
Ultrashort Echo Time Magnetic Resonance Morphology of Discovertebral Junction in Chronic Low Back Pain Subjects


Abstract
1. Introduction
2. Materials and Methods
2.1. Study Design
2.2. Subjects
2.3. MRI
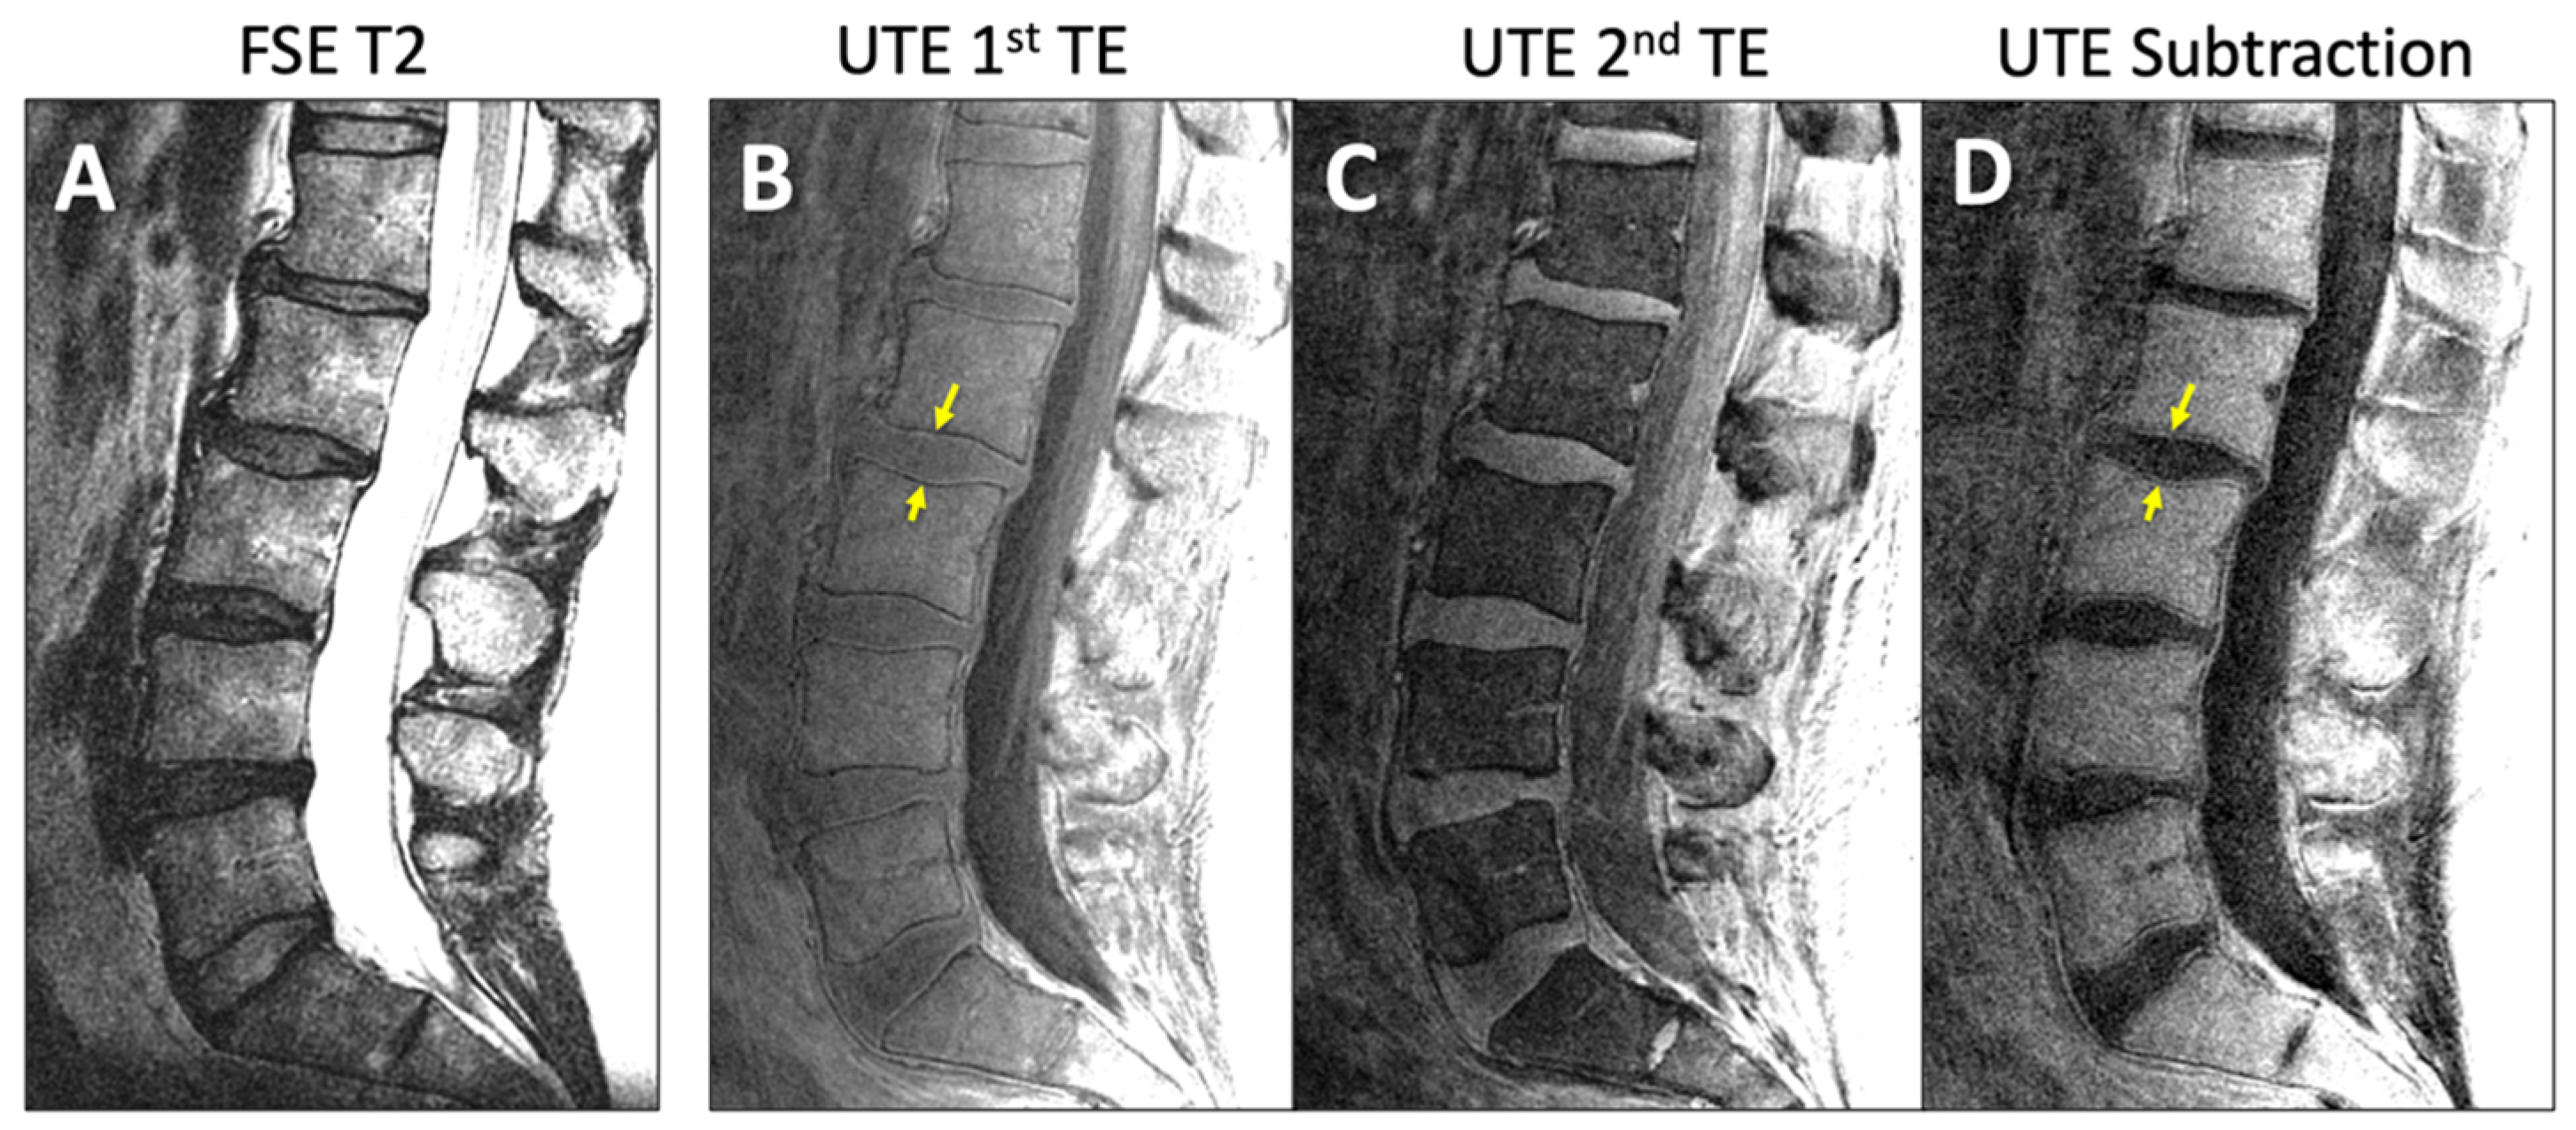
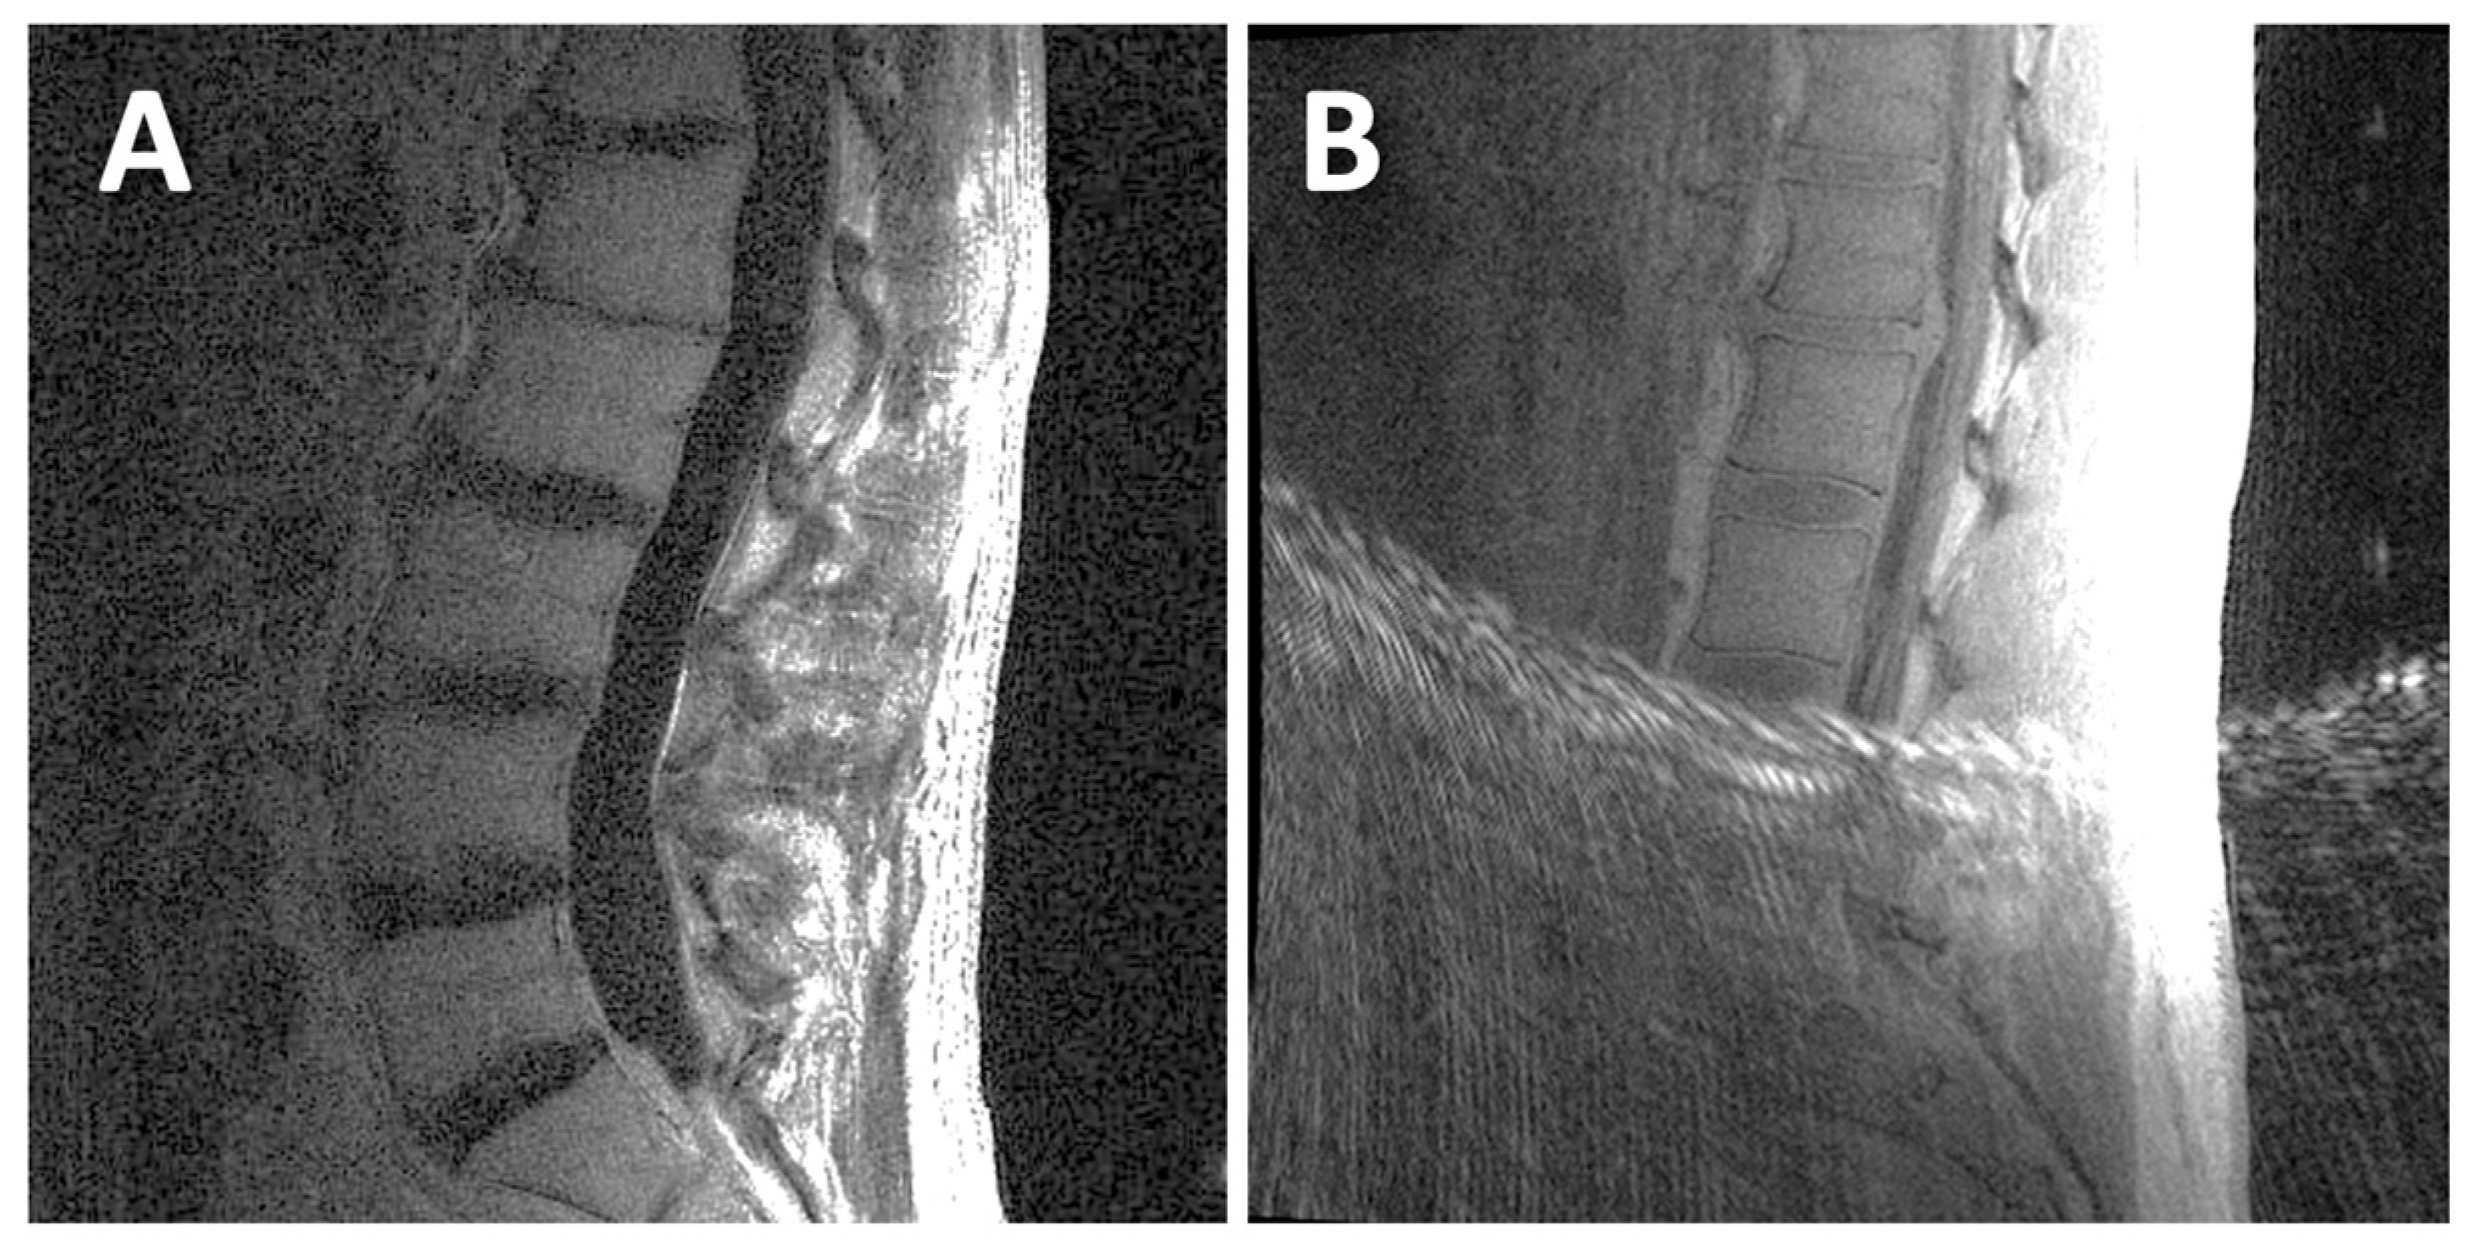
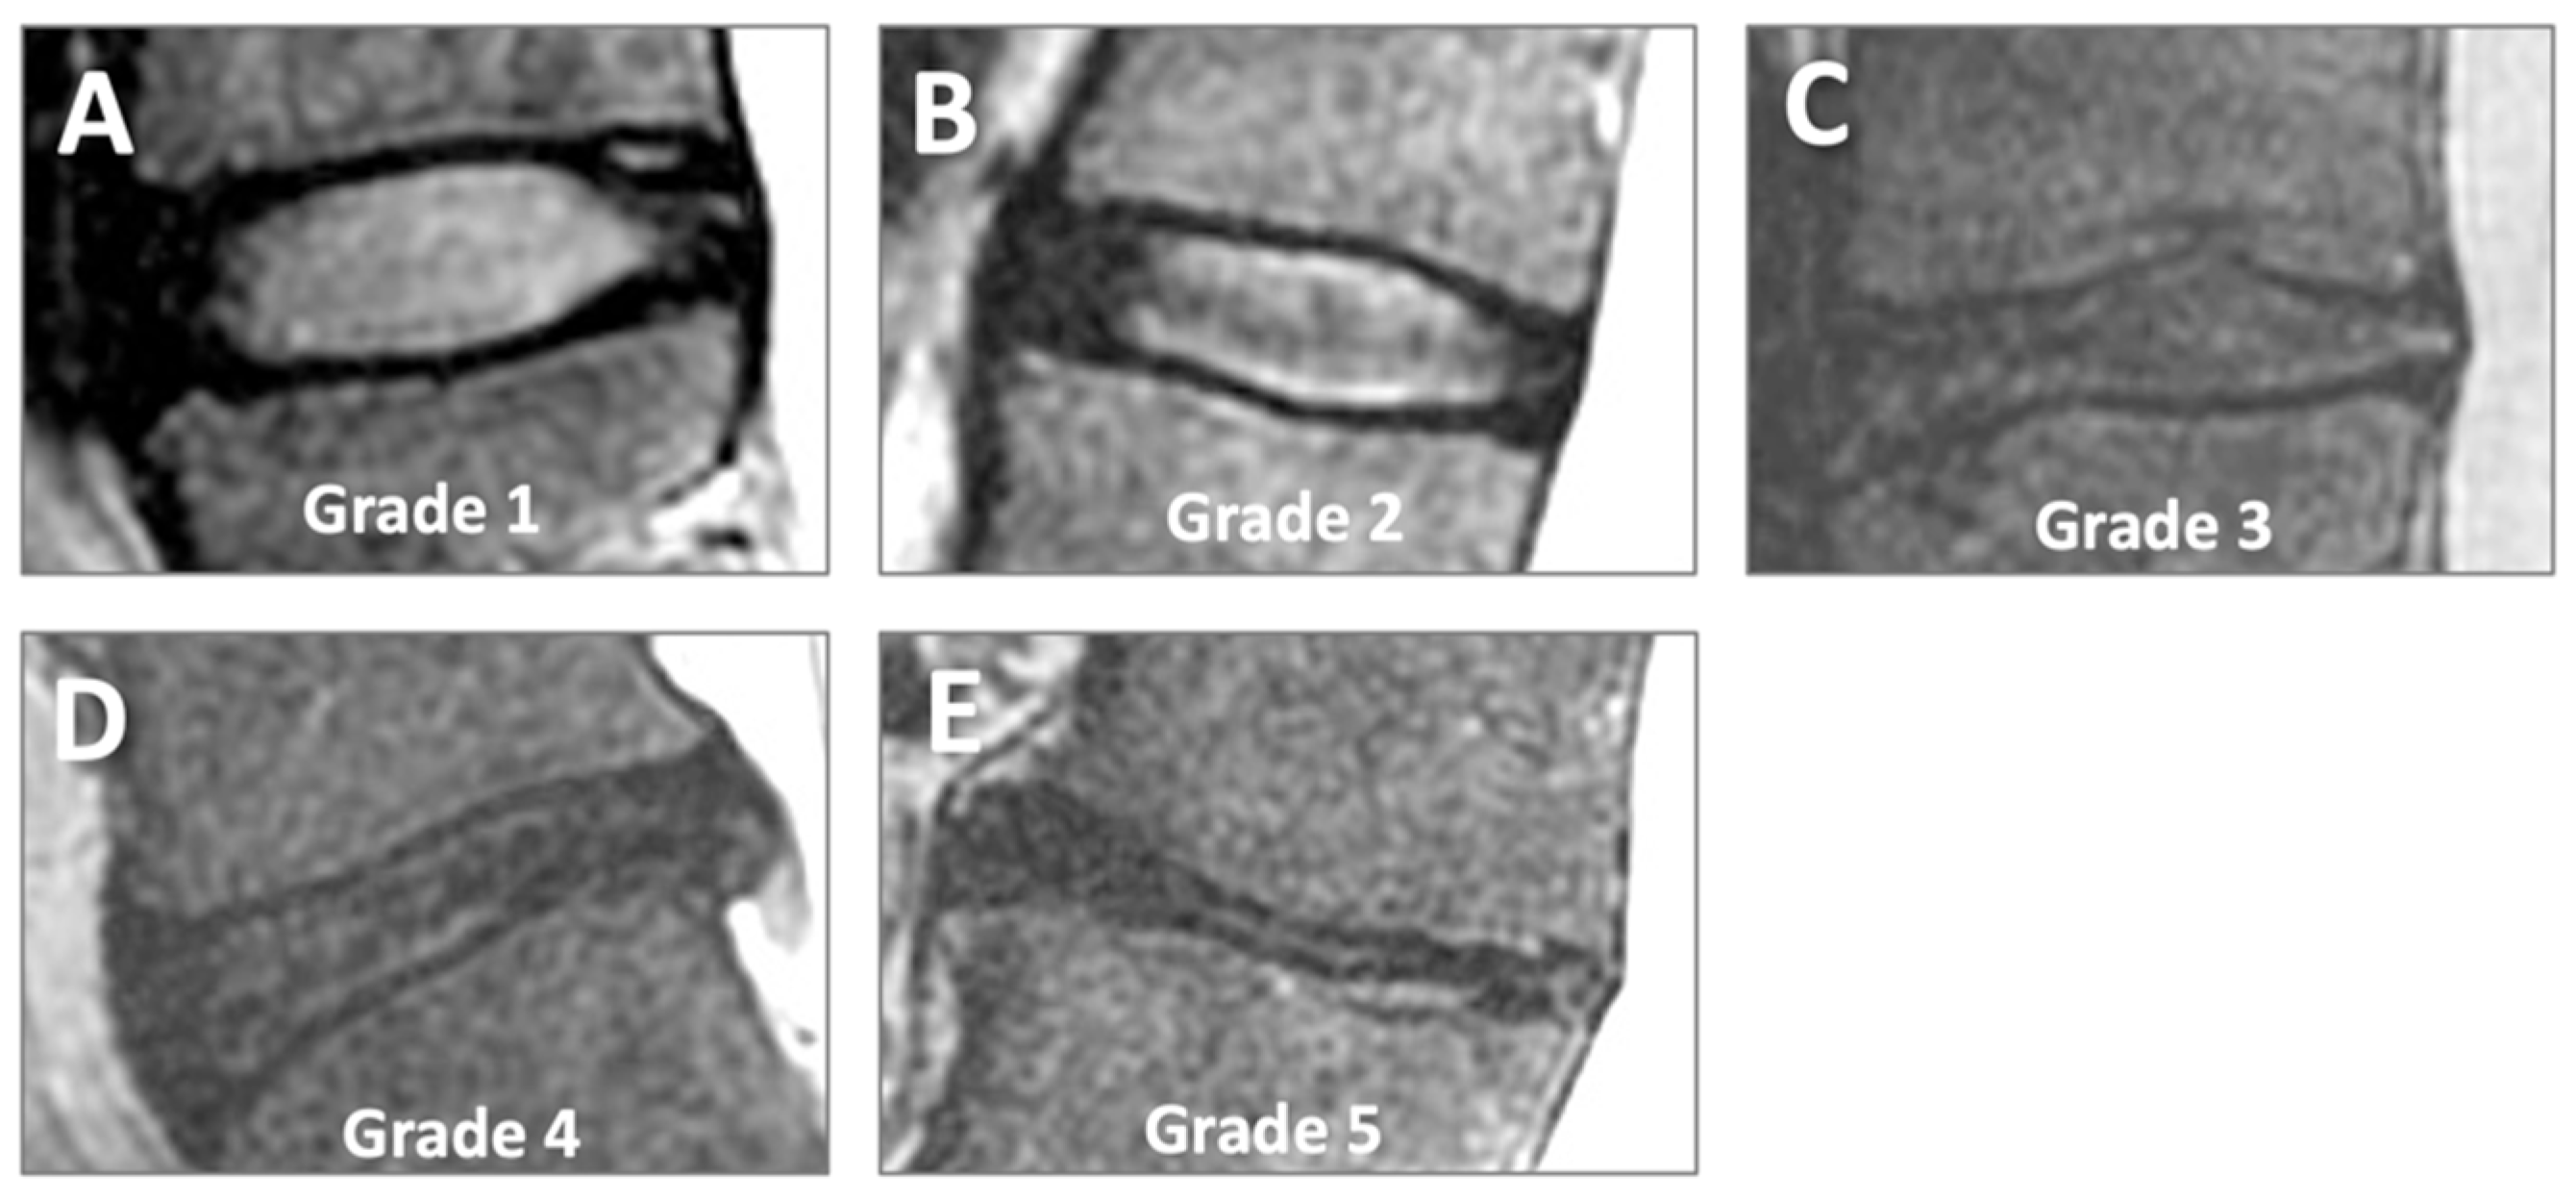
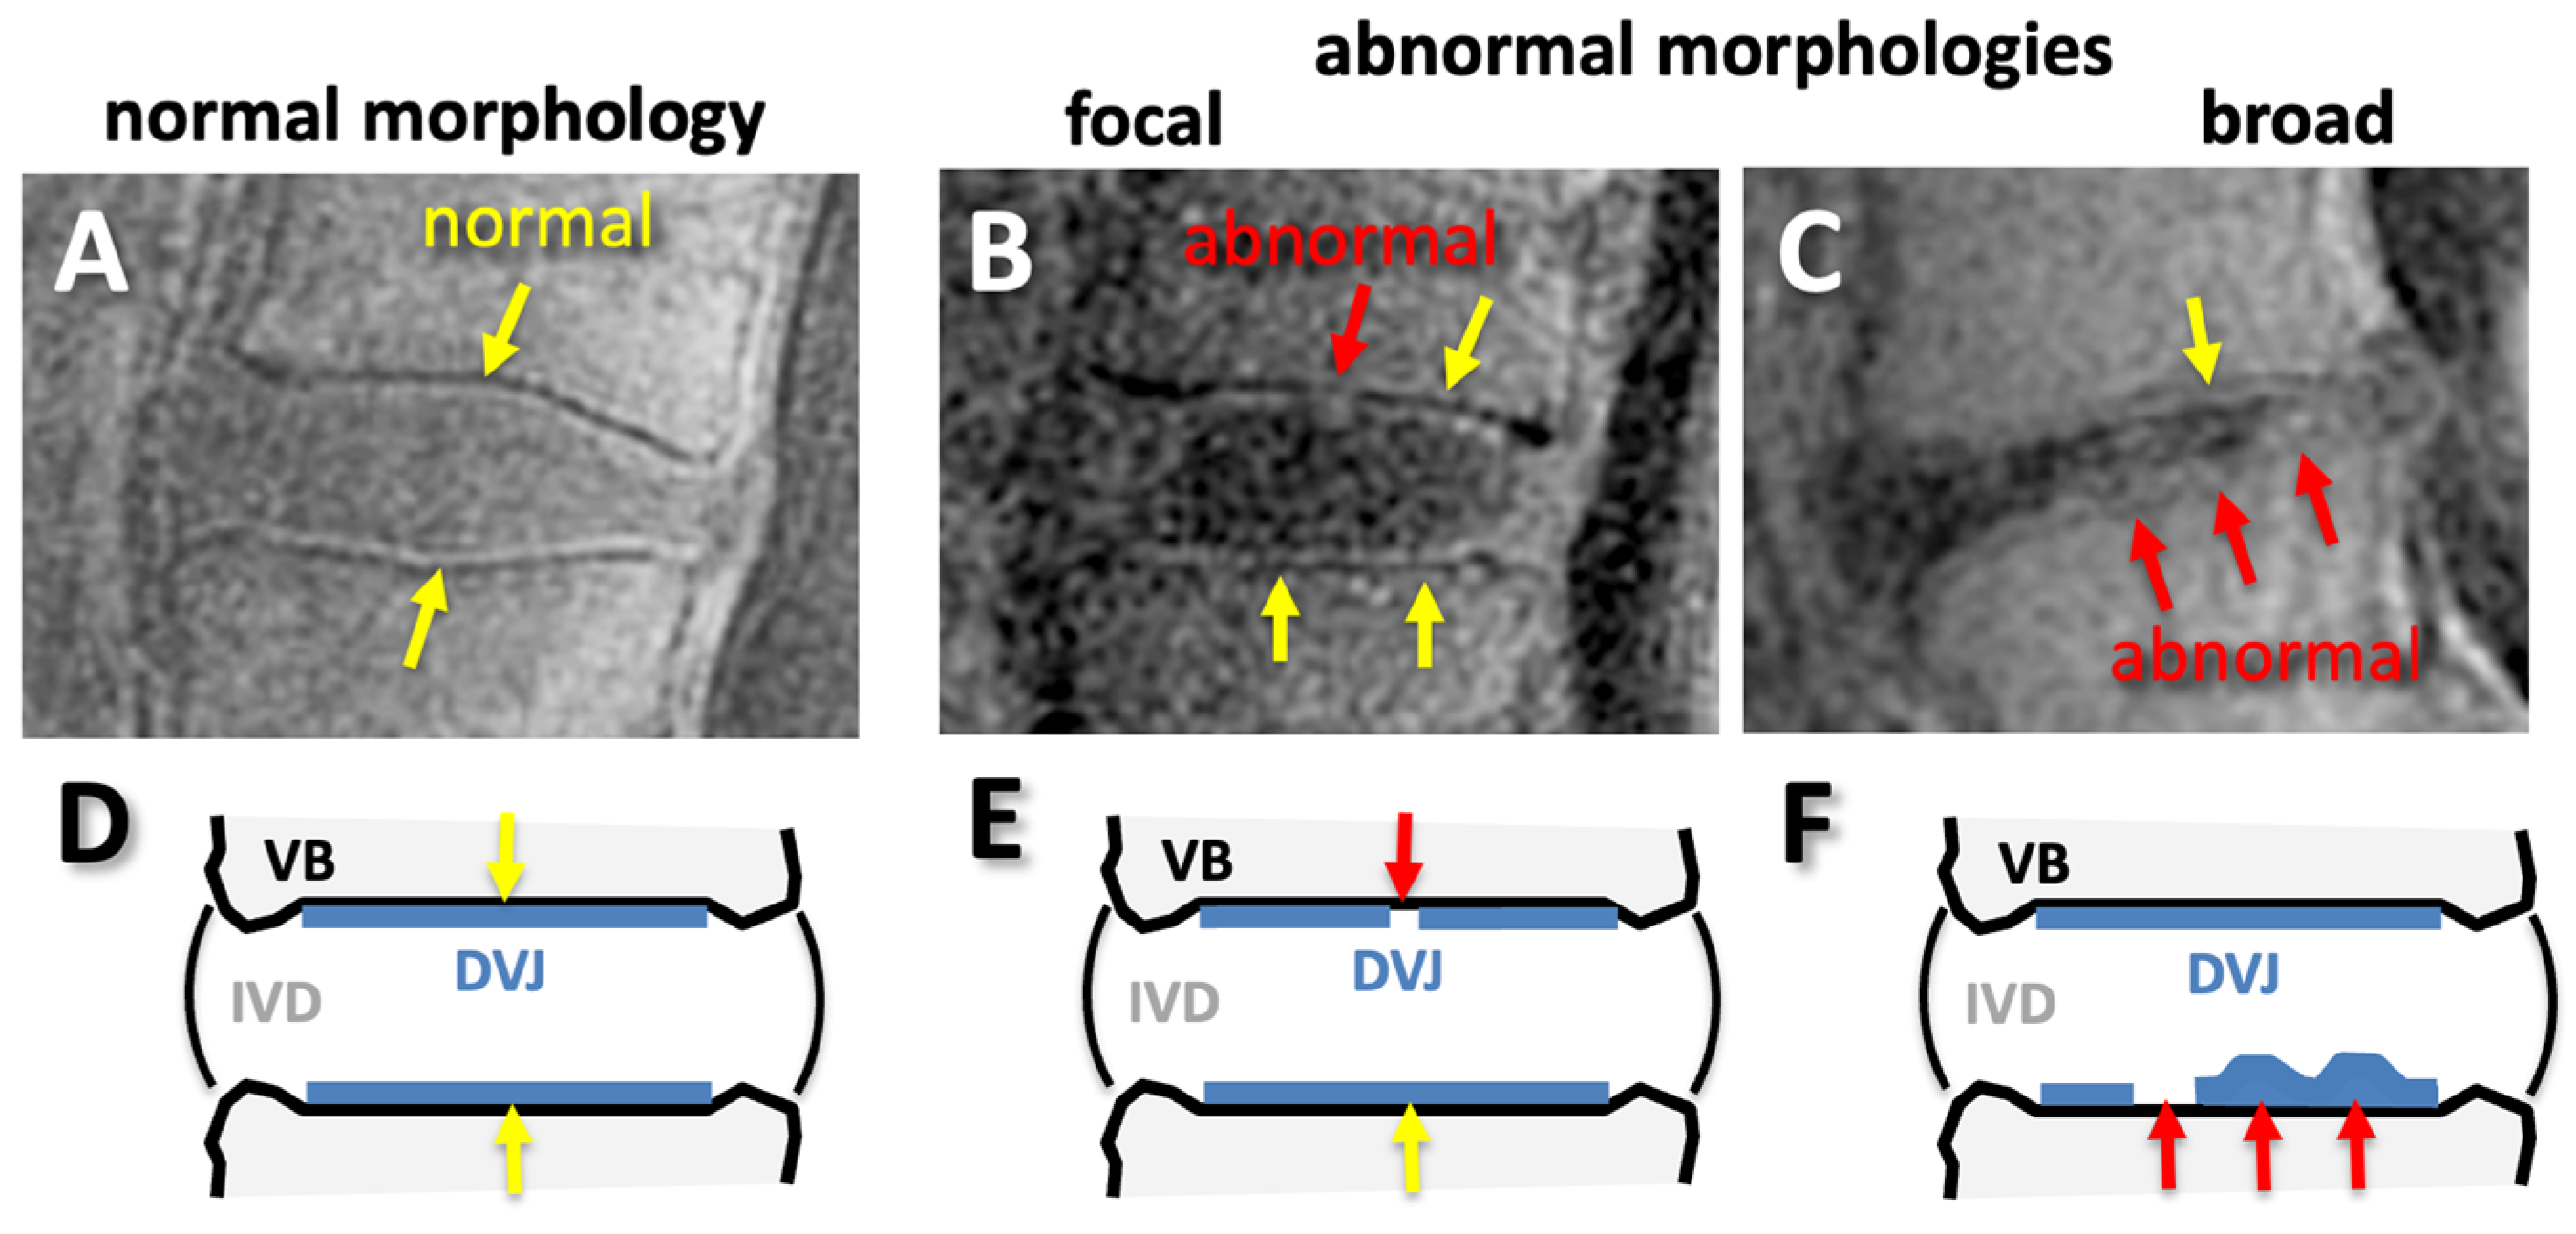
2.4. MRI Evaluation
2.5. Statistics
3. Results
3.1. MRI Appearances
3.2. IVD Degeneration with LBP, Level, and Age
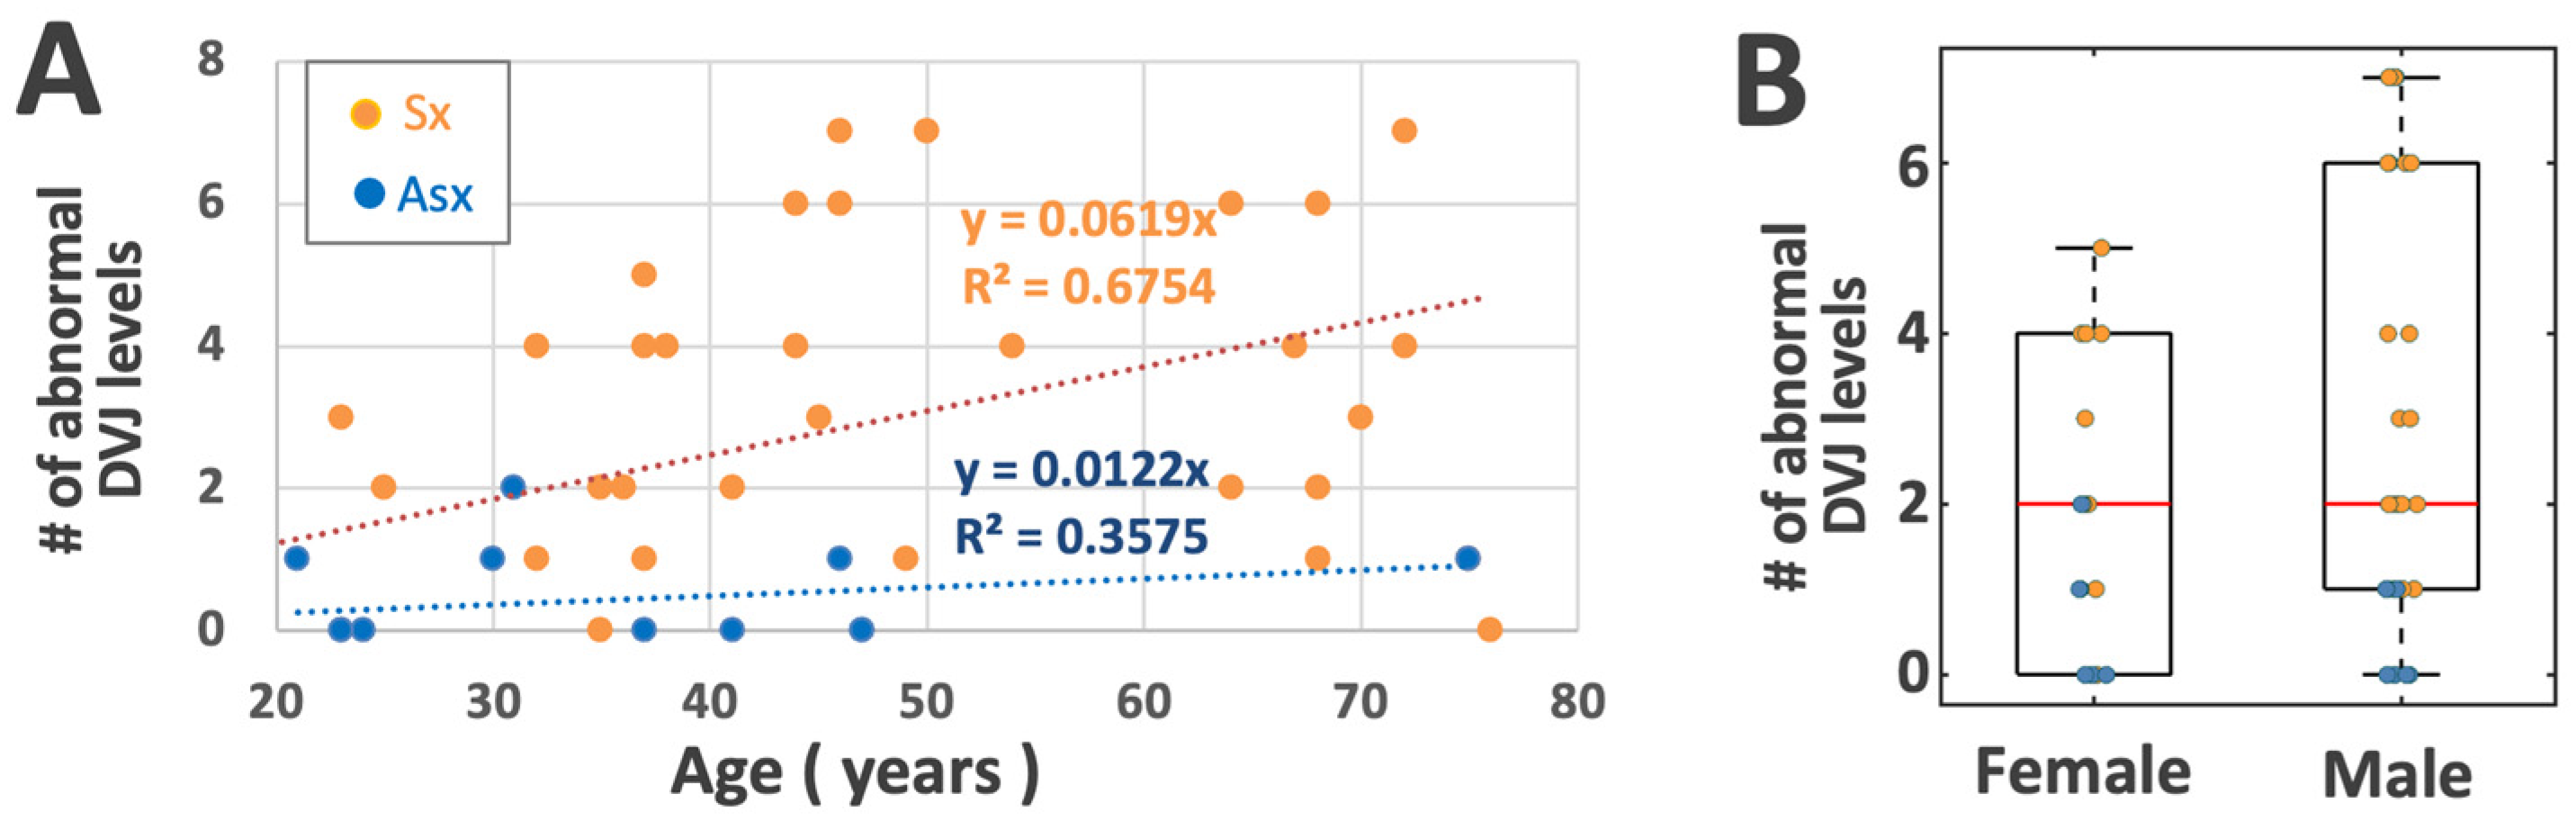
3.3. DVJ Abnormality with LBP, Level, and Age
3.4. Correlation Between IVD and DVJ Grades
4. Discussion
5. Conclusions
Author Contributions
Funding
Institutional Review Board Statement
Informed Consent Statement
Data Availability Statement
Acknowledgments
Conflicts of Interest
References
- Freburger, J.K.; Holmes, G.M.; Agans, R.P.; Jackman, A.M.; Darter, J.D.; Wallace, A.S.; Castel, L.D.; Kalsbeek, W.D.; Carey, T.S. The rising prevalence of chronic low back pain. Arch. Intern. Med. 2009, 169, 251–258. [Google Scholar] [CrossRef]
- An, H.S.; Anderson, P.A.; Haughton, V.M.; Iatridis, J.C.; Kang, J.D.; Lotz, J.C.; Natarajan, R.N.; Oegema, T.R., Jr.; Roughley, P.; Setton, L.A.; et al. Introduction: Disc degeneration: Summary. Spine 2004, 29, 2677–2678. [Google Scholar] [CrossRef] [PubMed]
- Abu-Ghanem, S.; Ohana, N.; Abu-Ghanem, Y.; Kittani, M.; Shelef, I. Acute schmorl node in dorsal spine: An unusual cause of a sudden onset of severe back pain in a young female. Asian Spine J. 2013, 7, 131–135. [Google Scholar] [CrossRef] [PubMed]
- Bogduk, N.; Endres, S.M. Clinical anatomy of the lumbar spine and sacrum. In Clinical Anatomy of the Lumbar Spine and Sacrum; Elsevier Health Sciences: Amsterdam, The Netherlands, 2005. [Google Scholar]
- Crock, H.V.; Goldwasser, M. Anatomic studies of the circulation in the region of the vertebral end-plate in adult Greyhound dogs. Spine 1984, 9, 702–706. [Google Scholar] [CrossRef] [PubMed]
- Urban, J.P.; Holm, S.; Maroudas, A. Diffusion of small solutes into the intervertebral disc: As in vivo study. Biorheology 1978, 15, 203–221. [Google Scholar] [CrossRef] [PubMed]
- Siemionow, K.; An, H.; Masuda, K.; Andersson, G.; Cs-Szabo, G. The effects of age, sex, ethnicity, and spinal level on the rate of intervertebral disc degeneration: A review of 1712 intervertebral discs. Spine 2011, 36, 1333–1339. [Google Scholar] [CrossRef] [PubMed]
- Natalia, F.; Sudirman, S.; Ruslim, D.; Al-Kafri, A. Lumbar spine MRI annotation with intervertebral disc height and Pfirrmann grade predictions. PLoS ONE 2024, 19, e0302067. [Google Scholar] [CrossRef]
- Lund, T.; Schlenzka, D.; Lohman, M.; Ristolainen, L.; Kautiainen, H.; Klemetti, E.; Osterman, K. The intervertebral disc during growth: Signal intensity changes on magnetic resonance imaging and their relevance to low back pain. PLoS ONE 2022, 17, e0275315. [Google Scholar] [CrossRef] [PubMed]
- Takashima, H.; Yoshimoto, M.; Ogon, I.; Takebayashi, T.; Imamura, R.; Akatsuka, Y.; Yamashita, T. T1rho, T2, and T2* relaxation time based on grading of intervertebral disc degeneration. Acta Radiol. 2023, 64, 1116–1121. [Google Scholar] [CrossRef]
- Yeung, K.H.; Man, G.C.W.; Deng, M.; Lam, T.P.; Cheng, J.C.Y.; Chan, K.C.; Chu, W.C.W. Morphological changes of Intervertebral Disc detectable by T2-weighted MRI and its correlation with curve severity in Adolescent Idiopathic Scoliosis. BMC Musculoskelet Disord 2022, 23, 655. [Google Scholar] [CrossRef]
- Kamei, N.; Nakamae, T.; Nakanishi, K.; Tamura, T.; Tsuchikawa, Y.; Morisako, T.; Harada, T.; Maruyama, T.; Adachi, N. Evaluation of intervertebral disc degeneration using T2 signal ratio on magnetic resonance imaging. Eur. J. Radiol. 2022, 152, 110358. [Google Scholar] [CrossRef]
- Yeung, K.H.; Man, G.; Hung, A.; Lam, T.P.; Cheng, J.; Chu, W. Morphological changes of intervertebral disc in relation with curve severity of patients with Adolescent Idiopathic Scoliosis—A T2-weighted MRI study. Stud. Health Technol. Inf. 2021, 280, 37–39. [Google Scholar] [CrossRef]
- Belavy, D.L.; Owen, P.J.; Armbrecht, G.; Bansmann, M.; Zange, J.; Ling, Y.; Pohle-Frohlich, R.; Felsenberg, D. Quantitative assessment of the lumbar intervertebral disc via T2 shows excellent long-term reliability. PLoS ONE 2021, 16, e0249855. [Google Scholar] [CrossRef] [PubMed]
- Haughton, V. Imaging intervertebral disc degeneration. J. Bone Joint Surg. Am. 2006, 88 (Suppl. S2), 15–20. [Google Scholar]
- Pfirrmann, C.W.; Metzdorf, A.; Zanetti, M.; Hodler, J.; Boos, N. Magnetic resonance classification of lumbar intervertebral disc degeneration. Spine 2001, 26, 1873–1878. [Google Scholar] [CrossRef] [PubMed]
- Joe, E.; Lee, J.W.; Park, K.W.; Yeom, J.S.; Lee, E.; Lee, G.Y.; Kang, H.S. Herniation of cartilaginous endplates in the lumbar spine: MRI findings. AJR Am. J. Roentgenol. 2015, 204, 1075–1081. [Google Scholar] [CrossRef]
- Bae, W.C.; Statum, S.; Zhang, Z.; Yamaguchi, T.; Wolfson, T.; Gamst, A.C.; Du, J.; Bydder, G.M.; Masuda, K.; Chung, C.B. Morphology of the Cartilaginous Endplates in Human Intervertebral Disks with Ultrashort Echo Time MR Imaging. Radiology 2013, 266, 564–574. [Google Scholar] [CrossRef]
- Moon, S.M.; Yoder, J.H.; Wright, A.C.; Smith, L.J.; Vresilovic, E.J.; Elliott, D.M. Evaluation of intervertebral disc cartilaginous endplate structure using magnetic resonance imaging. Eur. Spine J. 2013, 22, 1820–1828. [Google Scholar] [CrossRef] [PubMed]
- Finkenstaedt, T.; Siriwananrangsun, P.; Masuda, K.; Bydder, G.M.; Chen, K.C.; Bae, W.C. Ultrashort time-to-echo MR morphology of cartilaginous endplate correlates with disc degeneration in the lumbar spine. Eur. Spine J. 2023, 32, 2358–2367. [Google Scholar] [CrossRef]
- Robson, M.D.; Gatehouse, P.D.; Bydder, M.; Bydder, G.M. Magnetic resonance: An introduction to ultrashort TE (UTE) imaging. J. Comput. Assist. Tomogr. 2003, 27, 825–846. [Google Scholar] [CrossRef]
- Gatehouse, P.D.; He, T.; Puri, B.K.; Thomas, R.D.; Resnick, D.; Bydder, G.M. Contrast-enhanced MRI of the menisci of the knee using ultrashort echo time (UTE) pulse sequences: Imaging of the red and white zones. Br. J. Radiol. 2004, 77, 641–647. [Google Scholar] [CrossRef] [PubMed]
- Hall-Craggs, M.A.; Porter, J.; Gatehouse, P.D.; Bydder, G.M. Ultrashort echo time (UTE) MRI of the spine in thalassaemia. Br. J. Radiol. 2004, 77, 104–110. [Google Scholar] [CrossRef]
- Robson, M.D.; Benjamin, M.; Gishen, P.; Bydder, G.M. Magnetic resonance imaging of the Achilles tendon using ultrashort TE (UTE) pulse sequences. Clin. Radiol. 2004, 59, 727–735. [Google Scholar] [CrossRef] [PubMed]
- Robson, M.D.; Gatehouse, P.D.; So, P.W.; Bell, J.D.; Bydder, G.M. Contrast enhancement of short T2 tissues using ultrashort TE (UTE) pulse sequences. Clin. Radiol. 2004, 59, 720–726. [Google Scholar] [CrossRef] [PubMed]
- Benjamin, M.; Bydder, G.M. Magnetic resonance imaging of entheses using ultrashort TE (UTE) pulse sequences. J. Magn. Reson. Imaging 2007, 25, 381–389. [Google Scholar] [CrossRef]
- Du, J.; Hamilton, G.; Takahashi, A.; Bydder, M.; Chung, C.B. Ultrashort echo time spectroscopic imaging (UTESI) of cortical bone. Magn. Reson. Med. 2007, 58, 1001–1009. [Google Scholar] [CrossRef]
- Du, J.; Carl, M.; Bydder, M.; Takahashi, A.; Chung, C.B.; Bydder, G.M. Qualitative and quantitative ultrashort echo time (UTE) imaging of cortical bone. J. Magn. Reson. 2010, 207, 304–311. [Google Scholar] [CrossRef] [PubMed]
- Biswas, R.; Bae, W.; Diaz, E.; Masuda, K.; Chung, C.B.; Bydder, G.M.; Du, J. Ultrashort echo time (UTE) imaging with bi-component analysis: Bound and free water evaluation of bovine cortical bone subject to sequential drying. Bone 2011, 50, 749–755. [Google Scholar] [CrossRef]
- Du, J.; Carl, M.; Bae, W.C.; Statum, S.; Chang, E.Y.; Bydder, G.M.; Chung, C.B. Dual inversion recovery ultrashort echo time (DIR-UTE) imaging and quantification of the zone of calcified cartilage (ZCC). Osteoarthr. Cartil. 2012, 63, 447–455. [Google Scholar] [CrossRef]
- Bae, W.C.; Biswas, R.; Chen, K.; Chang, E.Y.; Chung, C.B. UTE MRI of the Osteochondral Junction. Current radiology reports 2014, 2, 35. [Google Scholar] [CrossRef] [PubMed]
- Chen, K.C.; Tran, B.; Biswas, R.; Statum, S.; Masuda, K.; Chung, C.B.; Bae, W.C. Evaluation of the disco-vertebral junction using ultrashort time-to-echo magnetic resonance imaging: Inter-reader agreement and association with vertebral endplate lesions. Skelet. Radiol. 2016, 45, 1249–1256. [Google Scholar] [CrossRef] [PubMed]
- Kim, T.K. T test as a parametric statistic. Korean J. Anesthesiol. 2015, 68, 540–546. [Google Scholar] [CrossRef] [PubMed]
- Huck, S.W.; McLean, R.A. Using a repeated measures ANOVA to analyze the data from a pretest-posttest design: A potentially confusing task. Psychol. Bull. 1975, 82, 511–518. [Google Scholar] [CrossRef]
- Cohen, J. A power primer. Psychol. Bull. 1992, 112, 155–159. [Google Scholar] [CrossRef] [PubMed]
- Kim, T.K. Understanding one-way ANOVA using conceptual figures. Korean J. Anesthesiol. 2017, 70, 22–26. [Google Scholar] [CrossRef] [PubMed]
- Roush, F.W. Discrete statistical models with social science applications. Math. Soc. Sci. 1981, 1, 215–216. [Google Scholar] [CrossRef]
- Spearman, C. The Proof and Measurement of Association between Two Things. Am. J. Psychol. 1904, 15, 72–101. [Google Scholar] [CrossRef]
- Law, T.; Anthony, M.P.; Chan, Q.; Samartzis, D.; Kim, M.; Cheung, K.M.; Khong, P.L. Ultrashort time-to-echo MRI of the cartilaginous endplate: Technique and association with intervertebral disc degeneration. J. Med. Imaging Radiat. Oncol. 2013, 57, 427–434. [Google Scholar] [CrossRef] [PubMed]
- Ji, Z.; Li, Y.; Dou, W.; Zhu, Y.; Shi, Y.; Zou, Y. Ultra-short echo time MR imaging in assessing cartilage endplate damage and relationship between its lesion and disc degeneration for chronic low back pain patients. BMC Med. Imaging 2023, 23, 60. [Google Scholar] [CrossRef]
- Peng, B.G. Pathophysiology, diagnosis, and treatment of discogenic low back pain. World J. Orthop. 2013, 4, 42–52. [Google Scholar] [CrossRef]
- Brinjikji, W.; Diehn, F.E.; Jarvik, J.G.; Carr, C.M.; Kallmes, D.F.; Murad, M.H.; Luetmer, P.H. MRI Findings of Disc Degeneration are More Prevalent in Adults with Low Back Pain than in Asymptomatic Controls: A Systematic Review and Meta-Analysis. AJNR Am. J. Neuroradiol. 2015, 36, 2394–2399. [Google Scholar] [CrossRef] [PubMed]
- Foizer, G.A.; Paiva, V.C.; Nascimento, R.D.D.; Gorios, C.; Cliquet Junior, A.; Miranda, J.B. Is There Any Association between the Severity of Disc Degeneration and Low Back Pain? Rev. Bras. Ortop. (Sao Paulo) 2022, 57, 334–340. [Google Scholar] [CrossRef] [PubMed]
- Bernick, S.; Cailliet, R. Vertebral end-plate changes with aging of human vertebrae. Spine 1982, 7, 97–102. [Google Scholar] [CrossRef] [PubMed]
- Roberts, S.; Menage, J.; Eisenstein, S.M. The cartilage end-plate and intervertebral disc in scoliosis: Calcification and other sequelae. J. Orthop. Res. 1993, 11, 747–757. [Google Scholar] [CrossRef]
- Bae, W.C.; Xu, K.; Inoue, N.; Bydder, G.M.; Chung, C.B.; Masuda, K. Ultrashort time-to-echo MRI of human intervertebral disc endplate: Association with endplate calcification. Proc. Intl Soc. Magn. Reson. Med. 2010, 18, 3218. [Google Scholar]
- Fields, A.J.; Liebenberg, E.C.; Lotz, J.C. Innervation of pathologies in the lumbar vertebral end plate and intervertebral disc. Spine J. 2014, 14, 513–521. [Google Scholar] [CrossRef] [PubMed]
- Fields, A.J.; Han, M.; Krug, R.; Lotz, J.C. Cartilaginous end plates: Quantitative MR imaging with very short echo times-orientation dependence and correlation with biochemical composition. Radiology 2015, 274, 482–489. [Google Scholar] [CrossRef] [PubMed]
- Bonnheim, N.B.; Wang, L.; Lazar, A.A.; Zhou, J.; Chachad, R.; Sollmann, N.; Guo, X.; Iriondo, C.; O’Neill, C.; Lotz, J.C.; et al. The contributions of cartilage endplate composition and vertebral bone marrow fat to intervertebral disc degeneration in patients with chronic low back pain. Eur. Spine J. 2022, 31, 1866–1872. [Google Scholar] [CrossRef] [PubMed]
- Bonnheim, N.B.; Wang, L.; Lazar, A.A.; Chachad, R.; Zhou, J.; Guo, X.; O’Neill, C.; Castellanos, J.; Du, J.; Jang, H.; et al. Deep-learning-based biomarker of spinal cartilage endplate health using ultra-short echo time magnetic resonance imaging. Quant. Imaging Med. Surg. 2023, 13, 2807–2821. [Google Scholar] [CrossRef]


| Group | Total # | Age Range | Male # | Age Range | Female # | Age Range |
|---|---|---|---|---|---|---|
| Asx | 12 | 21 to 75 | 6 | 23 to 75 | 6 | 21 to 37 |
| Sx | 32 | 19 to 76 | 0 | 32 to 76 | 0 | 19 to 75 |
| Total | 44 | 19 to 76 | 26 | 23 to 76 | 18 | 19 to 75 |
| Disc | G1 | G2 | G3 | G4 | G5 |
| Asx | 27.8% | 66.7% | 5.6% | 0% | 0% |
| Sx | 4.6% | 48.1% | 34.3% | 11.1% | 1.9% |
| DVJ | G0 | G1 | G2 |
|---|---|---|---|
| Asx | 93.8% | 2.5% | 3.8% |
| Sx | 56.8% | 12.4% | 30.7% |
Disclaimer/Publisher’s Note: The statements, opinions and data contained in all publications are solely those of the individual author(s) and contributor(s) and not of MDPI and/or the editor(s). MDPI and/or the editor(s) disclaim responsibility for any injury to people or property resulting from any ideas, methods, instructions or products referred to in the content. |
© 2025 by the authors. Licensee MDPI, Basel, Switzerland. This article is an open access article distributed under the terms and conditions of the Creative Commons Attribution (CC BY) license (https://creativecommons.org/licenses/by/4.0/).
Share and Cite
Siriwananrangsun, P.; Finkenstaedt, T.; Chen, K.C.; Bae, W.C. Ultrashort Echo Time Magnetic Resonance Morphology of Discovertebral Junction in Chronic Low Back Pain Subjects. Tomography 2025, 11, 12. https://doi.org/10.3390/tomography11020012
Siriwananrangsun P, Finkenstaedt T, Chen KC, Bae WC. Ultrashort Echo Time Magnetic Resonance Morphology of Discovertebral Junction in Chronic Low Back Pain Subjects. Tomography. 2025; 11(2):12. https://doi.org/10.3390/tomography11020012
Chicago/Turabian StyleSiriwananrangsun, Palanan, Tim Finkenstaedt, Karen C. Chen, and Won C. Bae. 2025. "Ultrashort Echo Time Magnetic Resonance Morphology of Discovertebral Junction in Chronic Low Back Pain Subjects" Tomography 11, no. 2: 12. https://doi.org/10.3390/tomography11020012
APA StyleSiriwananrangsun, P., Finkenstaedt, T., Chen, K. C., & Bae, W. C. (2025). Ultrashort Echo Time Magnetic Resonance Morphology of Discovertebral Junction in Chronic Low Back Pain Subjects. Tomography, 11(2), 12. https://doi.org/10.3390/tomography11020012