Abstract
Poly lactic acid (PLA) is one of the most commonly used bio-derived thermoplastic polymers in 3D and 4D printing applications. The determination of PLA surface properties is of capital importance in 3D/4D printing technology. The surface thermodynamic properties of PLA polymers were determined using the inverse gas chromatography (IGC) technique at infinite dilution. The determination of the retention volume of polar and non-polar molecules adsorbed on the PLA particles filling the column allowed us to obtain the dispersive, polar, and Lewis’s acid–base surface properties at different temperatures from 40 °C to 100 °C. The applied surface method was based on our recent model that used the London dispersion equation, the new chromatographic parameter function of the deformation polarizability, and the harmonic mean of the ionization energies of the PLA polymer and organic molecules. The application of this new method led to the determination of the dispersive and polar free surface energy of the adsorption of molecules on the polymeric material, as well as the glass transition and the Lewis acid–base constants. Four interval temperatures were distinguished, showing four zones of variations in the surface properties of PLA as a function of the temperature before and after the glass transition. The acid–base parameters of PLA strongly depend on the temperature. The accurate determination of the dispersive and polar surface physicochemical properties of PLA led to the work of adhesion of the polar organic solvents adsorbed on PLA. These results can be very useful for achieving reliable and functional 3D and 4D printed components.
1. Introduction
Since the first description of three-dimensional (3D) printing in the 1980s, many publications have been devoted to additive manufacturing, also known as 3D printing, which has been extremely developed in many applications such as engineering, materials science, physics and astronomy, computer science, chemistry, mathematics, genetics, and molecular biology [1]. In 3D printing, the three-dimensional object is created from a digital model by adding material, typically in successive layers, on the contrary to traditional manufacturing technologies, such as machining, grinding, and casting, where molten material is filled in a mold to create a product [1,2,3,4].
The increasing evolution of the spatial technology of 3D printing led to fourth-dimensional printing (4D printing) by considering the fourth dimension of time to modulate one or more properties of the 3D-printed objects with the help of smart materials that can control the application of any external stimulus implying light, water, self-diagnostic, heating, pressure, and shape-changing effects [1,2,3,4,5,6,7,8,9].
One of the most used materials in 3D/4D printing is poly (lactic acid) (PLA) because of its unique properties such as good appearance, higher transparency, less toxicity, and low thermal expansion, which help reduce the internal stresses caused during cooling [10,11,12,13]. PLA, a bio-derived thermoplastic polymer, is 100% biodegradable polymer with high tensile strength and modulus, and it is easily synthesized from lactic acid obtained from corn, sugarcane, and other biomass. It can be recycled up to eight times and is compostable at the end of life [1,14].
The highest tensile and flexural strengths of PLA and the use of its composites with bio-derived reinforcements such as flax, hemp, jute, bamboo, and other natural fibers were widely researched for 3D printing to enhance mechanical properties, reduce material and production costs, and improve the sustainability of manufactured products [14,15,16,17,18,19,20,21,22,23,24,25,26].
PLA, a biodegradable aliphatic polyester, is produced from renewable resources and has received much attention in the research of alternative biodegradable polymers [27,28,29]. This PLA polymer is the most popular polymer in the world and may be processed using standard machines, equipment, and technologies for classic polymers [27,30,31]. PLA shows good biocompatibility and physical properties, such as high mechanical strength, thermoplasticity, and fabricability [27].
The biodegradable PLA polymer is the most used material worldwide for 3D printing [1,14,15,27], and it is very sought after in 4D printing technology. PLA is an excellent bio-derived polymer that is now used as a shape memory polymer in 4D printing applications [20,21,22,23,24,25]. The future of 4D printing bio composites involves multi-disciplinary research to combine design strategies, material properties, stimulus properties, and composite mechanics [1].
The competing mechanical properties and the highest tensile strength of PLA compared to other bio-derived thermoplastics led to a wide utilization of PLA for 3D/4D printing. The best mechanical properties of bio-derived thermoplastics are used in 3D printing. The PLA composites efficiently responded to the requirements in 3D/4D printing applications by improving the mechanical properties and functionalities, such as their ability to be used as a shape memory polymer in 4D printing [1]. The tensile strength and modulus of PLA make it a completely biodegradable polymer.
The thermal, mechanical, and biodegradation properties and glass transition temperature of PLA are necessary to be determined for reinforcement processes and uses in many 3D printing applications by correlating the tensile strength and Young’s modulus of bio-derived fiber reinforcement/PLA to the surface and adhesion properties of PLA [1]. The determination of the interfacial energetic properties of PLA is very suitable to determine the adhesion of the fiber/matrix, which plays a crucial role in the selection of fibers and PLA composites in 3D/4D printing. The accurate determination of the surface physicochemical properties is then required to optimize processing parameters to produce continuously reinforced PLA 3D printed composites with maximum interfacial adhesion to avoid failure due to defects [1,8,32,33,34].
The surface properties, the Lewis acid–base parameters, and the dispersive and polar energies of PLA polymers, are very important to be determined in many 3D and 4D applications involving mechanical, adhesion, and surface properties. The determination of the polar and dispersive properties of PLA was based on the literature on different classic chromatographic methods that were proven inaccurate in several studies [35,36,37,38,39,40,41]. Indeed, the London dispersive energy was previously calculated by neglecting the effect of the temperature on the surface area of organic solvents, whereas recent studies have shown an important effect of the temperature on the surface area of molecules, and consequently, the surface properties of PLA had to be corrected in light of the new findings [36,37,38,39].
In this paper, we were interested in determining the surface thermodynamic properties and the various variables of interactions between PLA polymers and other organic molecules. The technique used to study the polymer material was the inverse gas chromatography (IGC) technique at infinite dilution (ID). Our new models [35,36,37,38,39,40,41] were applied to quantify the dispersive and polar interaction energies to understand the behavior of PLA polymer and, therefore, predict the various superficial thermodynamic properties of this 3D/4D printing material in interaction with organic molecules.
The London dispersive interaction [35,36,37,42] between the solvents and the solid materials was determined by applying the London equation and the notion of polarizabilities and ionization energies of the organic molecules and the polymeric material. This new methodology led to the separation between the dispersive and polar surface free energies of PLA and to the accurate determination of the Lewis enthalpic and entropic acid–base constants, the polar acid and base surface energies, and the glass transition of the PLA polymer. Determining the dispersive and polar surface physicochemical properties of PLA will help determine the adhesion behavior that is essential for achieving reliable and functional 3D and 4Dprinted components.
2. Methods and Materials
In this paper, inverse gas chromatography (IGC) at infinite dilution (ID) was used to determine the net retention time of organic solvents adsorbed on the solid materials [43,44,45,46,47,48,49,50,51,52,53,54,55,56,57,58,59,60,61,62,63,64,65,66]. This resulted in the calculation of the net retention volume of the adsorbed probes and, therefore, the values of the free energy of adsorption of organic molecules adsorbed on PLA polymers given by the following equation:
where is the absolute temperature, the perfect constant gas, and is a constant depending on the temperature and the interaction between solvents and PLA.
is expressed at any temperature by the summation of the London dispersive energy and the polar energy :
Many methods and molecular models were used in the literature [43,44,45,46,47,48,49,50,51,52,53,54,55,56,57,58,59,60,61,62,63,64,65,66,67] to separate the two dispersive and polar contributions of the free energy of adsorption. It was previously shown [35,36,37] that the best method that gave the most accurate separation between and was based on the London dispersion interaction energy given by Equation (3):
where is the Avogadro number, the dielectric constant of vacuum, and are the respective deformation polarizabilities of the solid material denoted by S and the organic molecule denoted by , separated by a distance , and and are their corresponding ionization energies.
By combining Equations (1)–(3), Equation (4) was obtained:
The chosen interaction parameter was given by Equation (5):
For non-polar molecules such as n-alkanes, the representation of as a function of of adsorbed molecules is given by Equation (6):
where is the slope of the non-polar straight line given by the following:
For a polar molecule adsorbed on a PLA polymer, the geometric point representing the polar probe will be located outside the straight line of n-alkanes, and the distance between the polar point and this straight line will be equal to of the polar molecule at a chosen temperature.
In the case of linear variations of of polar probes as a function of the temperature, it is possible to deduce the specific enthalpy and entropy of polar probes adsorbed on a PLA polymer using the classic thermodynamic relation (9)):
The determination of and of adsorbed polar molecules leads to the characterization of the Lewis’s acid–base properties of the PLA polymer by its enthalpic (KA, KD) and entropic (, ) acid–base constants using the following relations:
where and are, respectively, the corrected electron donor and acceptor numbers of the polar molecule [68,69].
The experimental results showed that the relation (10) were not always satisfied. In similar cases, other relation (11) were proposed in the literature [39,41,70], taking into consideration the amphoteric coupling constants and of solid materials:
Relation (11) can be written as follows:
where , , , and , relative to the adsorbed polar molecule denoted by , are the known experimental values given by Equation (13), whereas , , , , , and are the unknown quantities of the problem (12).
The unique solution of the system (12) can be obtained if the number of polar solvents satisfies using the least squares method. The obtained solution or thus minimizes the sum of the squares of the residuals.
Materials
PLA polymers with a molecular weight of 40,000 and all organic solvents (highly pure grade (i.e., 99%) were purchased from Sigma-Aldrich (Beirut, Lebanon). The various non-polar molecules used in this study were n-alkanes (pentane, hexane, heptane, octane, and nonane); acidic (dichloromethane), amphoteric (acetone and toluene); and basic solvents (ethyl acetate and tetrahydrofuran (THF)). The PLA particles of sizes between 100 and 250 μm were introduced into a stainless steel column, which was 30 cm long and had an internal diameter of 5 mm. A mass of 1 g of PLA was used to fill the chromatographic column. The column filled with the sample was conditioned at 120 °C for 12 h to remove any impurities. Helium was used as carrier gas with a flow rate equal to 25 mL/min. The IGC measurements at infinite dilution were carried out with a DELSI GC 121 FB Chromatograph from Delsi Instruments (Suresnes, France) equipped with a flame ionization detector of high sensitivity. The injector and detector temperatures were maintained at 180 °C during the experiments. To achieve an infinite dilution approach in linear condition gas chromatography, 0.1 µL of each probe was injected with 1 µL Hamilton syringes. The interactions between probe molecules could be neglected, and only the interactions between the surface of the solid and an isolated probe molecule were important. The column temperatures ranged from 40 to 100 °C, and they varied in 5 °C steps. Each probe injection was repeated three times, and the average retention time was used for the calculation of the retention volume. The standard deviation was less than 1% in all of the measurements.
3. Results
3.1. London Dispersive Component of Surface Energy of PLA
By using the same procedure developed in previous studies [35,36] and varying the temperature of the chromatographic column containing the PLA particles, the IGC technique allowed us to obtain the net retention times of the various solvents adsorbed on the PLA polymer. This led to the net retention volumes of injected probes and, therefore, the values of of adsorbed organic molecules. The experimental results are given in Tables S1 and S2 (Supporting Materials).
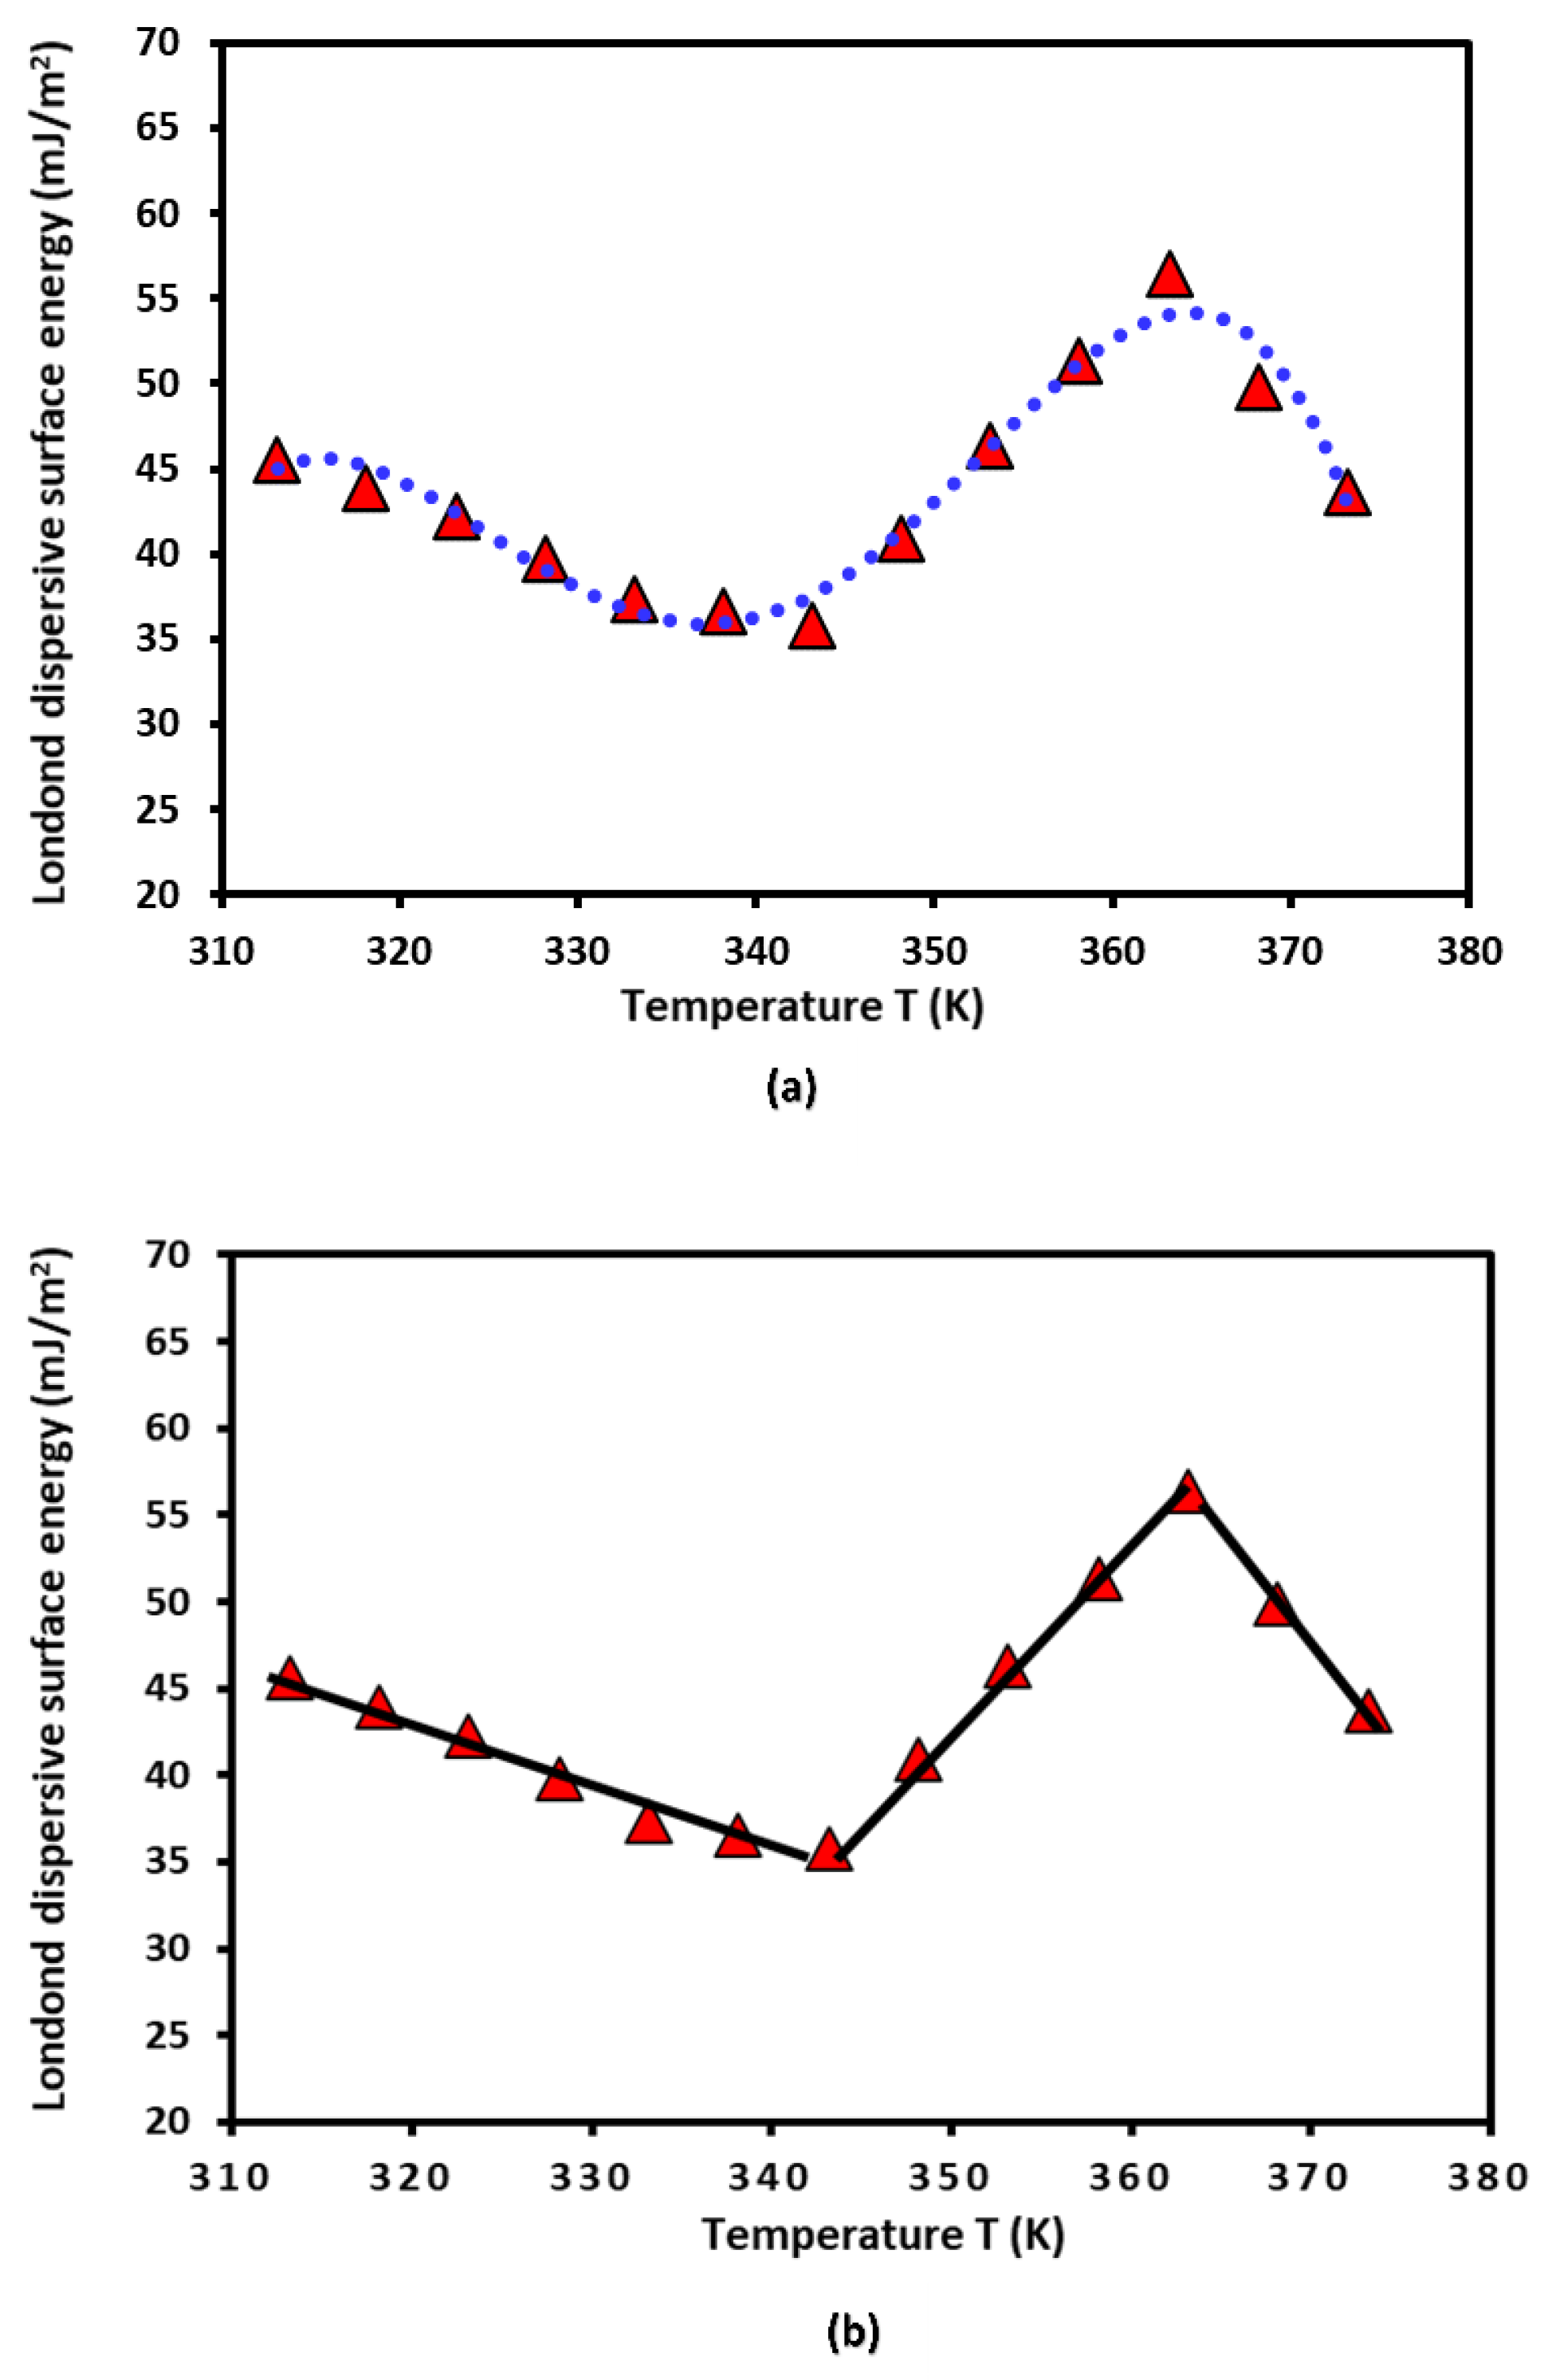
The London dispersive component of the surface energy of PLA polymer was obtained by applying the Hamieh thermal model [37,38,39,70,71]. The variation in of the PLA polymer as a function of the temperature plotted in Figure 1.
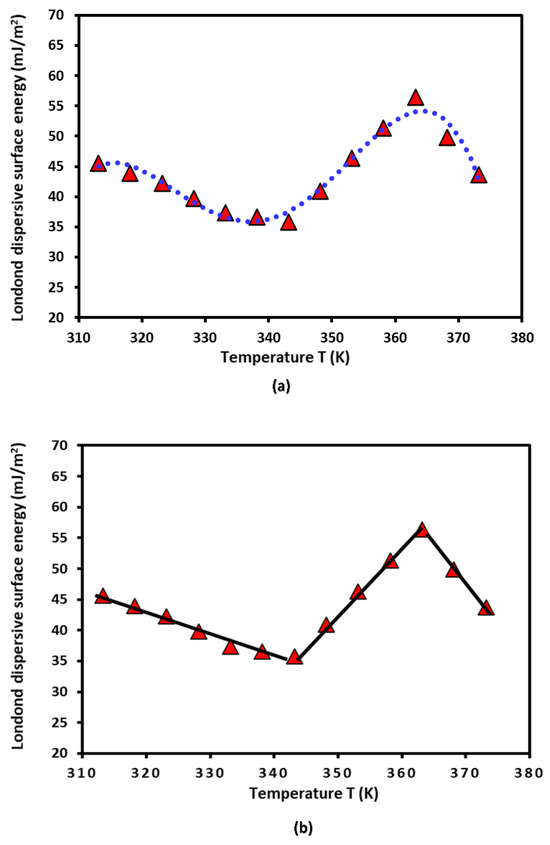
Figure 1.
Evolution of of the PLA polymer as a function of the temperature T (K) using the Hamieh thermal model. (a) Non-linear evolution of and (b) three linear variations.
A non-linear evolution of was observed (Figure 1a), showing an important change in the thermodynamic properties of PLA when the temperature varied. However, three linear variations were distinguished (Figure 1b), which were characterized by a decrease in in the temperature interval [313.15 K, 333.15K], given in Equation (14):
Passing by a minimum of the London dispersive surface energy equal to 35.8 mJ/m2 at , followed by an increase variation of to reach a maximum equal to 56.4 mJ/m2 at , with the following straight line Equation (15):
And finally, a decrease characterized by Equation (16):
This interesting result highlighted the possible glass transition temperature of PLA around (70 °C) explained by the change in the variations of of PLA, before and after , when the temperature increased.
3.2. Polar Surface Free Energy of PLA Polymer
All thermodynamic surface properties of PLA polymers were obtained using our new method of the harmonic mean of the ionization energies and the deformation polarizability of particles. Table 1 and Table 2, respectively, present the values of deformation polarizability, the harmonic mean of the ionization energies, and the parameter of the various organic molecules in interaction with the PLA polymer. The Handbook of Physics and Chemistry [72] was used to determine the parameters of the different solvents.

Table 1.
Values of deformation polarizability (respectively, in 10−30 m3 and in 10−40 C m2/V) and ionization energy (in eV) of the various organic molecules and PLA polymers.

Table 2.
Values of the harmonic mean of the ionization energies of PLA particles and organic solvents (in 10−19 J) and the parameter (in 10−15 SI unit) for the various organic molecules.
The obtained experimental results (Tables S1 and S2), the values in Table 1 and Table 2, and the Equations (2), (4), and (8) allowed us to calculate the polar free surface energy () of the polar solvents adsorbed on the PLA polymer as a function of the temperature T (Table 3).

Table 3.
Values of (in kJ/mol) of polar molecules adsorbed on PLA.
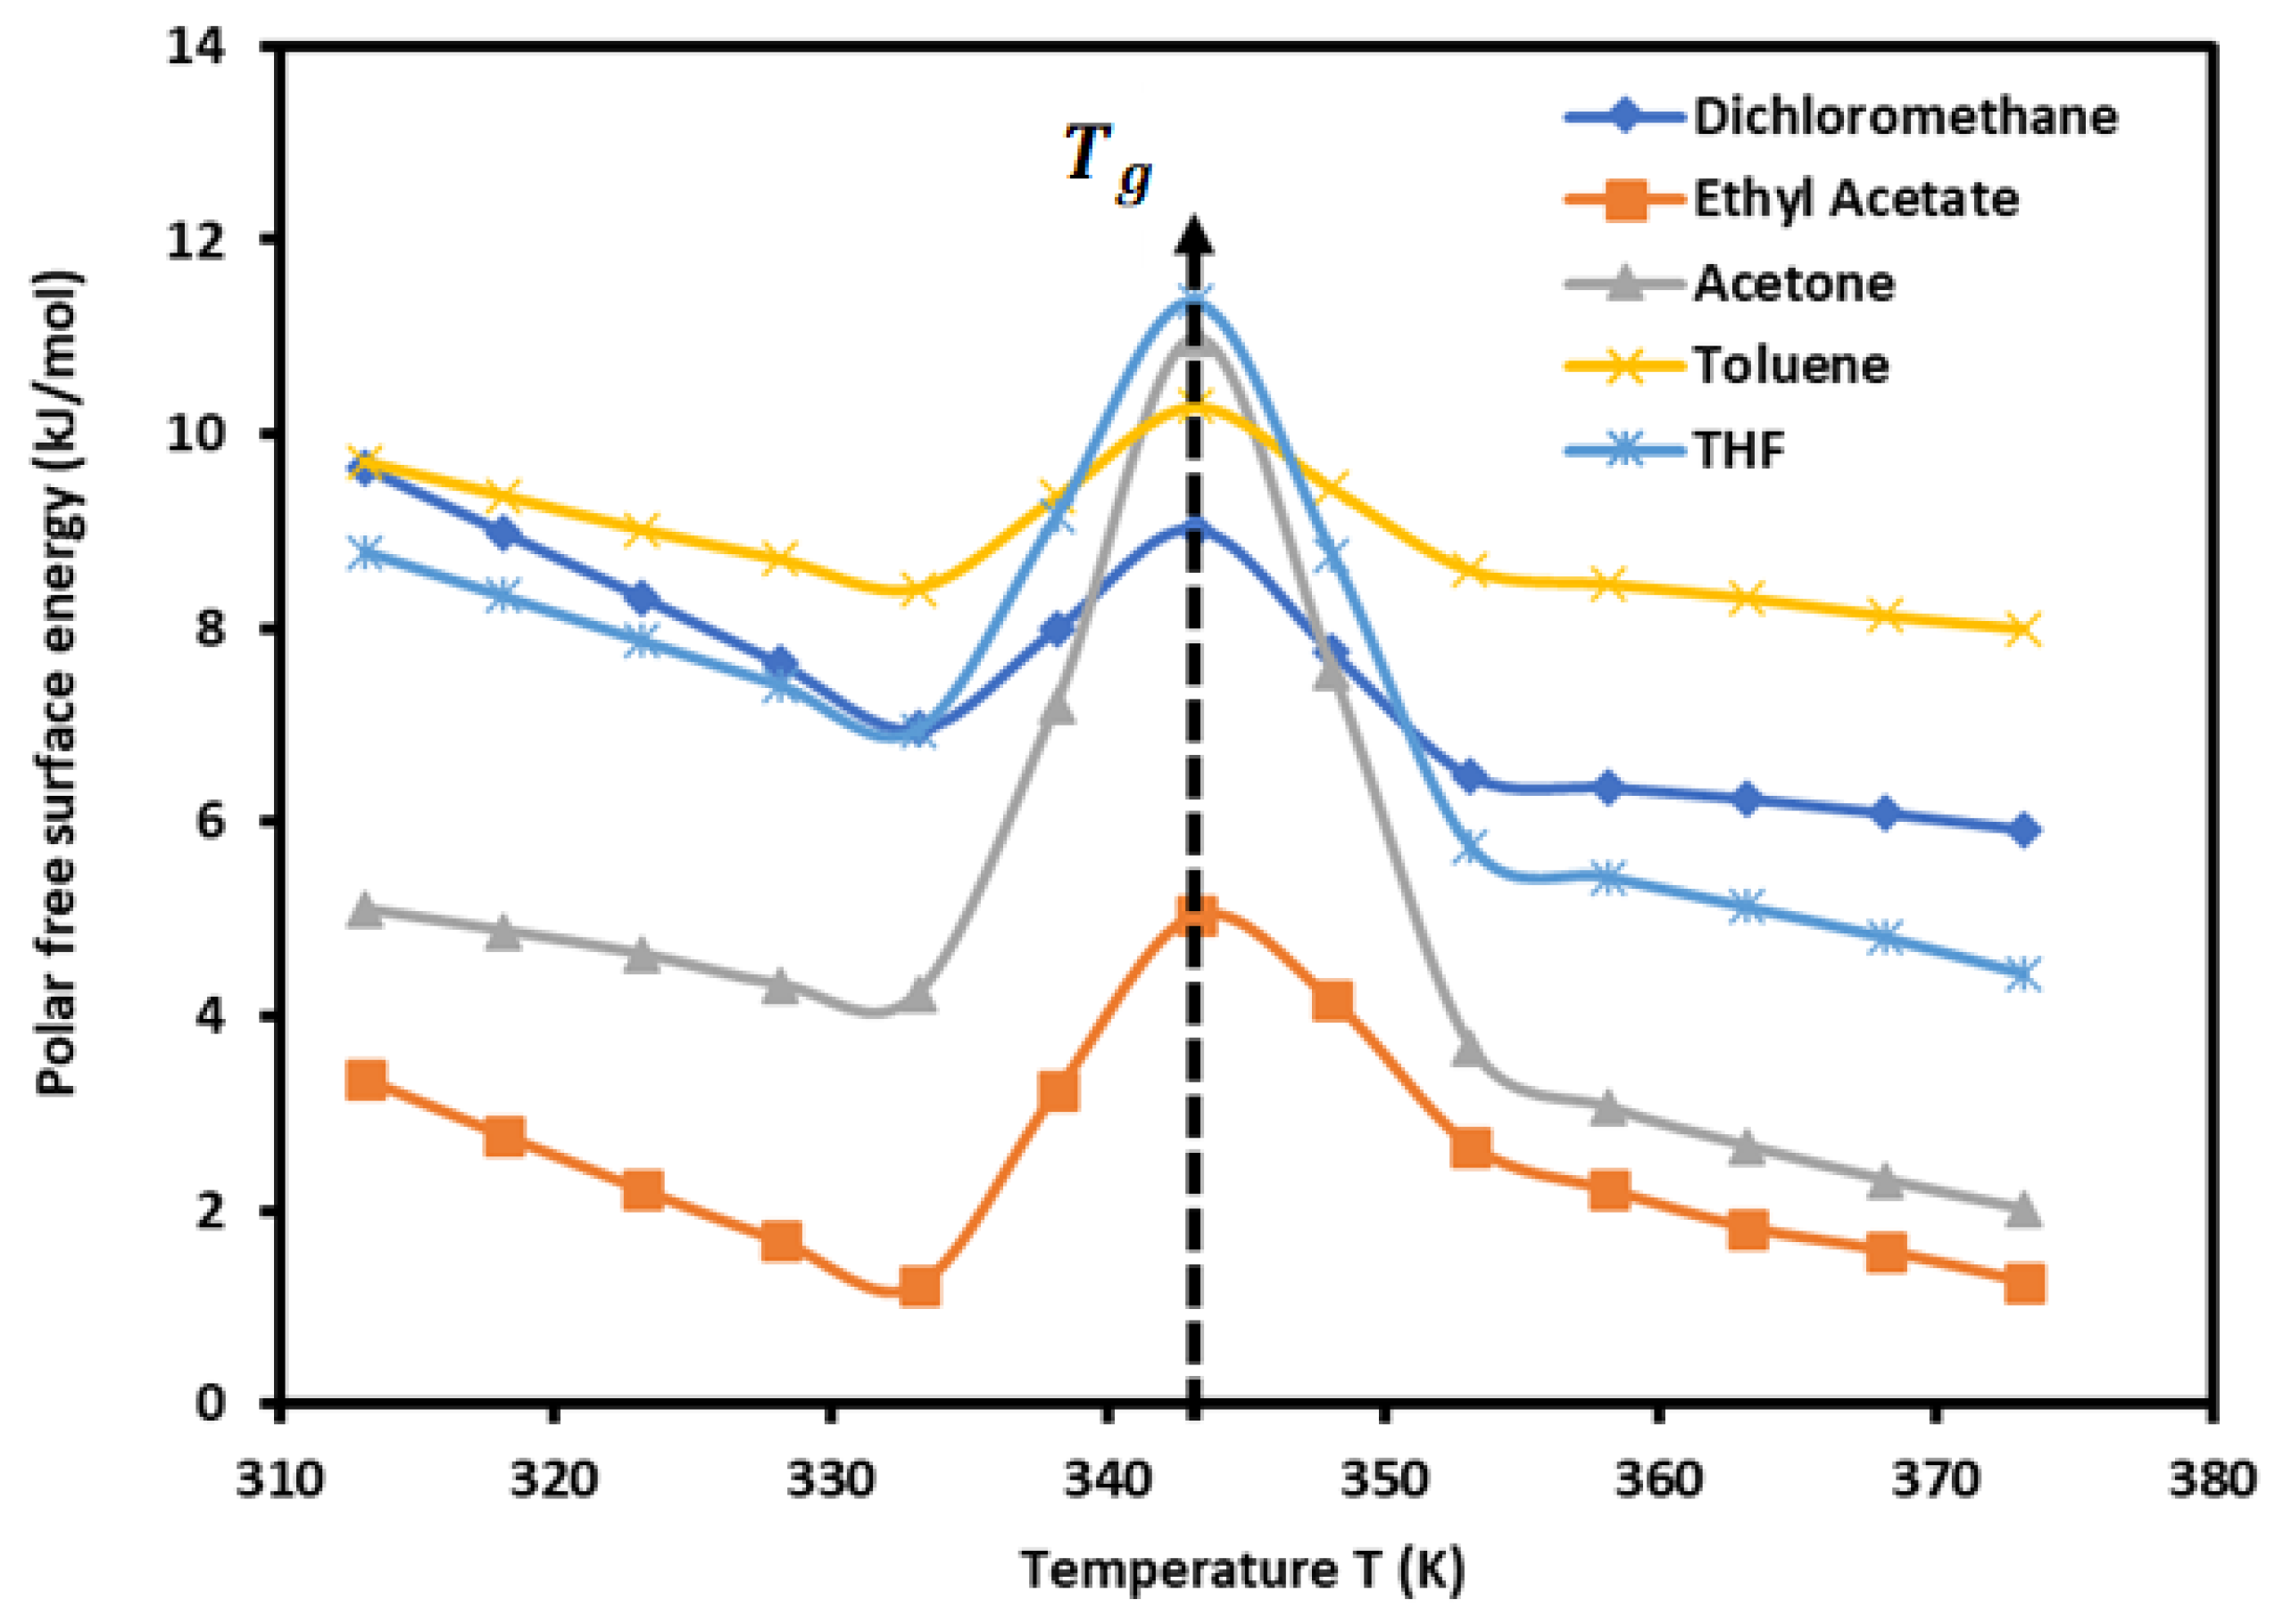
The results in Table 3 show an amphoteric behavior of PLA with a stronger basic character, which is clearly shown by the high values of of dichloromethane, the most acidic solvent among the five used polar molecules, then traducing the important interaction energy with PLA. It can be observed in Table 3 that the variations in for all polar molecules are not linear. The curves of of polar solvents adsorbed on PLA in Figure 2 prove this non-linearity against the temperature, with a maximum temperature around 343.15 K confirming the presence of the glass temperature of PLA, which was previously shown with the variations in the London dispersive surface energy as a function of the temperature.
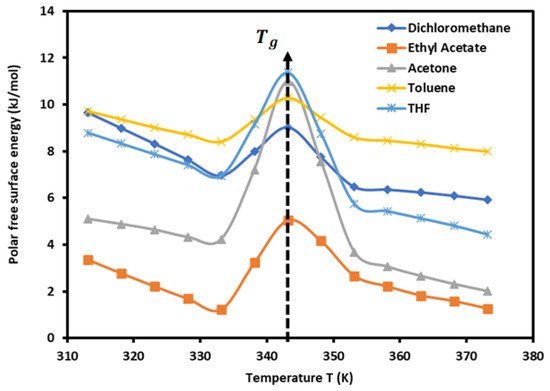
Figure 2.
Variations in the polar free surface energy () of polar solvents adsorbed on PLA polymers as a function of temperature.
The results plotted in Figure 2 show an important non-monotonous variation in the polar free surface energy as a function of temperature due to the effect of the glass transition on the surface properties of the polymer. It has been proven in a previous work [73] that the presence of a glass transition temperature for a polymer affects the physicochemical properties and the dispersive and polar free energies of the solid surfaces. The change in the values of the free energy and enthalpy of adsorption of polar solvents on PLA will directly affect the acid–base constants of the polymer. In general, the free energy of adsorption decreases as a function of the temperature. However, in the case of a polymer with a glass transition, there is a broken variation of the free energy, enthalpy, entropy, and all parameters of adsorption. This necessarily causes a variation in the acid–base parameters of the polymer. In a previous study [73], the same variations were observed in the case of acrylate cellulose. Adsorption is characterized by a negative value of the enthalpy of adsorption, while a positive value is obtained in the desorption case.
3.3. Lewis’s Acid–Base Constants of PLA
The curves of () of polar molecules drawn in Figure 2 show four different temperature intervals in which the variations of () are represented by a straight line with an excellent linear regression coefficient equal to 0.9990. The results are given in Table 4 for the different equations.

Table 4.
Equations of of the polar solvents adsorbed on PLAs for the different temperature intervals.
The values of the polar enthalpy ( and entropy ( of the polar molecules adsorbed on PLA polymers were deduced from the equations of in Table 4. The values of these polar thermodynamic parameters are given in Table 5.

Table 5.
Values of polar enthalpy () and entropy () of polar probes adsorbed on PLAs.
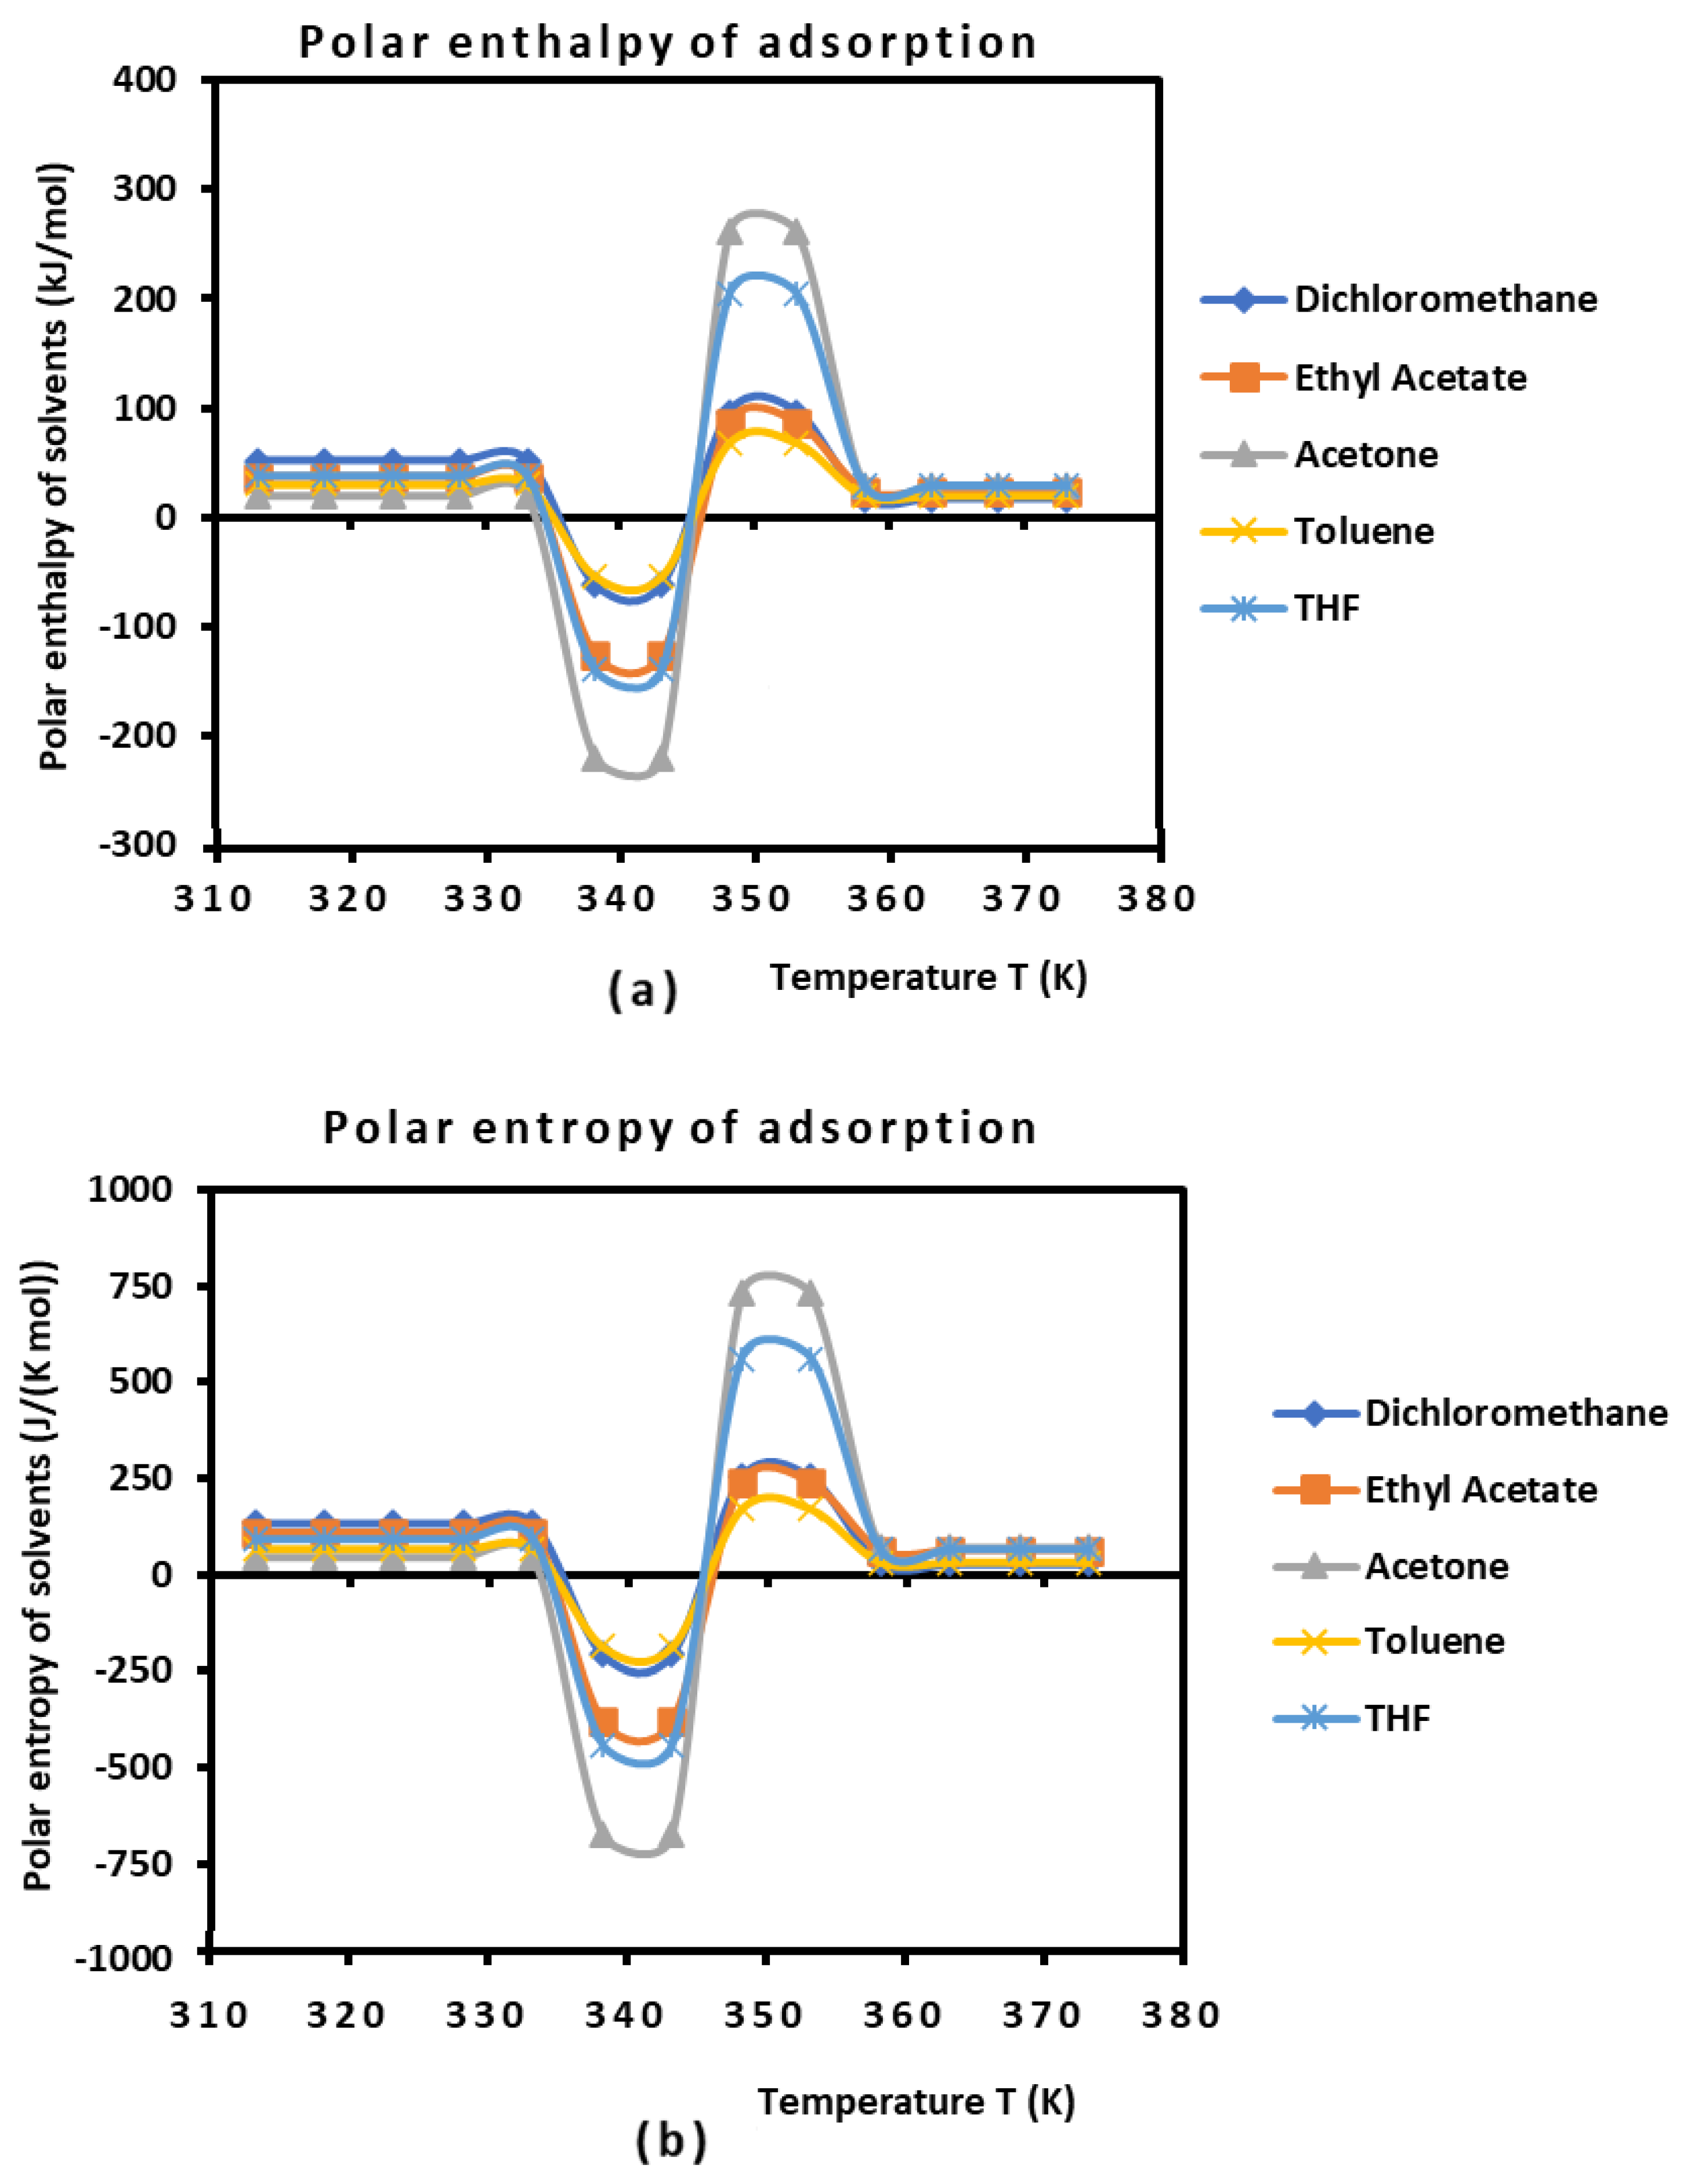
Table 5 allowed us to draw in Figure 4 the curves of () and the entropy () of polar molecules as a function of the temperature.
It was observed that the curves in Figure 3 present positive values of polar enthalpy and entropy of polar solvents, before and after the glass transition temperature, highlighting the adsorption phenomenon, whereas desorption was observed during the transition process, showing a repulsive interaction around the glass transition. These types of variations in the acid–base parameters as a function of the temperature have also been observed in other studies [73]. An interesting result can be seen in Figure 3. It concerned the values of () and the entropy () of polar solvents adsorbed on PLAs. Indeed, the variations in these surface parameters are constant for the temperature intervals located far from the glass transition (. This will strongly affect the Lewis’s acid–base parameters of PLAs against temperature.
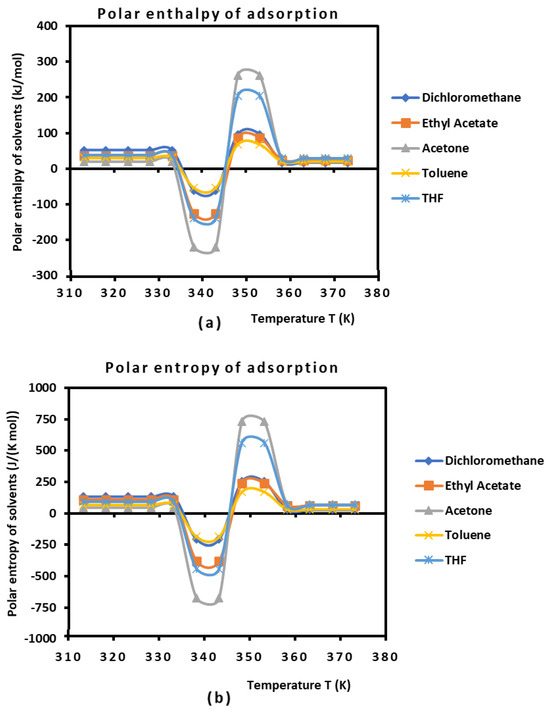
Figure 3.
Variations of () (a) and entropy () (b) of polar molecules adsorbed on PLA polymers as a function of the temperature.
Using the empirical relation (10) and the results in Table 5 and Figure 3, the Lewis enthalpic and entropic acid–base constants, , , and of PLA polymers, as a function of the temperature with their ratios are given in Table 6.

Table 6.
Values of the enthalpic acid–base constants and (unitless), the entropic acid base constants and (unitless), the acid–base ratios of PLA, and the linear regression coefficients R².
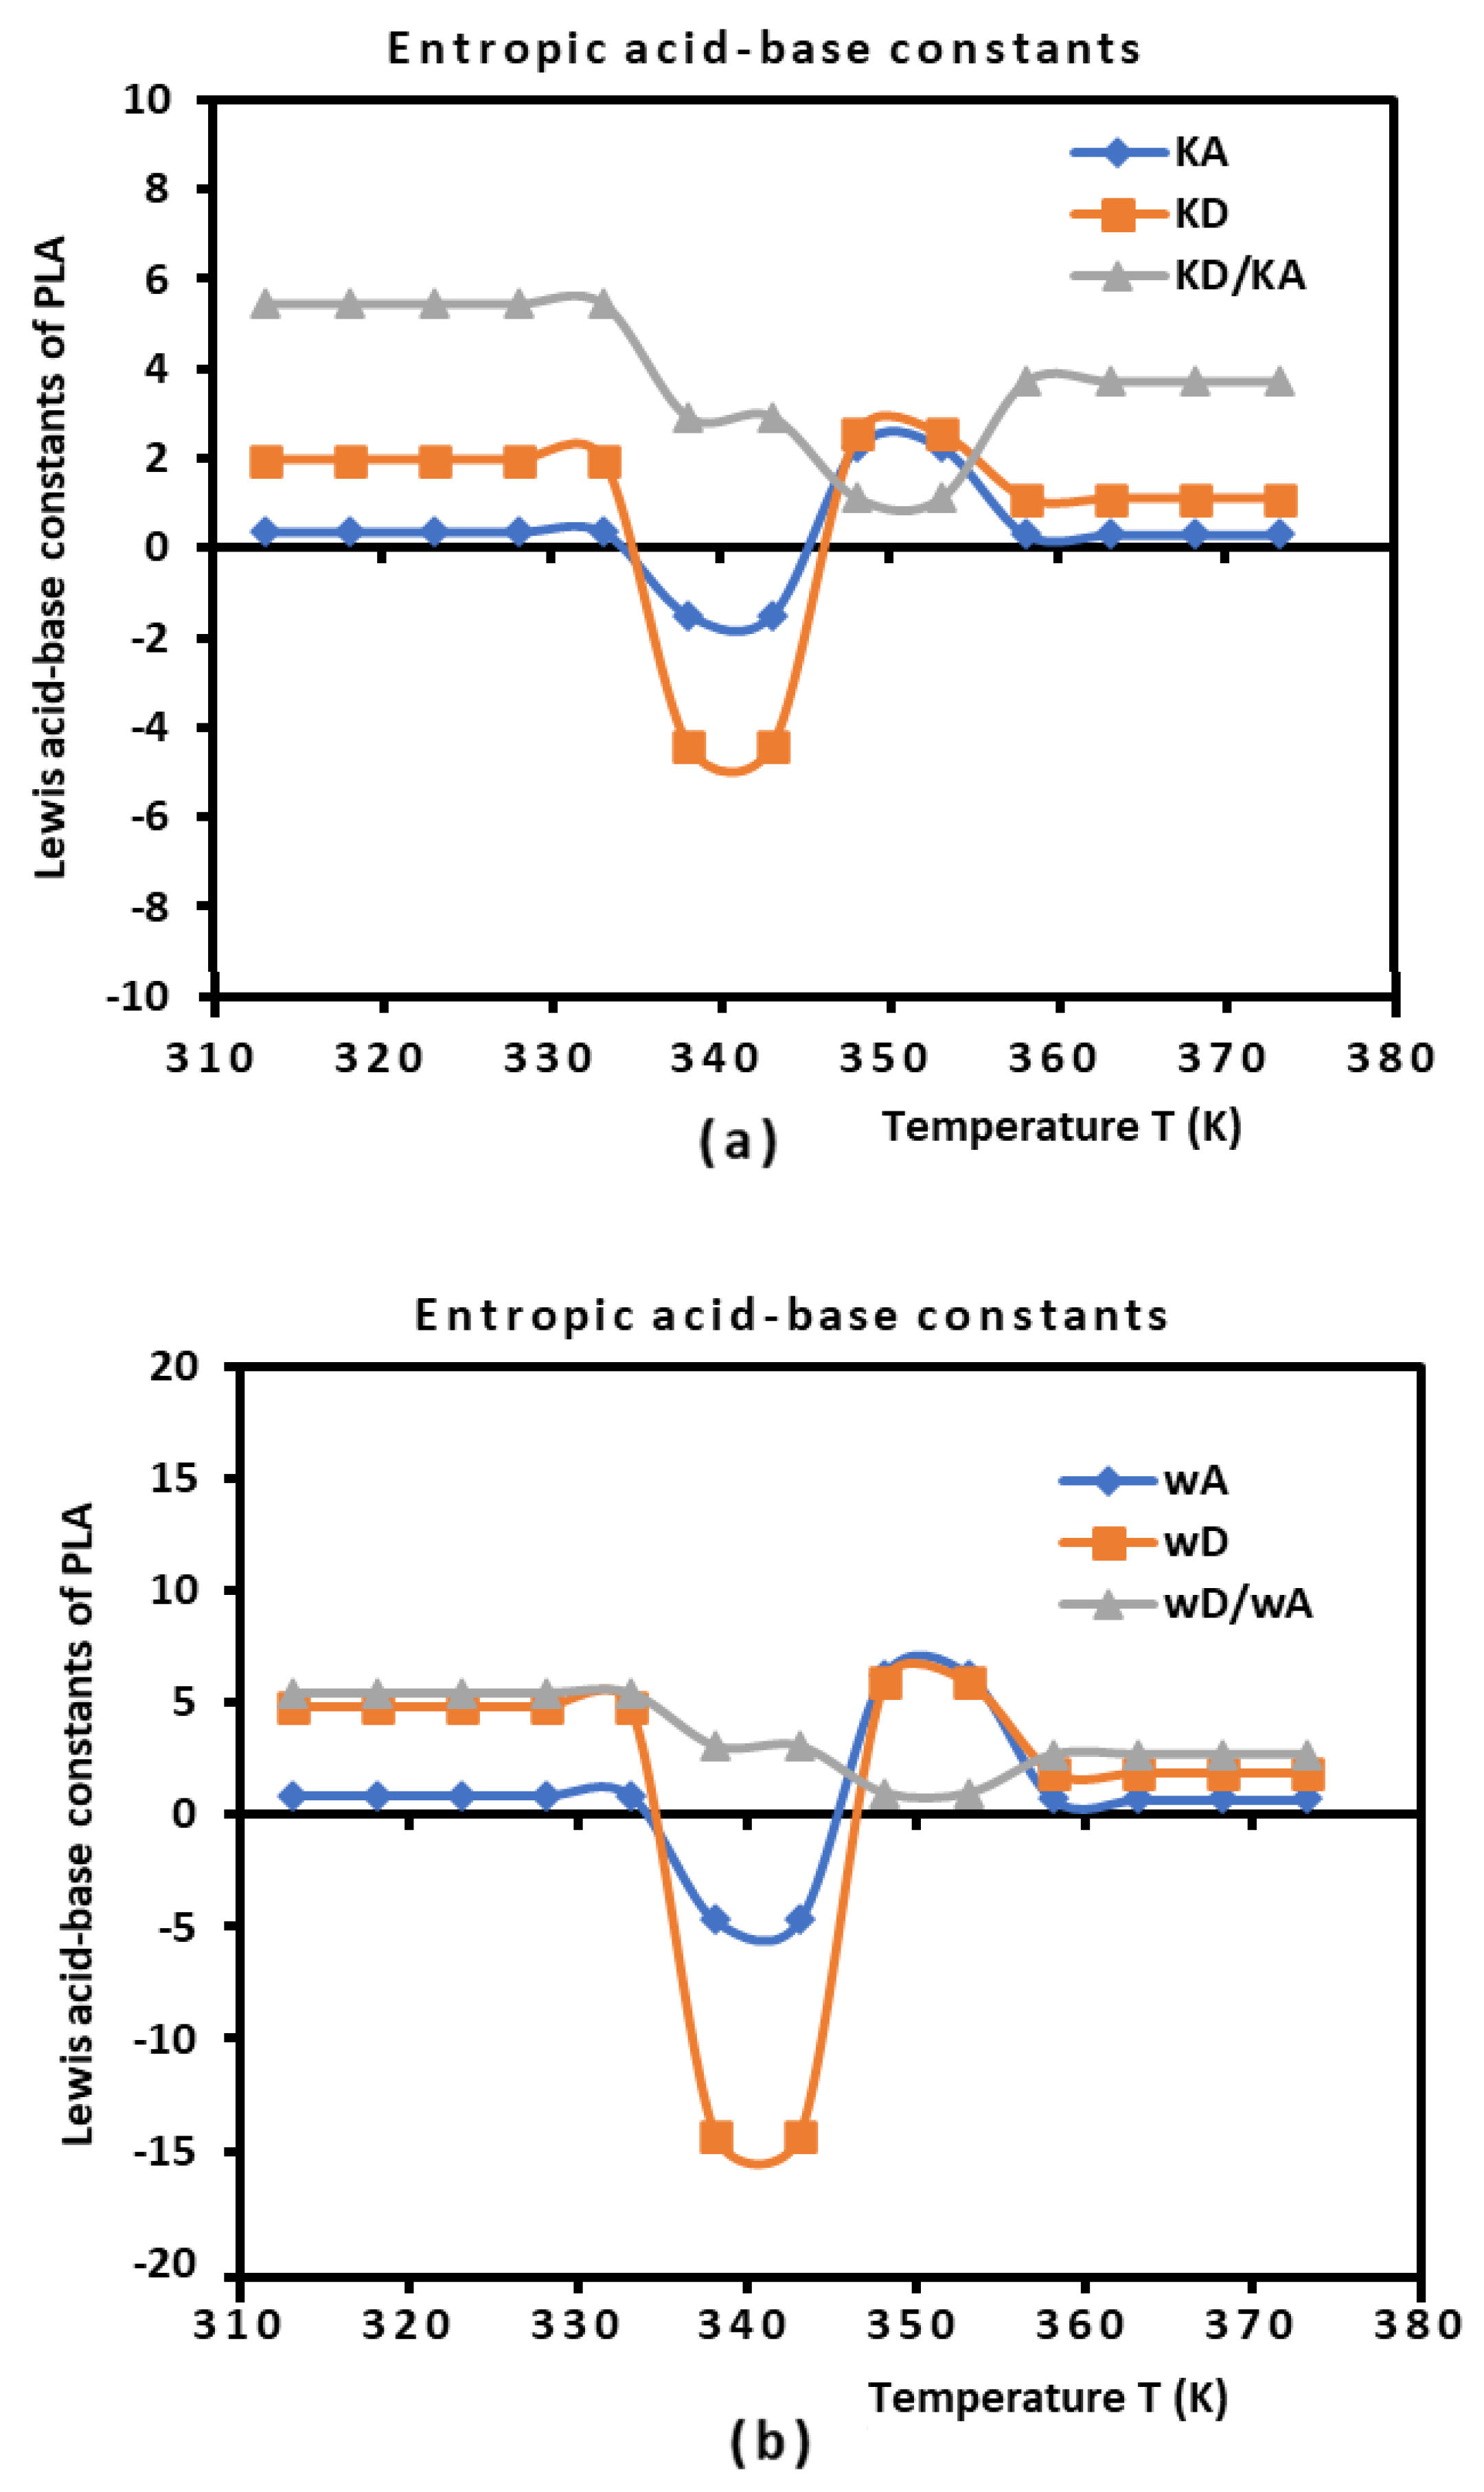
The results in Table 6 show that the behavior of the PLA surface is 5.5 times more basic than acidic for a temperature less than 333.15 K (Figure 4). The desorption of the polar solvents in the glass transition process led to a neutral surface of the polymer for , characterized by negative values of the Lewis acid–base constants , , and of PLA. After the glass transition temperature, two zones were distinguished (Figure 5):
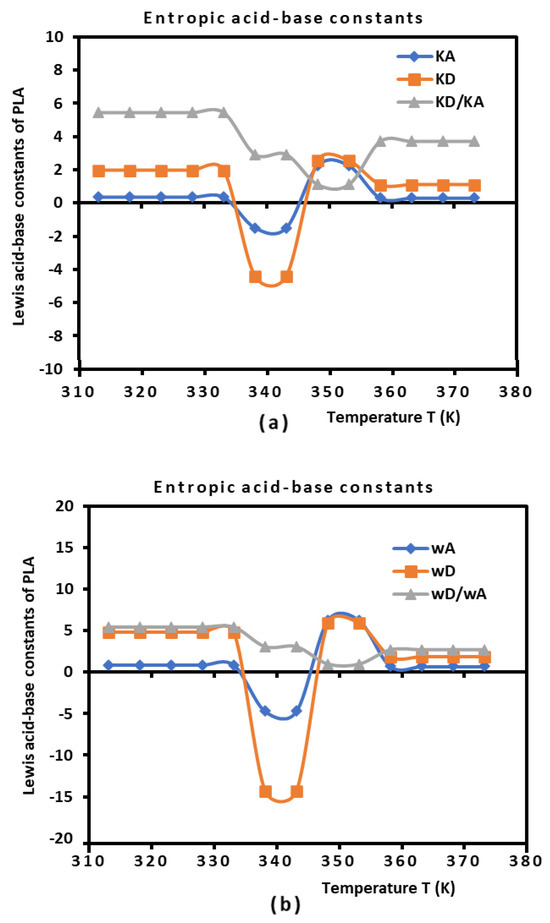
Figure 4.
Variations in the Lewis enthalpic acid–base constants and (a) and the Lewis entropic acid base constants and (b) as a function of the temperature.
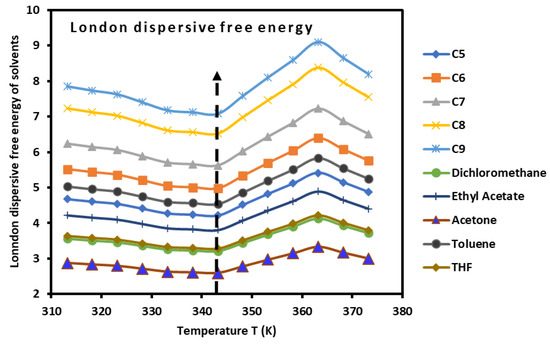
Figure 5.
Variations in the London dispersive free energy (kJ/mol) of n-alkanes and polar molecules adsorbed on PLA polymers as a function of the temperature.
- Stronger amphoteric character of PLAs with the highest values of the Lewis acid–base constants for .
- Decreasing amphoteric behavior of the PLA surface with the lowest values of , , and of the polymer for .
Table 6 and Figure 4 clearly show the stronger basic character of PLA varying with the temperature and decreasing amphoteric behavior for larger temperatures (. In fact, the observed variations in the Lewis’s acid–base of PLA (Figure 4) showed the same tendence as those of () and entropy () of polar molecules. The variations in all Lewis acid–base variables were constant for , whereas strong non-linear behavior was highlighted around the glass transition in the temperature interval .
3.4. Correction of the Acid–Base Parameters of PLA
The validity of Equation (10) was not always satisfied, as shown by the values of the linear regression coefficients R2 in Table 6. The correction reported by Hamieh et al. in other papers was applied in this work to give more accurate values of the acid–base constants of PLA polymers. Equations (11)–(13) were used alongside procedure developed in a recent paper [35]. The corrected results are presented in Table 7.

Table 7.
Values of the corrected acid–base constants , , , , and the acid–base ratios of PLA.
3.5. Dispersive and Polar Free Energy of PLA
This new method applied on the PLA polymer using the London dispersion interaction equation resulted in the net separation of the London dispersive free energy and the polar free energy of interaction between the PLA and the adsorbed organic molecules. By using Equation (3), it was possible to experimentally determine the values of of all of the molecules adsorbed on the PLA polymer from the following equation:
where the values of the parameter were determined from the experimental results (Table 8).

Table 8.
Values of the parameter as a function of the temperature.
It was observed that the variations in parameter given in Table 7 passed through a minimum corresponding exactly to the glass transition temperature .
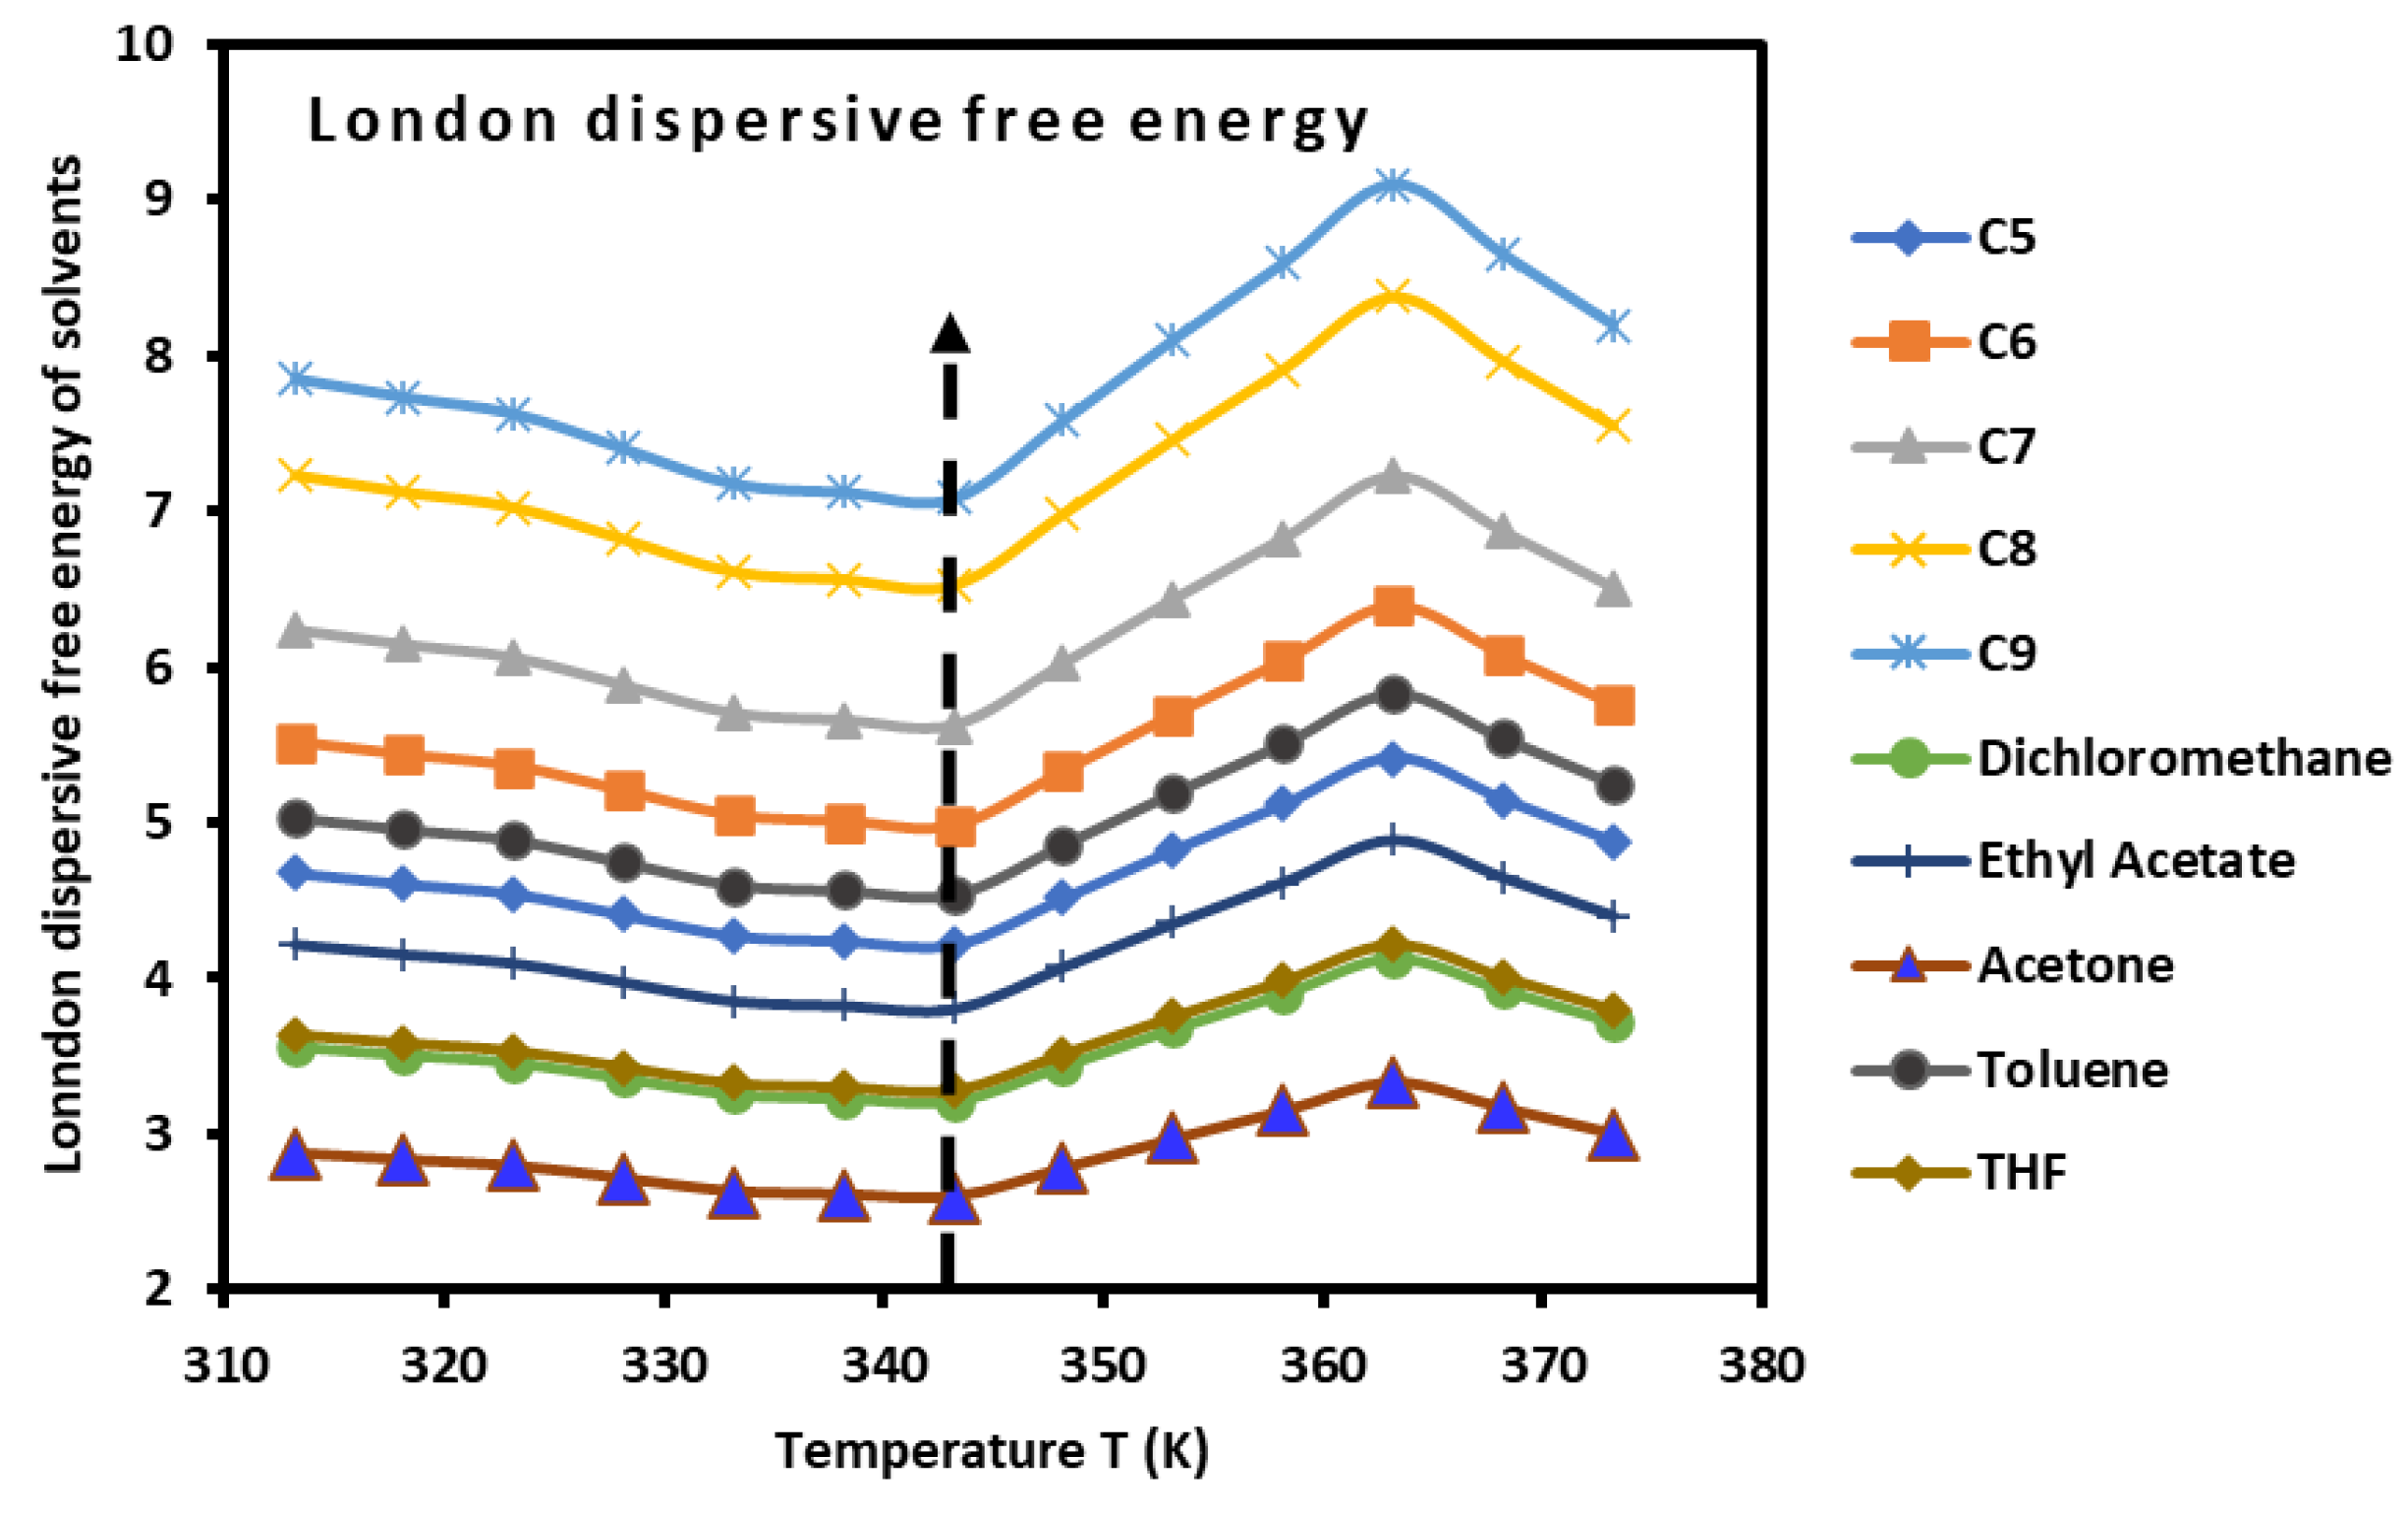
The values of of the adsorbed organic molecules were determined (Tables S3 and S4). The obtained results led to drawing the variations in , which also showed a minimum at the glass transition, as shown in Figure 5. Three linear domains were observed in the curves of the dispersive free energy of polar and non-polar adsorbed molecules. These domains were located in the following temperature intervals:
- , with a positive slope of .
- , with a negative slope of .
- , with a positive slope of .
In general, the variations in of the adsorbed molecules are linear for many solid materials; however, in the case of the PLA polymer, the presence of the glass transition disrupts this linearity to reach linear variation again.
The experimental determination of the dispersive and polar energy of interaction allowed us to obtain the total free energy of organic molecules (Table S5 and Figure S1), which also highlighted the presence of the glass transition.
3.6. Average Separation Distance H
Table 8 and Equation (7) determine the average separation distance H between the PLA surface and the organic molecules as a function of temperature. The results obtained are given in Table 9. These results showed a slight variation in the separation distance when the temperature varies, but it respects the general tendency observed with the other thermodynamic variables, showing a signature at the glass transition temperature reported for (Figure S2). The results in Table 9 and Figure S2 show a small increase in the separation distance when the temperature increases until the glass transition , followed by a slight decrease in after this temperature. This result confirmed that obtained by the stronger acid–base constants of PLA obtained for .

Table 9.
Values of the average separation distance H (in Å) as a function of the temperature.
3.7. Lewis Acid–Base Surface Energies of PLA
To determine the acid and base surface energy of the PLA polymer, Van Oss’s relation was used [74]:
where and are the respective acid and base surface energy of the polar molecule adsorbed on the PLA surface with , the surface area of the adsorbed solvent.
Using the experimental values relative to ethyl acetate (EA) and dichloromethane (CH2Cl2), respectively, given by , and , it was possible to determine the values of and of the PLA polymer using Equation (19):
whereas the acid–base (polar) surface energy of PLA was obtained from Equation (20):
The results are reported in Table 10 and Figure S3. The variations in the acid and base surface energies versus the temperature showed a decrease in these surface energy parameters and then an increase, reaching a maximum at the glass transition temperature, followed by a final decrease until . An important basic surface energy of PLA was observed with smaller acidic surface energy.

Table 10.
Values of the polar acid and base surface energies , , and (mJ/m2) of PLAs as a function of the temperature.
The results in Table 10 with those relative to the dispersive surface energy of PLAs, previously obtained in this work, led to the determination of the Lifshitz–Van der Waals (LW) surface energy (Table 11) using Equation (21):

Table 11.
Values of the dispersive energies and the Lifshitz–Van der Waals (LW) surface energy (mJ/m2) of PLAs as a function of the temperature.
The determination of the Lifshitz–Van der Waals (LW) surface energy (Table 11) of PLAs showed an important variation as a function of the temperature by presenting a decrease at the glass transition followed by a sudden increase just after the transition, and finishing by a new decrease. The values of showed the identical variations as those obtained with the free energy, enthalpy, entropy, and acid–base parameters.
3.8. Polar Component of the Surface Energy of Polar Molecules
Using the previous results and Equation (22), it is observed that the polar free energy of polar molecules adsorbed on PLA are related to the polar components of the surface energy of the PLA polymer and the polar organic molecules .
of polar molecules was directly obtained from Equation (22). The results are given in Table 12.

Table 12.
Values of (mJ/m2) of polar molecules adsorbed on PLAs.
Table 12 shows that, among all of the obtained values of the polar components of the surface energy of polar molecules, the stronger values were obtained with dichloromethane, the highest acidic solvent used in this study, once again proving the highest Lewis basicity of PLA polymers. It is shown (Table 12) that the polar component of the surface energy of the various polar organic molecules adsorbed on PLA varied as a function of the temperature. These variations also followed the same trends obtained by the presence of the glass transition, which affected the variations in all of the surface thermodynamic parameters.
3.9. Consequences of These Results of the Work of Adhesion
The polar component of the work of adhesion of the polar organic molecule adsorbed on PLA is given by relation 23:
The results in Table 11 and Table 12 led to the determination of of the different polar molecules. Table 13 depicts the values of the polar work of adhesion at various temperatures.

Table 13.
Values of (mJ/m2) of polar molecules adsorbed on PLAs.
The results in Table 13 show that the variations in the work of adhesion of all polar solvents were not linear and that they all admitted a maximum at the glass transition temperature of PLA. The highest polar work of adhesion was obtained with dichloromethane, respectively, followed by THF, toluene, acetone, and ethyl acetate, again proving the highest Lewis basicity of PLA compared to its Lewis acidity.
4. Conclusions
Inverse gas chromatography (IGC) at infinite dilution was used to determine the surface thermodynamic properties of the biodegradable poly lactic acid, which is considered the most interesting material that can be used in 3D printing applications. The new method used was based on the London dispersion interaction equation. This equation took into account the polarizability and the harmonic mean of the ionization energies of PLA polymers and adsorbed organic solvents. The London dispersive energy of PLA materials was determined using the Hamieh thermal model. The free dispersive and polar energies of adsorbed solvents were obtained using the new parameter and the net retention volumes of adsorbed probes from chromatographic measurements. The variations in all thermodynamic parameters of the interaction of organic molecules adsorbed on PLAs highlighted four temperature intervals with linear equations in each interval of temperature. A glass transition temperature of PLA was located at . The presence of this transition phenomenon had an important effect on the non-linearity in the domain of the temperature containing the glass transition temperature. This is due to the strong variation of the enthalpic and entropic acid base constants of PLA as a function of temperature. A stronger basic character of the PLA surface was highlighted before and after the glass transition, and a slight variation in the average separation distance between the PLA polymer and the solvents was observed.
The determination of the various components , , and of acid–base surface energies of PLA allowed us to calculate the Lifshitz–Van der Waals surface energy . A dominant basic surface character was shown with the highest value of of PLA. All these surface parameters confirmed the presence of for poly lactic acid.
The application of this new method enabled a net separation between the polar and dispersive free energies and also the determination of the polar components of the surface energy of polar solvents adsorbed on the PLA polymer. These new findings will allow us to make an accurate determination of the polar works of adhesion between the PLA surface and organic molecules. The new values from this work on the adhesion of the solvents and PLA are very important in 3D and 4D printing applications, particularly when the temperature increases. Other studies are now prepared to validate the different results obtained in this work by applying the same methodology to other polymers and, especially, in the case of polymers adsorbed on oxides by varying the tacticity of polymers.
Supplementary Materials
The following supporting information can be downloaded at https://www.mdpi.com/article/10.3390/biomimetics9050268/s1. Table S1. Values of − (in kJ/mol) of the various non-polar solvents adsorbed on PLA polymer as a function of temperature. Table S2. Values of − (in kJ/mol) of the various polar solvents adsorbed on PLA polymer as a function of the temperature. Table S3. Values of − (kJ/mol) of the various non-polar solvents adsorbed on PLA polymer as a function of temperature. Table S4. Values of − (kJ/mol) of the various polar solvents adsorbed on PLA polymer as a function of temperature. Table S5. Values of − (kJ/mol) of the various polar solvents adsorbed on PLA polymer as a function of temperature. Figure S1. Variations in the total free energy (kJ/mol) of polar molecules adsorbed on PLA polymer as a function of temperature. Figure S2. Variations in the average separation distance H (in Å) as a function of temperature. Figure S3. Variations in the polar acid and base surface energies , , and (mJ/m2) of PLA as a function of temperature.
Funding
This research received no external funding.
Institutional Review Board Statement
Not applicable.
Data Availability Statement
The data presented in this study are available in article and supplementary materials.
Conflicts of Interest
The author declares no conflicts of interest.
References
- Muthe, L.P.; Pickering, K.; Gauss, C. A Review of 3D/4D Printing of Poly-Lactic Acid Composites with Bio-Derived Reinforcements. Compos. Part C Open Access 2022, 8, 100271. [Google Scholar] [CrossRef]
- Zhang, Y.; Gao, Y.; Michelin, L.; Josien, L.; Vidal, L.; Schrodj, G.; Simon-Masseron, A.; Lalevée, J. Photopolymerization of ceramic/zeolite reinforced photopolymers: Towards 3D/4D printing and gas adsorption applications. Eur. Polym. J. 2022, 179, 111552. [Google Scholar] [CrossRef]
- Yin, J.; Zhao, X.; Hu, B.; Zhou, Q.; Yu, Y.; Zhang, Y.; Gao, J.; Xu, Y.; Lalevée, J. Fabrication of a Novel Fluorescein Embedded Photocomposite Based on Interpenetrating Polymer Network (IPN) and Its Application in 4D Printing. Adv. Mater. Technol. 2024, 9, 2301323. [Google Scholar] [CrossRef]
- Zheng, X.; Lee, H.; Weisgraber, T.H.; Shusteff, M.; Deotte, J.; Duoss, E.B.; Kuntz, J.D.; Biener, M.M.; Ge, Q.; Jackson, J.A.; et al. Ultraléger, ultra-rigideMétamatériaux mécanique. Science 2014, 344, 1373. [Google Scholar] [CrossRef]
- Dumitrescu, G.C.; Tanase, I.A. 3D Printing—A New Industrial Revolution. Knowl. Horizons. Econ. 2016, 8, 32–39. [Google Scholar]
- Pereira, T.; Kennedy, J.V.; Potgieter, J. A comparison of traditional manufacturing vs additive manufacturing, the best method for the job. Procedia Manuf. 2019, 30, 11–18. [Google Scholar] [CrossRef]
- Nkomo, N.Z. A Review of 4D Printing Technology and Future Trends; National University of Science and Technology: Bulawayo, Zimbabwe, 2018; Available online: https://www.researchgate.net/publication/328162917_A_Review_of_4D_Printing_Technology_and_Future_Trends (accessed on 2 March 2024).
- Shahbazi, M.; Jäger, H.; Ettelaie, R.; Mohammadi, A.; Kashi, P.A. Multimaterial 3D printing of self-assembling smart thermo-responsive polymers into 4D printed objects: A review. Addit. Manuf. 2023, 71, 103598. [Google Scholar] [CrossRef]
- Li, X.; Shang, J.; Wang, Z. Intelligent materials: A review of applications in 4D printing. Assem. Autom. 2017, 37, 170–185. [Google Scholar] [CrossRef]
- Tibbits, S.; McKnelly, C.; Olguin, C.; Dikovsky, D.; Hirsch, S. 4D Printing and Universal Transformation. In Proceedings of the ACADIA 2014 Design Agency: Proceedings of the 34th Annual Conference of the Association for Computer AIDED Design in Architecture, Los Angeles, CA, USA, 23–25 October 2014; pp. 539–548. [Google Scholar]
- Momeni, F.; Hassani, N.S.M.M.; Liu, X.; Ni, J. A review of 4D printing. Mater. Des. 2017, 122, 42–79. [Google Scholar] [CrossRef]
- Ayob, N.A.I.; Rawi, N.F.M.; Aziz, A.A.; Azahari, B.; Kassim, M.H.M. The properties of 3D printed poly (lactic acid) (PLA)/poly (butylene-adipate-terephthalate) (PBAT) blend and oil palm empty fruit bunch (EFB) reinforced PLA/PBAT composites used in fused deposition modelling (FDM) 3D printing. Phys. Sci. Rev. 2023, 8, 5135–5151. [Google Scholar] [CrossRef]
- Cardoso, P.H.M.; Coutinho, R.R.T.P.; Drummond, F.R.; da Conceição, M.D.N.; Thiré, R.M.d.S.M. Evaluation of Printing Parameters on Porosity and Mechanical Properties of 3D Printed PLA/PBAT Blend Parts. Macromol. Symp. 2020, 394, 2000157. [Google Scholar] [CrossRef]
- Liu, Z.; Wang, Y.; Wu, B.; Cui, C.; Guo, Y.; Yan, C. A critical review of fused deposition modeling 3D printing technology in manufacturing polylactic acid parts. Int. J. Adv. Manuf. Technol. 2019, 102, 2877–2889. [Google Scholar] [CrossRef]
- Iwata, T. Biodegradable and Bio-Based Polymers: Future Prospects of Eco-Friendly Plastics. Angew. Chem. Int. Ed. 2015, 54, 3210–3215. [Google Scholar] [CrossRef] [PubMed]
- Farah, S.; Anderson, D.G.; Langer, R. Physical and mechanical properties of PLA, and their functions in widespread applications—A comprehensive review. Adv. Drug Deliv. Rev. 2016, 107, 367–392. [Google Scholar] [CrossRef]
- Pappu, A.; Pickering, K.L.; Thakur, V.K. Manufacturing and characterization of sustainable hybrid composites using sisal and hemp fibres as reinforcement of poly (lactic acid) via injection moulding. Ind. Crop. Prod. 2019, 137, 260–269. [Google Scholar] [CrossRef]
- Wijk, A.V.; Wijk, I.V. 3D Printing with Biomaterials: Towards a Sustainable and Circular Economy; IOS Press: Amsterdam, The Netherlands, 2015. [Google Scholar] [CrossRef]
- Dubey, S.P.; Thakur, V.K.; Krishnaswamy, S.; Abhyankar, H.A.; Marchante, V.; Brighton, J.L. Progress in environmental-friendly polymer nanocomposite material from PLA: Synthesis, processing and applications. Vacuum 2017, 146, 655–663. [Google Scholar] [CrossRef]
- Wickramasinghe, S.; Do, T.; Tran, P. FDM-Based 3D Printing of Polymer and Associated Composite: A Review on Mechanical Properties, Defects and Treatments. Polymers 2020, 12, 1529. [Google Scholar] [CrossRef] [PubMed]
- Mukherjee, T.; Kao, N. PLA Based Biopolymer Reinforced with Natural Fibre: A Review. J. Polym. Environ. 2011, 19, 714–725. [Google Scholar] [CrossRef]
- Murariu, M.; Dubois, P. PLA composites: From production to properties. Adv. Drug Deliv. Rev. 2016, 107, 17–46. [Google Scholar] [CrossRef]
- Getme, A.S.; Patel, B. A review: Bio-fiber’s as reinforcement in composites of polylactic acid (PLA). Mater. Today Proc. 2019, 26, 2116–2122. [Google Scholar] [CrossRef]
- Wu, X.; Huang, W.M.; Zhao, Y.; Ding, Z.; Tang, C.; Zhang, J. Mechanisms of the Shape Memory Effect in Polymeric Materials. Polymers 2013, 5, 1169–1202. [Google Scholar] [CrossRef]
- Zhou, J.; Sheiko, S.S. Reversible shape-shifting in polymeric materials. J. Polym. Sci. Part B Polym. Phys. 2016, 54, 1365–1380. [Google Scholar] [CrossRef]
- Leist, S.K.; Gao, D.; Chiou, R.; Zhou, J. Investigating the shape memory properties of 4D printed polylactic acid (PLA) and the concept of 4D printing onto nylon fabrics for the creation of smart textiles. Virtual Phys. Prototyp. 2017, 12, 290–300. [Google Scholar] [CrossRef]
- Yang, C.; Wang, B.; Li, D.; Tian, X. Modelling and characterisation for the responsive performance of CF/PLA and CF/PEEK smart materials fabricated by 4D printing. Virtual Phys. Prototyp. 2017, 12, 69–76. [Google Scholar] [CrossRef]
- Dogan, S.; Boyacioglu, S.; Kodal, M.; Gokce, O.; Ozkoc, G. Thermally induced shape memory behavior, enzymatic degradation and biocompatibility of PLA/TPU blends: “Effects of compatibilization”. J. Mech. Behav. Biomed. Mater. 2017, 71, 349–361. [Google Scholar] [CrossRef] [PubMed]
- Senatov, F.S.; Niaza, N.K.; Zadorozhnyy, M.Y.; Maksimkin, A.V.; Kaloshkin, S.D.; Estrin, Y.Z. Mechanical properties and shape memory effect of 3D-printed PLA-based porous scaffolds. J. Mech. Behav. Biomed. Mater. 2016, 57, 139–148. [Google Scholar] [CrossRef]
- Mohapatra, A.K.; Mohanty, S.; Nayak, S.K. Study of Thermo-Mechanical and Morphological Behaviour of Biodegradable PLA/PBAT/Layered Silicate Blend Nanocomposites. J. Polym. Environ. 2014, 22, 398–408. [Google Scholar] [CrossRef]
- Tsuji, H.; Ikada, Y.J. Blends of aliphatic polyesters. II. Hydrolysis of solution-cast blends from poly(L-lactide) and poly(E-caprolactone) in phosphate-buffered solution. J. Appl. Polym. Sci. 1998, 67, 405–415. [Google Scholar] [CrossRef]
- Perego, G.; Cella, G.D.; Bastioli, C. Effect of molecular weight and crystallinity on poly(lactic acid) mechanical properties. J. Appl. Polym. Sci. 1996, 59, 37–43. [Google Scholar] [CrossRef]
- Bledzki, A.K.; Fabrycy, E. Degradable polymers—A technical report. Polimery 1992, 37, 343–350. [Google Scholar] [CrossRef]
- Garlotta, D. A Literature Review of Poly(Lactic Acid). J. Polym. Environ. 2001, 9, 63–84. [Google Scholar] [CrossRef]
- Hamieh, T. New Progress on London Dispersive Energy, Polar Surface Interactions, and Lewis’s Acid–Base Properties of Solid Surfaces. Molecules 2024, 29, 949. [Google Scholar] [CrossRef]
- Hamieh, T. London Dispersive and Lewis Acid-Base Surface Energy of 2D Single-Crystalline and Polycrystalline Covalent Organic Frameworks. Crystals 2024, 14, 148. [Google Scholar] [CrossRef]
- Hamieh, T. Inverse Gas Chromatography to Characterize the Surface Properties of Solid Materials. Chem. Mater. 2024, 36, 2231–2244. [Google Scholar] [CrossRef]
- Hamieh, T. Study of the temperature effect on the surface area of model organic molecules, the dispersive surface energy and the surface properties of solids by inverse gas chromatography. J. Chromatogr. A 2020, 1627, 461372. [Google Scholar] [CrossRef]
- Hamieh, T. New Methodology to Study the Dispersive Component of the Surface Energy and Acid–Base Properties of Silica Particles by Inverse Gas Chromatography at Infinite Dilution. J. Chromatogr. Sci. 2021, 60, 126–142. [Google Scholar] [CrossRef]
- Hamieh, T. New Physicochemical Methodology for the Determination of the Surface Thermodynamic Properties of Solid Particles. Appliedchem 2023, 3, 229–255. [Google Scholar] [CrossRef]
- Hamieh, T.; Ahmad, A.A.; Roques-Carmes, T.; Toufaily, J. New approach to determine the surface and interface thermodynamic properties of H-β-zeolite/rhodium catalysts by inverse gas chromatography at infinite dilution. Sci. Rep. 2020, 10, 20894. [Google Scholar] [CrossRef] [PubMed]
- London, F. The general theory of molecular forces. Trans. Faraday Soc. 1937, 33, 8b-26. [Google Scholar] [CrossRef]
- Flour, C.S.; Papirer, E. Gas-solid chromatography. A method of measuring surface free energy characteristics of short carbon fibers. 1. Through adsorption isotherms. Ind. Eng. Chem. Prod. Res. Dev. 1982, 21, 337–341. [Google Scholar] [CrossRef]
- Flour, C.S.; Papirer, E. Gas-solid chromatography: Method of measuring surface free energy characteristics of short fibers. 2. Through retention volumes measured near zero surface coverage. Ind. Eng. Chem. Prod. Res. Dev. 1982, 21, 666–669. [Google Scholar] [CrossRef]
- Flour, C.S.; Papirer, E. Gas-solid chromatography: A quick method of estimating surface free energy variations induced by the treatment of short glass fibers. J. Colloid Interface Sci. 1983, 91, 69–75. [Google Scholar] [CrossRef]
- Schultz, J.; Lavielle, L.; Martin, C. The Role of the Interface in Carbon Fibre-Epoxy Composites. J. Adhes. 1987, 23, 45–60. [Google Scholar] [CrossRef]
- Donnet, J.B.; Park, S.J.; Balard, H. Evaluation of specific interactions of solid surfaces by inverse gas chromatography. Chromatographia 1991, 31, 434–440. [Google Scholar] [CrossRef]
- Brendlé, E.; Papirer, E. A New Topological Index for Molecular Probes Used in Inverse Gas Chromatography for the Surface Nanorugosity Evaluation, 2. Application for the Evaluation of the Solid Surface Specific Interaction Potential. J. Colloid Interface Sci. 1997, 194, 217–224. [Google Scholar] [CrossRef] [PubMed]
- Brendlé, E.; Papirer, E. A New Topological Index for Molecular Probes Used in Inverse Gas Chromatography for the Surface Nanorugosity Evaluation, 1. Method of Evaluation. J. Colloid Interface Sci. 1997, 194, 207–216. [Google Scholar] [CrossRef]
- Sawyer, D.T.; Brookman, D.J. Thermodynamically based gas chromatographic retention index for organic molecules using salt-modified aluminas and porous silica beads. Anal. Chem. 1968, 40, 1847–1850. [Google Scholar] [CrossRef]
- Chehimi, M.M.; Pigois-Landureau, E. Determination of acid–base properties of solid materials by inverse gas chromatography at infinite dilution. A novel empirical method based on the dispersive contribution to the heat of vaporization of probes. J. Mater. Chem. 1994, 4, 741–745. [Google Scholar] [CrossRef]
- Donnet, J.-B.; Ridaoui, H.; Balard, H.; Barthel, H.; Gottschalk-Gaudig, T. Evolution of the surface polar character of pyrogenic silicas, with their grafting ratios by dimethylchlorosilane, studied by microcalorimetry. J. Colloid Interface Sci. 2008, 325, 101–106. [Google Scholar] [CrossRef]
- Jagiełło, J.; Ligner, G.; Papirer, E. Characterization of silicas by inverse gas chromatography at finite concentration: Determination of the adsorption energy distribution function. J. Colloid Interface Sci. 1990, 137, 128–136. [Google Scholar] [CrossRef]
- Rückriem, M.; Inayat, A.; Enke, D.; Gläser, R.; Einicke, W.-D.; Rockmann, R. Inverse gas chromatography for determining the dispersive surface energy of porous silica. Colloids Surf. A Physicochem. Eng. Asp. 2010, 357, 21–26. [Google Scholar] [CrossRef]
- Bauer, F.; Meyer, R.; Czihal, S.; Bertmer, M.; Decker, U.; Naumov, S.; Uhlig, H.; Steinhart, M.; Enke, D. Functionalization of porous siliceous materials, Part 2: Surface characterization by inverse gas chromatography. J. Chromatogr. A 2019, 1603, 297–310. [Google Scholar] [CrossRef] [PubMed]
- Strzemiecka, B.; Kołodziejek, J.; Kasperkowiak, M.; Voelkel, A. Influence of relative humidity on the properties of examined materials by means of inverse gas chromatography. J. Chromatogr. A 2012, 1217, 201–206. [Google Scholar] [CrossRef] [PubMed]
- Strzemiecka, B.; Voelkel, A.; Kasperkowiak, M. Characterization of zeolites as potential new generation fillers in abrasive articles, Colloids Surf A Physicochem. Eng. Asp. 2010, 372, 80–85. [Google Scholar] [CrossRef]
- Kasperkowiak, M.; Kołodziejek, J.; Strzemiecka, B.; Voelkel, A. Effect of impregnating agent and relative humidity on surface characteristics of sorbents determined by inverse gas chromatography. J. Chromatogr. A 2013, 1288, 101–104. [Google Scholar] [CrossRef] [PubMed]
- Peng, Y.; Gardner, D.J.; Han, Y.; Cai, Z.; Tshabalala, M.A. Influence of drying method on the surface energy of cellulose nanofibrils determined by inverse gas chromatography. J. Colloid Interface Sci. 2013, 405, 85–95. [Google Scholar] [CrossRef] [PubMed]
- Gamelas, J.A.F. The surface properties of cellulose and lignocellulosic materials assessed by inverse gas chromatography: A review. Cellulose 2013, 20, 2675–2693. [Google Scholar] [CrossRef]
- Legras, A.; Kondor, A.; Alcock, M.; Heitzmann, M.T.; Truss, R.W. Inverse gas chromatography for natural fibre characterisation: Dispersive and acid-base distribution profiles of the surface energy. Cellulose 2017, 24, 4691–4700. [Google Scholar] [CrossRef]
- Cordeiro, N.; Gouveia, C.; John, M.J. Investigation of surface properties of physicochemically modified natural fibres using inverse gas chromatography. Ind. Crops Prod. 2011, 33, 108–115. [Google Scholar] [CrossRef]
- Wang, Q.; Wang, Q. Determination of the Surface Thermodynamic Characteristics of Phthalate Plasticizers by Inverse Gas Chromatography. J. Chem. Eng. Data 2020, 65, 1869–1874. [Google Scholar] [CrossRef]
- Santos, J.M.R.C.A.; Guthrie, J.T. Lewis acid/base character and crystallisation properties of poly(butylene terephthalate). J. Chromatogr. A 2015, 1379, 92–99. [Google Scholar] [CrossRef]
- Panayiotou, C. Thermodynamic characterization of polymers. Polymer 2018, 136, 47–61. [Google Scholar] [CrossRef]
- Yampolskii, Y.; Belov, N. Investigation of Polymers by Inverse Gas Chromatography. Macromolecules 2015, 48, 6751–6767. [Google Scholar] [CrossRef]
- Hamieh, T.; Schultz, J. New approach to characterise physicochemical properties of solid substrates by inverse gas chromatography at infinite dilution: I. Some new methods to determine the surface areas of some molecules adsorbed on solid surfaces. J. Chromatogr. A 2002, 969, 17–47. [Google Scholar] [CrossRef] [PubMed]
- Gutmann, V. The Donor-Acceptor Approach to Molecular Interactions; Plenum: New York, NY, USA, 1978. [Google Scholar]
- Riddle, F.L.; Fowkes, F.M. Spectral shifts in acid-base chemistry. 1. Van der Waals contributions to acceptor numbers. J. Am. Chem. Soc. 1990, 112, 3259–3264. [Google Scholar] [CrossRef]
- Hamieh, T.; Nardin, M.; Rageul-Lescouët, M.; Haïdara, H.; Schultz, J. Study of acid-base interactions between some metallic oxides and model organic molecules. Colloids Surf. A Physicochem. Eng. Asp. 1997, 125, 155–161. [Google Scholar] [CrossRef]
- Hamieh, T.; Schultz, J. Study of the adsorption of n-alkanes on polyethylene surface—State equations, molecule areas and covered surface fraction. Comptes Rendus L’acad. Sci. Sér. IIb 1996, 323, 281–289. [Google Scholar]
- Lide, D.R. (Ed.) CRC Handbook of Chemistry and Physics, 87th ed.; Internet Version 2007; Taylor and Francis: Boca Raton, FL, USA, 2007. [Google Scholar] [CrossRef]
- Hamieh, T. Study of the temperature effect on the acid-base properties of cellulose acrylate by inverse gas chromatography at infinite dilution. J. Chromatogr. A 2018, 1568, 168–176. [Google Scholar] [CrossRef]
- Van Oss, C.J.; Good, R.J.; Chaudhury, M.K. Additive and nonadditive surface tension components and the interpretation of contact angles. Langmuir 1988, 4, 884–891. [Google Scholar] [CrossRef]
Disclaimer/Publisher’s Note: The statements, opinions and data contained in all publications are solely those of the individual author(s) and contributor(s) and not of MDPI and/or the editor(s). MDPI and/or the editor(s) disclaim responsibility for any injury to people or property resulting from any ideas, methods, instructions or products referred to in the content. |
© 2024 by the author. Licensee MDPI, Basel, Switzerland. This article is an open access article distributed under the terms and conditions of the Creative Commons Attribution (CC BY) license (https://creativecommons.org/licenses/by/4.0/).

