

Diatom-Inspired Structural Adaptation According to Mode Shapes: A Study on 3D Structures and Software Tools

Abstract
1. Introduction
2. Materials and Methods
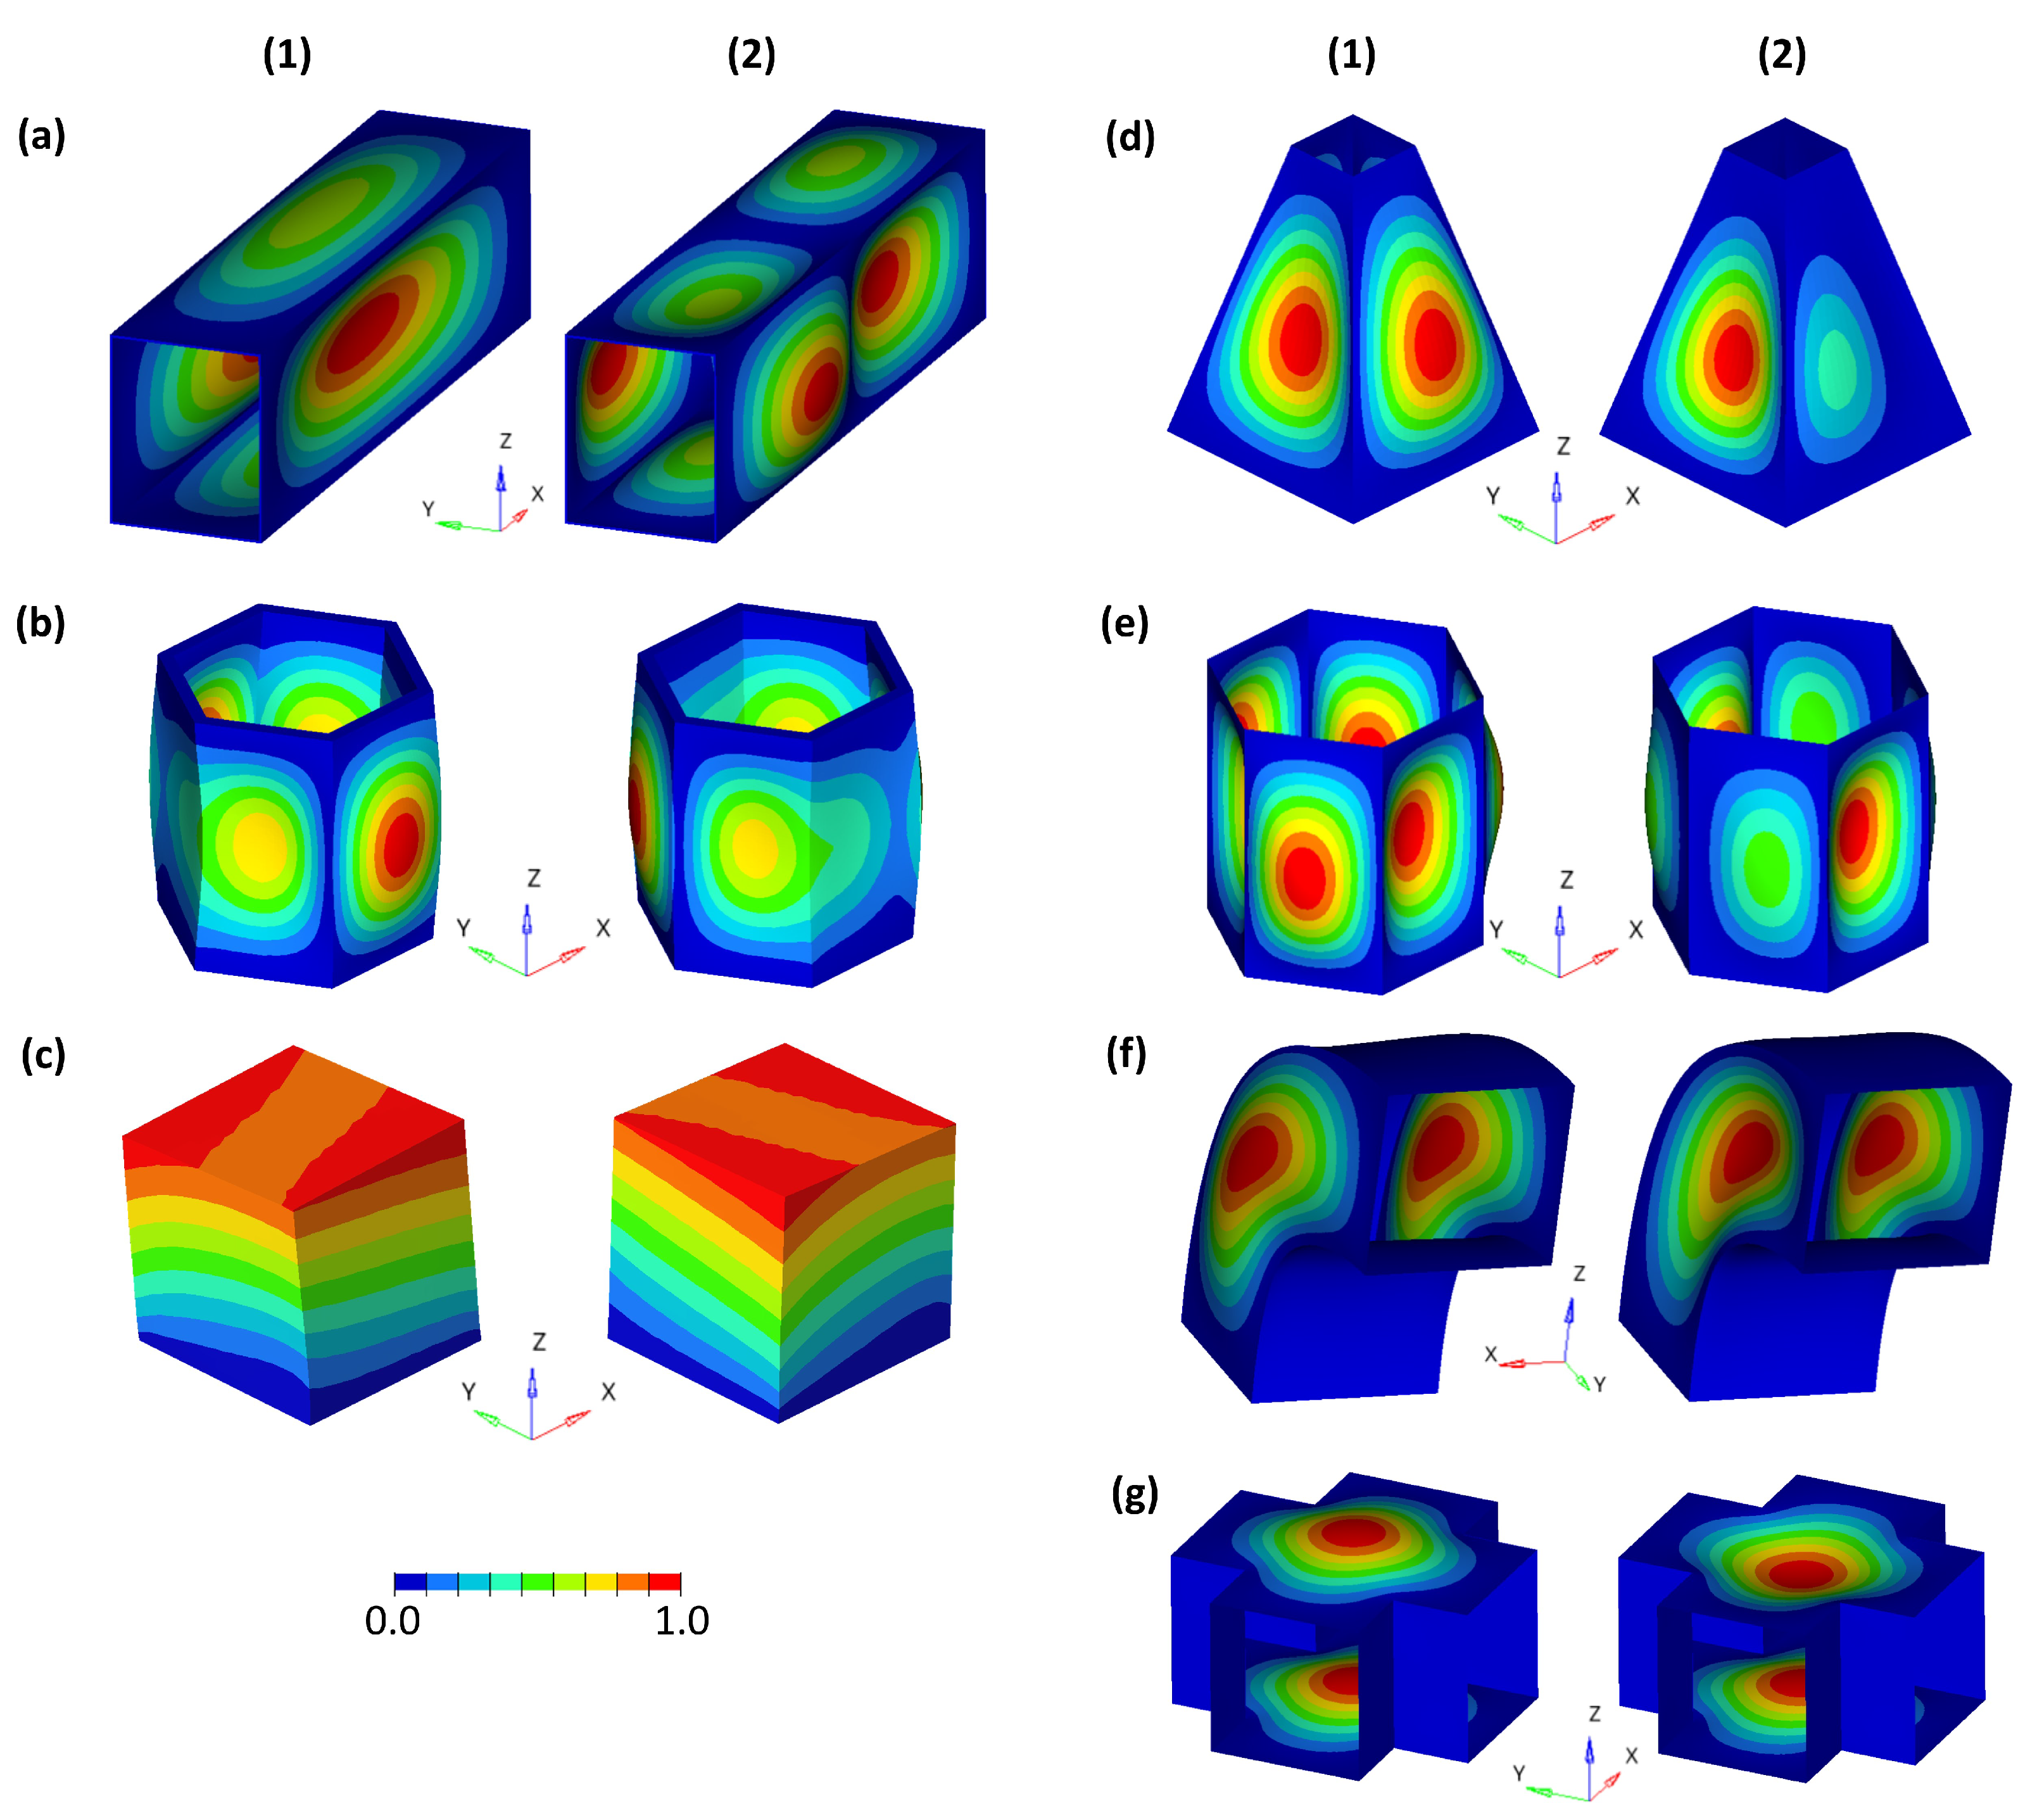
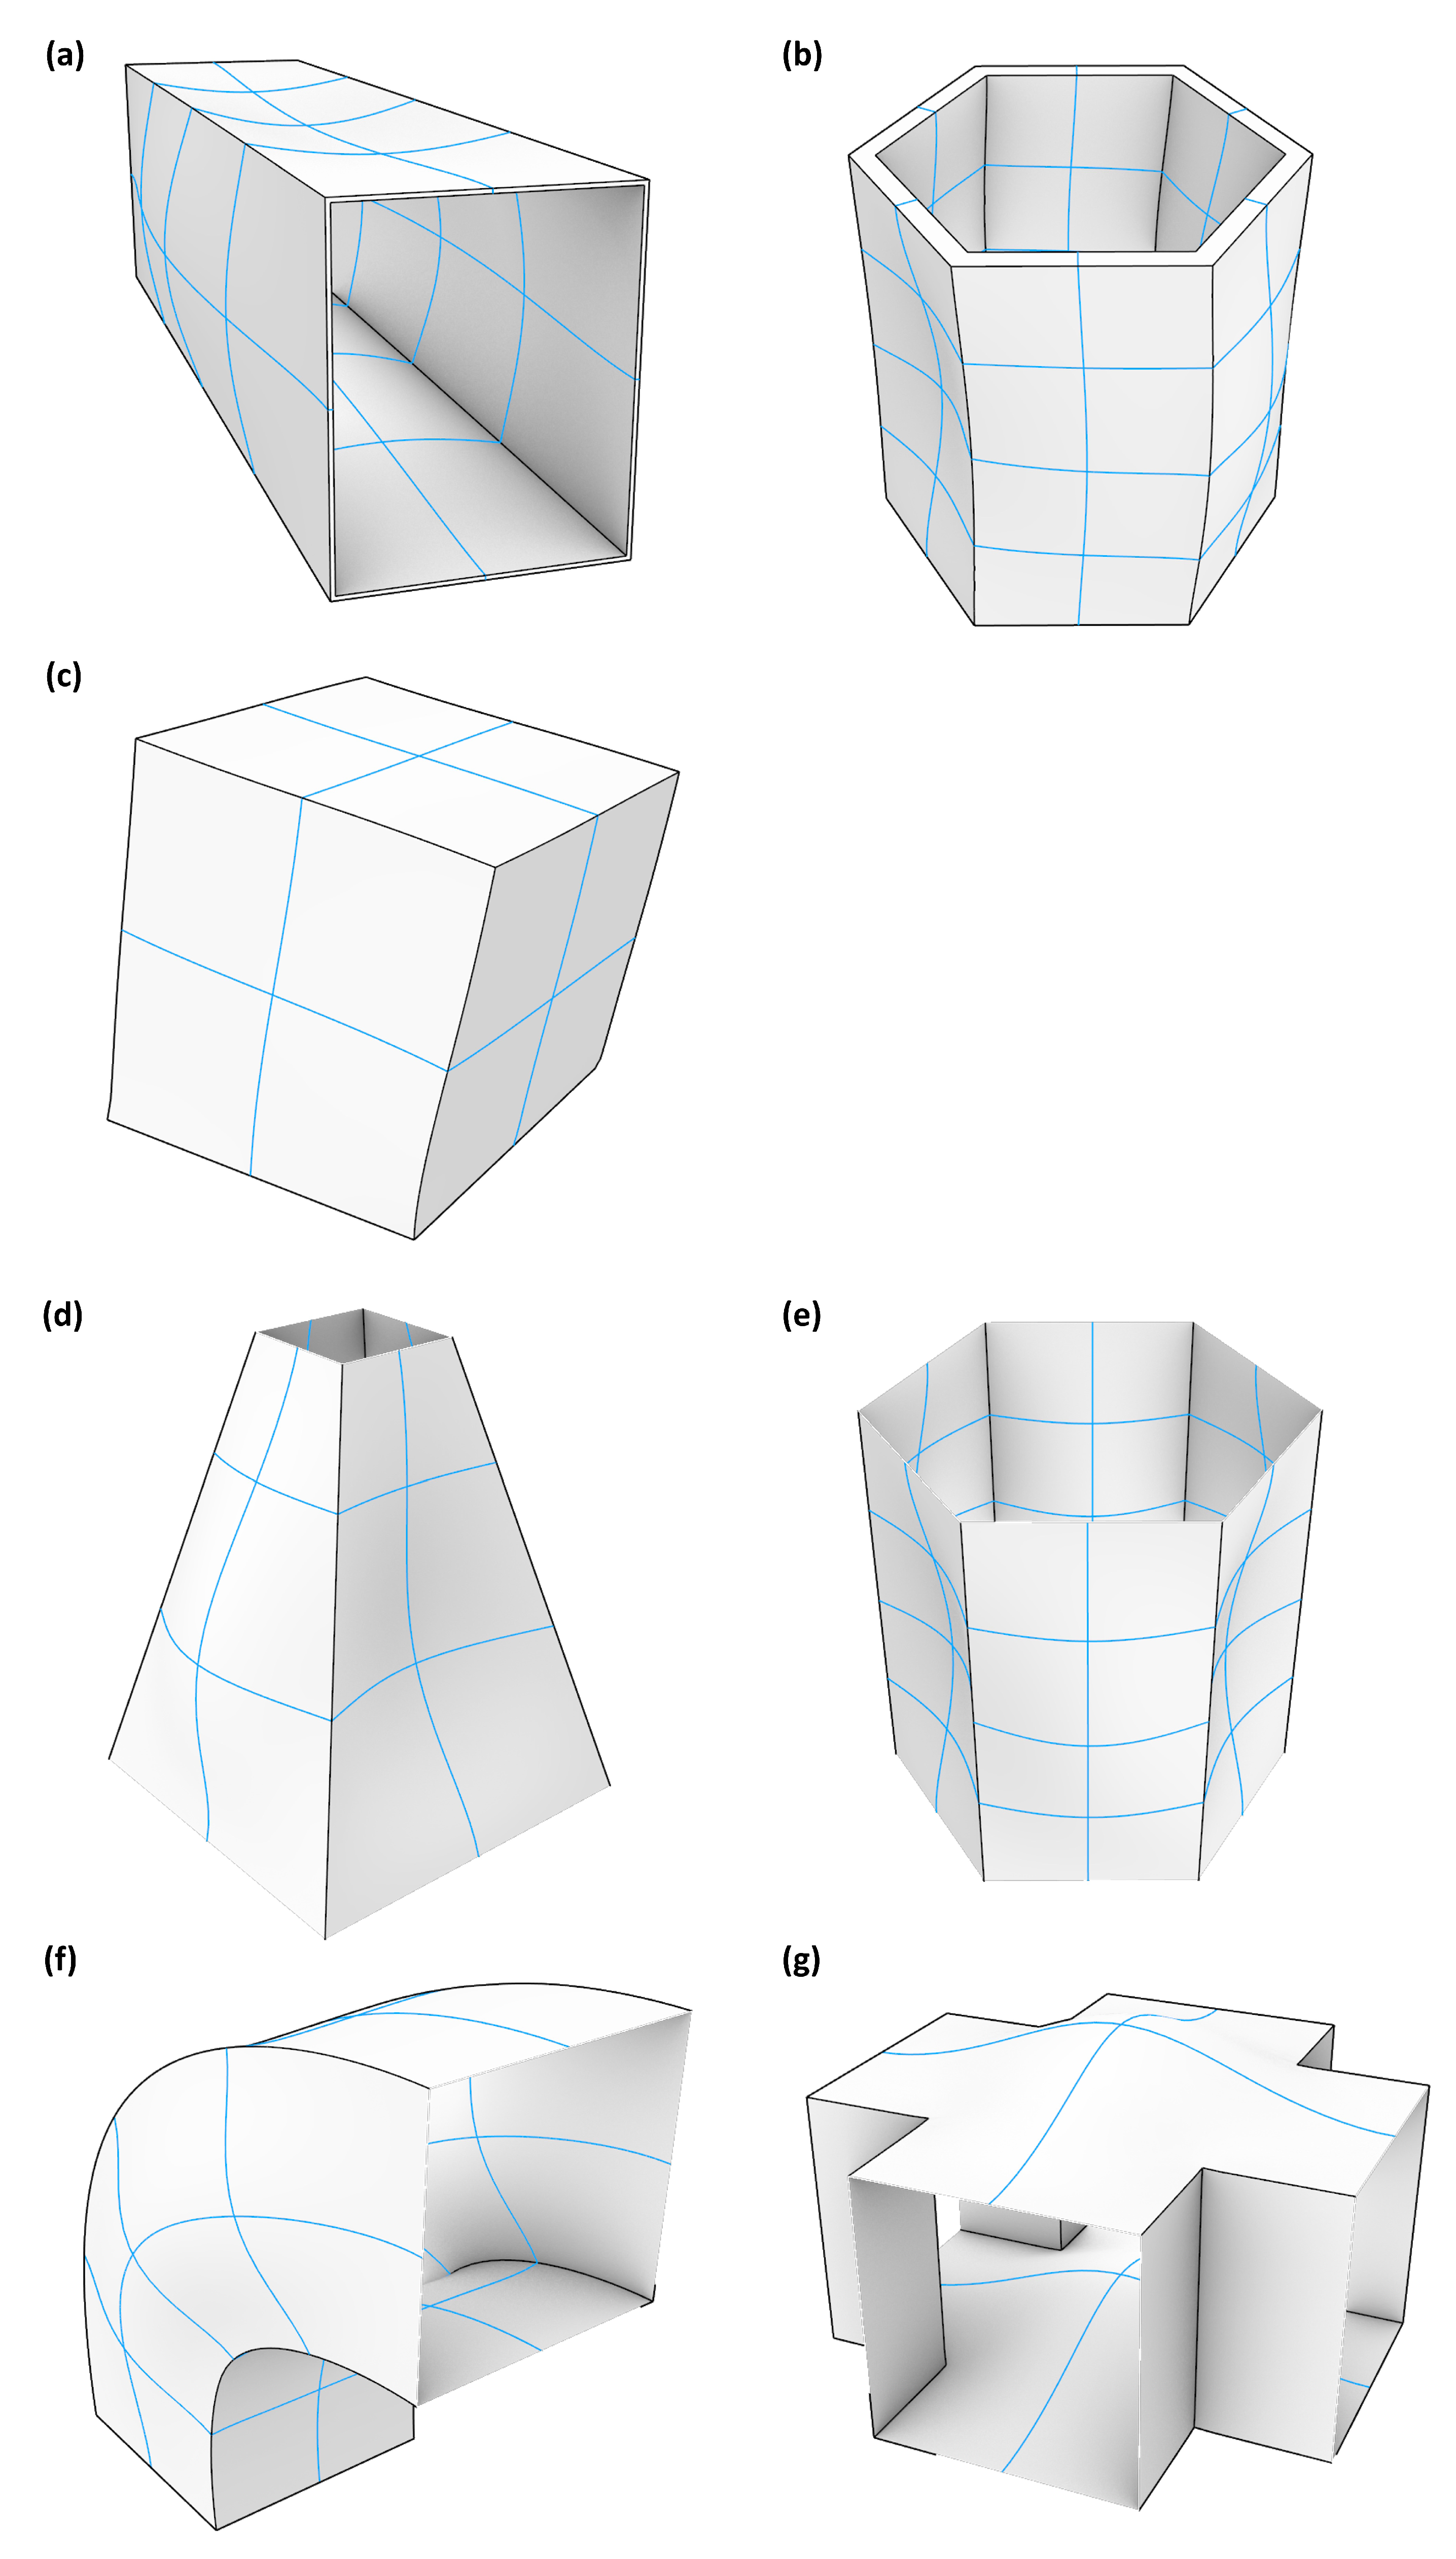
2.1. Bio-Inspired Mode Shape Adaptation of 3D Structures
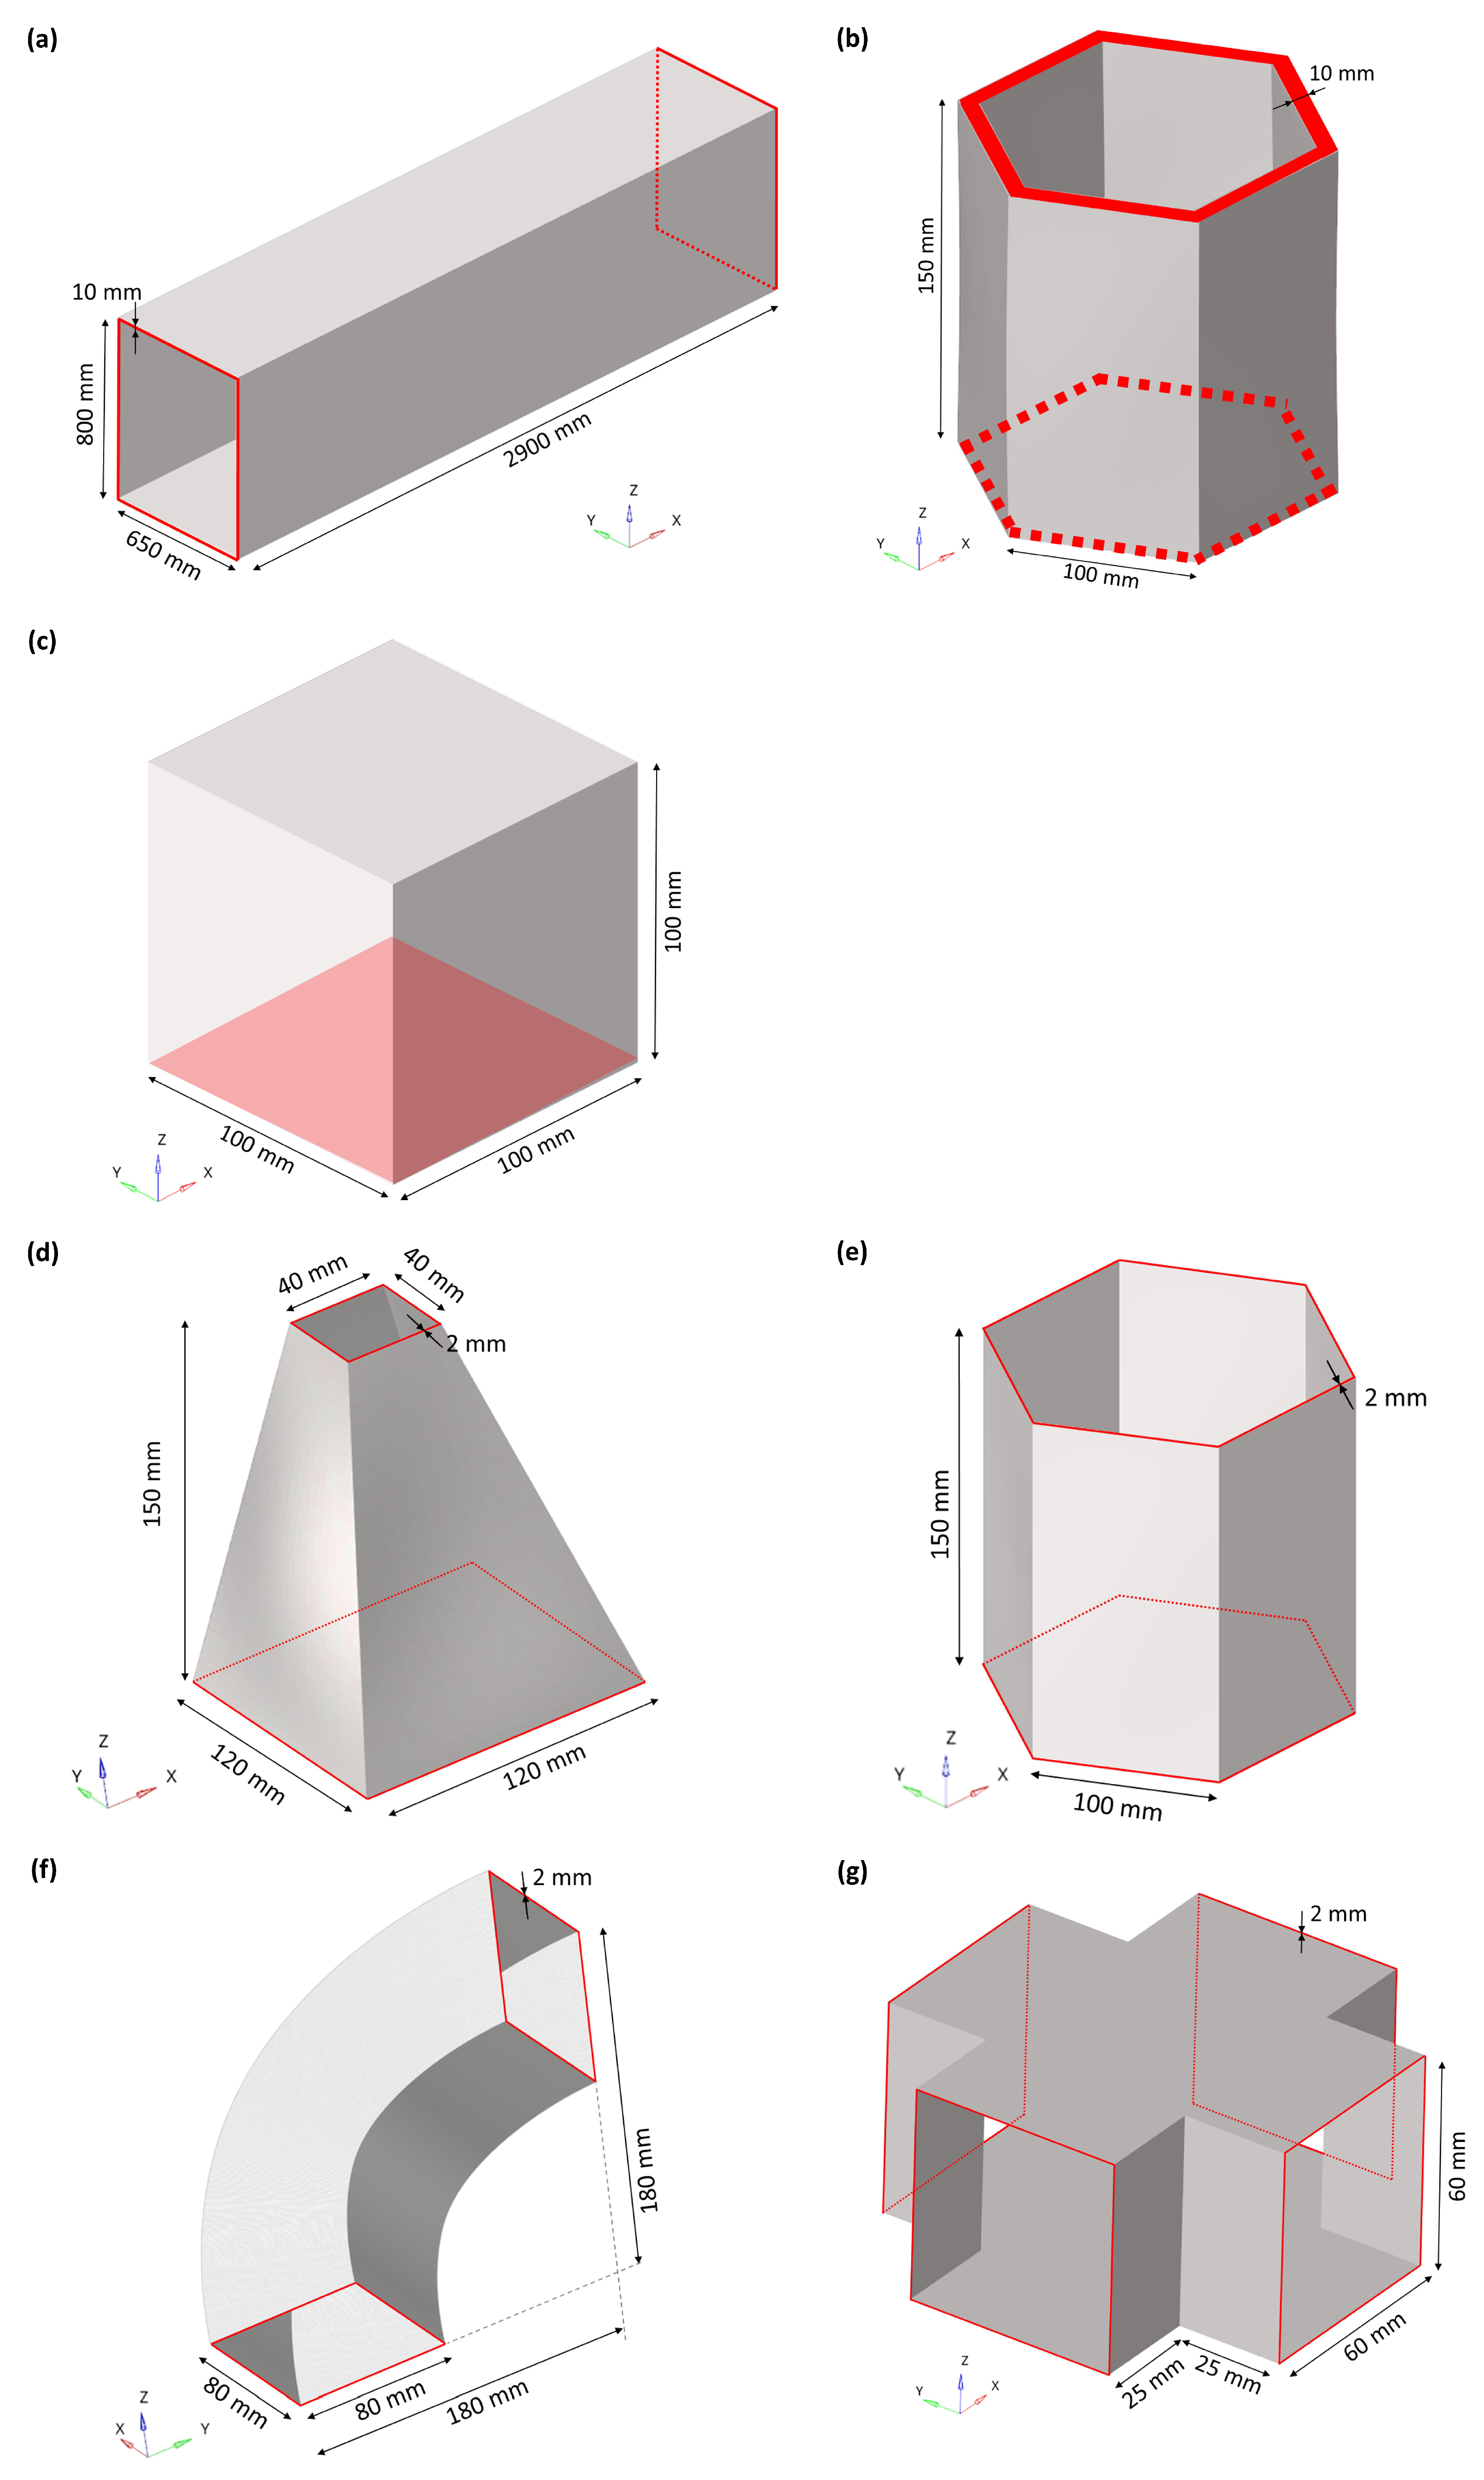
- Hollow cuboid: 0 mm to 150 mm in steps of 15 mm;
- Thick hexagonal prism: 0 mm to 5 mm in steps of 1 mm, and 5 mm to 25 mm in steps of 5 mm;
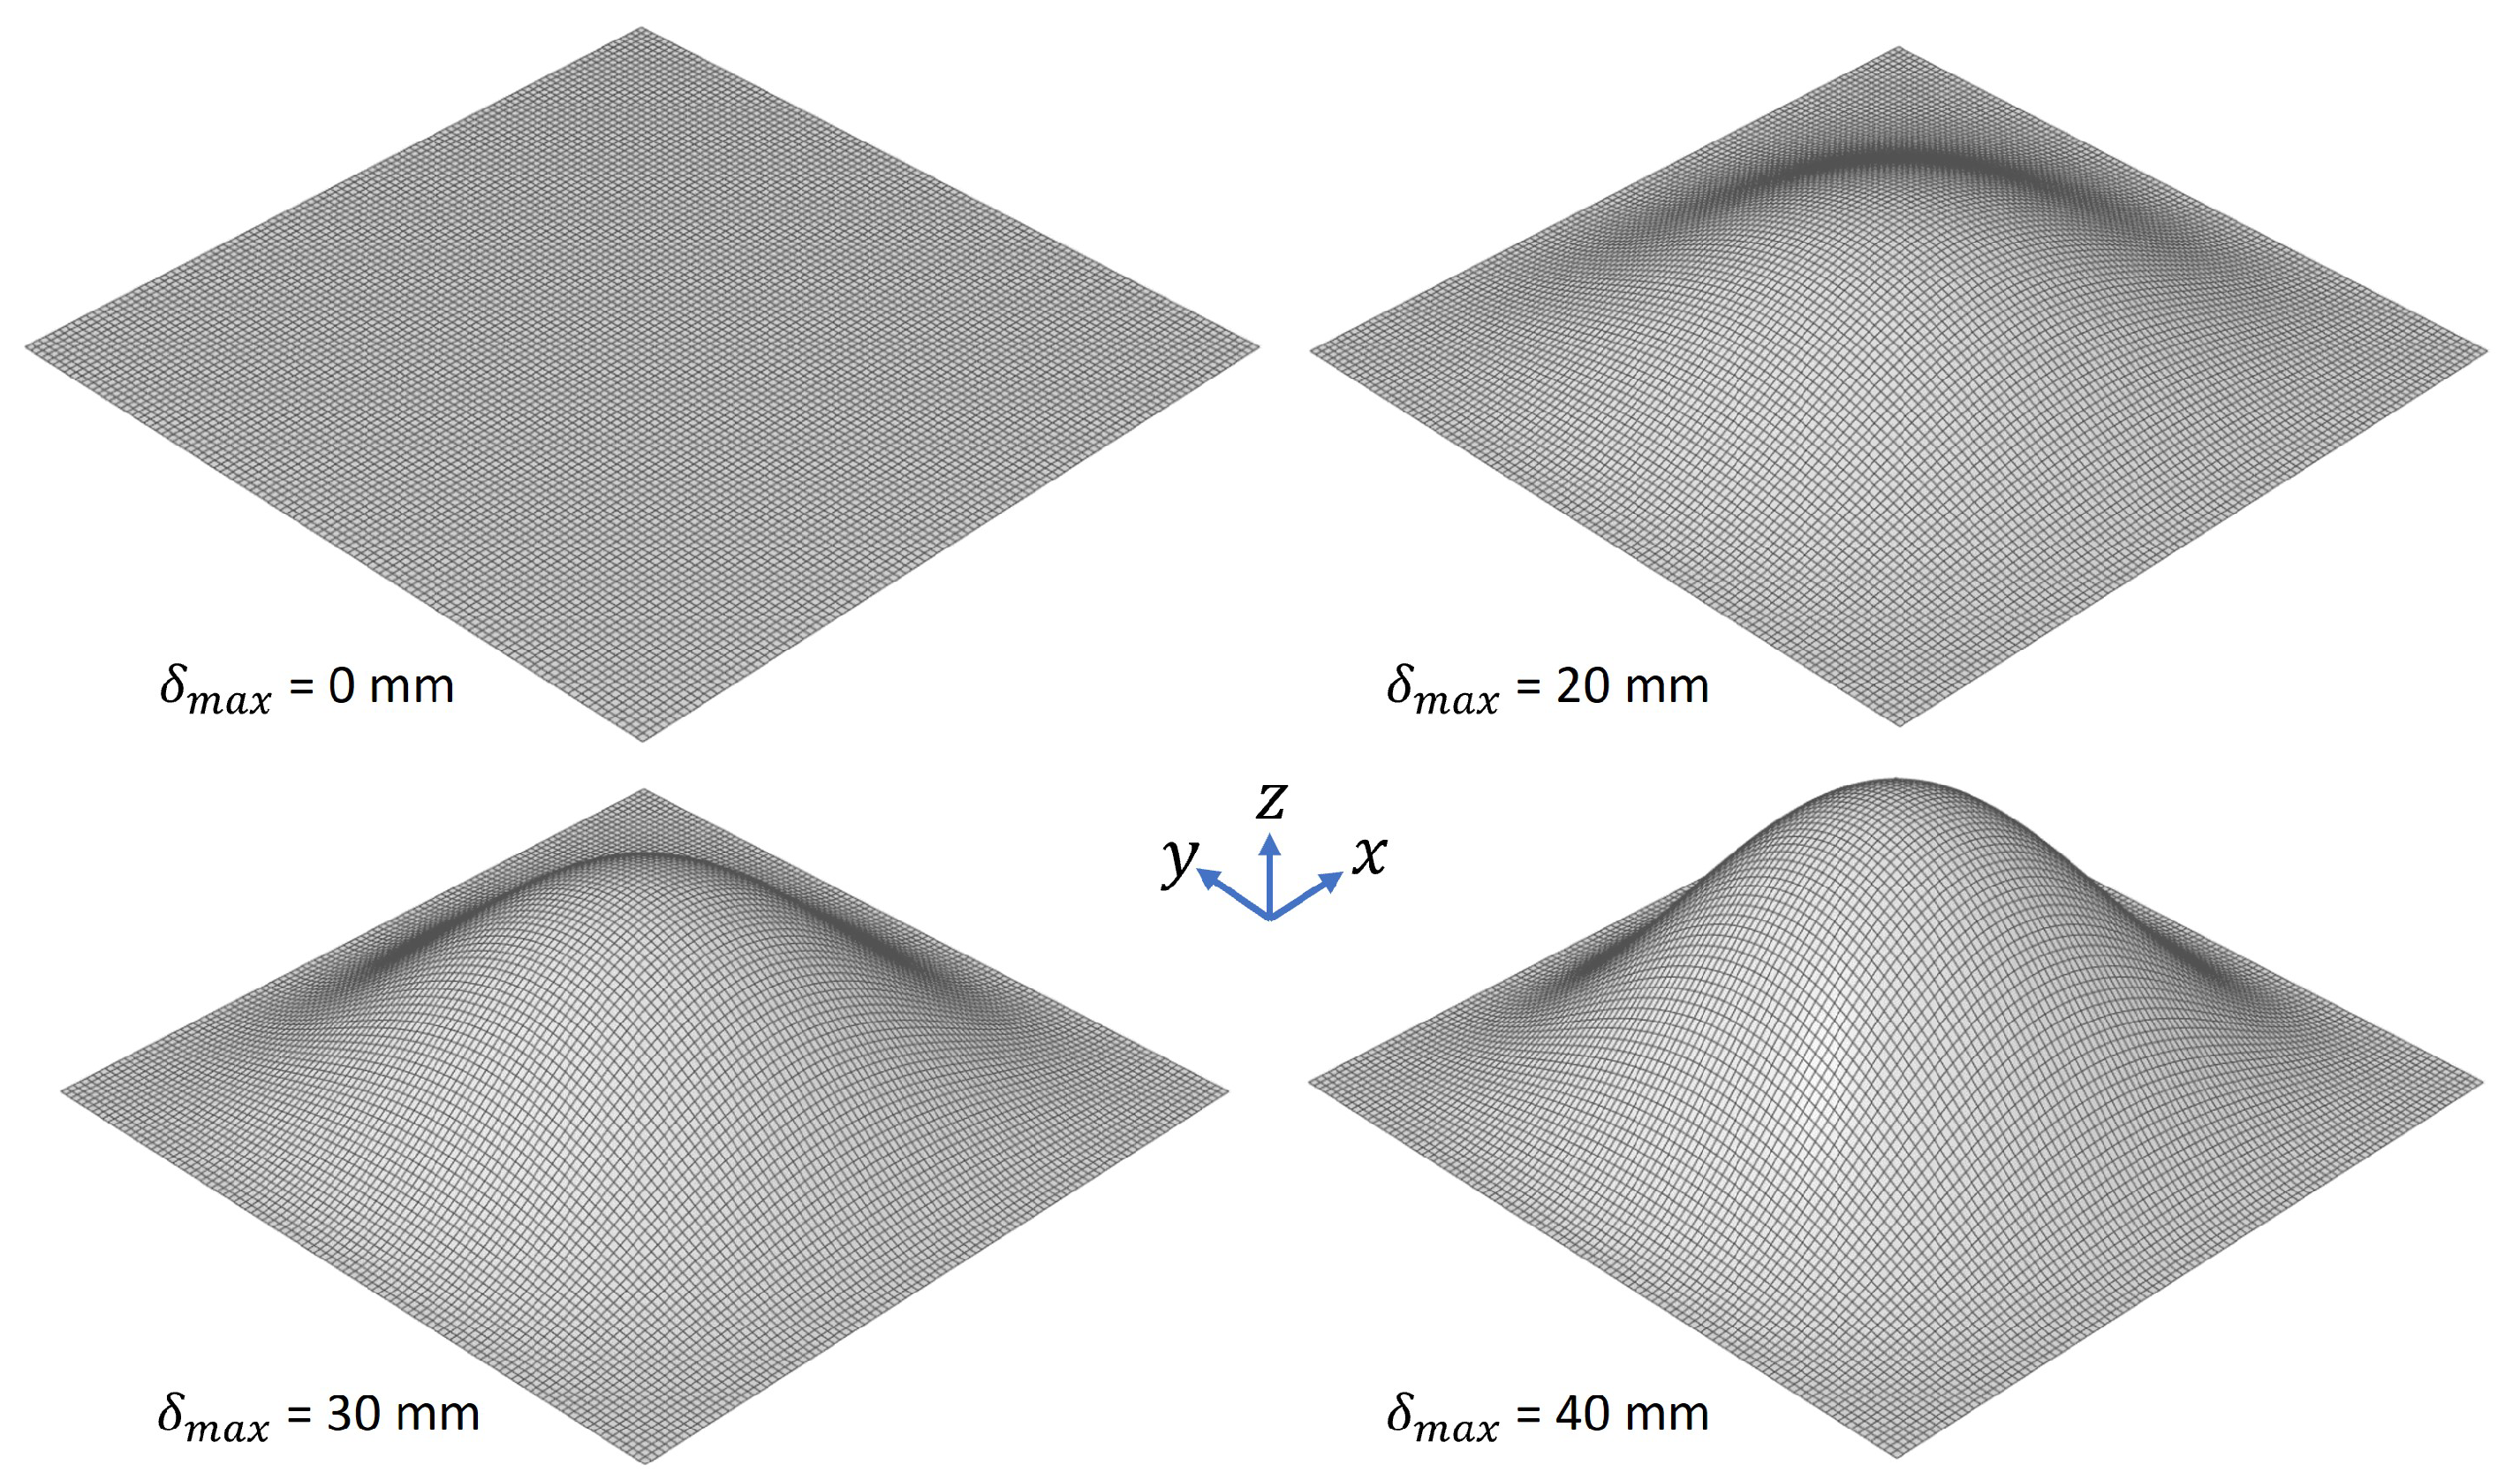
- Cube: 0 mm to 5 mm in steps of 1 mm, and 5 mm to 30 mm in steps of 5 mm.
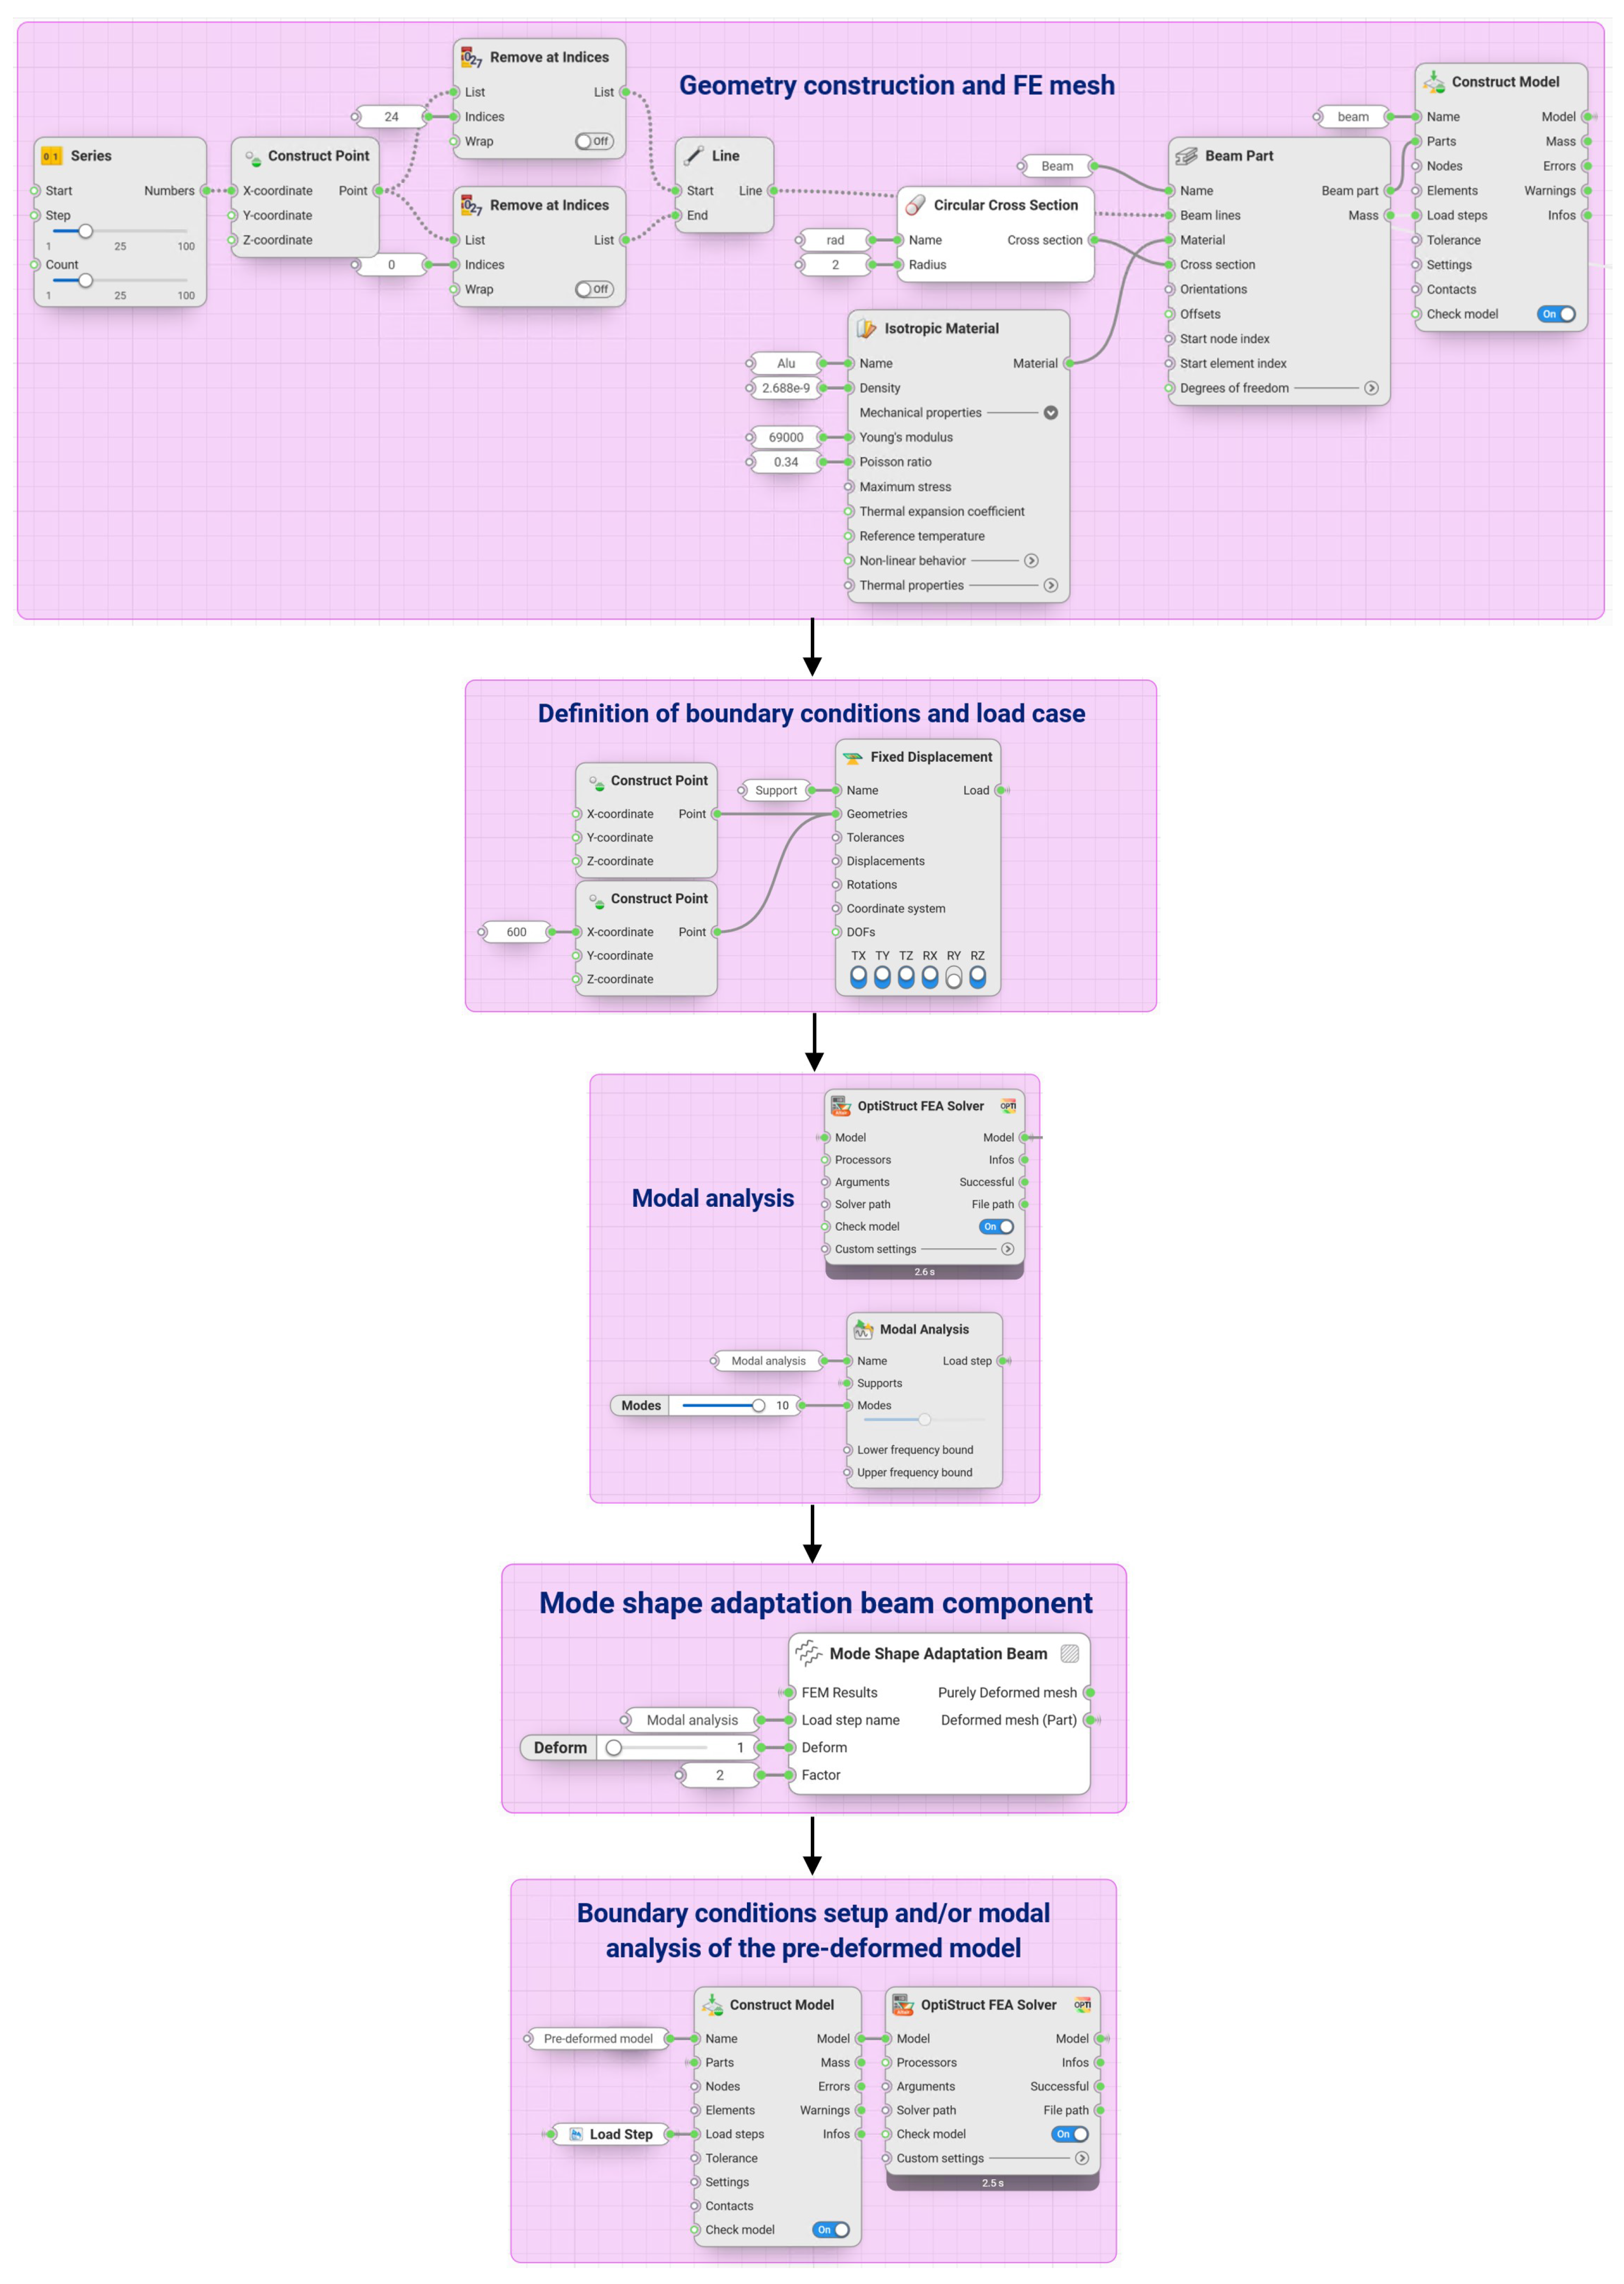
2.2. Integration of the Bio-Inspired Adaptation Method into a Low-Code Software
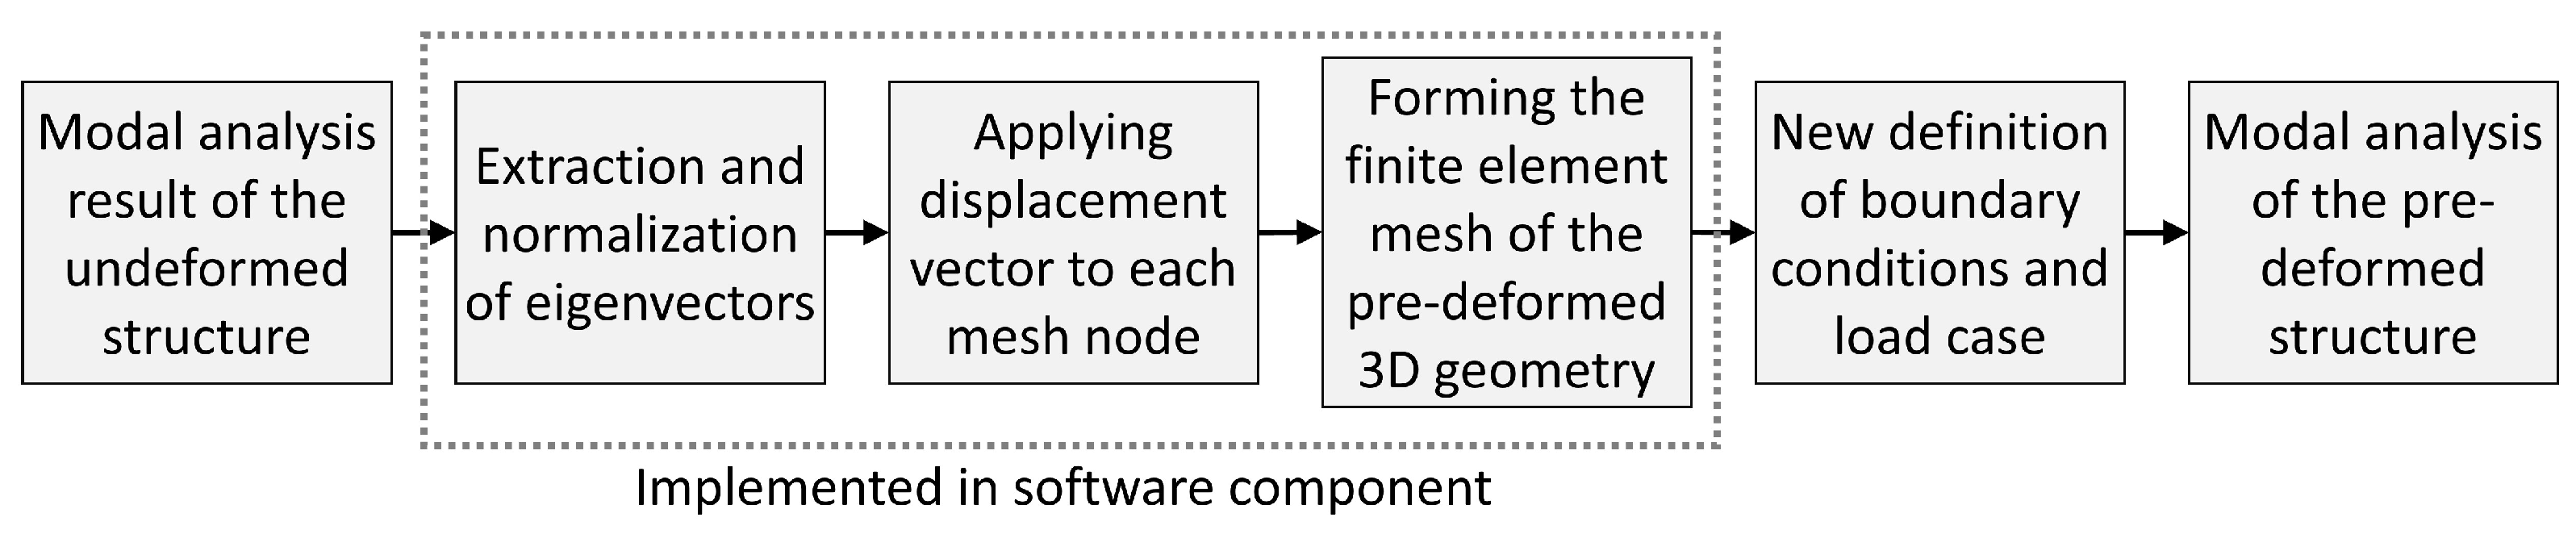
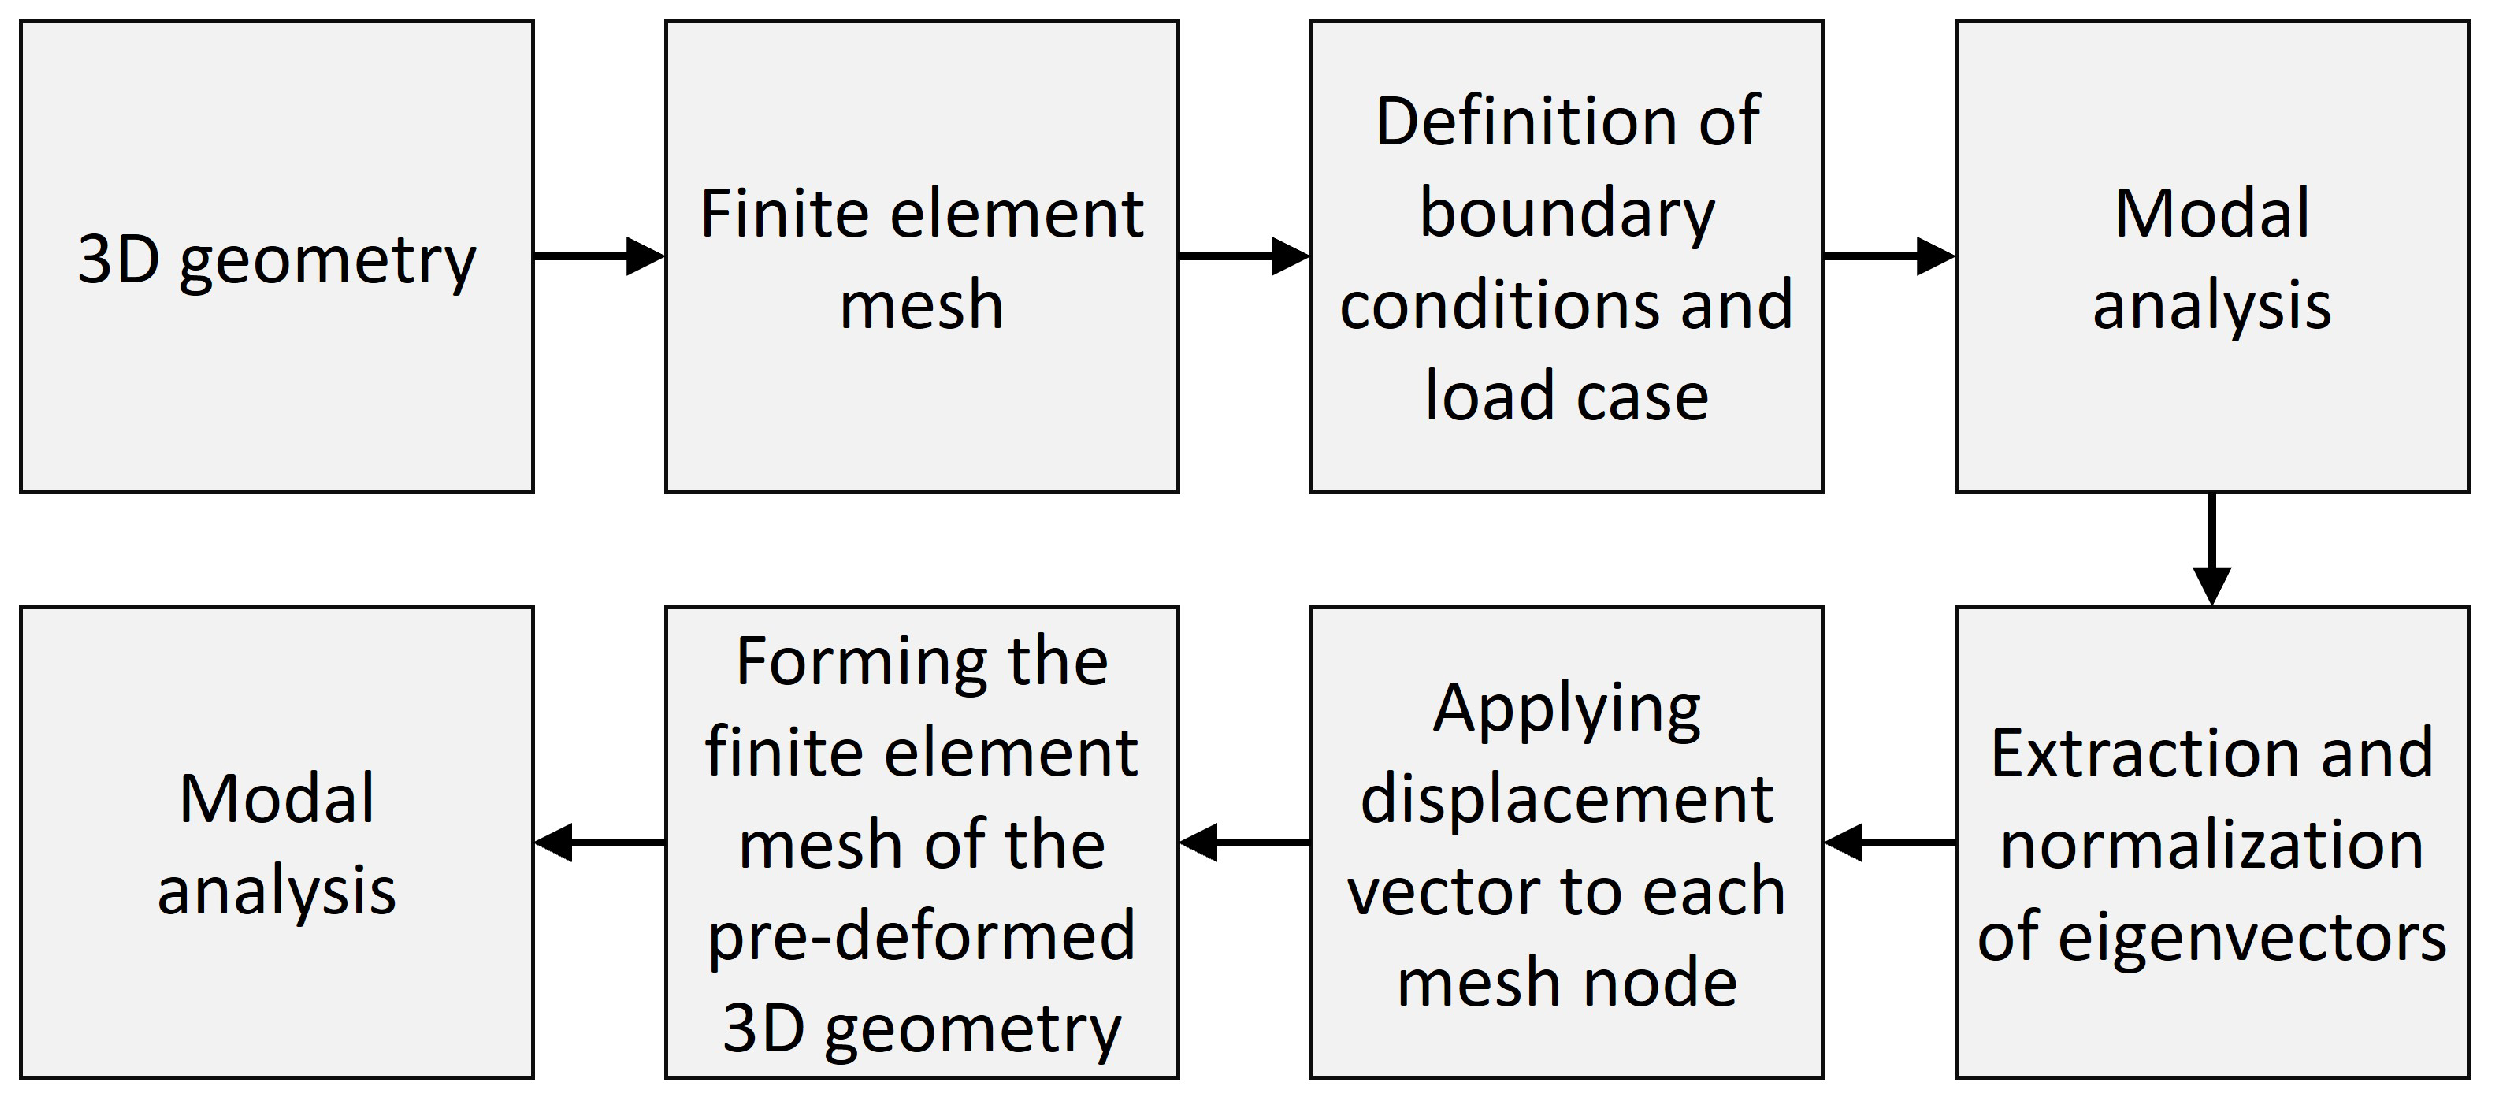
2.2.1. Automatization of the Mode Shape Adaptation Method
2.2.2. Validation of the Created Software Components
- (i)
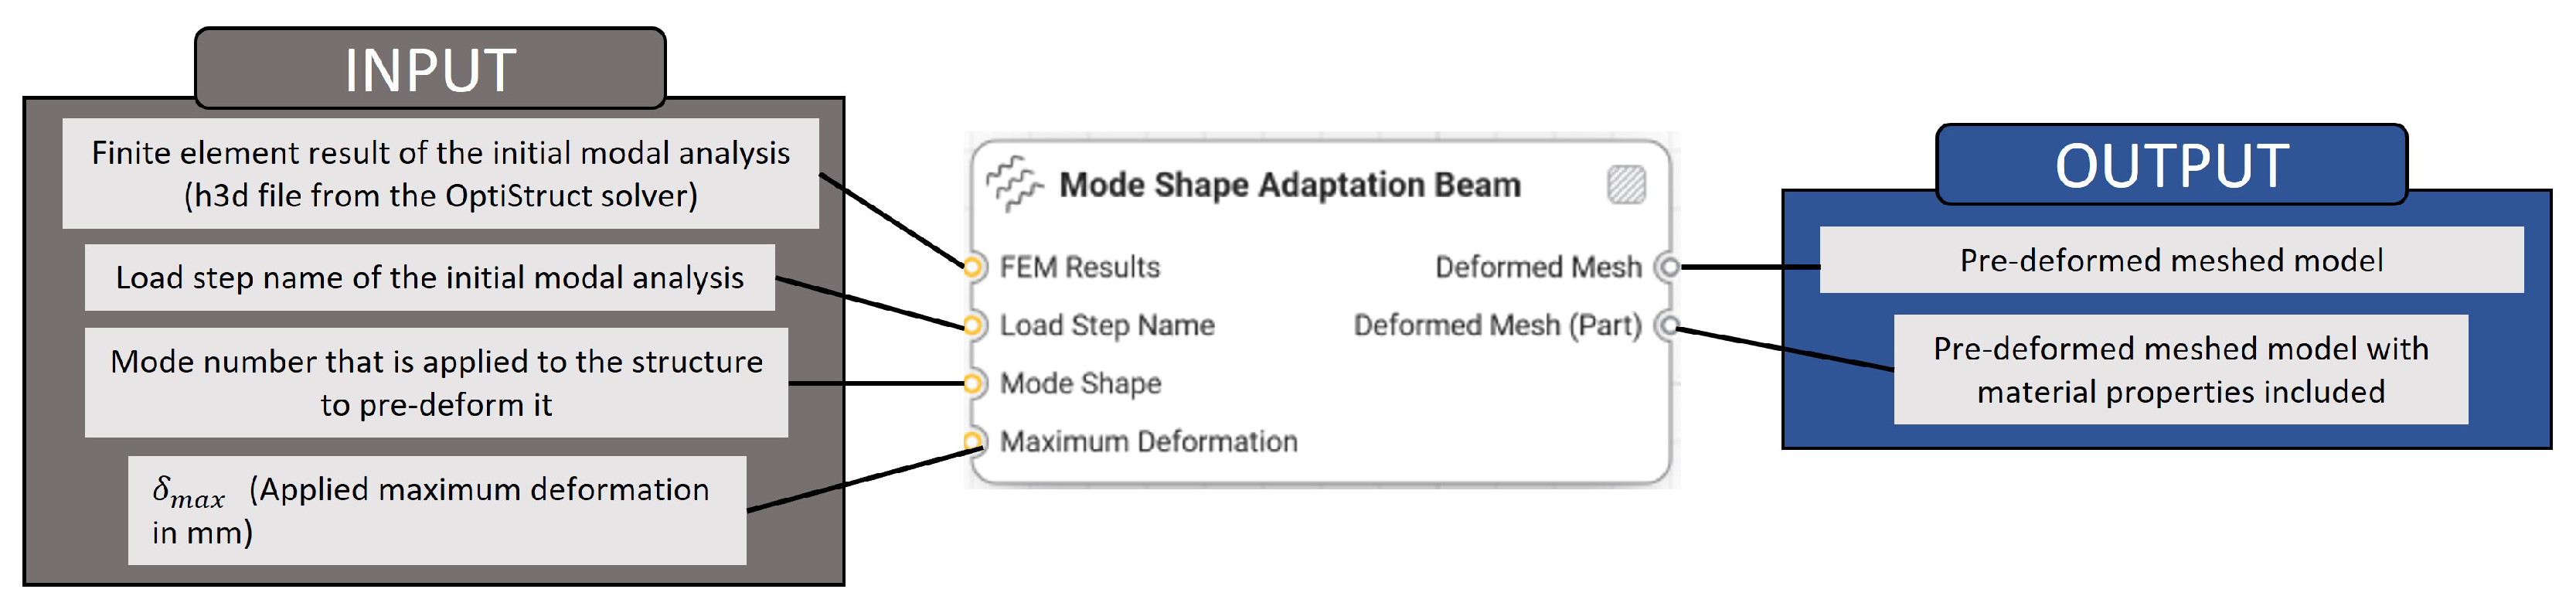
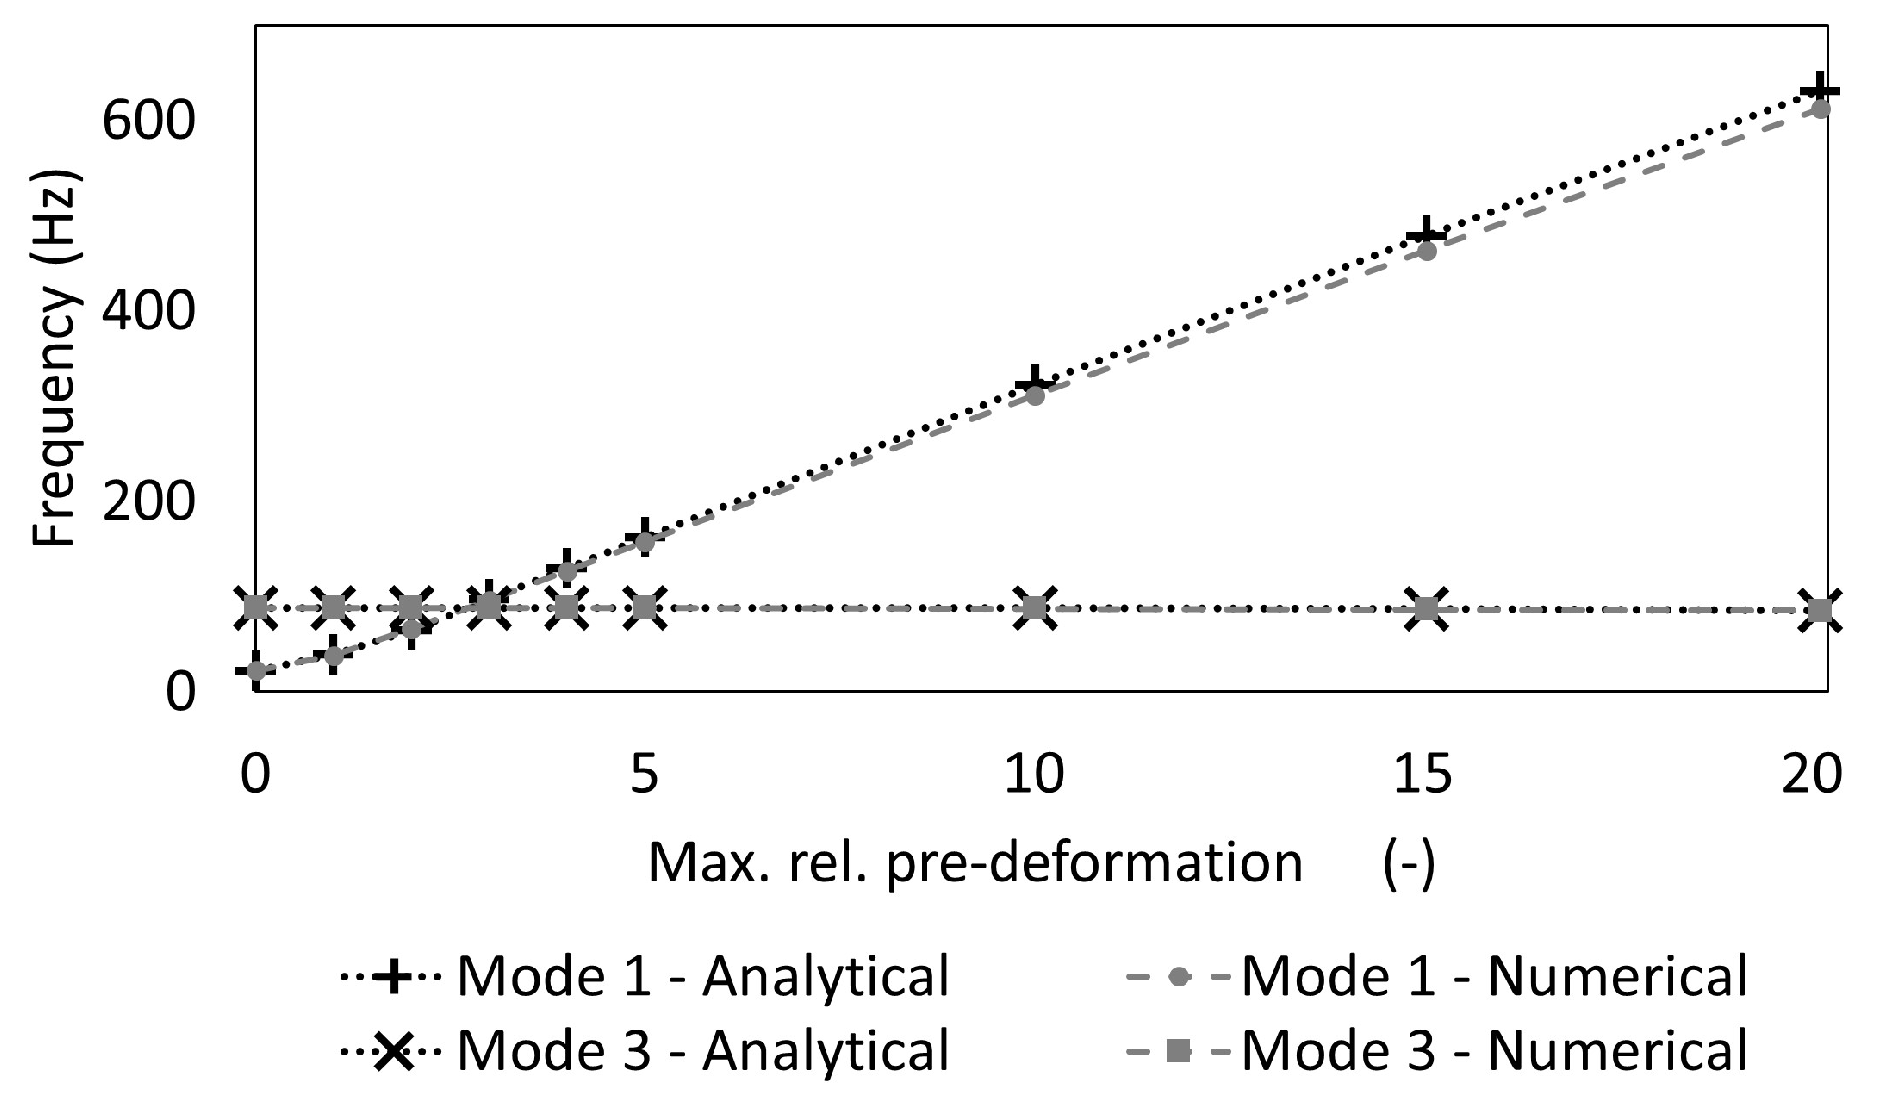
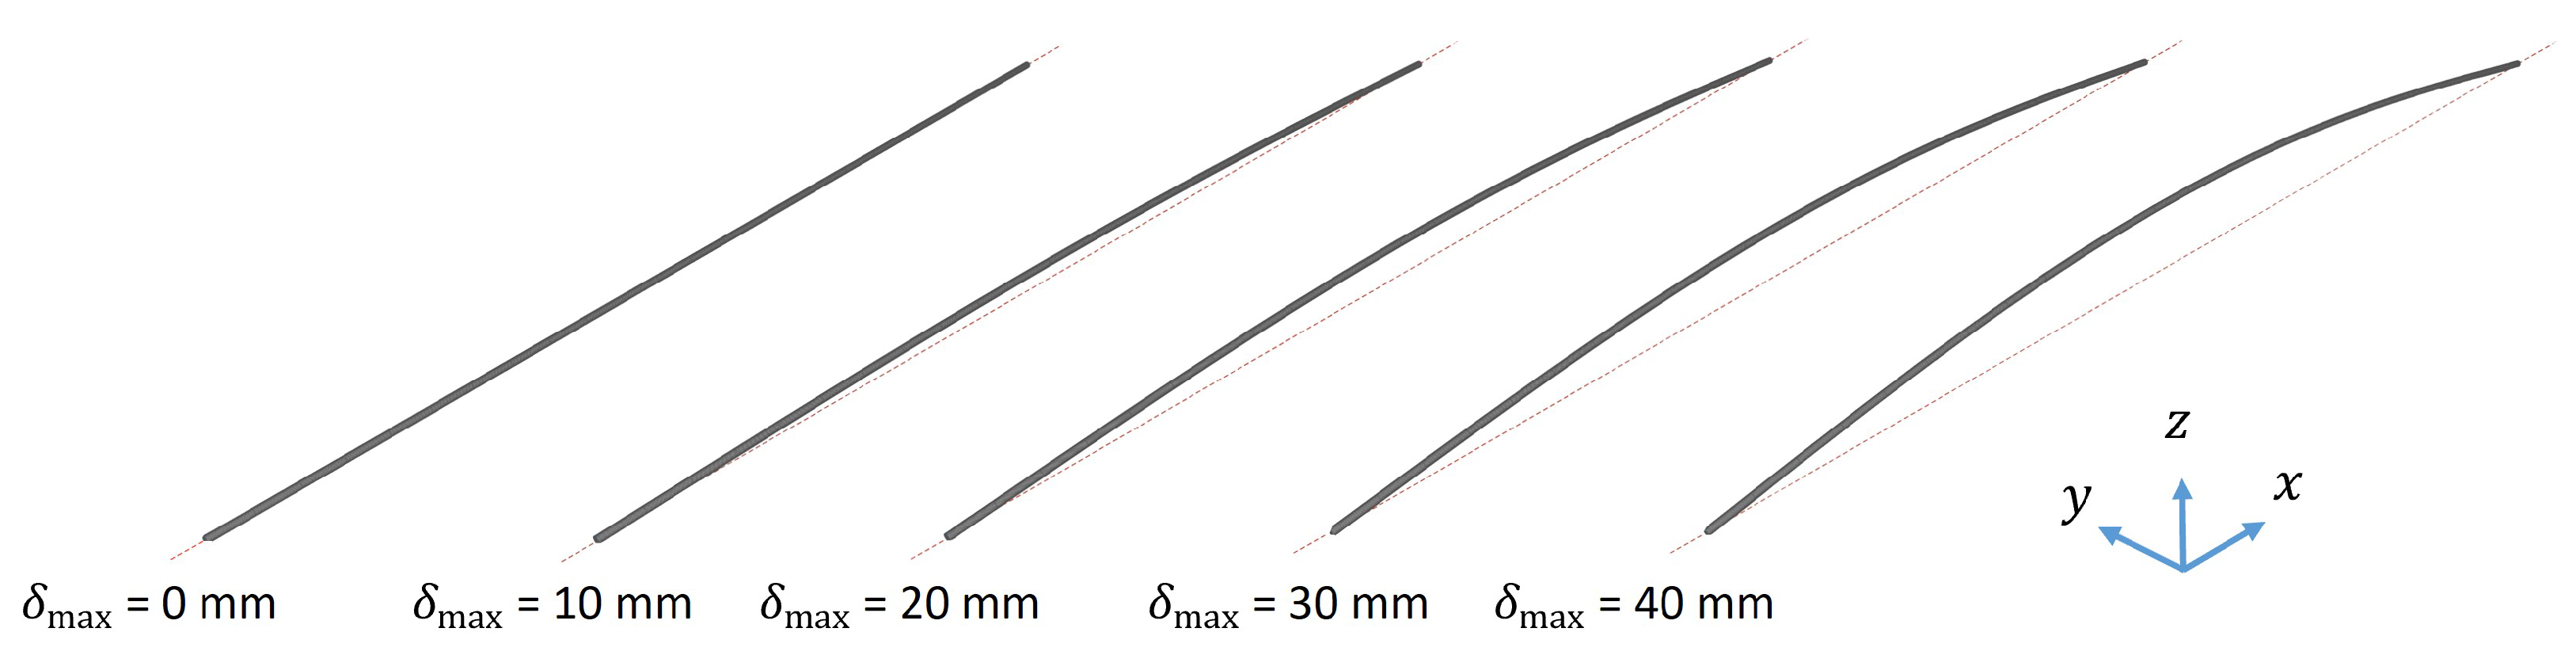
- Mode Shape Adaptation of Beam Components
- (ii)
- Mode Shape Adaptation of Shell Components
- (iii)
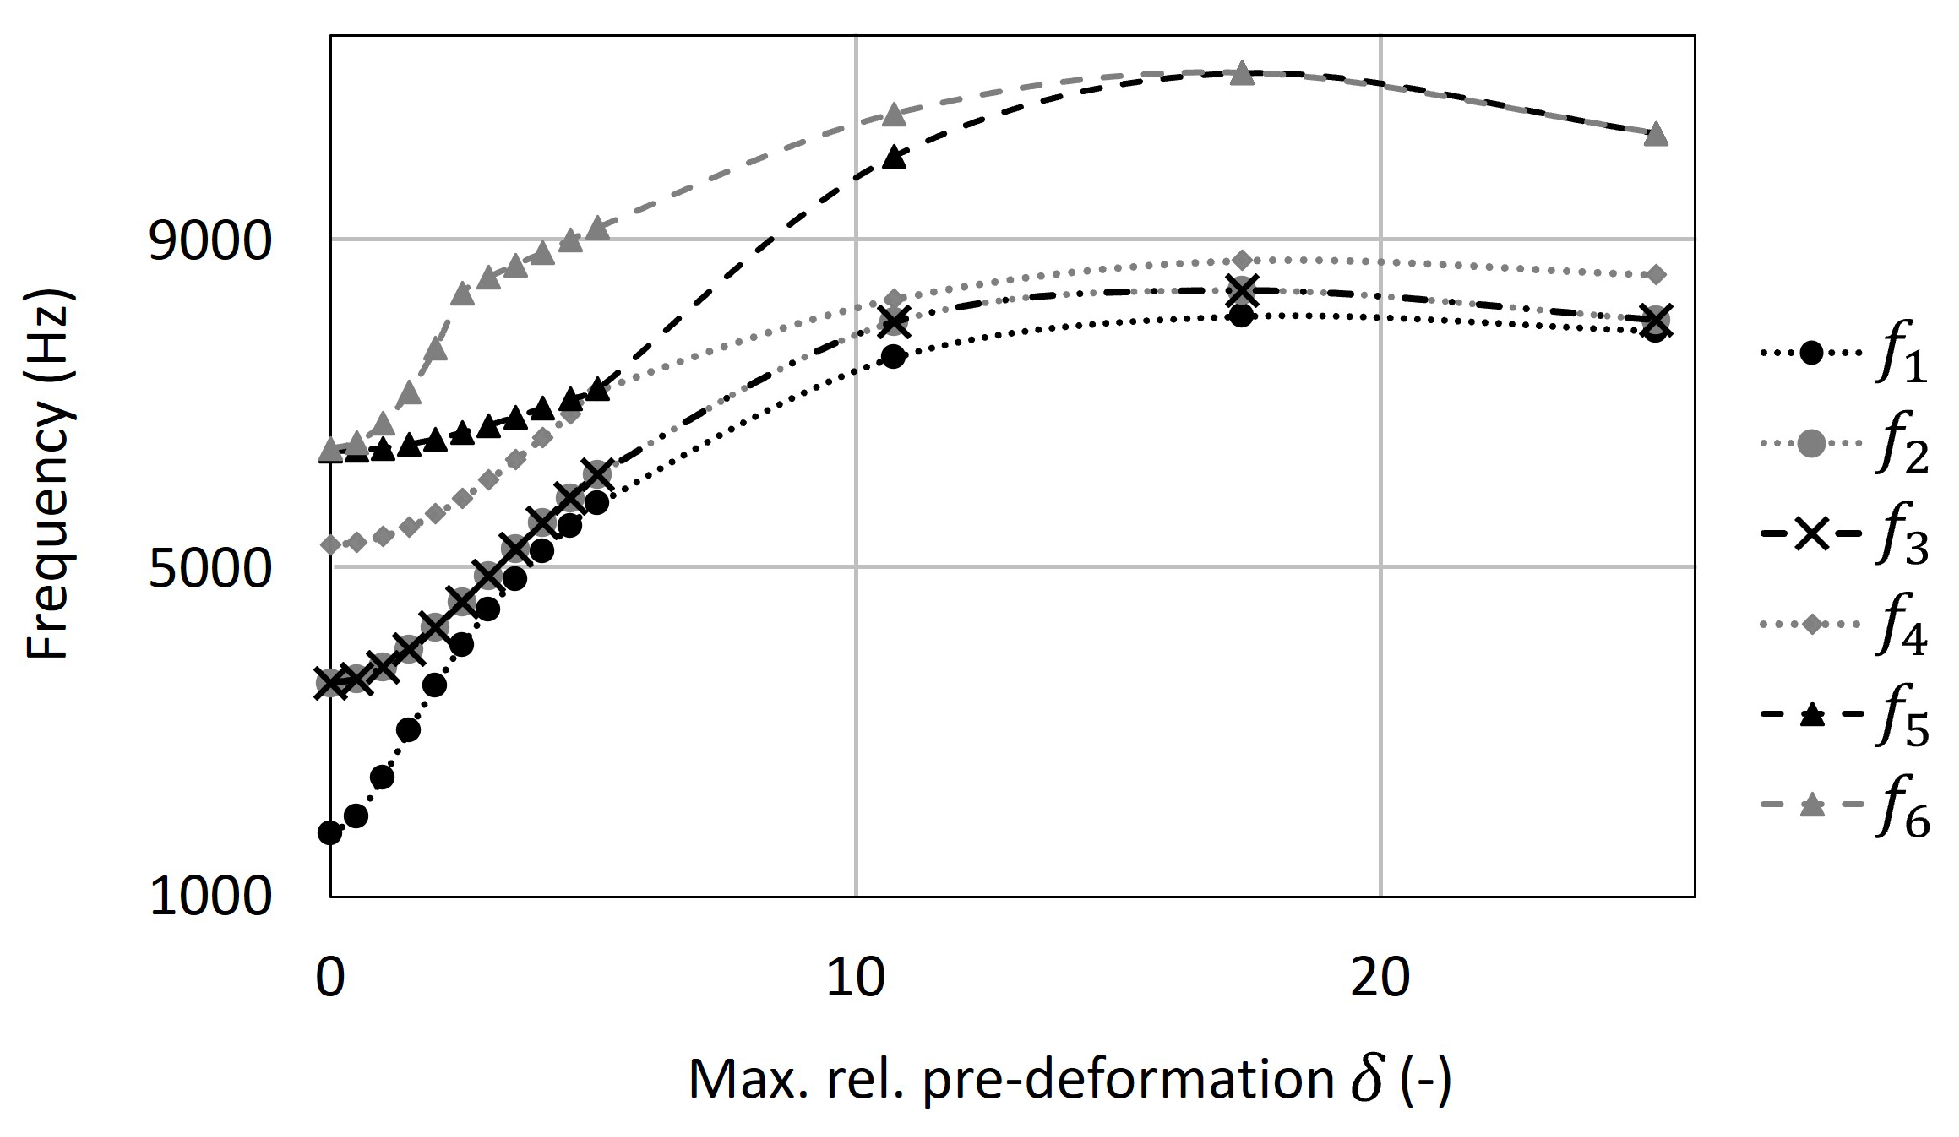
- Mode Shape Adaptation of Solid Components
3. Results
3.1. Bio-Inspired Mode Shape Adaptation of 3D Structures
3.2. Integration of the Bio-Inspired Adaptation Method into a Low-Code Software
- (i)
- Mode Shape Adaptation of Beam Components
- (ii)
- Mode Shape Adaptation of Shell Components
- (iii)
- Mode Shape Adaptation of Solid Components
4. Discussion
4.1. Bio-Inspired Mode Shape Adaptation of 3D Structures
4.2. Integration of the Bio-Inspired Adaptation Method into a Low-Code Software
5. Conclusions
Supplementary Materials
Author Contributions
Funding
Data Availability Statement
Acknowledgments
Conflicts of Interest
References
- De Stefano, L.; De Stefano, M.; De Tommasi, E.; Rea, I.; Rendina, I. A natural source of porous biosilica for nanotech applications: The diatoms microalgae. Phys. Status Solidi C 2010, 8, 1820–1825. [Google Scholar] [CrossRef]
- Round, F.; Crawford, R.; Mann, D. Diatoms: Biology and Morphology of the Genera; Cambridge University Press: Cambridge, UK, 1990. [Google Scholar]
- Guiry, M.D. How many species of algae are there? J. Phycol. 2012, 48, 1057–1063. [Google Scholar] [CrossRef] [PubMed]
- Mann, D.G.; Droop, S. Biodiversity, biogeography and conservation of diatoms. In Biogeography of Freshwater Algae, Proceedings of the Workshop on Biogeography of Freshwater Algae, Held During the Fifth International Phycological Congress, Qingdao, China, 25 June–l July 1994; Springer: Berlin, Germany, 1996; pp. 19–32. [Google Scholar] [CrossRef]
- Maier, M. Entwicklung Einer Systematischen Vorgehensweise für Bionischen Leichtbau. Ph.D. Thesis, University of Bremen, Bremen, Germany, 2015. [Google Scholar]
- Friedrichs, L. Biomechanics of Diatom Frustules—Techniques and Ecological Implications. Ph.D. Thesis, University of Bremen, Bremen, Germany, 2014. [Google Scholar]
- Hamm, C.; Merkel, R.; Springer, O.; Jurkojc, P.; Maier, C.; Prechtel, K.; Smetacek, V. Architecture and material properties of diatom shells provide effective mechanical protection. Nature 2003, 421, 841–843. [Google Scholar] [CrossRef] [PubMed]
- Hamm, C. The evolution of advanced mechanical defenses and potential technological applications of diatom shells. J. Nanosci. Nanotechnol. 2005, 5, 108–119. [Google Scholar] [CrossRef] [PubMed]
- Hamm, C.; Smetacek, V. Armor: Why, when, and how. In Evolution of Primary Producers in the Sea; Falkowski, P., Knoll, A., Eds.; Elsevier: Amsterdam, The Netherlands, 2007; pp. 311–332. [Google Scholar] [CrossRef]
- Losic, D.; Rosengarten, G.; Mitchell, J.; Voelcker, N. Pore architecture of diatom frustules: Potential nanostructured membranes for molecular and particle separations. J. Nanosci. Nanotechnol. 2006, 6, 982–989. [Google Scholar] [CrossRef] [PubMed]
- Diaz Moreno, M.; Ma, K.; Schoenung, J.; Dávila, L. An integrated approach for probing the structure and mechanical properties of diatoms: Toward engineered nanotemplates. Acta Biomater. 2015, 25, 313–324. [Google Scholar] [CrossRef] [PubMed]
- Gutiérrez, A.; Gordon, R.; Dávila, L. Deformation modes and structural response of diatom frustules. J. Mater. Sci. Eng. Adv. Technol. 2017, 15, 105–134. [Google Scholar] [CrossRef]
- Yang, J.; Lin, G.S.; Mou, C.Y.; Tung, K.L. Diatom-mimicking ultrahigh-flux mesoporous silica thin membrane with straight-through channels for selective protein and nanoparticle separations. Chem. Mater. 2019, 31, 1745–1751. [Google Scholar] [CrossRef]
- Terracciano, M.; De Stefano, L.; Rea, I. Diatoms green nanotechnology for biosilica-based drug delivery systems. Pharmaceutics 2018, 10, 242. [Google Scholar] [CrossRef]
- Hundertmark, C.; Tinter, R.; Ortelt, M.; Hauser, M. Diatom-inspired plastic deformation elements for energy absorption in automobiles. J. Bionic Eng. 2015, 12, 613–623. [Google Scholar] [CrossRef]
- De Stefano, L.; Rendina, I.; De Stefano, M.; Bismuto, A.; Maddalena, P. Marine diatoms as optical chemical sensors. Appl. Phys. Lett. 2005, 87, 233902. [Google Scholar] [CrossRef]
- Heinrichs, A.; Siegel, D.; Frank, P.; Bomke, P.; Naguschweski, R.; Frank, M. Bionische Entwicklung einer additiv gefertigten A-Säulen-Verstärkung. In Karosseriebautage Hamburg 2017; Springer: Bremen, Germany, 2017; pp. 43–56. [Google Scholar] [CrossRef]
- Maier, M.; Siegel, D.; Thoben, K.D.; Niebuhr, N.; Hamm, C. Transfer of natural micro structures to bionic lightweight design proposals. J. Bionic Eng. 2013, 10, 469–478. [Google Scholar] [CrossRef]
- Andresen, S.; Meyners, N.; Thoden, D.; Körfer, M.; Hamm, C. Biologically Inspired Girder Structure for the Synchrotron Radiation Facility PETRA IV. J. Bionic Eng. 2023, 20, 1–22. [Google Scholar] [CrossRef]
- Koehl, M.; Strickier, J.R. Copepod feeding currents: Food capture at low Reynolds number 1. Limnol. Oceanogr. 1981, 26, 1062–1073. [Google Scholar] [CrossRef]
- Andresen, S.; Linnemann, S.K.; Ahmad Basri, A.B.; Savysko, O.; Hamm, C. Natural Frequencies of Diatom Shells: Alteration of Eigenfrequencies Using Structural Patterns Inspired by Diatoms. Biomimetics 2024, 9, 85. [Google Scholar] [CrossRef]
- Abdusatorov, B.; Salimon, A.I.; Bedoshvili, Y.D.; Likhoshway, Y.V.; Korsunsky, A.M. FEM exploration of the potential of silica diatom frustules for vibrational MEMS applications. Sensors Actuators A Phys. 2020, 315, 112270. [Google Scholar] [CrossRef]
- Cvjetinovic, J.; Luchkin, S.Y.; Perevoschikov, S.; Davidovich, N.A.; Salimon, A.I.; Bedoshvili, Y.D.; Somov, P.A.; Lagoudakis, P.; Korsunsky, A.M.; Gorin, D.A. Probing vibrational eigenmodes in diatom frustules via combined in silico computational study and atomic force microscopy experimentation. Appl. Phys. Lett. 2023, 123, 184101. [Google Scholar] [CrossRef]
- Pohl, G.; Nachtigall, W. Biomimetics for Architecture & Design. Nature-Analogies- Technology; Springer International Publishing: Cham, Switzerland, 2015. [Google Scholar] [CrossRef]
- Andresen, S.; Bäger, A.; Hamm, C. Eigenfrequency maximisation by using irregular lattice structures. J. Sound Vib. 2020, 465, 115027. [Google Scholar] [CrossRef]
- Yang, J.S.; Ma, L.; Schmidt, R.; Qi, G.; Schröder, K.U.; Xiong, J.; Wu, L.Z. Hybrid lightweight composite pyramidal truss sandwich panels with high damping and stiffness efficiency. Compos. Struct. 2016, 148, 85–96. [Google Scholar] [CrossRef]
- Ehrig, T.; Holeczek, K.; Kostka, P. Experimental investigations of lightweight structures with fluidically actuated Compressible Constrained Layer Damping. Mater. Today Commun. 2018, 16, 204–211. [Google Scholar] [CrossRef]
- Tang, X.; Yan, X. A review on the damping properties of fiber reinforced polymer composites. J. Ind. Text. 2020, 49, 693–721. [Google Scholar] [CrossRef]
- Zhang, W.; Xu, J. Advanced lightweight materials for Automobiles: A review. Mater. Des. 2022, 221, 110994. [Google Scholar] [CrossRef]
- Oltmann, J.; Hartwich, T.; Krause, D. Optimizing lightweight structures with particle damping using frequency based substructuring. Des. Sci. 2020, 6, e17. [Google Scholar] [CrossRef]
- Díaz, A.; Kikuchi, N. Solutions to shape and topology eigenvalue optimization problems using a homogenization method. Int. J. Numer. Methods Eng. 1992, 35, 1487–1502. [Google Scholar] [CrossRef]
- Du, J.; Olhoff, N. Topological design of freely vibrating continuum structures for maximum values of simple and multiple eigenfrequencies and frequency gaps. Struct. Multidiscip. Optim. 2007, 34, 91–110. [Google Scholar] [CrossRef]
- Pedersen, P.; Pedersen, N. An optimality criterion for shape optimization in eigenfrequency problems. Struct. Multidiscip. Optim. 2005, 29, 457–469. [Google Scholar] [CrossRef]
- Stanford, B.; Beran, P.; Bhatia, M. Aeroelastic topology optimization of blade-stiffened panels. J. Aircr. 2014, 51, 938–944. [Google Scholar] [CrossRef]
- Bendsøe, M.; Sigmund, O. Topology Optimization. Theory, Methods, and Applications, 2nd ed.; Springer: Berlin/Heidelberg; New York, NY, USA, 2004. [Google Scholar] [CrossRef]
- Da Silva, G.; Nicoletti, R. Optimization of natural frequencies of a slender beam shaped in a linear combination of its mode shapes. J. Sound Vib. 2017, 397, 92–107. [Google Scholar] [CrossRef]
- Andresen, S.; Lottes, L.M.; Linnemann, S.K.; Kienzler, R. Shape adaptation of beams (1D) and plates (2D) to maximise eigenfrequencies. Adv. Mech. Eng. 2020, 12. [Google Scholar] [CrossRef]
- Fredö, S.; Hedlund, A. NVH Optimization Of Truck Cab Floor Panel Embossing Pattern. SAE Tech. Pap. 2005, 2005-01-2342. [Google Scholar] [CrossRef]
- Schmitz, T.; Smith, K. Mechanical Vibrations. Modeling and Measurement; Springer: New York, NY, USA, 2012. [Google Scholar] [CrossRef]
- Beards, C. Structural Vibration: Analysis and Damping; John Wiley & Sons Inc.: New York, NY, USA; Toronto, ON, Canada, 1996. [Google Scholar]
- Den Hartog, J. The lowest natural frequency of circular arcs. London Edinburgh Dublin Philos. Mag. J. Sci. 1928, 5, 400–408. [Google Scholar] [CrossRef]


| Hollow Cuboid | Thick Hexagonal Prism | Cube | Truncated Pyramid | Thin Hexagonal Prism | Curved Rectangular Duct | Connector Square | |
|---|---|---|---|---|---|---|---|
| Mesh element type | CTETRA (volume) | CTETRA (volume) | CTETRA (volume) | CQUAD1 (shell) | CQUAD1 (shell) | CQUAD1 (shell) | CQUAD1 (shell) |
| Element edge length | 9 mm | 3 mm | 5 mm | 4 mm | 3 mm | 1 mm | 1 mm |
| Number of elements | 1,303,473 | 26,040 | 2402 | 3104 | 13,464 | 2996 | 2370 |
| Material properties | Structural steel (Young’s modulus: 210,000 MPa, density: 7850 kg m3, Poisson’s ratio: 0.3) | ||||||
| Studied max. pre-deformation | 0–150 mm ( = 0–15) | 0–25 mm ( = 0.0–2.5) | 0–30 mm ( = 0.0–3.0) | 0–25 mm ( = 0.0–13.9) | 0–25 mm ( = 0.0–13.5) | 0–25 mm ( = 0.0–13.0) | 0–25 mm ( = 0.0–13.3) |
| Wall thickness | 10 mm (constant) | 10 mm (constant) | - | 1.80–2.00 mm (varied) | 1.85–2.00 mm (varied) | 1.92–2.00 mm (varied) | 1.88–2.00 mm (varied) |
| Mass | 0.65–0.71 t (varied up to 9%) | 8.88–9.49 kg (varied up to 7%) | 7.85–8.35 kg (varied up to 6%) | 0.78 t (constant) | 1.88 kg (constant) | 1.14 t (constant) | 0.565 t (constant) |
| (mm) | 0 | 1 | 2 | 3 | 4 | 5 | 10 | 15 | 20 | 25 | |
|---|---|---|---|---|---|---|---|---|---|---|---|
| Adaptation according to the 1st mode shape | Truncated pyramid | 2.00 | 2.00 | 2.00 | 2.00 | 2.00 | 2.00 | 1.96 | 1.92 | 1.86 | 1.80 |
| Thin hexagonal prism | 2.00 | 2.00 | 2.00 | 2.00 | 2.00 | 2.00 | 1.98 | 1.95 | 1.90 | 1.85 | |
| Curved rectangular duct | 2.00 | 2.00 | 2.00 | 2.00 | 2.00 | 2.00 | 2.00 | 1.98 | 1.94 | 1.92 | |
| Connector square | 2.00 | 2.00 | 2.00 | 2.00 | 2.00 | 2.00 | 1.98 | 1.96 | 1.92 | 1.88 | |
| Adaptation according to the 2nd mode shape | Truncated pyramid | 2.00 | 2.00 | 2.00 | 2.00 | 2.00 | 2.00 | 1.96 | 1.92 | 1.86 | 1.80 |
| Thin hexagonal prism | 2.00 | 2.00 | 2.00 | 2.00 | 2.00 | 2.00 | 1.98 | 1.97 | 1.95 | 1.92 | |
| Curved rectangular duct | 2.00 | 2.00 | 2.00 | 2.00 | 2.00 | 2.00 | 2.00 | 1.98 | 1.94 | 1.92 | |
| Connector square | 2.00 | 2.00 | 2.00 | 2.00 | 2.00 | 2.00 | 1.98 | 1.96 | 1.92 | 1.88 |
| Property | Value |
|---|---|
| Young’s modulus E (MPa) | 69,000 |
| Material density (kg m3) | 2688 |
| Poisson’s ratio (-) | 0.34 |
| Beam length l (m) | 0.6 |
| Beam cross-section radius r (m) | 0.002 |
| Average Eigenfrequency Deviation | |
|---|---|
| 1.0 | 0.0% |
| 2.0 | 0.0% |
| 3.0 | 0.1% |
| 4.1 | 0.2% |
| 5.1 | 0.4% |
| 10.7 | 2.8% |
| 17.4 | 4.7% |
| 25.3 | 8.7% |
| Average Eigenfrequency Deviation | |
|---|---|
| 1.5 | 0.4% |
| 3.0 | 0.3% |
| 4.5 | 0.2% |
| 6.0 | 0.2% |
| 7.5 | 0.2% |
| 9.0 | 1.4% |
| 10.5 | 0.3% |
| 12.0 | 1.0% |
| 13.5 | 0.8% |
| 15.0 | 0.7% |
Disclaimer/Publisher’s Note: The statements, opinions and data contained in all publications are solely those of the individual author(s) and contributor(s) and not of MDPI and/or the editor(s). MDPI and/or the editor(s) disclaim responsibility for any injury to people or property resulting from any ideas, methods, instructions or products referred to in the content. |
© 2024 by the authors. Licensee MDPI, Basel, Switzerland. This article is an open access article distributed under the terms and conditions of the Creative Commons Attribution (CC BY) license (https://creativecommons.org/licenses/by/4.0/).
Share and Cite
Andresen, S.; Ahmad Basri, A.B. Diatom-Inspired Structural Adaptation According to Mode Shapes: A Study on 3D Structures and Software Tools. Biomimetics 2024, 9, 241. https://doi.org/10.3390/biomimetics9040241
Andresen S, Ahmad Basri AB. Diatom-Inspired Structural Adaptation According to Mode Shapes: A Study on 3D Structures and Software Tools. Biomimetics. 2024; 9(4):241. https://doi.org/10.3390/biomimetics9040241
Chicago/Turabian StyleAndresen, Simone, and Ahmad Burhani Ahmad Basri. 2024. "Diatom-Inspired Structural Adaptation According to Mode Shapes: A Study on 3D Structures and Software Tools" Biomimetics 9, no. 4: 241. https://doi.org/10.3390/biomimetics9040241
APA StyleAndresen, S., & Ahmad Basri, A. B. (2024). Diatom-Inspired Structural Adaptation According to Mode Shapes: A Study on 3D Structures and Software Tools. Biomimetics, 9(4), 241. https://doi.org/10.3390/biomimetics9040241