


Maximization of Power Density of Direct Methanol Fuel Cell for Greener Energy Generation Using Beetle Antennae Search Algorithm and Fuzzy Modeling
 ,
,  ,
,  , ,
, ,  and
and 
Abstract
:1. Introduction
- Constructing a new fuzzy model for simulating direct methanol fuel cell.
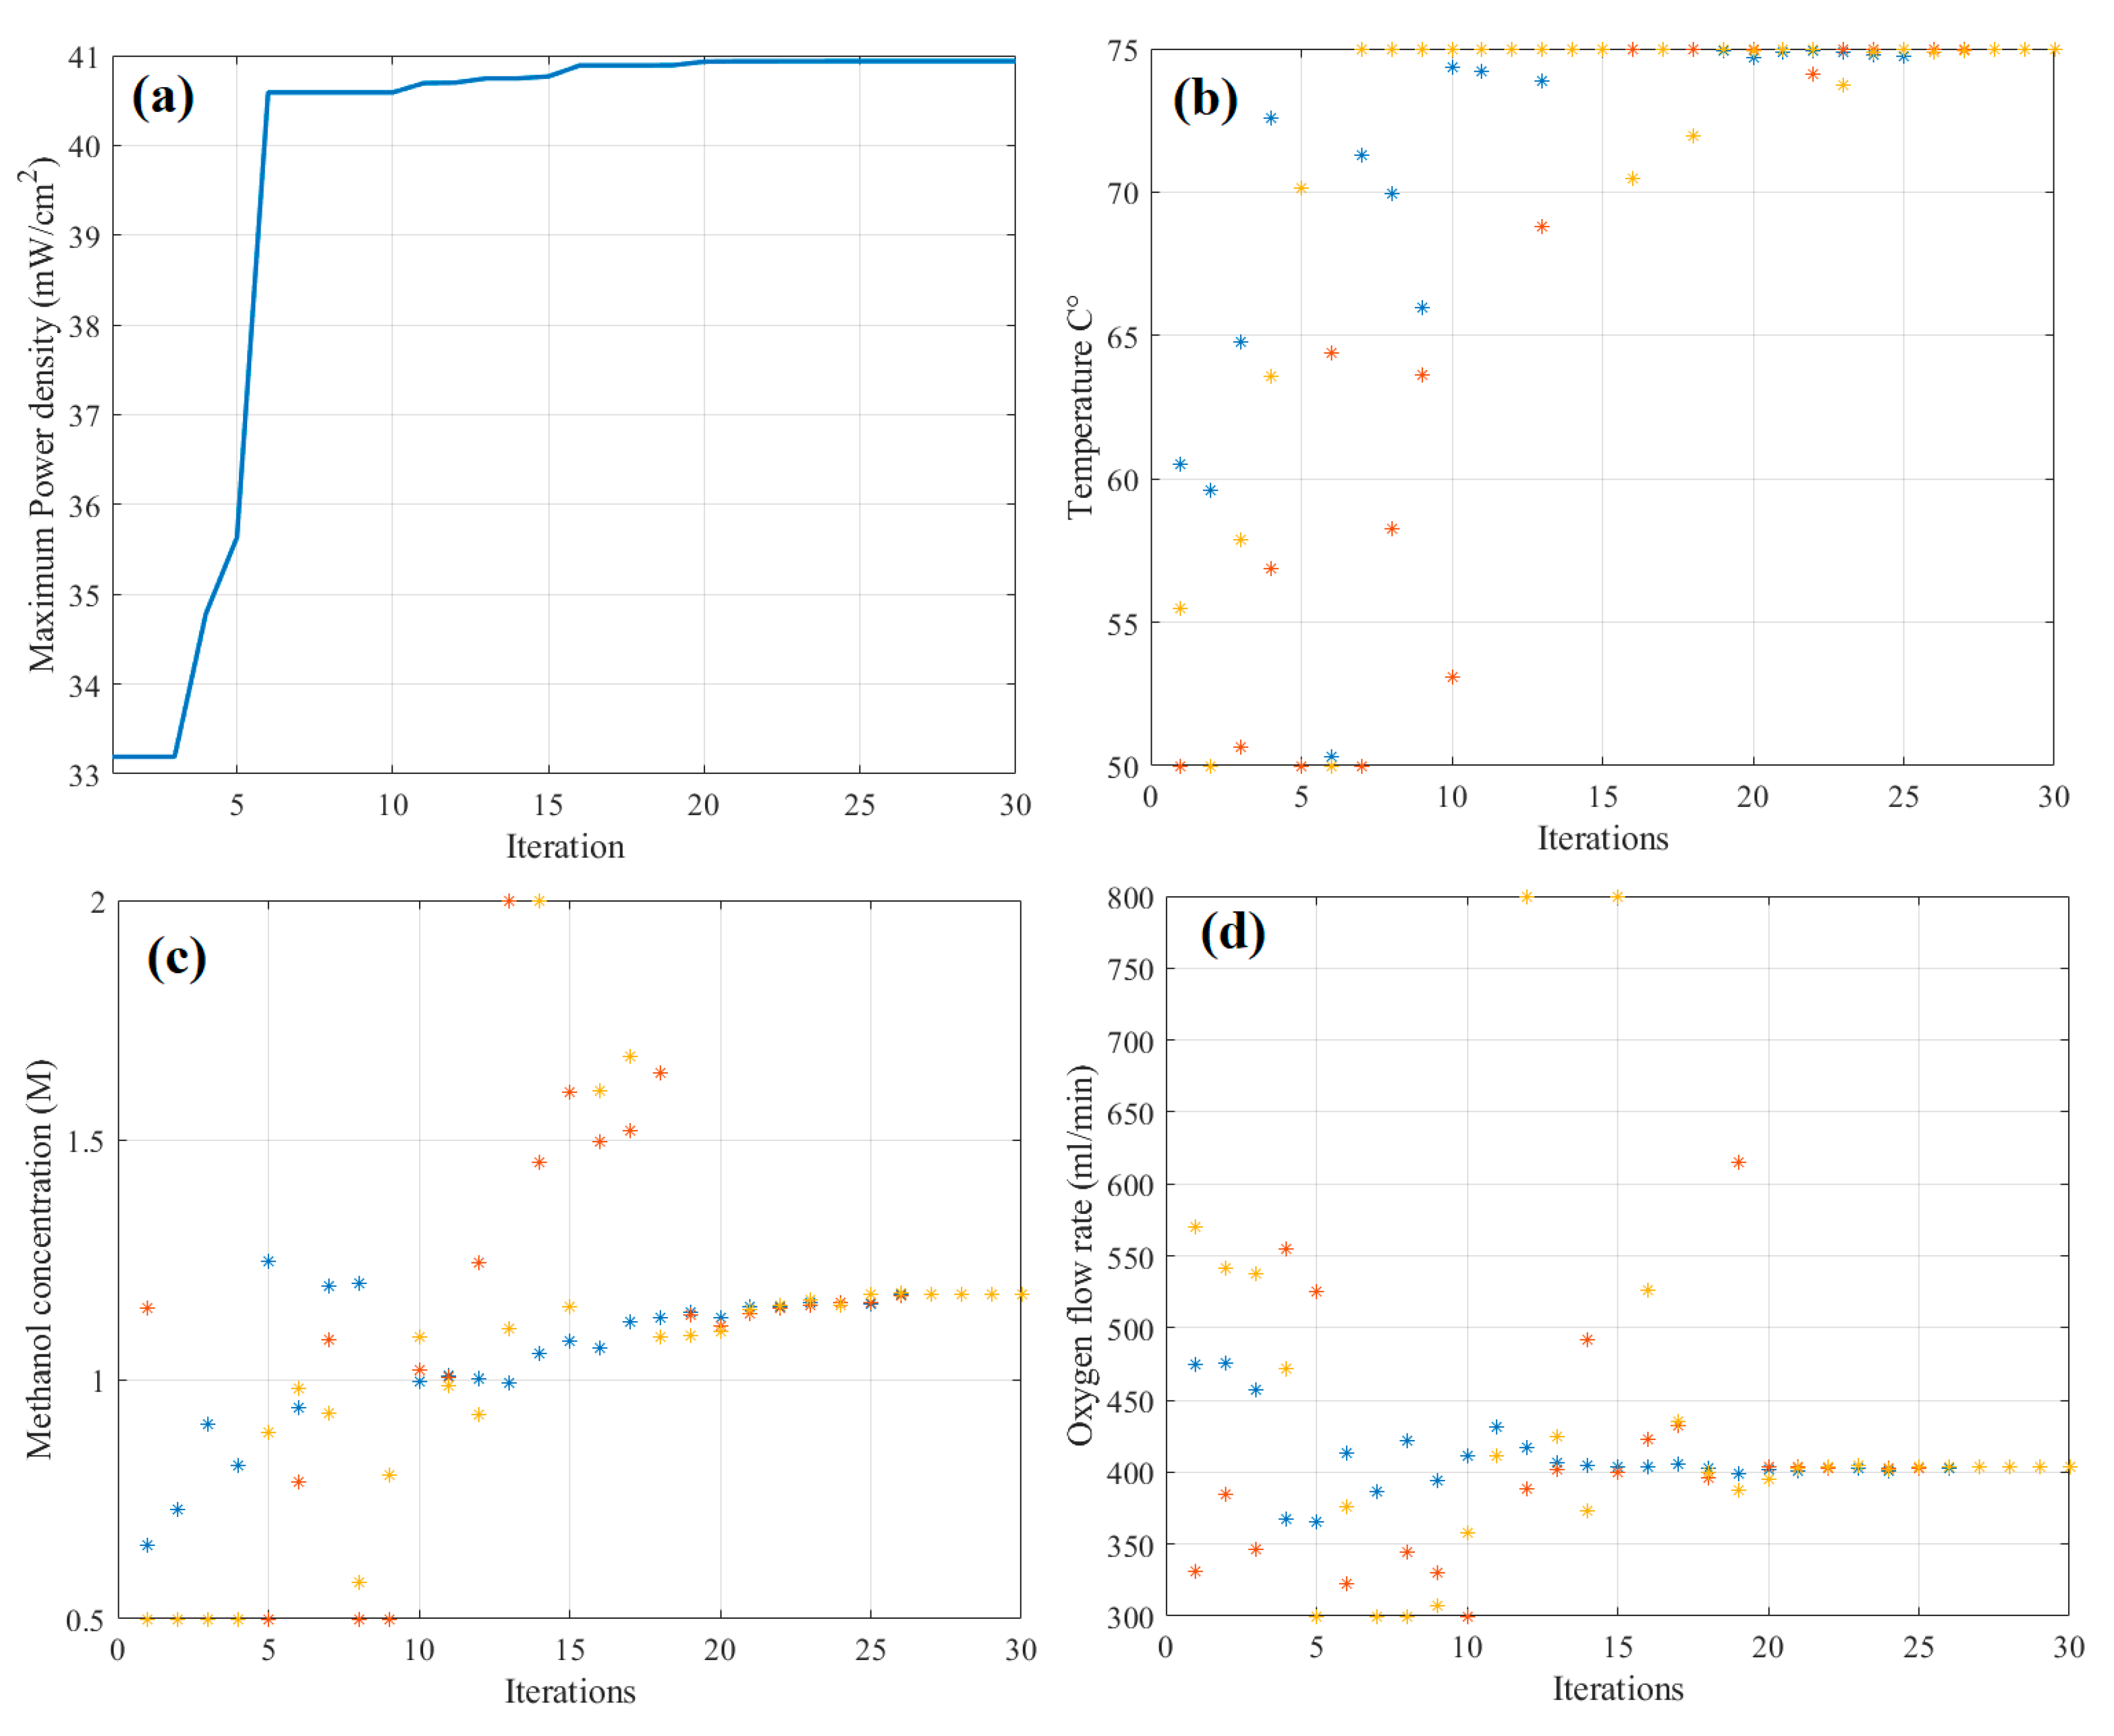
- Applying BAS algorithm for determining the best values of temperature, methanol concentration, and oxygen flow rate.
- Boosting the power density of the DMFC.
2. Dataset
3. Methodology
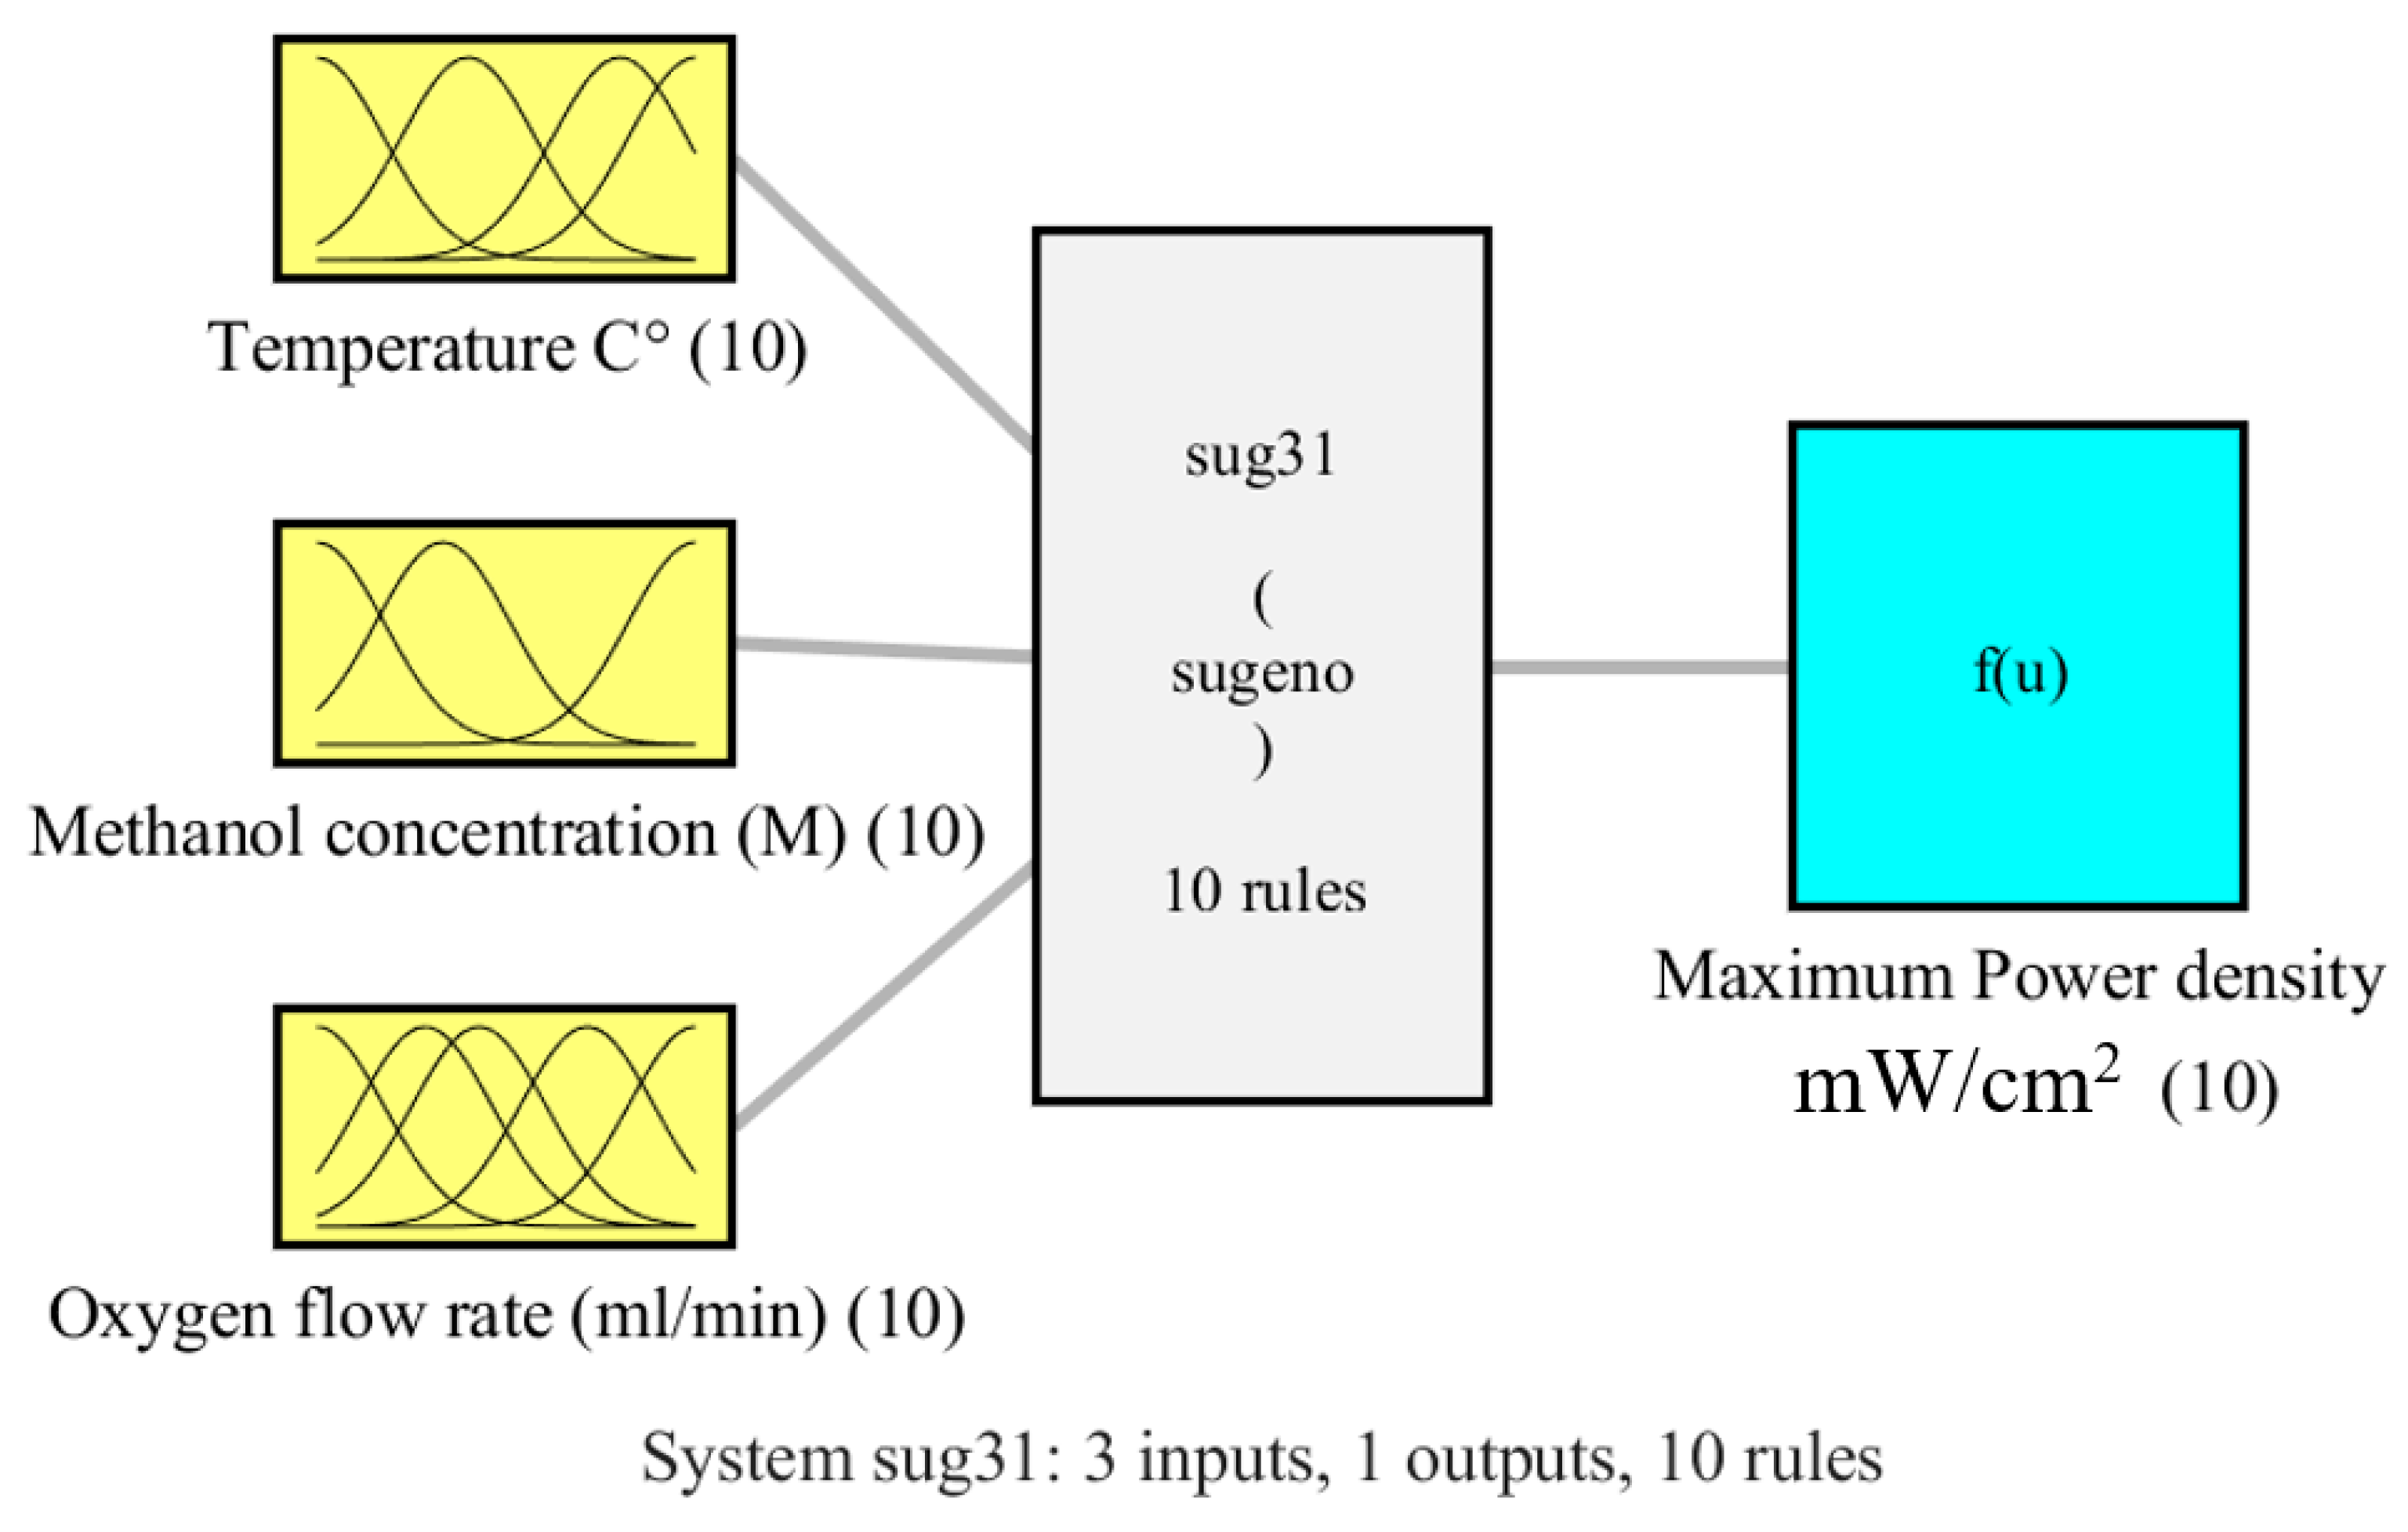
3.1. Fuzzy Modeling
- An assemblage of fuzzy IF–THEN rules within the rule base. The number of rules can be determined by multiplying the number of inputs. The rules are provided as follows:
- ○
- If α is X1 and β is Y1, then γ is Z1
- ○
- If α is X2 and β is Y2, then γ is Z2
- ○
- If α is Xn and β is Yn, then γ is Zn
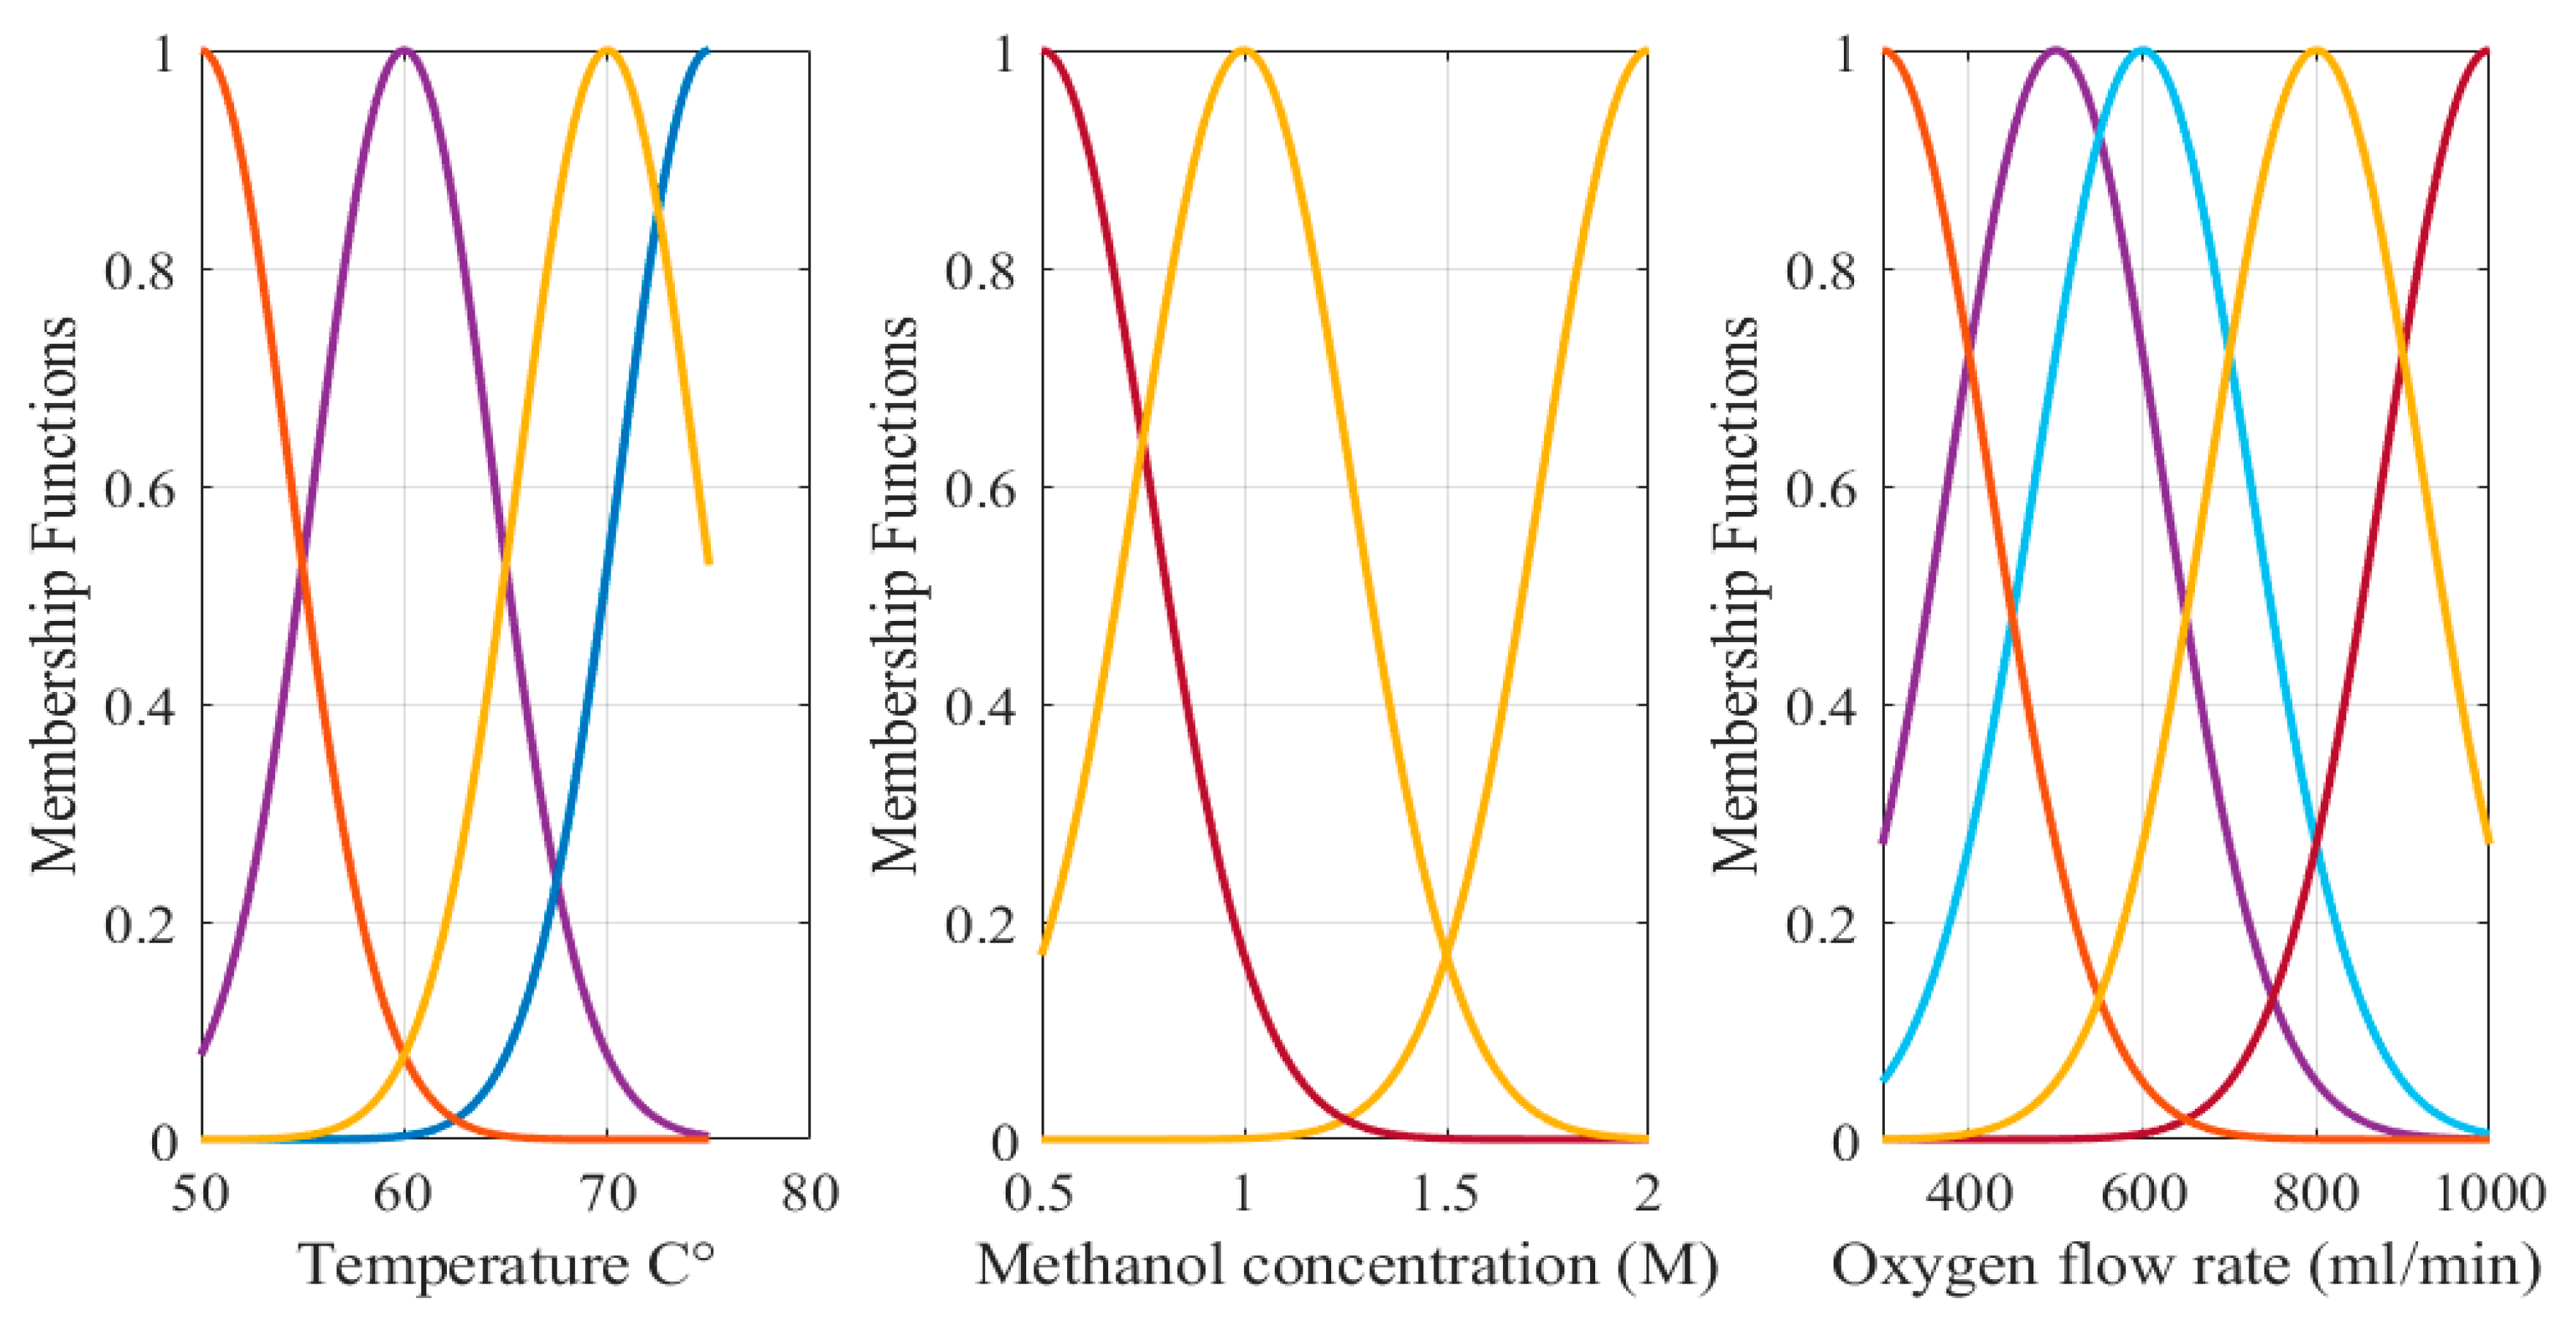
- A database that outlines the membership functions of each set.
- The decision making method.
- A fuzzification stage that converts the inputs to linguistic variables.
- A defuzzification stage that converts the linguistic variables to outputs.
3.2. Beetle Antennae Search Algorithm
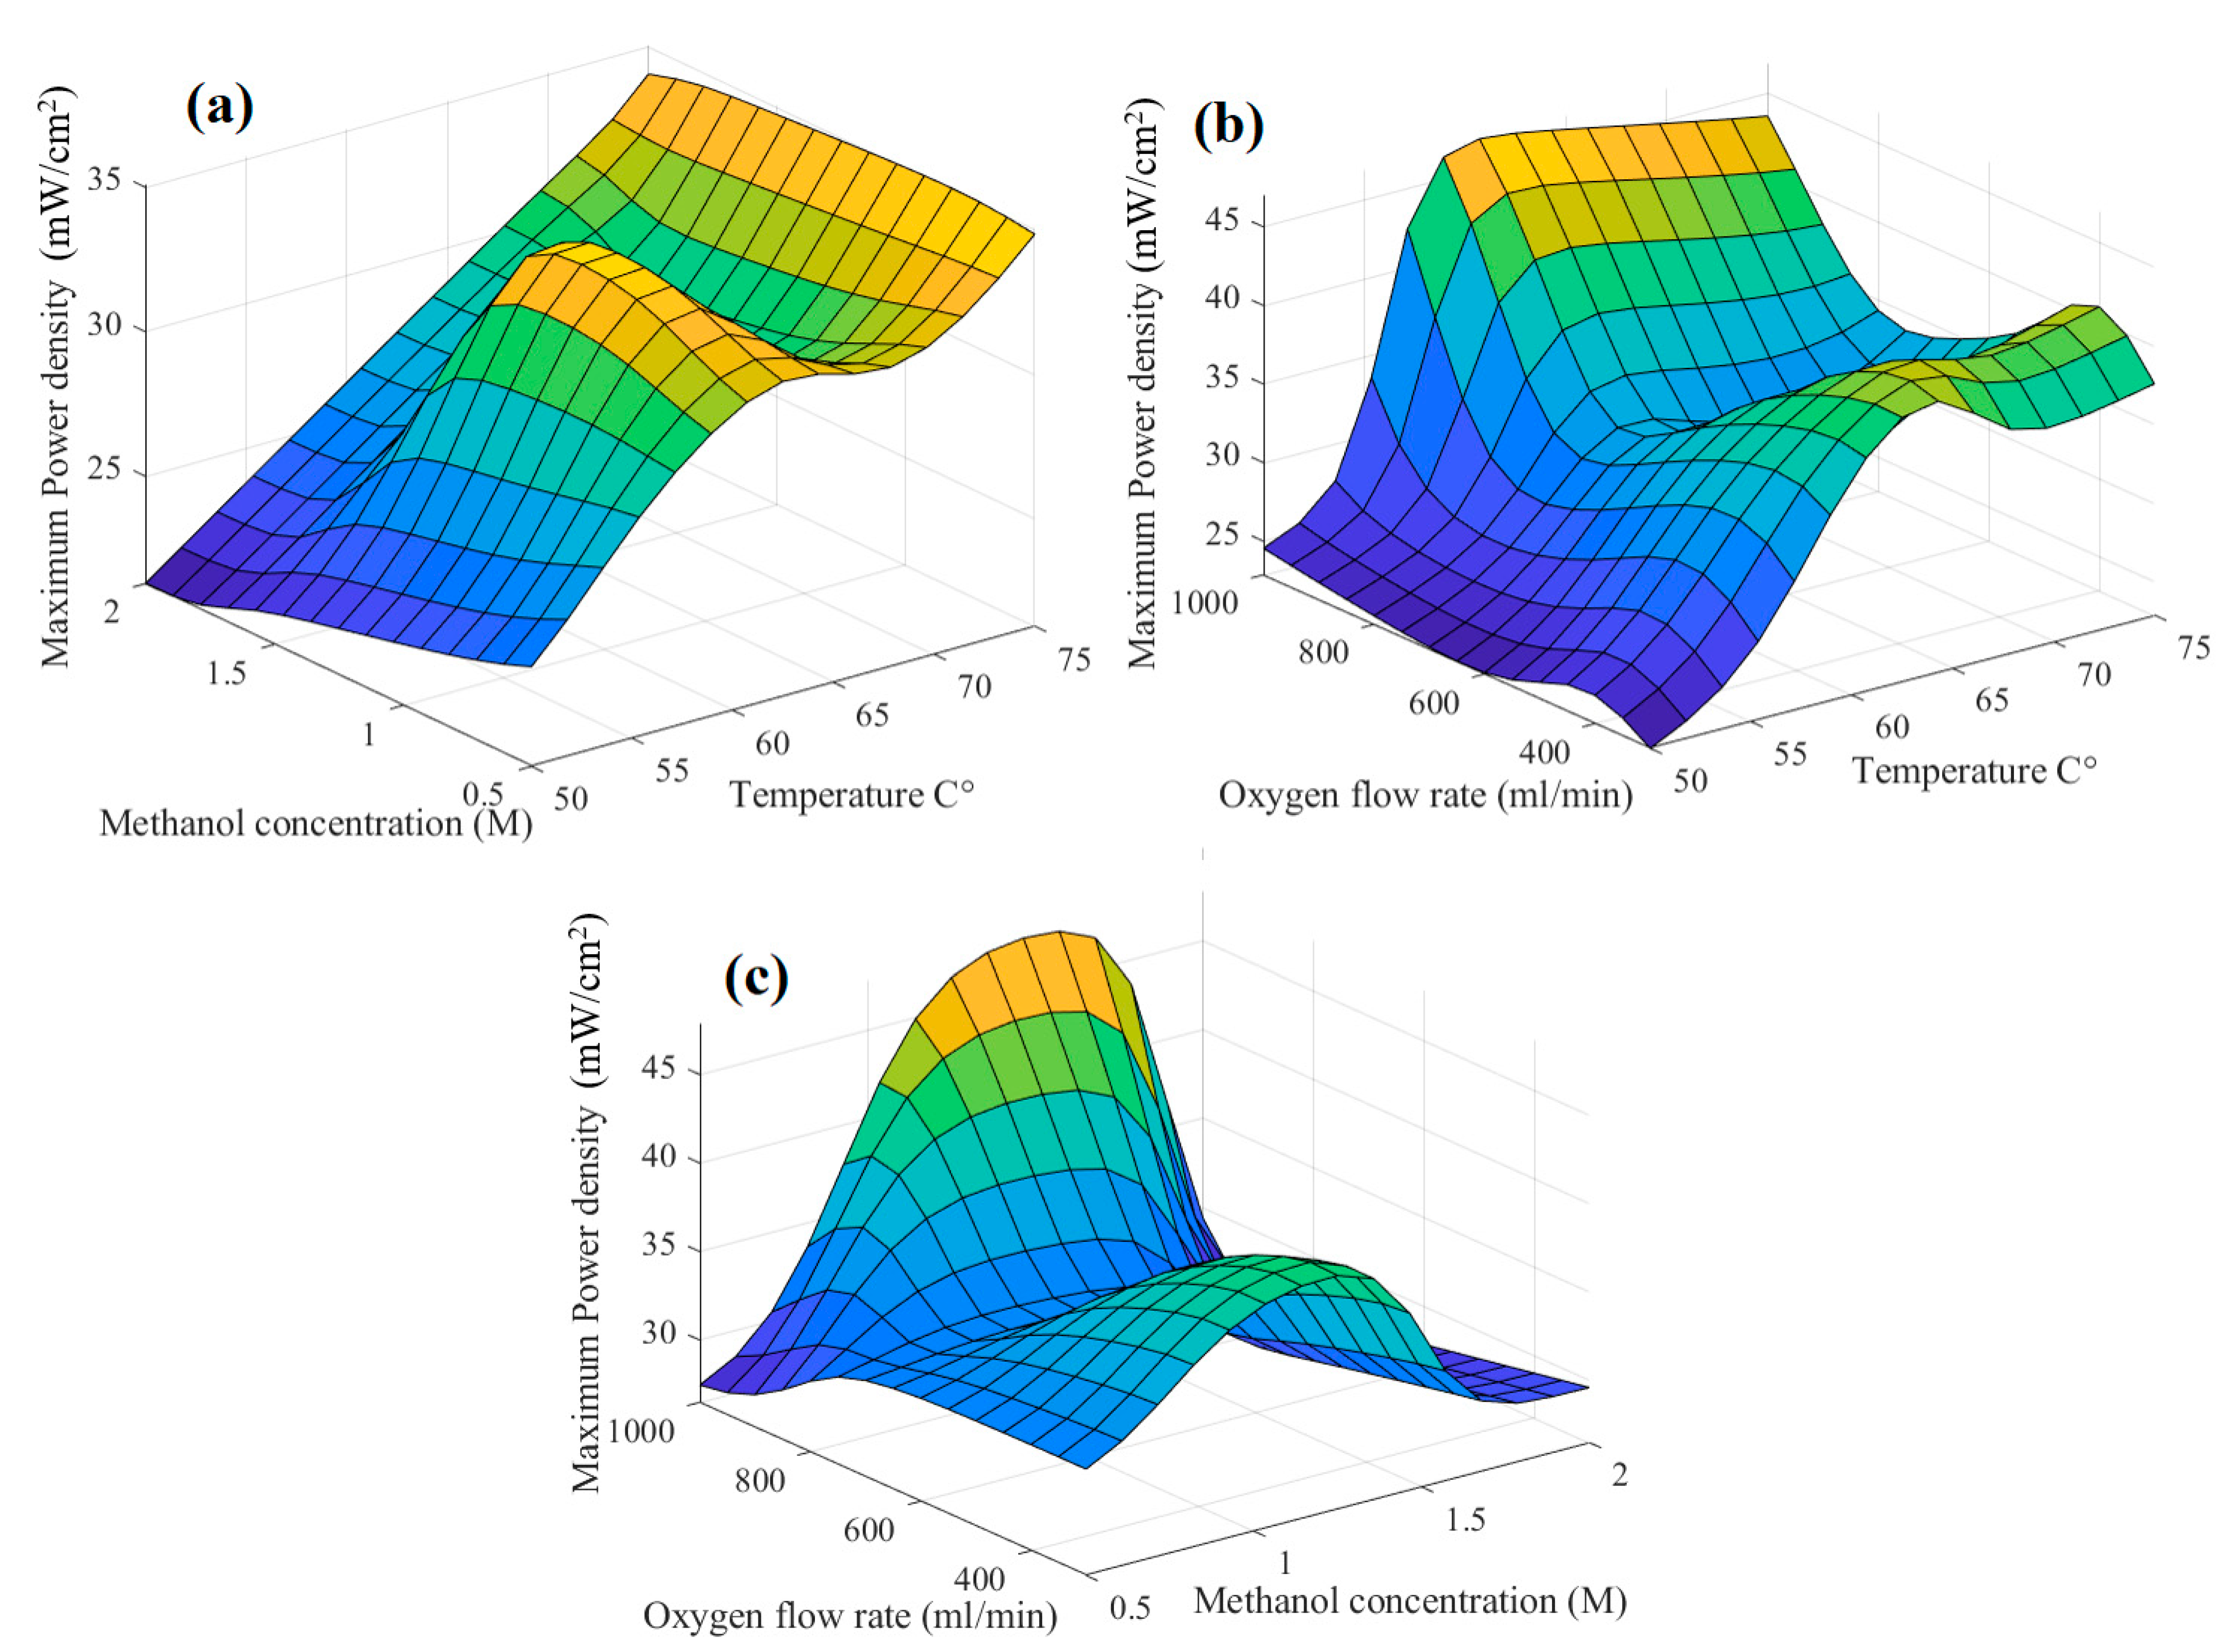
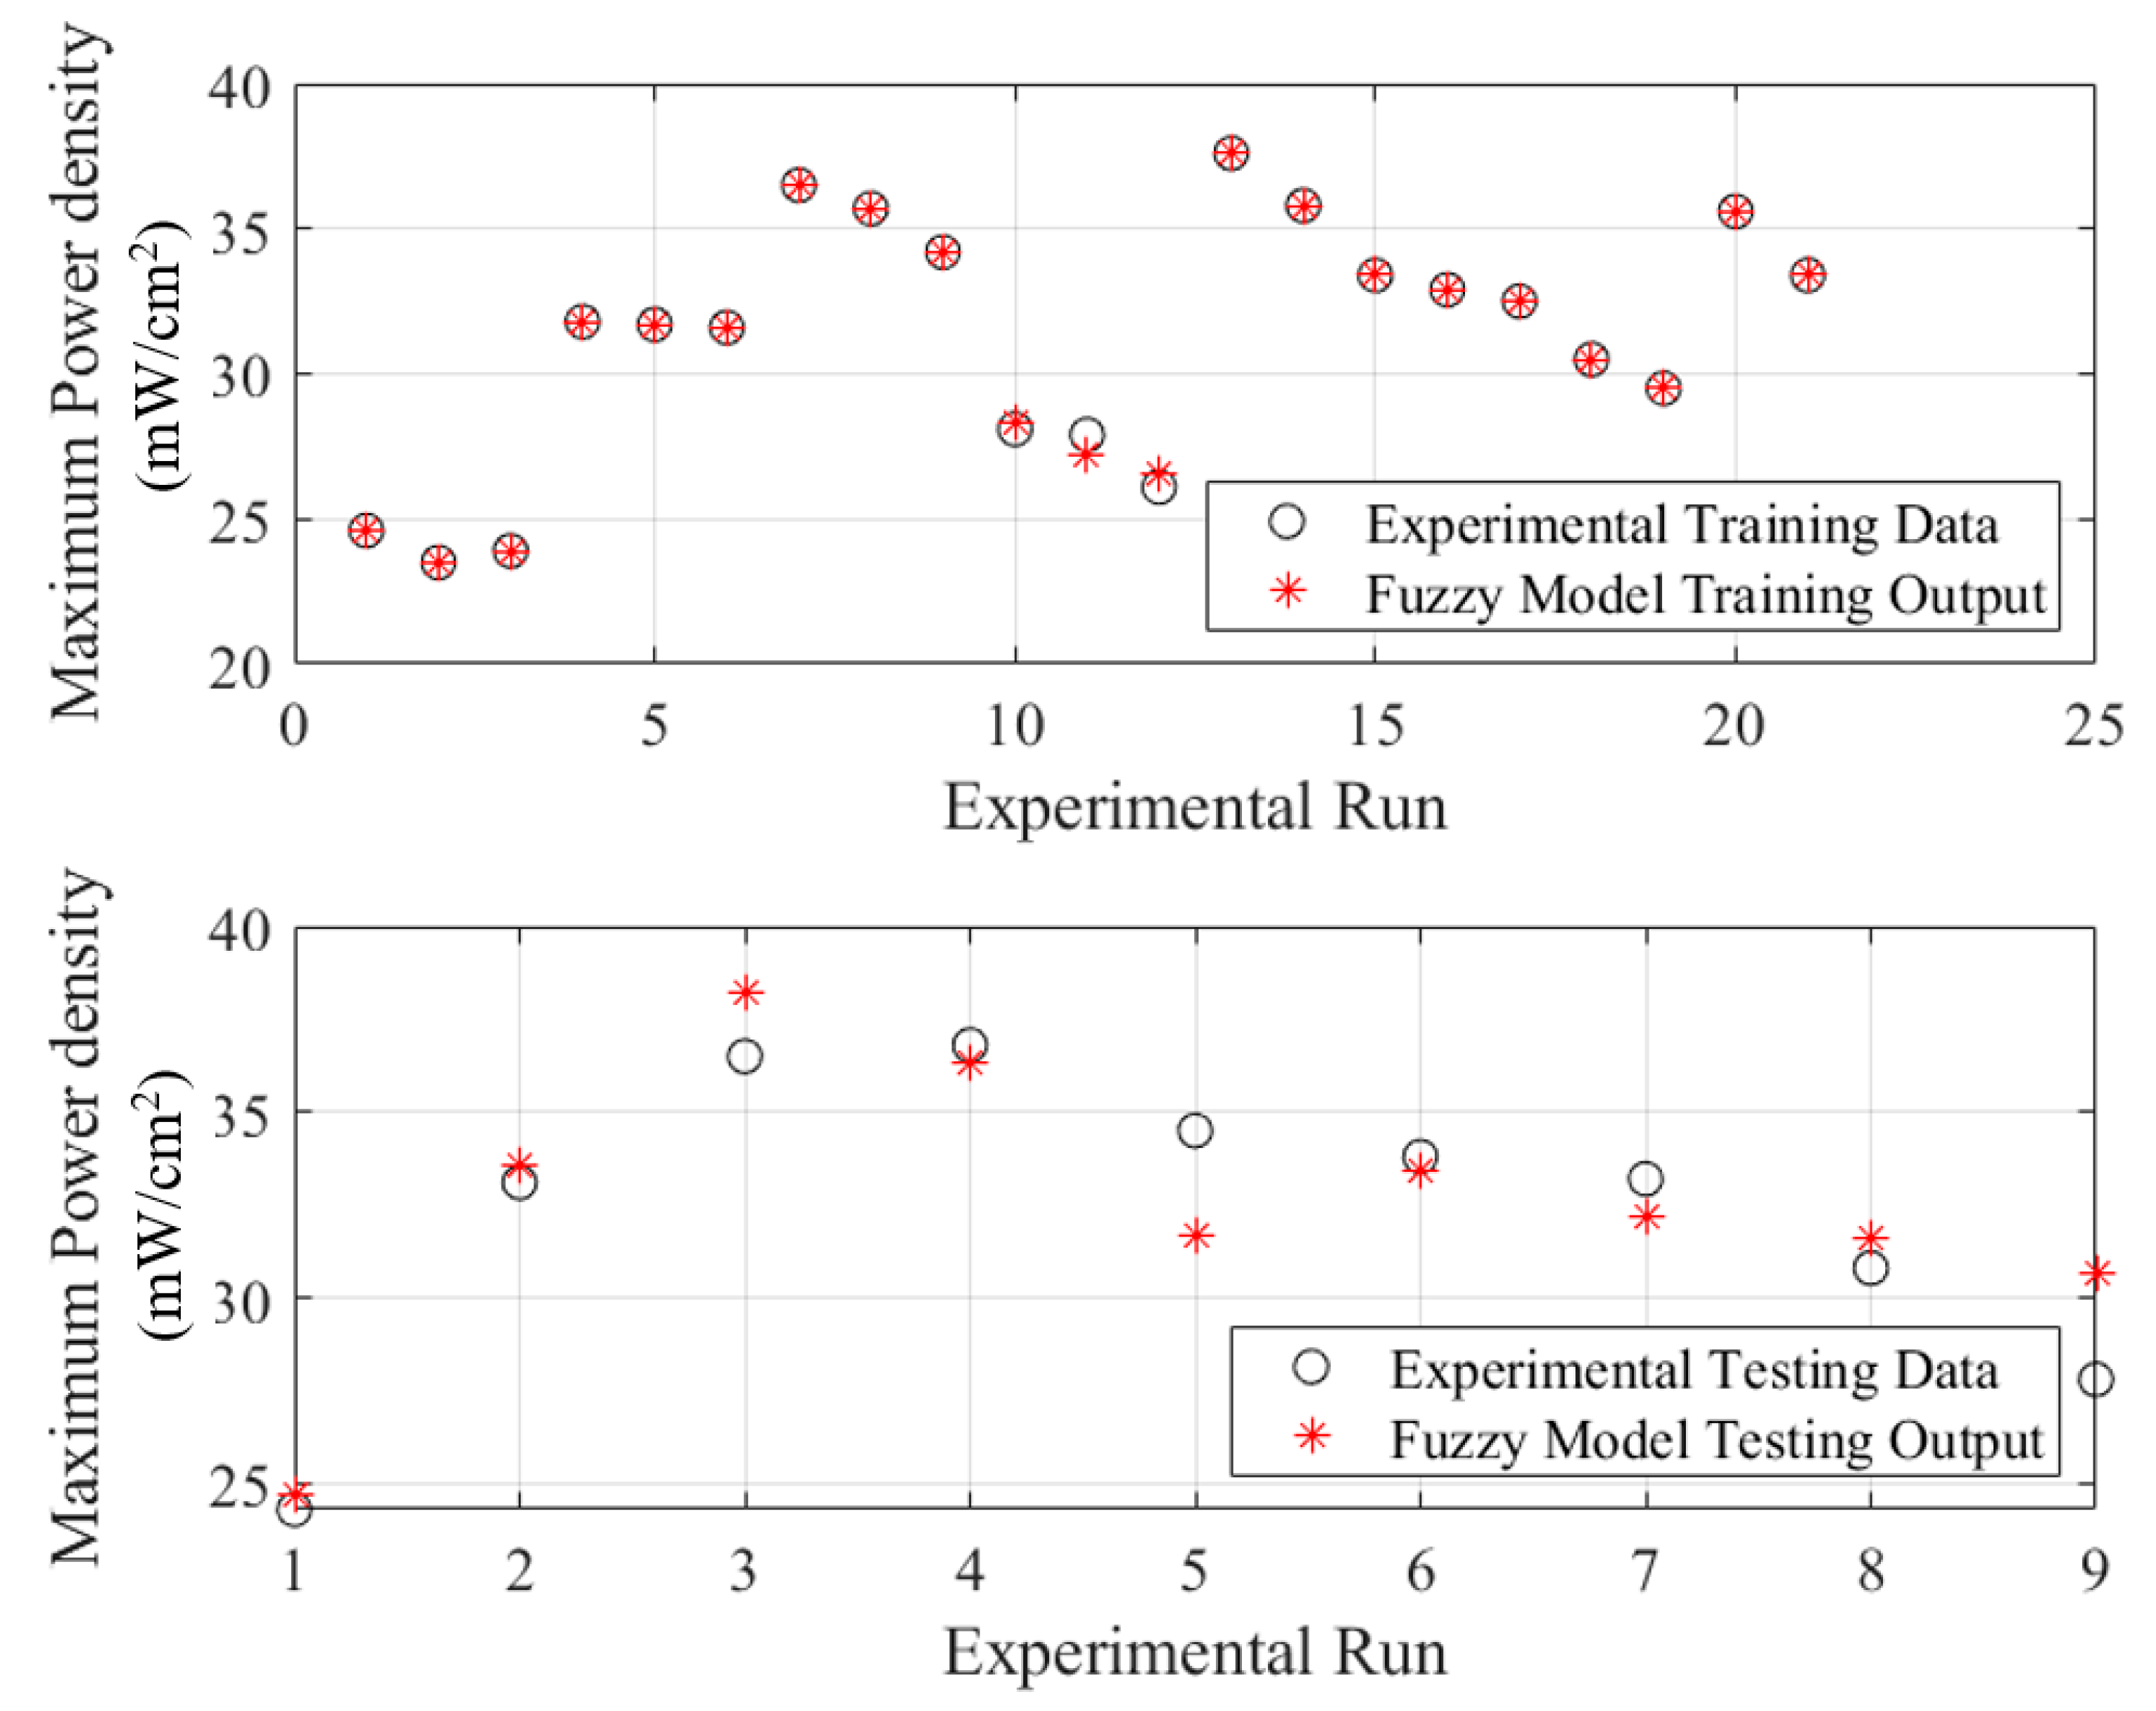
4. Results and Discussion
5. Conclusions
Author Contributions
Funding
Institutional Review Board Statement
Informed Consent Statement
Data Availability Statement
Conflicts of Interest
References
- Lamb, W.F.; Wiedmann, T.; Pongratz, J.; Andrew, R.; Crippa, M.; Olivier, J.G.J.; Wiedenhofer, D.; Mattioli, G.; Khourdajie, A.A.; House, J.; et al. A review of trends and drivers of greenhouse gas emissions by sector from 1990 to 2018. Environ. Res. Lett. 2021, 16, 073005. [Google Scholar] [CrossRef]
- Yoro, K.O.; Daramola, M.O. Chapter 1—CO2 emission sources, greenhouse gases, and the global warming effect. In Advances in Carbon Capture; Rahimpour, M.R., Farsi, M., Makarem, M.A., Eds.; Woodhead Publishing: Cambridge, UK, 2020; pp. 3–28. [Google Scholar]
- Armstrong McKay, D.I.; Staal, A.; Abrams, J.F.; Winkelmann, R.; Sakschewski, B.; Loriani, S.; Fetzer, I.; Cornell, S.E.; Rockström, J.; Lenton, T.M. Exceeding 1.5 °C global warming could trigger multiple climate tipping points. Science 2022, 377, eabn7950. [Google Scholar] [CrossRef]
- Barbarossa, V.; Bosmans, J.; Wanders, N.; King, H.; Bierkens, M.F.P.; Huijbregts, M.A.J.; Schipper, A.M. Threats of global warming to the world’s freshwater fishes. Nat. Commun. 2021, 12, 1701. [Google Scholar] [CrossRef]
- Baroutaji, A.; Arjunan, A.; Robinson, J.; Wilberforce, T.; Abdelkareem, M.A.; Olabi, A.G. PEMFC Poly-Generation Systems: Developments, Merits, and Challenges. Sustainability 2021, 13, 11696. [Google Scholar] [CrossRef]
- Wang, Y.; Pang, Y.; Xu, H.; Martinez, A.; Chen, K.S. PEM Fuel cell and electrolysis cell technologies and hydrogen infrastructure development—A review. Energy Environ. Sci. 2022, 15, 2288–2328. [Google Scholar] [CrossRef]
- Ratnakar, R.R.; Gupta, N.; Zhang, K.; van Doorne, C.; Fesmire, J.; Dindoruk, B.; Balakotaiah, V. Hydrogen supply chain and challenges in large-scale LH2 storage and transportation. Int. J. Hydrogen Energy 2021, 46, 24149–24168. [Google Scholar] [CrossRef]
- Abdalla, A.M.; Hossain, S.; Nisfindy, O.B.; Azad, A.T.; Dawood, M.; Azad, A.K. Hydrogen production, storage, transportation and key challenges with applications: A review. Energy Convers. Manag. 2018, 165, 602–627. [Google Scholar] [CrossRef]
- Song, C. Fuel processing for low-temperature and high-temperature fuel cells: Challenges, and opportunities for sustainable development in the 21st century. Catal. Today 2002, 77, 17–49. [Google Scholar] [CrossRef]
- Trimm, D.L.; Önsan, Z.I. Onboard Fuel Conversion for Hydrogen-Fuel-Cell-Driven Vehicles. Catal. Rev. 2001, 43, 31–84. [Google Scholar] [CrossRef]
- Abdelkareem, M.A.; Sayed, E.T.; Nakagawa, N. Significance of diffusion layers on the performance of liquid and vapor feed passive direct methanol fuel cells. Energy 2020, 209, 118492. [Google Scholar] [CrossRef]
- Alias, M.S.; Kamarudin, S.K.; Zainoodin, A.M.; Masdar, M.S. Active direct methanol fuel cell: An overview. Int. J. Hydrogen Energy 2020, 45, 19620–19641. [Google Scholar] [CrossRef]
- Osman, S.H.; Kamarudin, S.K.; Basri, S.; Karim, N.A. Three-Dimensional Graphene Aerogel Supported on Efficient Anode Electrocatalyst for Methanol Electrooxidation in Acid Media. Catalysts 2023, 13, 879. [Google Scholar] [CrossRef]
- Hamid, N.S.A.; Kamarudin, S.K.; Karim, N.A. Potential of Nafion/eggshell composite membrane for application in direct methanol fuel cell. Int. J. Energy Res. 2021, 45, 2245–2264. [Google Scholar] [CrossRef]
- Zakaria, Z.; Kamarudin, S.K.; Wahid, K.A.A. Polymer electrolyte membrane modification in direct ethanol fuel cells: An update. J. Appl. Polym. Sci. 2023, 140, e53383. [Google Scholar] [CrossRef]
- Fadzillah, D.M.; Kamarudin, S.K.; Zainoodin, A.M. Design and simulation for improved performance via pump-less direct ethanol fuel cell for mobile application. Int. J. Energy Res. 2022, 46, 15683–15695. [Google Scholar] [CrossRef]
- Brodt, M.; Müller, K.; Kerres, J.; Katsounaros, I.; Mayrhofer, K.; Preuster, P.; Wasserscheid, P.; Thiele, S. The 2-Propanol Fuel Cell: A Review from the Perspective of a Hydrogen Energy Economy. Energy Technol. 2021, 9, 2100164. [Google Scholar] [CrossRef]
- Shaari, N.; Kamarudin, S.K.; Bahru, R.; Osman, S.H.; Md Ishak, N.A.I. Progress and challenges: Review for direct liquid fuel cell. Int. J. Energy Res. 2021, 45, 6644–6688. [Google Scholar] [CrossRef]
- Zakaria, Z.; Kamarudin, S.K. Evaluation of Quaternized polyvinyl alcohol/graphene oxide-based membrane towards improving the performance of air-breathing passive direct methanol fuel cells. Int. J. Energy Res. 2020, 44, 8988–9000. [Google Scholar] [CrossRef]
- Tsujiguchi, T.; Abdelkareem, M.A.; Kudo, T.; Nakagawa, N.; Shimizu, T.; Matsuda, M. Development of a passive direct methanol fuel cell stack for high methanol concentration. J. Power Sources 2010, 195, 5975–5979. [Google Scholar] [CrossRef]
- Kamarudin, S.K.; Daud, W.R.W.; Ho, S.L.; Hasran, U.A. Overview on the challenges and developments of micro-direct methanol fuel cells (DMFC). J. Power Sources 2007, 163, 743–754. [Google Scholar] [CrossRef]
- Zuo, Y.; Sheng, W.; Tao, W.; Li, Z. Direct methanol fuel cells system–A review of dual-role electrocatalysts for oxygen reduction and methanol oxidation. J. Mater. Sci. Technol. 2022, 114, 29–41. [Google Scholar] [CrossRef]
- Gurau, B.; Smotkin, E.S. Methanol crossover in direct methanol fuel cells: A link between power and energy density. J. Power Sources 2002, 112, 339–352. [Google Scholar] [CrossRef]
- Bahrami, H.; Faghri, A. Review and advances of direct methanol fuel cells: Part II: Modeling and numerical simulation. J. Power Sources 2013, 230, 303–320. [Google Scholar] [CrossRef]
- Jeng, K.T.; Chen, C.W. Modeling and simulation of a direct methanol fuel cell anode. J. Power Sources 2002, 112, 367–375. [Google Scholar] [CrossRef]
- Jadhav, D.A.; Carmona-Martínez, A.A.; Chendake, A.D.; Pandit, S.; Pant, D. Modeling and optimization strategies towards performance enhancement of microbial fuel cells. Bioresour. Technol. 2021, 320, 124256. [Google Scholar] [CrossRef] [PubMed]
- Wu, H.-W. A review of recent development: Transport and performance modeling of PEM fuel cells. Appl. Energy 2016, 165, 81–106. [Google Scholar] [CrossRef]
- Zhou, Z.-H. Machine Learning; Springer Nature: Berlin/Heidelberg, Germany, 2021. [Google Scholar]
- Janiesch, C.; Zschech, P.; Heinrich, K. Machine learning and deep learning. Electron. Mark. 2021, 31, 685–695. [Google Scholar] [CrossRef]
- Carleo, G.; Cirac, I.; Cranmer, K.; Daudet, L.; Schuld, M.; Tishby, N.; Vogt-Maranto, L.; Zdeborová, L. Machine learning and the physical sciences. Rev. Mod. Phys. 2019, 91, 045002. [Google Scholar] [CrossRef]
- Li, Z.; Liu, F.; Yang, W.; Peng, S.; Zhou, J. A Survey of Convolutional Neural Networks: Analysis, Applications, and Prospects. IEEE Trans. Neural Netw. Learn. Syst. 2022, 33, 6999–7019. [Google Scholar] [CrossRef]
- Samek, W.; Montavon, G.; Lapuschkin, S.; Anders, C.J.; Müller, K.R. Explaining Deep Neural Networks and Beyond: A Review of Methods and Applications. Proc. IEEE 2021, 109, 247–278. [Google Scholar] [CrossRef]
- Serrano-Guerrero, J.; Romero, F.P.; Olivas, J.A. Fuzzy logic applied to opinion mining: A review. Knowl. Based Syst. 2021, 222, 107018. [Google Scholar] [CrossRef]
- Vivek, K.; Subbarao, K.V.; Routray, W.; Kamini, N.R.; Dash, K.K. Application of Fuzzy Logic in Sensory Evaluation of Food Products: A Comprehensive Study. Food Bioprocess Technol. 2020, 13, 1–29. [Google Scholar] [CrossRef]
- Yousef, B.A.A.; Rezk, H.; Abdelkareem, M.A.; Olabi, A.G.; Nassef, A.M. Fuzzy modeling and particle swarm optimization for determining the optimal operating parameters to enhance the bio-methanol production from sugar cane bagasse. Int. J. Energy Res. 2020, 44, 8964–8973. [Google Scholar] [CrossRef]
- Rezk, H.; Olabi, A.G.; Abdelkareem, M.A.; Maghrabie, H.M.; Sayed, E.T. Fuzzy Modelling and Optimization of Yeast-MFC for Simultaneous Wastewater Treatment and Electrical Energy Production. Sustainability 2023, 15, 1878. [Google Scholar] [CrossRef]
- Rezk, H.; Sayed, E.T.; Abdelkareem, M.A.; Olabi, A.G. Performance improvement of co-culture inoculated microbial fuel cell using fuzzy modelling and Harris hawks optimization. Int. J. Energy Res. 2022, 46, 14396–14407. [Google Scholar] [CrossRef]
- Nassef, A.M.; Rezk, H.; Alahmer, A.; Abdelkareem, M.A. Maximization of CO2 Capture Capacity Using Recent RUNge Kutta Optimizer and Fuzzy Model. Atmosphere 2023, 14, 295. [Google Scholar] [CrossRef]
- Kushwaha, O.S.; Uthayakumar, H.; Kumaresan, K. Modeling of carbon dioxide fixation by microalgae using hybrid artificial intelligence (AI) and fuzzy logic (FL) methods and optimization by genetic algorithm (GA). Environ. Sci. Pollut. Res. 2023, 30, 24927–24948. [Google Scholar] [CrossRef]
- AbouOmar, M.S.; Su, Y.; Zhang, H.; Shi, B.; Wan, L. Observer-based interval type-2 fuzzy PID controller for PEMFC air feeding system using novel hybrid neural network algorithm-differential evolution optimizer. Alex. Eng. J. 2022, 61, 7353–7375. [Google Scholar] [CrossRef]
- Rezk, H.; Wilberforce, T.; Olabi, A.G.; Ghoniem, R.M.; Abdelkareem, M.A.; Sayed, E.T. Fuzzy Modelling and Optimization to Decide Optimal Parameters of the PEMFC. Energies 2023, 16, 4743. [Google Scholar] [CrossRef]
- Salameh, T.; Sayed, E.T.; Olabi, A.G.; Hdaib, I.I.; Allan, Y.; Alkasrawi, M.; Abdelkareem, M.A. Adaptive Network Fuzzy Inference System and Particle Swarm Optimization of Biohydrogen Production Process. Fermentation 2022, 8, 483. [Google Scholar] [CrossRef]
- Wang, R.; Qi, L.; Xie, X.; Ding, Q.; Li, C.; Ma, C.M. Modeling of a 5-cell direct methanol fuel cell using adaptive-network-based fuzzy inference systems. J. Power Sources 2008, 185, 1201–1208. [Google Scholar]
- Hasiloglu, A.; Aras, Ö.; Bayramoglu, M. Artificial Intelligence Techniques for the Estimation of Direct Methanol Fuel Cell Performance. J. Phys. Conf. Ser. 2016, 707, 012048. [Google Scholar] [CrossRef]
- Cao, L.; Li, C.; Liu, L. The Research of Energy Management Strategy for Direct Methanol Fuel Cell/Battery Hybrid System. In Proceedings of the 2010 Asia-Pacific Power and Energy Engineering Conference, Chengdu, China, 28–31 March 2010; pp. 1–4. [Google Scholar]
- Sharifi, S.; Rahimi, R.; Mohebbi-Kalhori, D.; Colpan, C.O. Coupled computational fluid dynamics-response surface methodology to optimize direct methanol fuel cell performance for greener energy generation. Energy 2020, 198, 117293. [Google Scholar] [CrossRef]
- Zanganeh, M. Improvement of the ANFIS-based wave predictor models by the Particle Swarm Optimization. J. Ocean Eng. Sci. 2020, 5, 84–99. [Google Scholar] [CrossRef]
- Jiang, X.; Li, S. BAS: Beetle antennae search algorithm for optimization problems. arXiv 2017, arXiv:1710.10724. [Google Scholar] [CrossRef]
- Ge, J.; Liu, H. Experimental studies of a direct methanol fuel cell. J. Power Sources 2005, 142, 56–69. [Google Scholar] [CrossRef]
- Liu, J.G.; Zhao, T.S.; Chen, R.; Wong, C.W. The effect of methanol concentration on the performance of a passive DMFC. Electrochem. Commun. 2005, 7, 288–294. [Google Scholar] [CrossRef]


| Oxygen Flow Rate (mL/min) | Methanol Concentration (M) | Temperature (°C) | Maximum Power Density (mW/cm2) |
|---|---|---|---|
| 300 | 1 | 50 | 24.6 |
| 500 | 1 | 50 | 24.3 |
| 600 | 1 | 50 | 23.5 |
| 800 | 1 | 50 | 23.9 |
| 300 | 0.5 | 60 | 31.8 |
| 500 | 0.5 | 60 | 31.7 |
| 600 | 0.5 | 60 | 31.6 |
| 300 | 1 | 60 | 36.5 |
| 500 | 1 | 60 | 35.7 |
| 600 | 1 | 60 | 34.2 |
| 800 | 1 | 60 | 33.1 |
| 300 | 2 | 60 | 28.1 |
| 500 | 2 | 60 | 27.9 |
| 600 | 2 | 60 | 26.1 |
| 300 | 1 | 75 | 37.6 |
| 500 | 1 | 75 | 36.5 |
| 600 | 1 | 75 | 35.8 |
| 300 | 0.5 | 70 | 33.4 |
| 500 | 0.5 | 70 | 32.9 |
| 600 | 0.5 | 70 | 32.5 |
| 800 | 0.5 | 70 | 30.5 |
| 1000 | 0.5 | 70 | 29.5 |
| 300 | 1 | 70 | 36.8 |
| 500 | 1 | 70 | 35.6 |
| 600 | 1 | 70 | 34.5 |
| 800 | 1 | 70 | 33.4 |
| 300 | 2 | 70 | 33.8 |
| 500 | 2 | 70 | 33.2 |
| 600 | 2 | 70 | 30.8 |
| 800 | 2 | 70 | 27.8 |
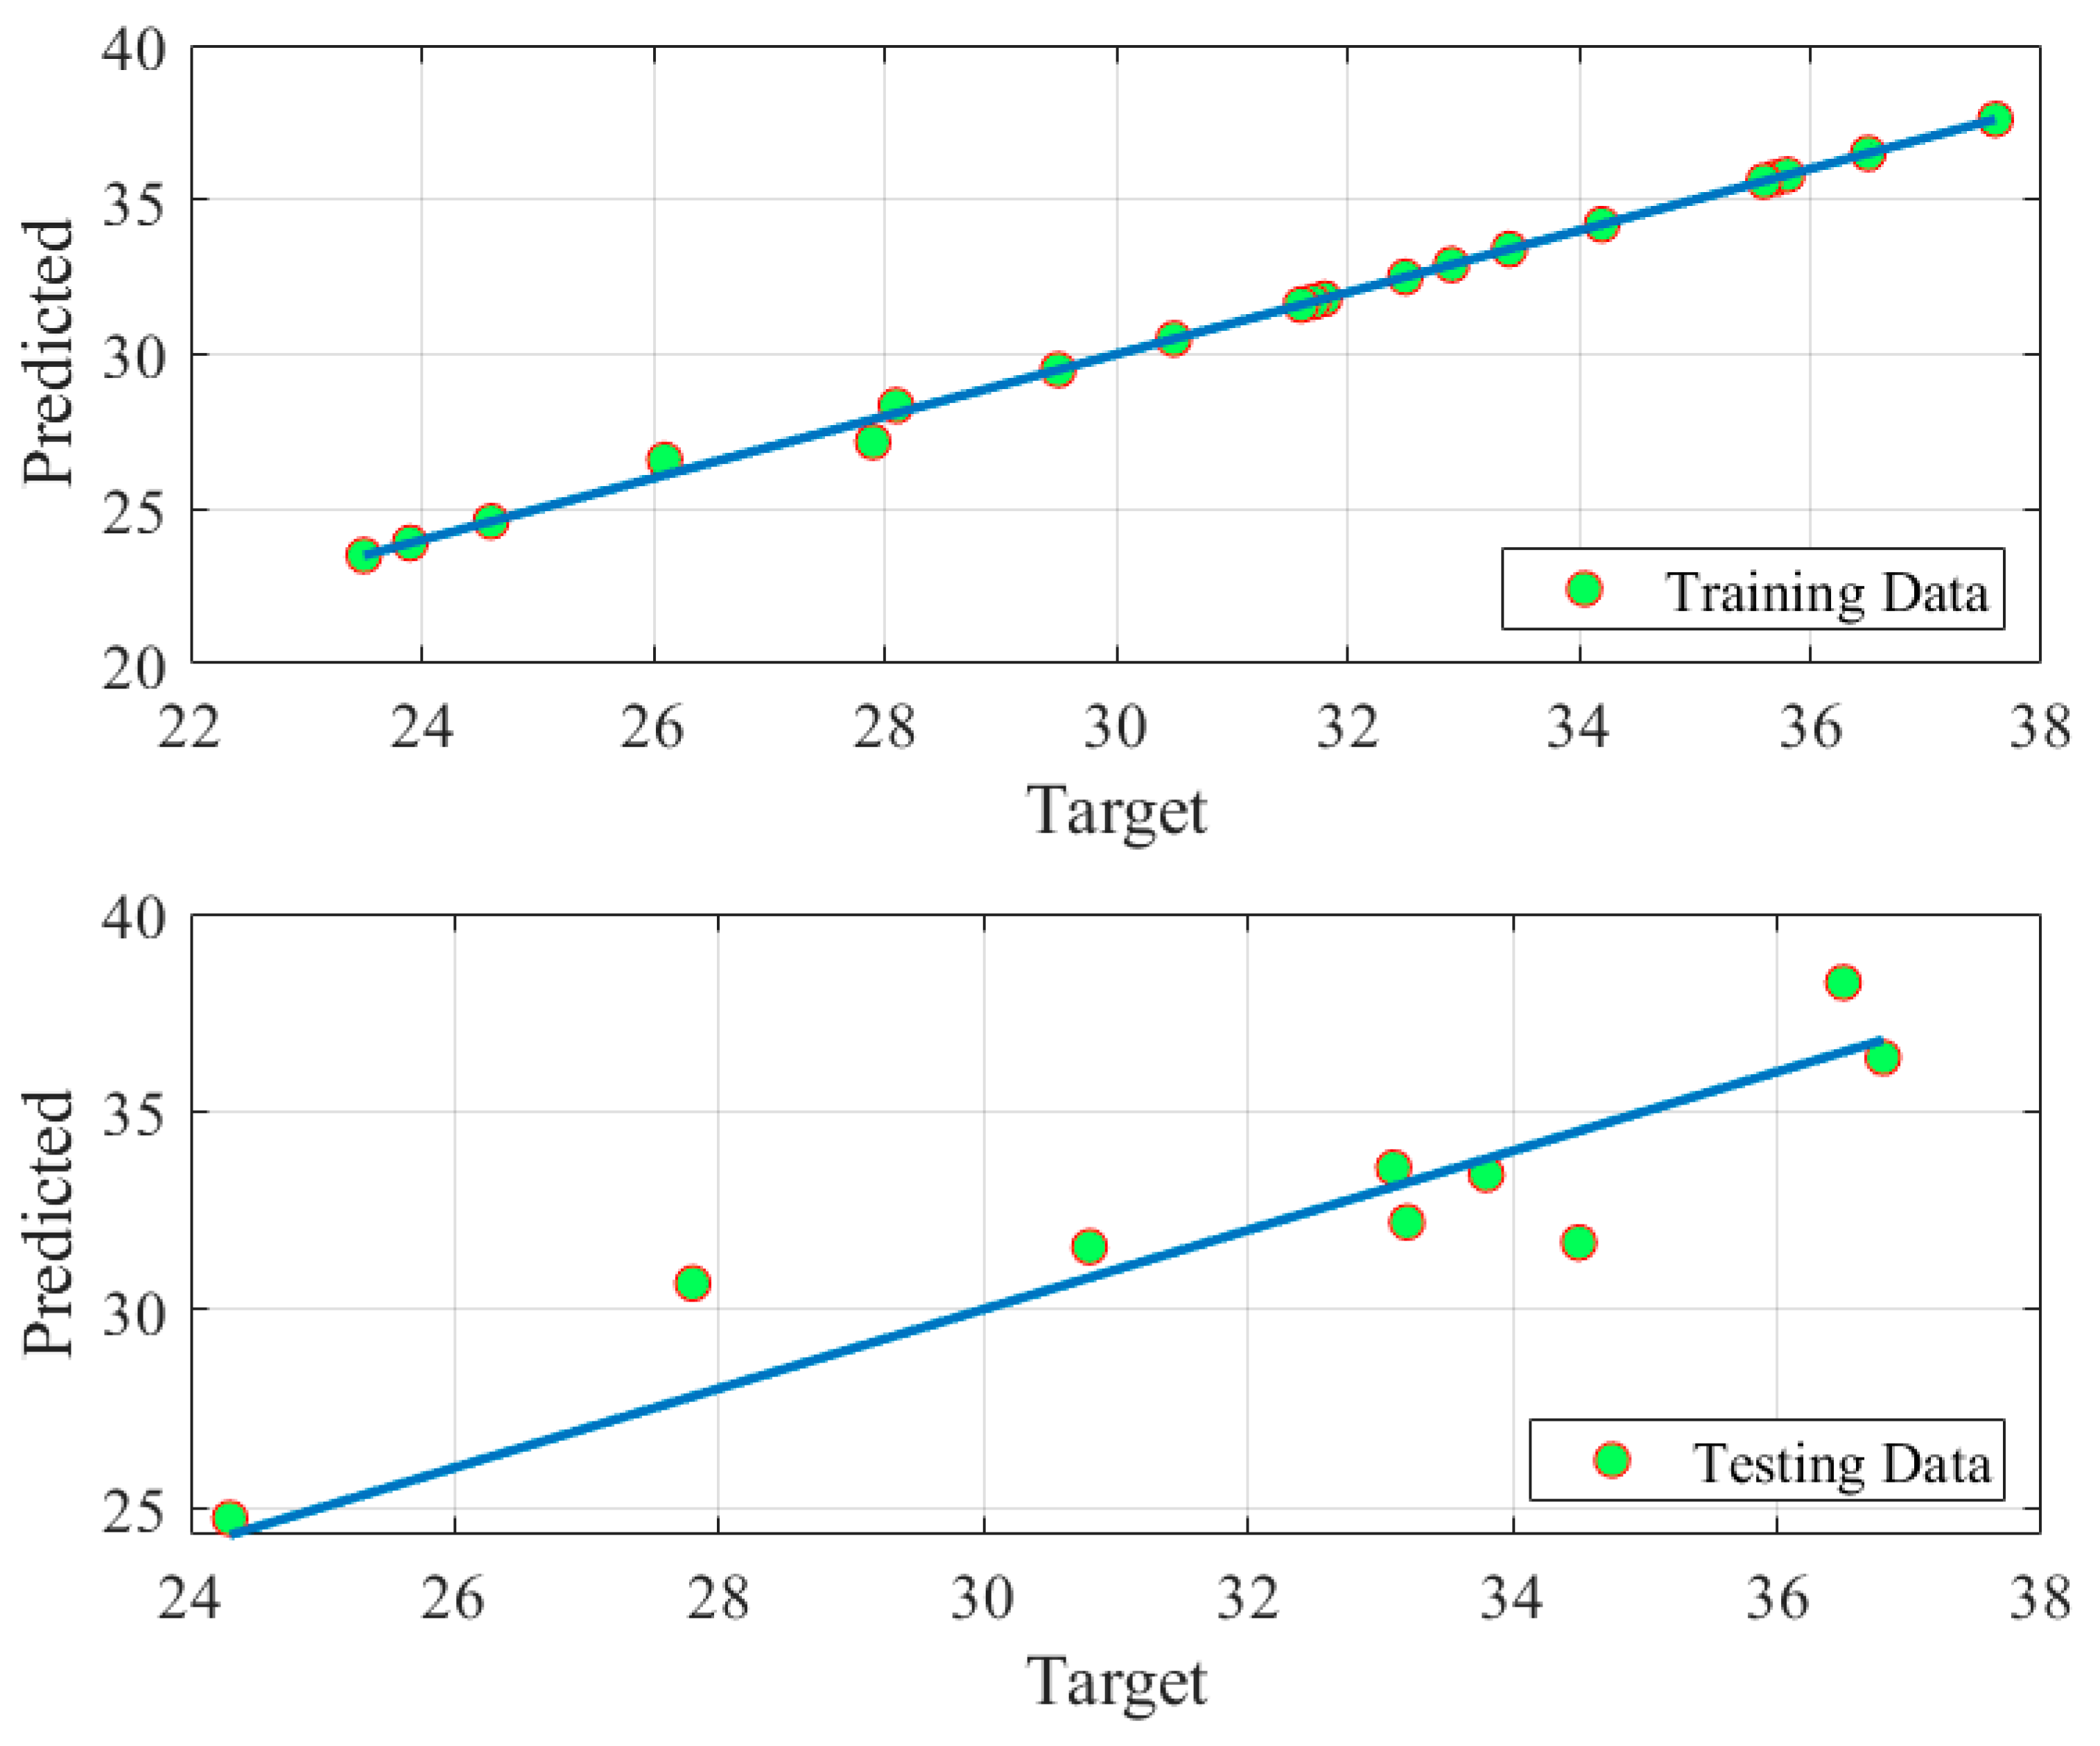
| RMSE | R2 | ||||
|---|---|---|---|---|---|
| Train | Test | All | Train | Test | All |
| 0.1982 | 1.5460 | 0.8628 | 0.9977 | 0.89 | 0.96 |
| Method | Temperature °C | Methanol Concentration | Oxygen Flow Rate (mL/min) | Maximum Power Density (mW/cm2) | Percentage Error (%) |
|---|---|---|---|---|---|
| Exp. [46] | 70 | 1 | 300 | 36.8 | 0.0 |
| RSM [46] | 70 | 1 | 300 | 38.1 | 3.5 |
| Fuzzy | 70 | 1 | 300 | 36.35 | 1.22 |
| Method | Temperature °C | Methanol Concentration | Oxygen Flow Rate (mL/min) | Maximum Power Density (mW/cm2) |
|---|---|---|---|---|
| Exp. [46] | 70 | 1 | 300 | 37.6 |
| RSM [46] | 70 | 1 | 300 | 38.1 |
| Fuzzy and BAS | 75 | 1.2 | 400 | 40.94 |
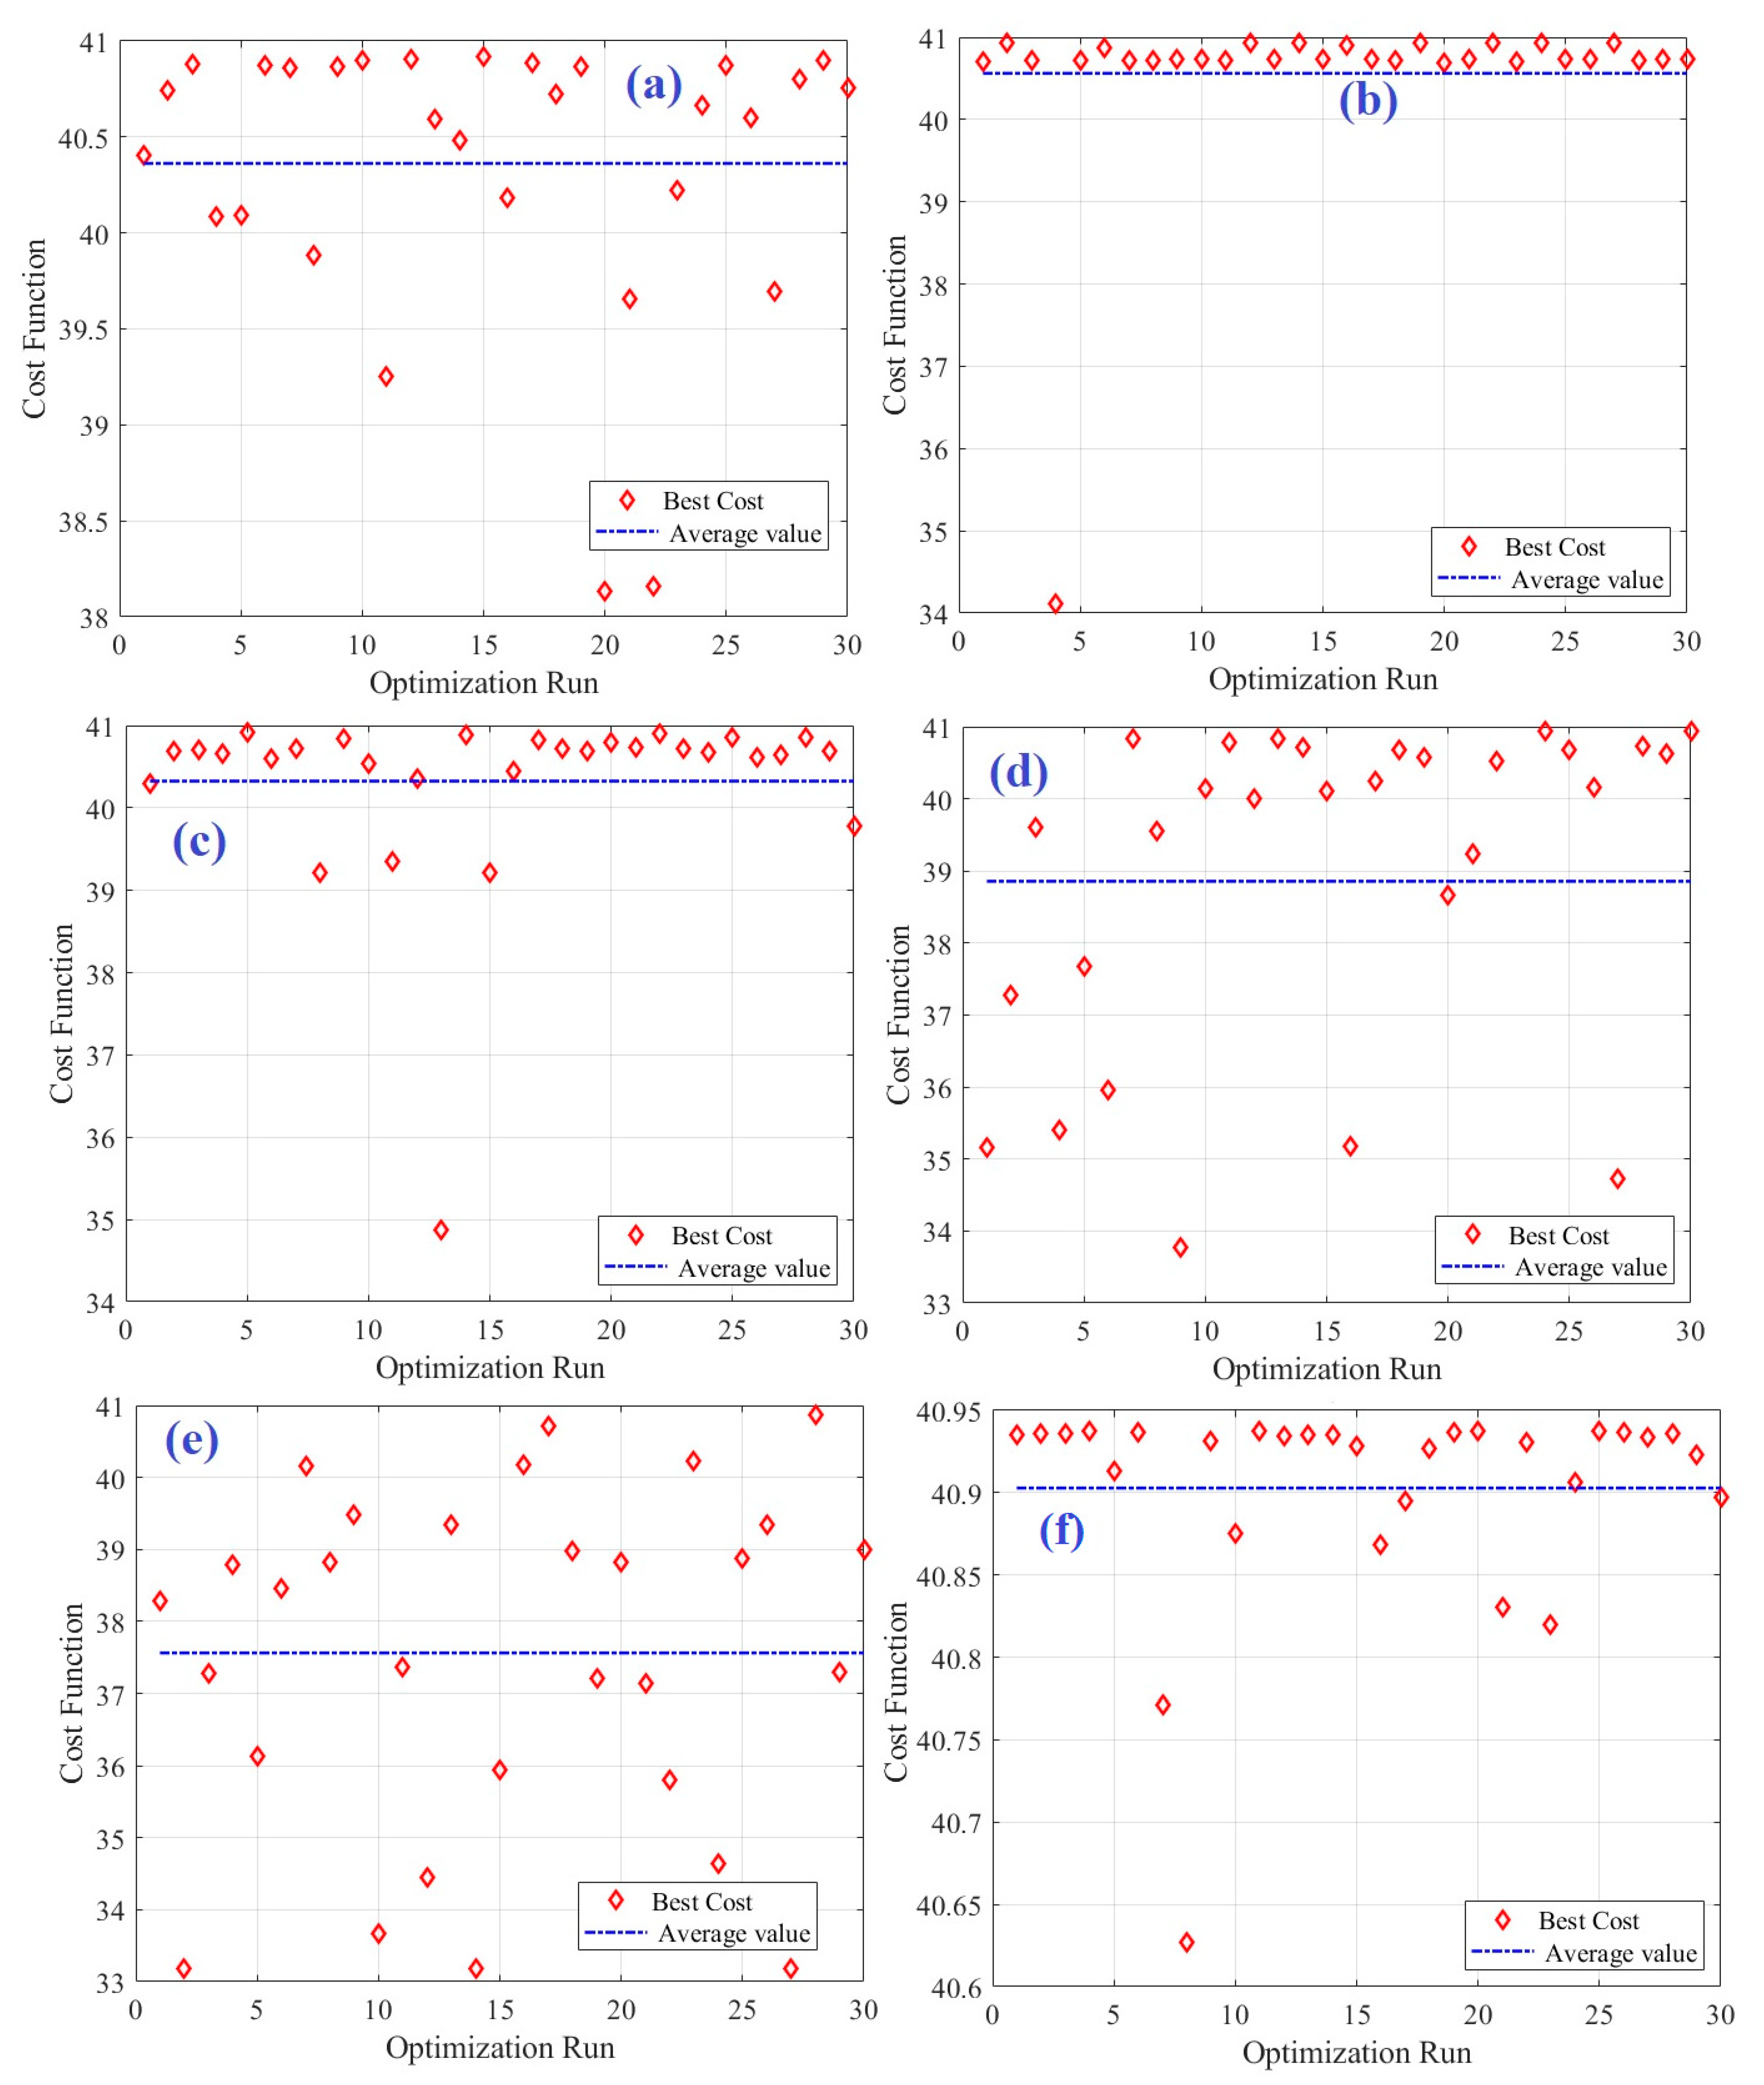
| No. | SCA | PSO | GA | BAS | JS | HHO | No. | SCA | PSO | GA | BAS | JS | HHO |
|---|---|---|---|---|---|---|---|---|---|---|---|---|---|
| 1 | 40.41 | 40.7 | 38.28 | 40.94 | 40.29 | 35.16 | 16 | 40.18 | 40.9 | 40.17 | 40.87 | 40.44 | 35.18 |
| 2 | 40.74 | 40.93 | 33.19 | 40.94 | 40.69 | 37.28 | 17 | 40.89 | 40.73 | 40.71 | 40.89 | 40.82 | 40.25 |
| 3 | 40.88 | 40.72 | 37.27 | 40.94 | 40.71 | 39.6 | 18 | 40.72 | 40.72 | 38.98 | 40.93 | 40.72 | 40.68 |
| 4 | 40.09 | 34.12 | 38.78 | 40.94 | 40.66 | 35.41 | 19 | 40.87 | 40.94 | 37.2 | 40.94 | 40.69 | 40.58 |
| 5 | 40.09 | 40.72 | 36.14 | 40.91 | 40.92 | 37.68 | 20 | 38.13 | 40.69 | 38.83 | 40.94 | 40.8 | 38.67 |
| 6 | 40.87 | 40.87 | 38.46 | 40.94 | 40.6 | 35.96 | 21 | 39.66 | 40.73 | 37.14 | 40.83 | 40.73 | 39.24 |
| 7 | 40.86 | 40.73 | 40.15 | 40.77 | 40.72 | 40.84 | 22 | 38.16 | 40.94 | 35.8 | 40.93 | 40.91 | 40.53 |
| 8 | 39.88 | 40.73 | 38.83 | 40.63 | 39.21 | 39.55 | 23 | 40.22 | 40.7 | 40.23 | 40.82 | 40.72 | 33.96 |
| 9 | 40.87 | 40.73 | 39.49 | 40.93 | 40.84 | 33.77 | 24 | 40.66 | 40.93 | 34.64 | 40.91 | 40.68 | 40.93 |
| 10 | 40.9 | 40.73 | 33.67 | 40.88 | 40.54 | 40.14 | 25 | 40.87 | 40.73 | 38.87 | 40.94 | 40.85 | 40.69 |
| 11 | 39.25 | 40.72 | 37.37 | 40.94 | 39.35 | 40.79 | 26 | 40.6 | 40.73 | 39.35 | 40.94 | 40.62 | 40.16 |
| 12 | 40.91 | 40.94 | 34.45 | 40.93 | 40.35 | 40 | 27 | 39.7 | 40.93 | 33.19 | 40.93 | 40.64 | 34.73 |
| 13 | 40.59 | 40.73 | 39.35 | 40.93 | 34.87 | 40.84 | 28 | 40.8 | 40.72 | 40.88 | 40.94 | 40.85 | 40.73 |
| 14 | 40.48 | 40.93 | 33.19 | 40.93 | 40.88 | 40.72 | 29 | 40.9 | 40.73 | 37.29 | 40.92 | 40.7 | 40.62 |
| 15 | 40.92 | 40.73 | 35.95 | 40.93 | 39.21 | 40.11 | 30 | 40.75 | 40.73 | 39 | 40.9 | 39.77 | 40.94 |
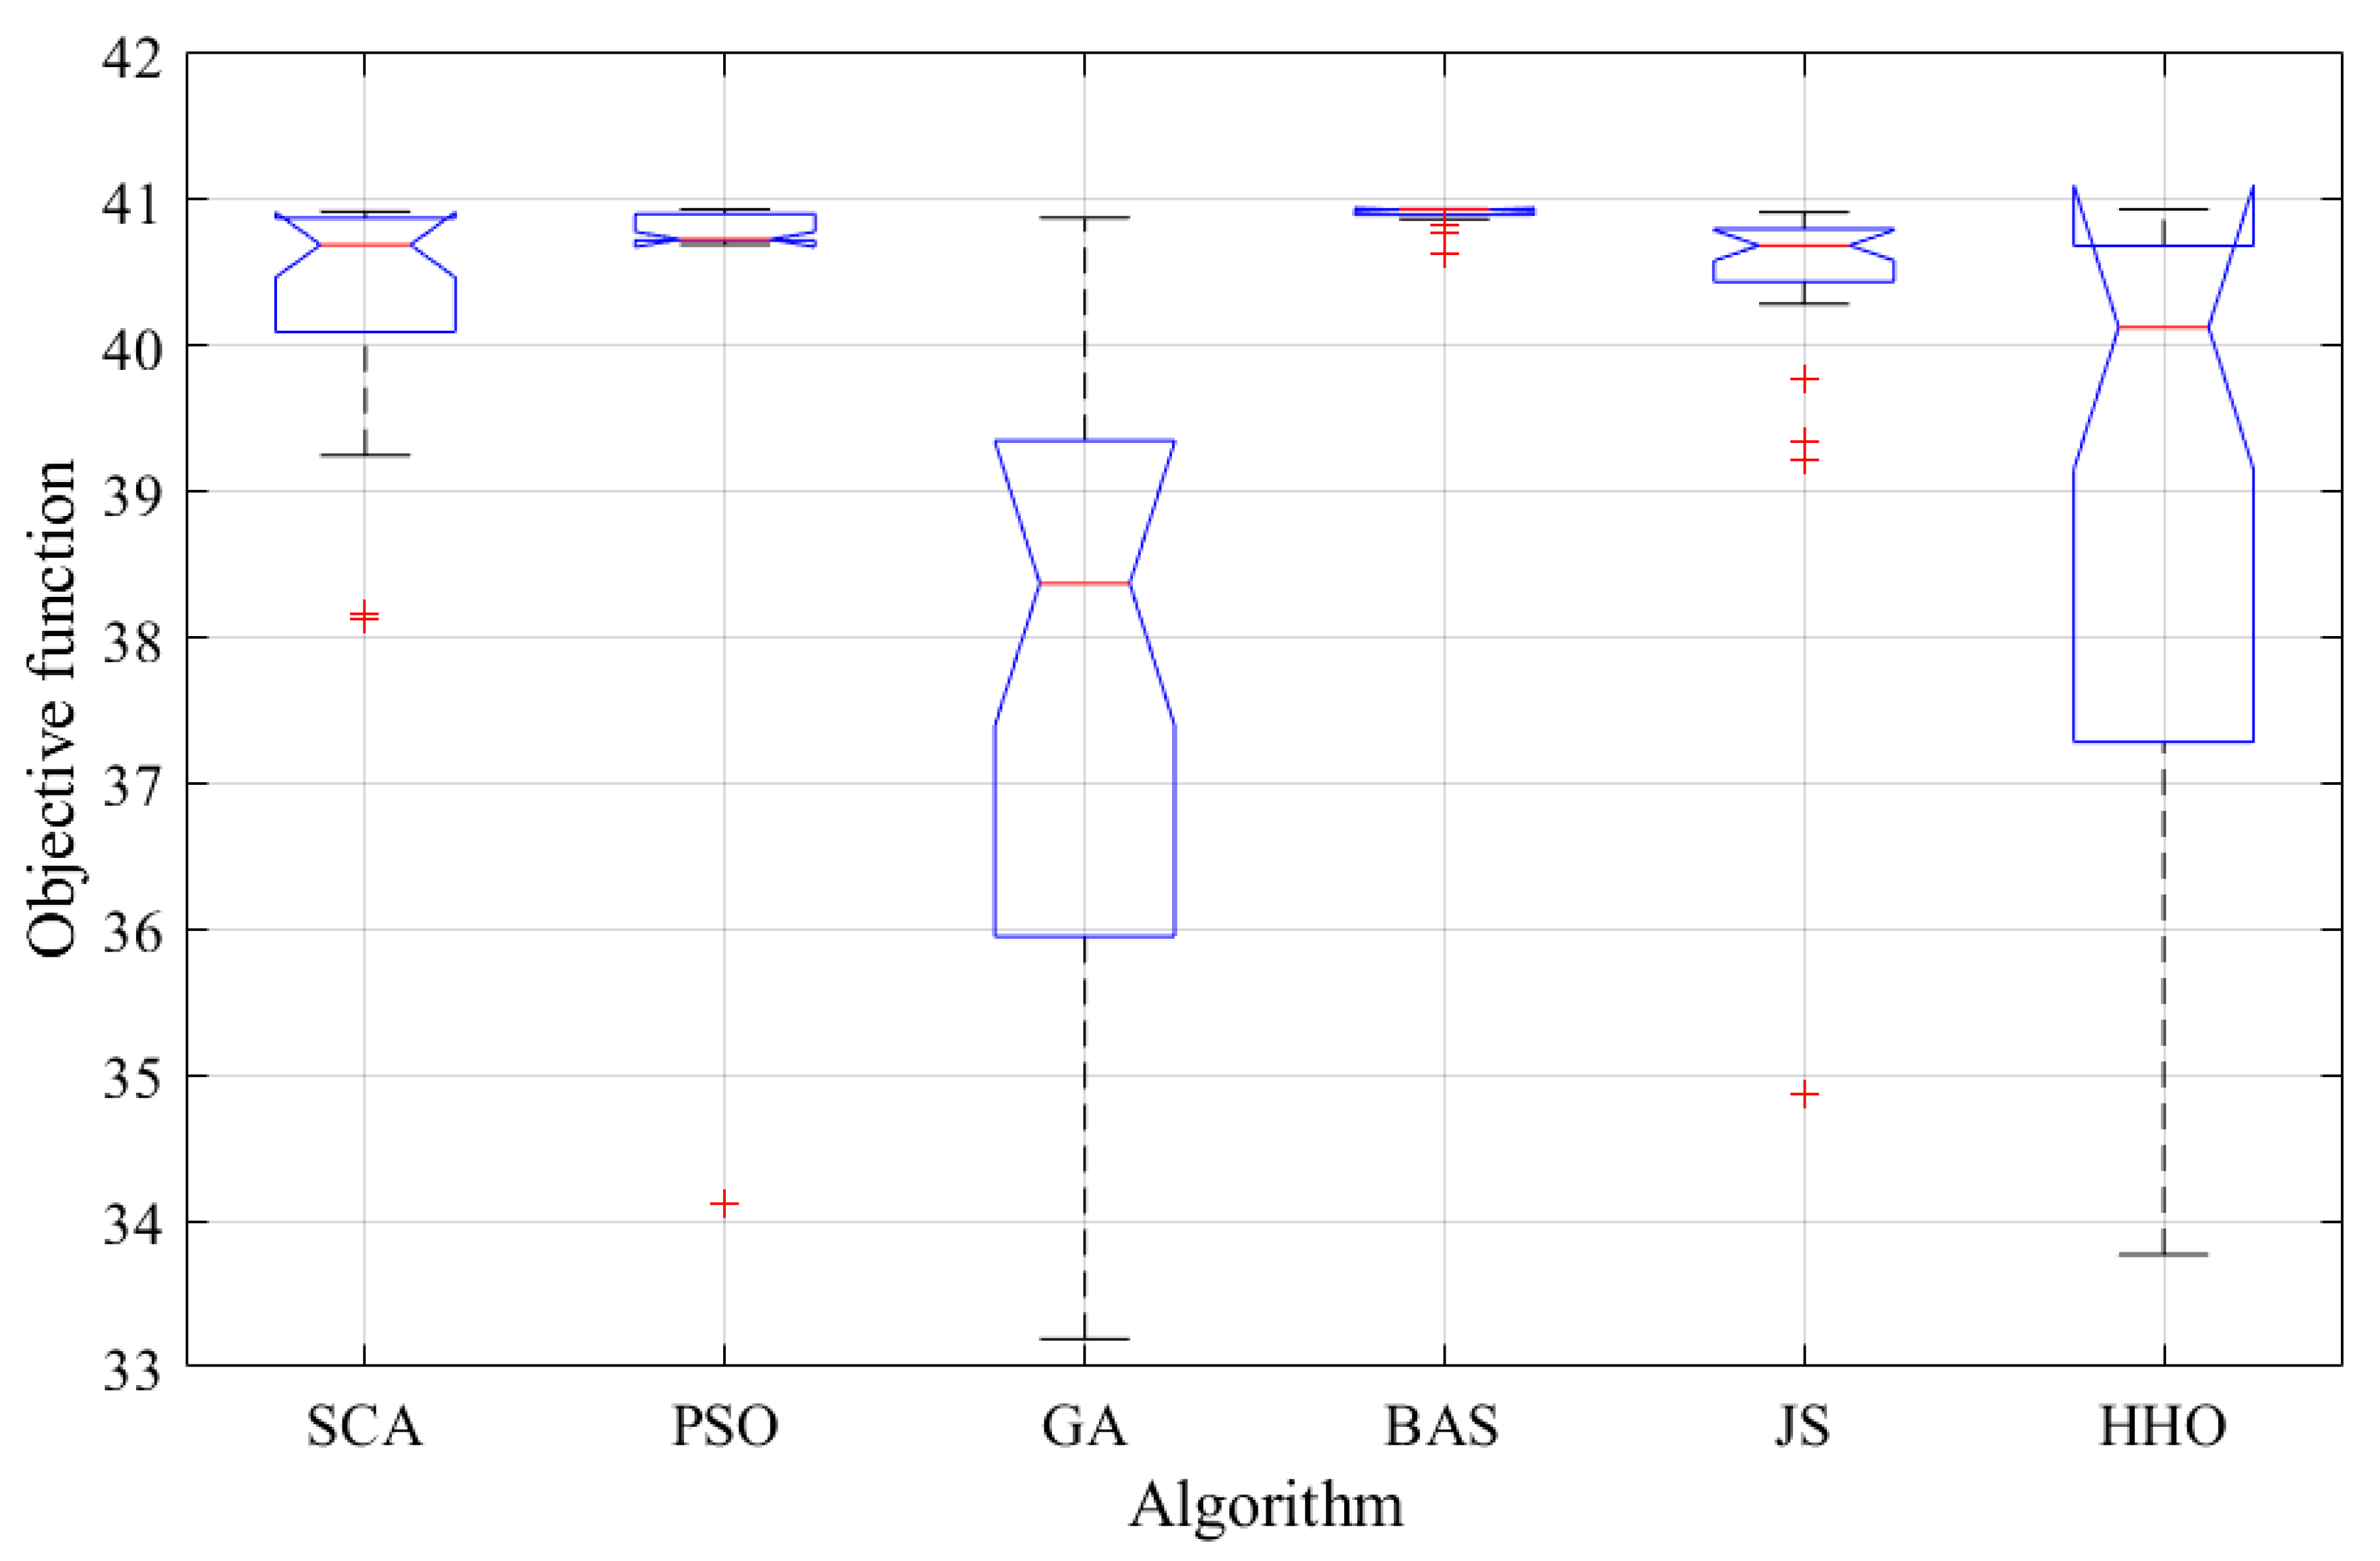
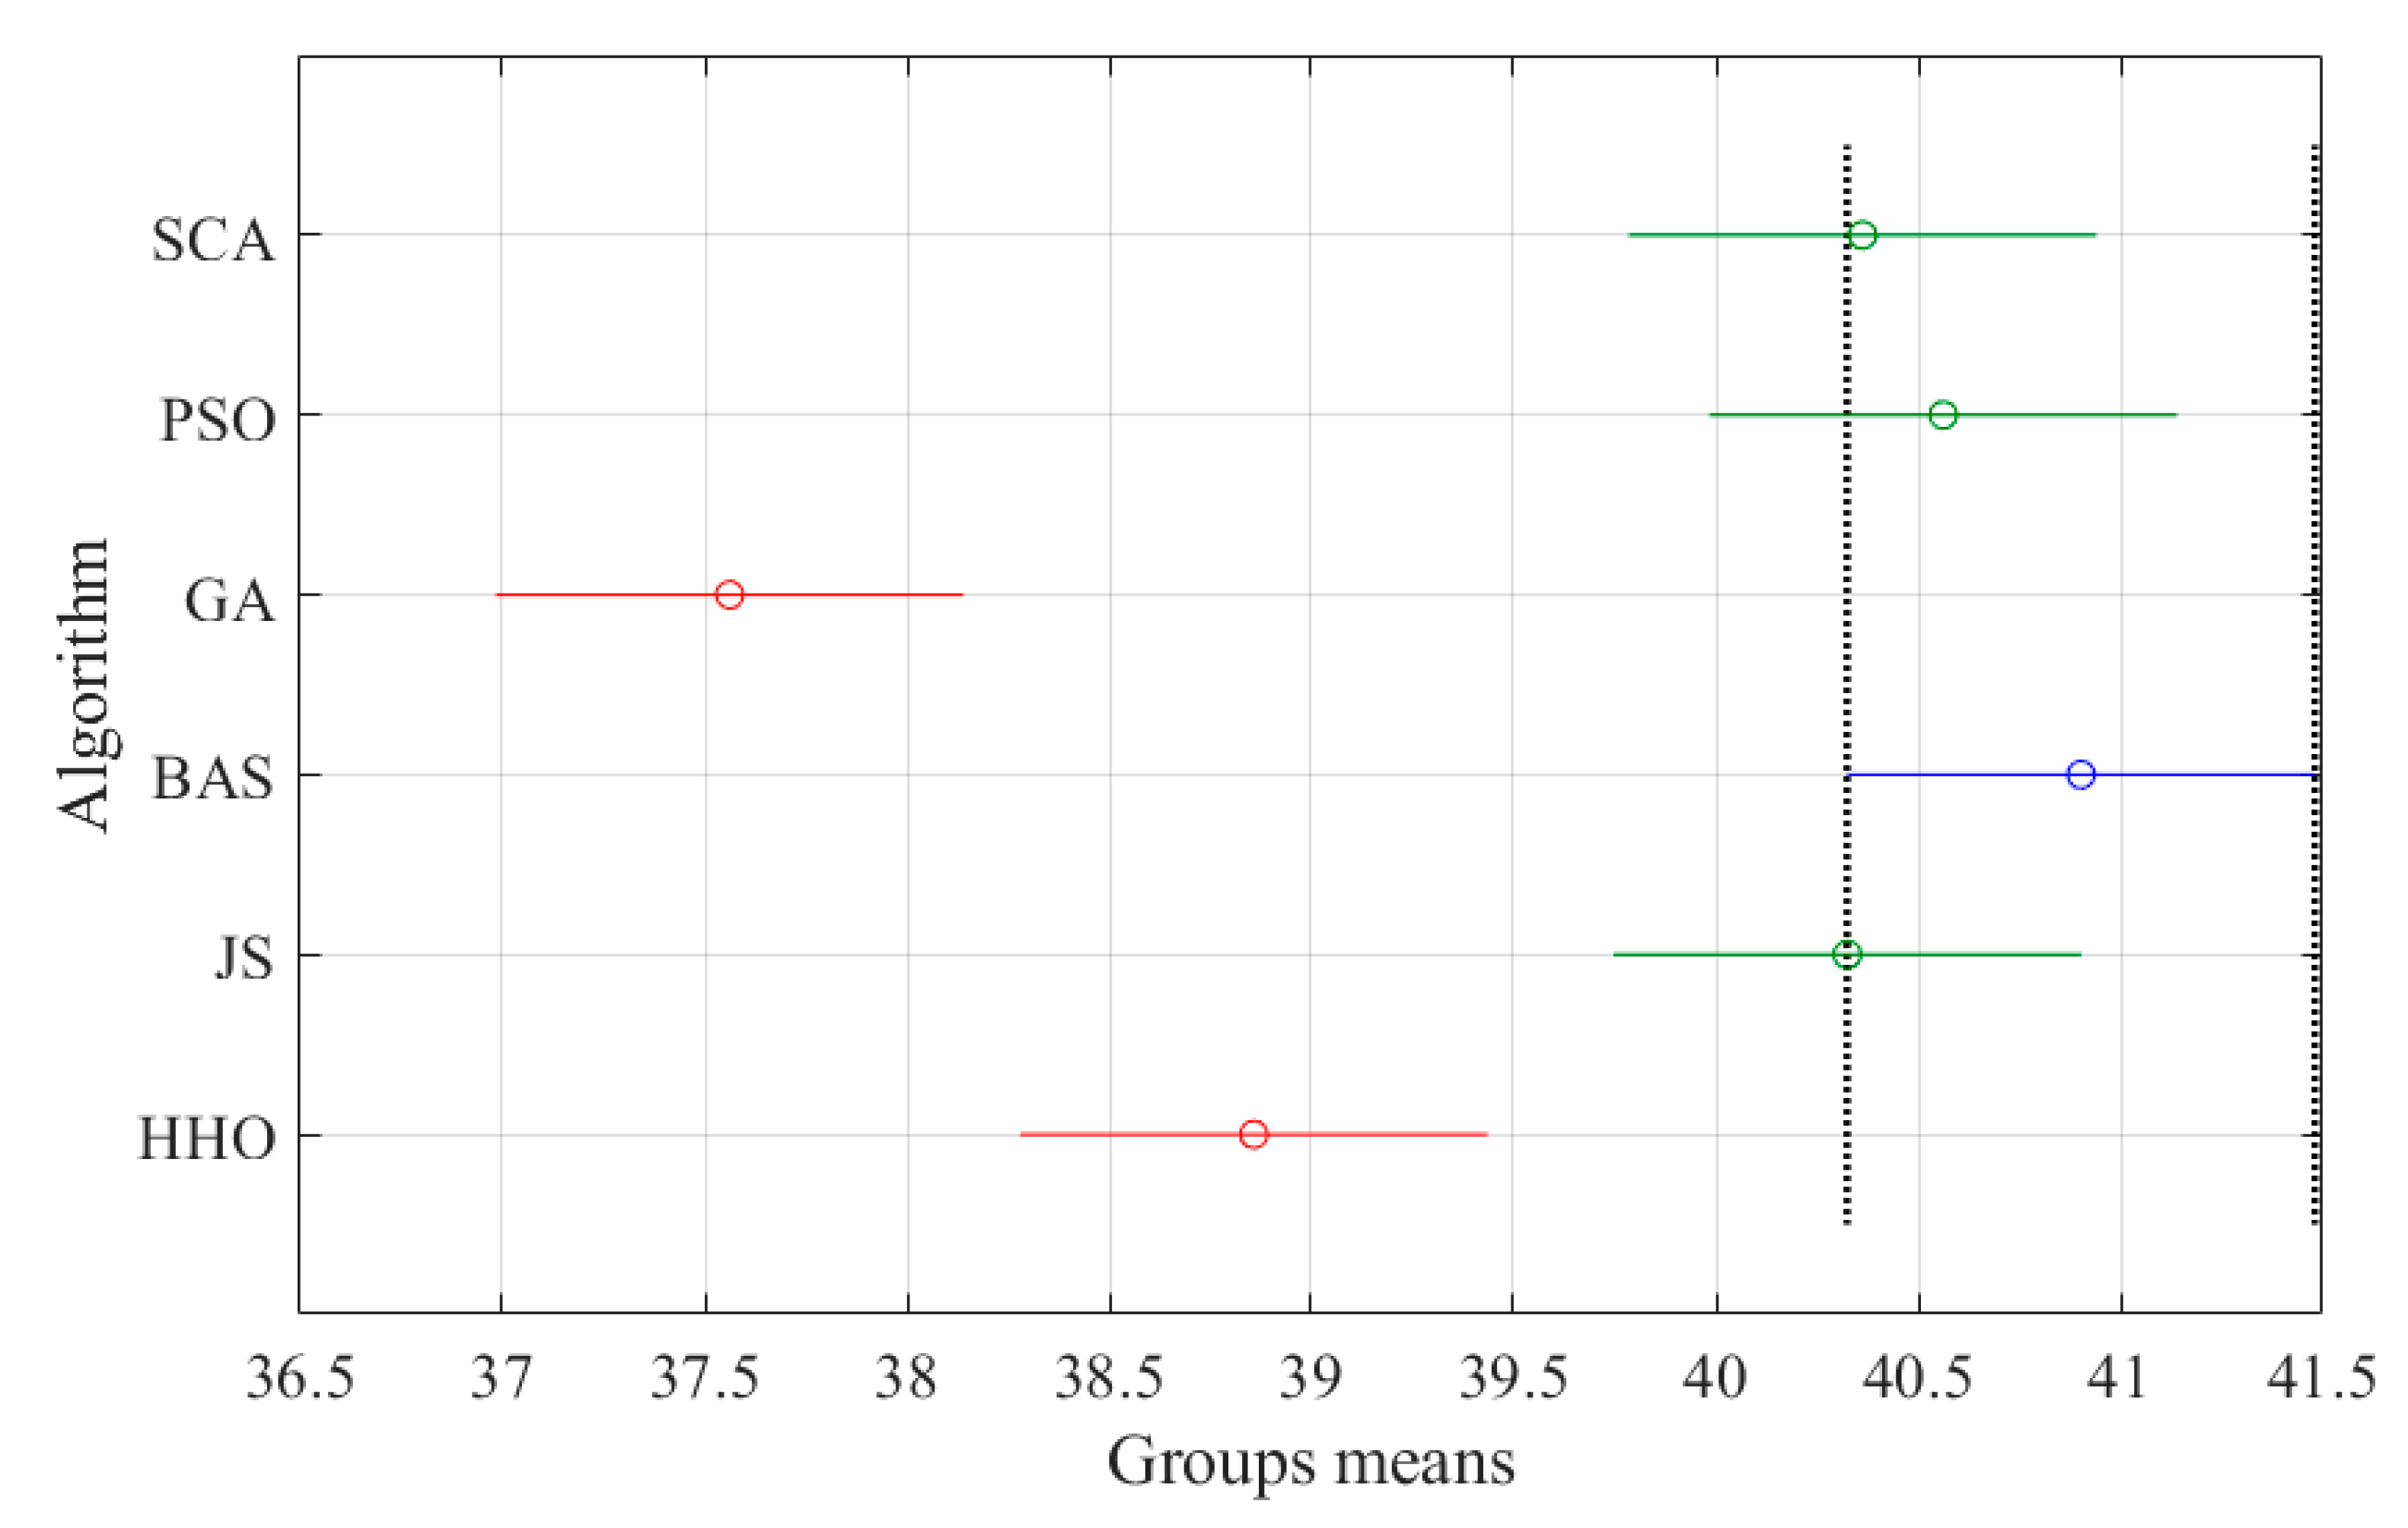
| SCA | PSO | GA | BAS | JS | HHO | |
|---|---|---|---|---|---|---|
| Best | 40.92 | 40.94 | 40.88 | 40.94 | 40.92 | 40.94 |
| Worst | 38.13 | 34.12 | 33.19 | 40.63 | 34.87 | 33.77 |
| Mean | 40.36 | 40.56 | 37.56 | 40.9 | 40.33 | 38.86 |
| STD | 0.74 | 1.2 | 2.33 | 0.07 | 1.12 | 2.38 |
| Source | df | SS | MS | F | Prob |
|---|---|---|---|---|---|
| Columns | 5 | 248.365 | 49,673 | 20.11 | 8.364 × 10⁻¹³ |
| Error | 174 | 429.835 | 2.470 | ||
| Total | 179 | 678.200 |
Disclaimer/Publisher’s Note: The statements, opinions and data contained in all publications are solely those of the individual author(s) and contributor(s) and not of MDPI and/or the editor(s). MDPI and/or the editor(s) disclaim responsibility for any injury to people or property resulting from any ideas, methods, instructions or products referred to in the content. |
© 2023 by the authors. Licensee MDPI, Basel, Switzerland. This article is an open access article distributed under the terms and conditions of the Creative Commons Attribution (CC BY) license (https://creativecommons.org/licenses/by/4.0/).
Share and Cite
Al Shouny, A.; Rezk, H.; Sayed, E.T.; Abdelkareem, M.A.; Issa, U.H.; Miky, Y.; Olabi, A.G. Maximization of Power Density of Direct Methanol Fuel Cell for Greener Energy Generation Using Beetle Antennae Search Algorithm and Fuzzy Modeling. Biomimetics 2023, 8, 557. https://doi.org/10.3390/biomimetics8070557
Al Shouny A, Rezk H, Sayed ET, Abdelkareem MA, Issa UH, Miky Y, Olabi AG. Maximization of Power Density of Direct Methanol Fuel Cell for Greener Energy Generation Using Beetle Antennae Search Algorithm and Fuzzy Modeling. Biomimetics. 2023; 8(7):557. https://doi.org/10.3390/biomimetics8070557
Chicago/Turabian StyleAl Shouny, Ahmed, Hegazy Rezk, Enas Taha Sayed, Mohammad Ali Abdelkareem, Usama Hamed Issa, Yehia Miky, and Abdul Ghani Olabi. 2023. "Maximization of Power Density of Direct Methanol Fuel Cell for Greener Energy Generation Using Beetle Antennae Search Algorithm and Fuzzy Modeling" Biomimetics 8, no. 7: 557. https://doi.org/10.3390/biomimetics8070557
APA StyleAl Shouny, A., Rezk, H., Sayed, E. T., Abdelkareem, M. A., Issa, U. H., Miky, Y., & Olabi, A. G. (2023). Maximization of Power Density of Direct Methanol Fuel Cell for Greener Energy Generation Using Beetle Antennae Search Algorithm and Fuzzy Modeling. Biomimetics, 8(7), 557. https://doi.org/10.3390/biomimetics8070557