


Intelligent Breast Mass Classification Approach Using Archimedes Optimization Algorithm with Deep Learning on Digital Mammograms


Abstract
:1. Introduction
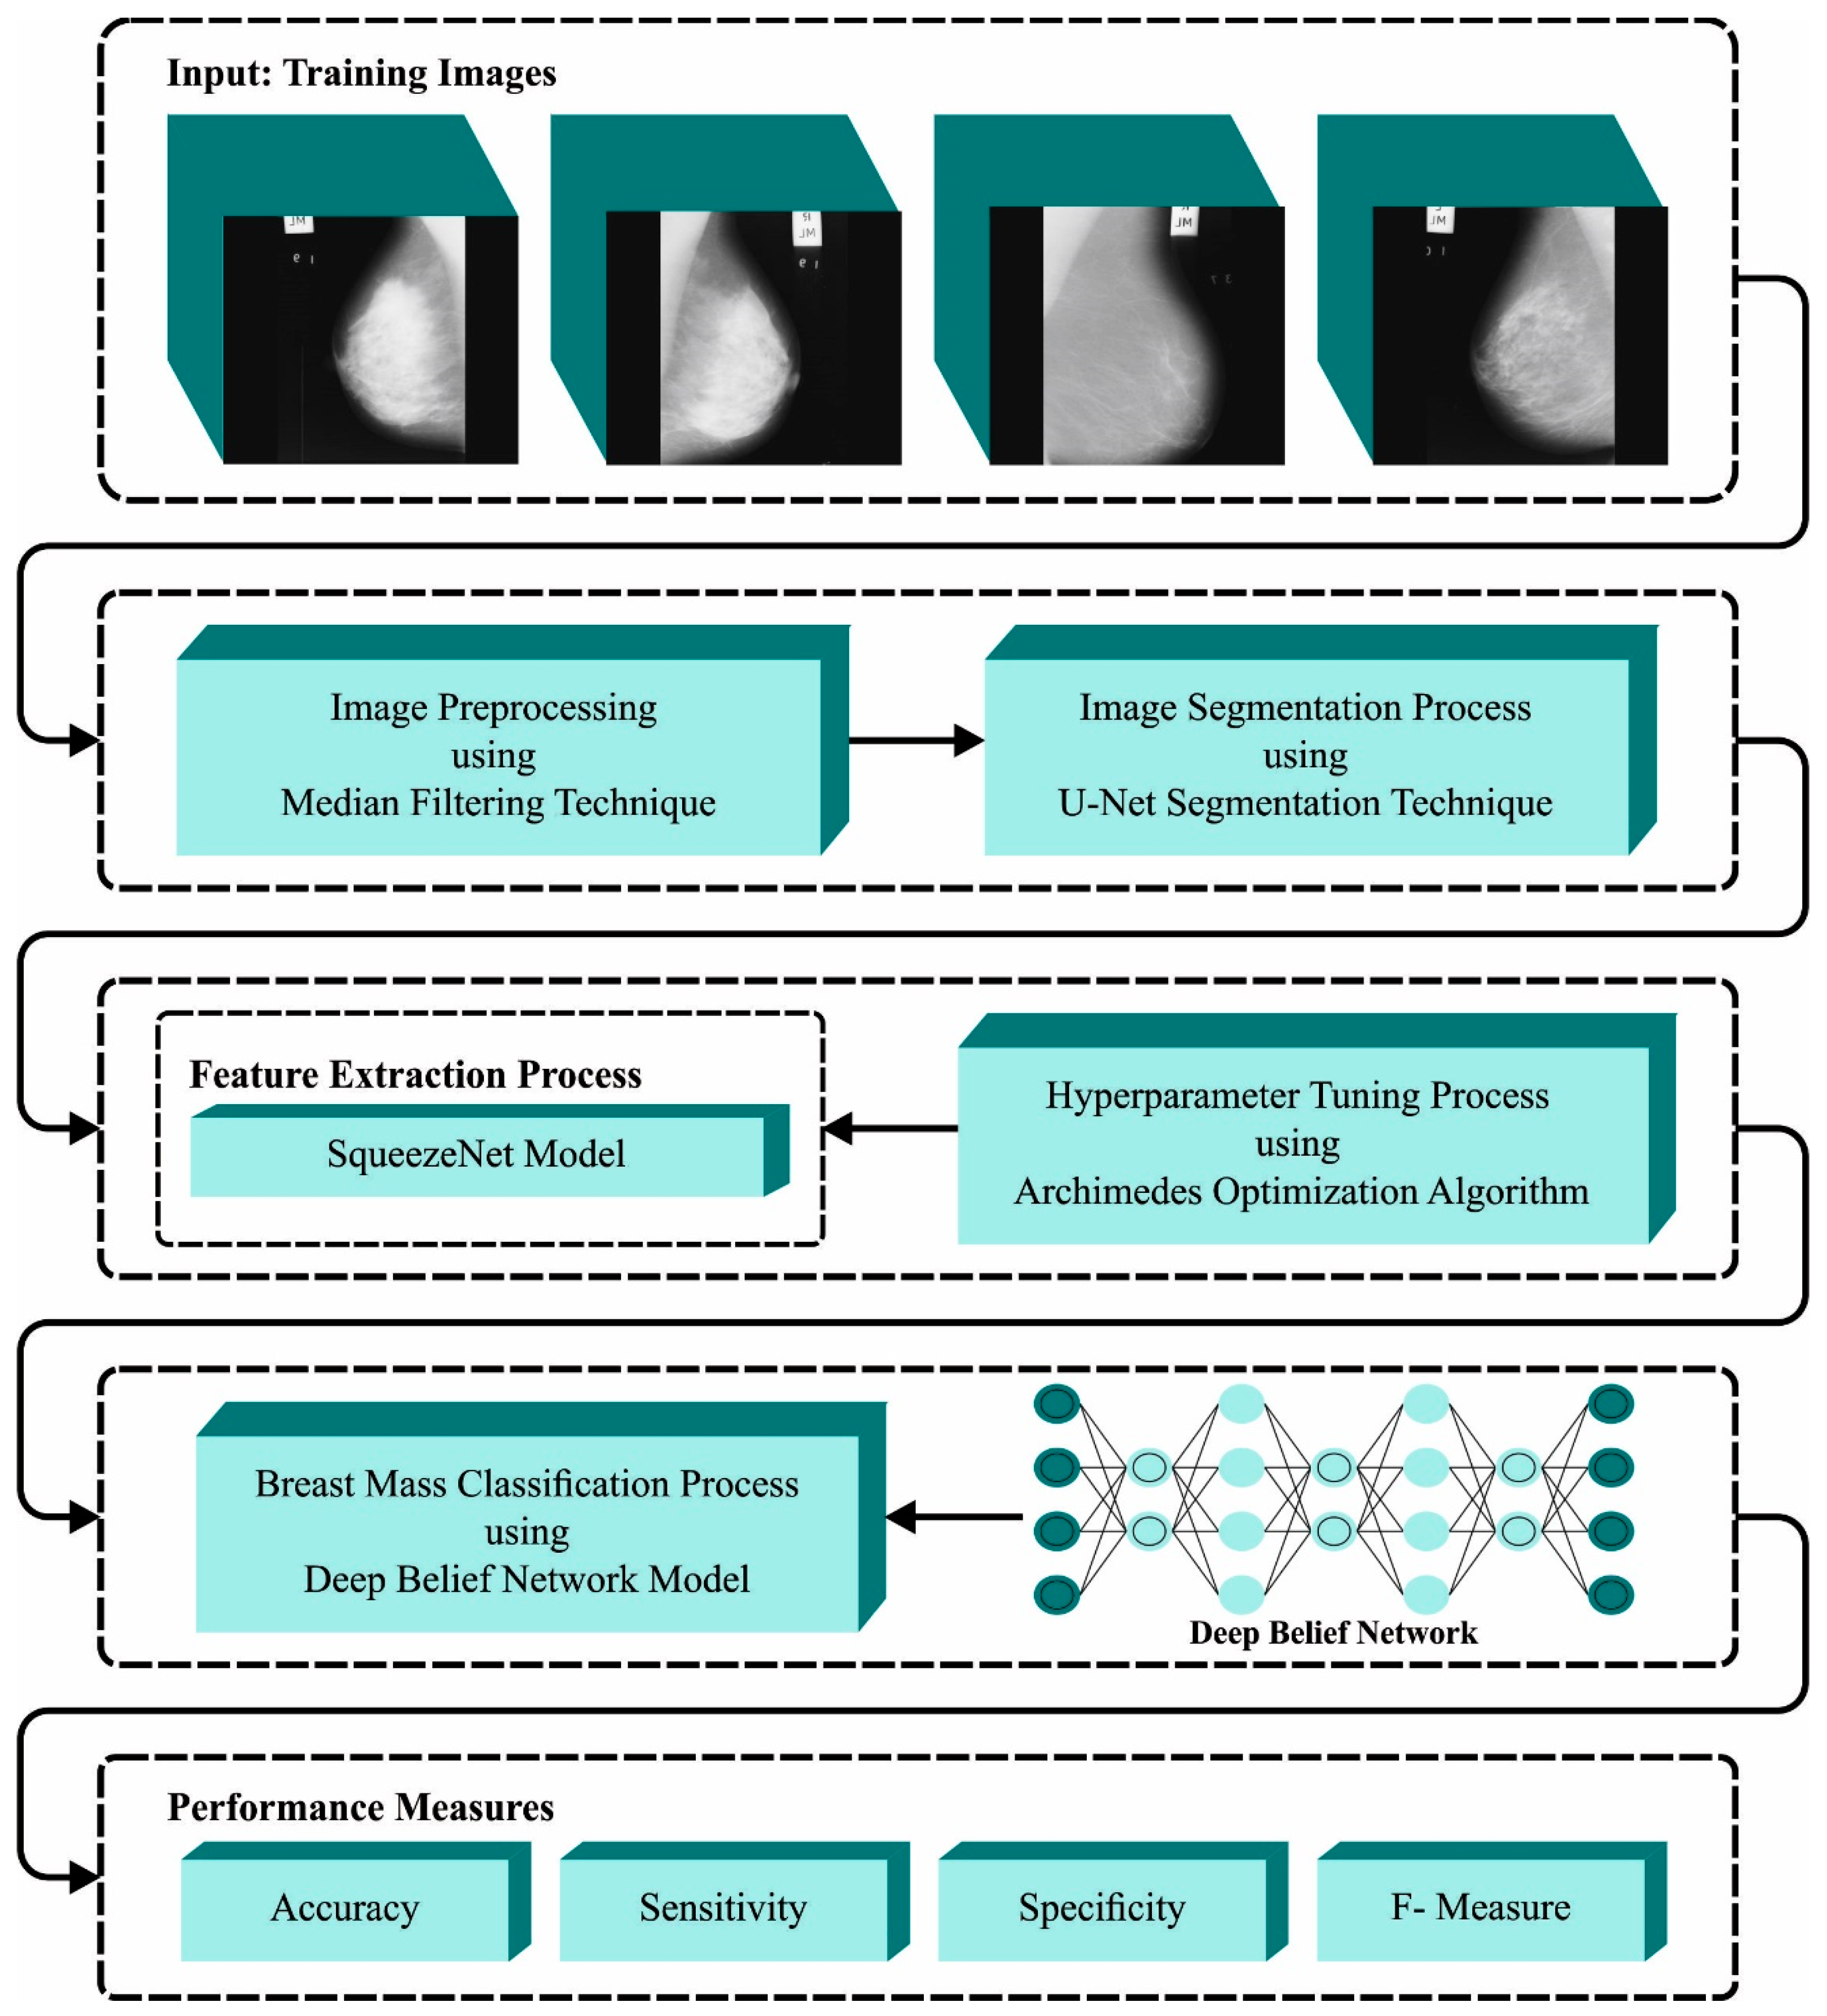
- An Intelligent BMCA-AOADL technique comprising pre-processing, the SqueezeNet feature extractor, AOA-based hyperparameter tuning, and DBN classification of BC has been developed. To the best of our knowledge, the BMCA-AOADL technique did not exist in the literature.
- Pre-processing steps help to enhance the quality of the digital mammograms and isolate the regions of interest, which are the breast masses.
- The SqueezeNet model is employed for the feature extraction process. The SqueezeNet is known for its efficiency and compact architecture, whilst maintaining a competitive performance, making it a suitable choice for resource-constrained applications like medical image analysis.
- AOA with the SqueezeNet model for feature extraction is designed, where the hyperparameter optimization process using cross-validation helps to boost the predictive outcome of the BMCA-AOADL model for unseen data.
- DBNs are employed for the classification process, which have the capability of modeling complex data distributions, making them suitable for BC image classification tasks.
2. Related Works
3. The Proposed Model
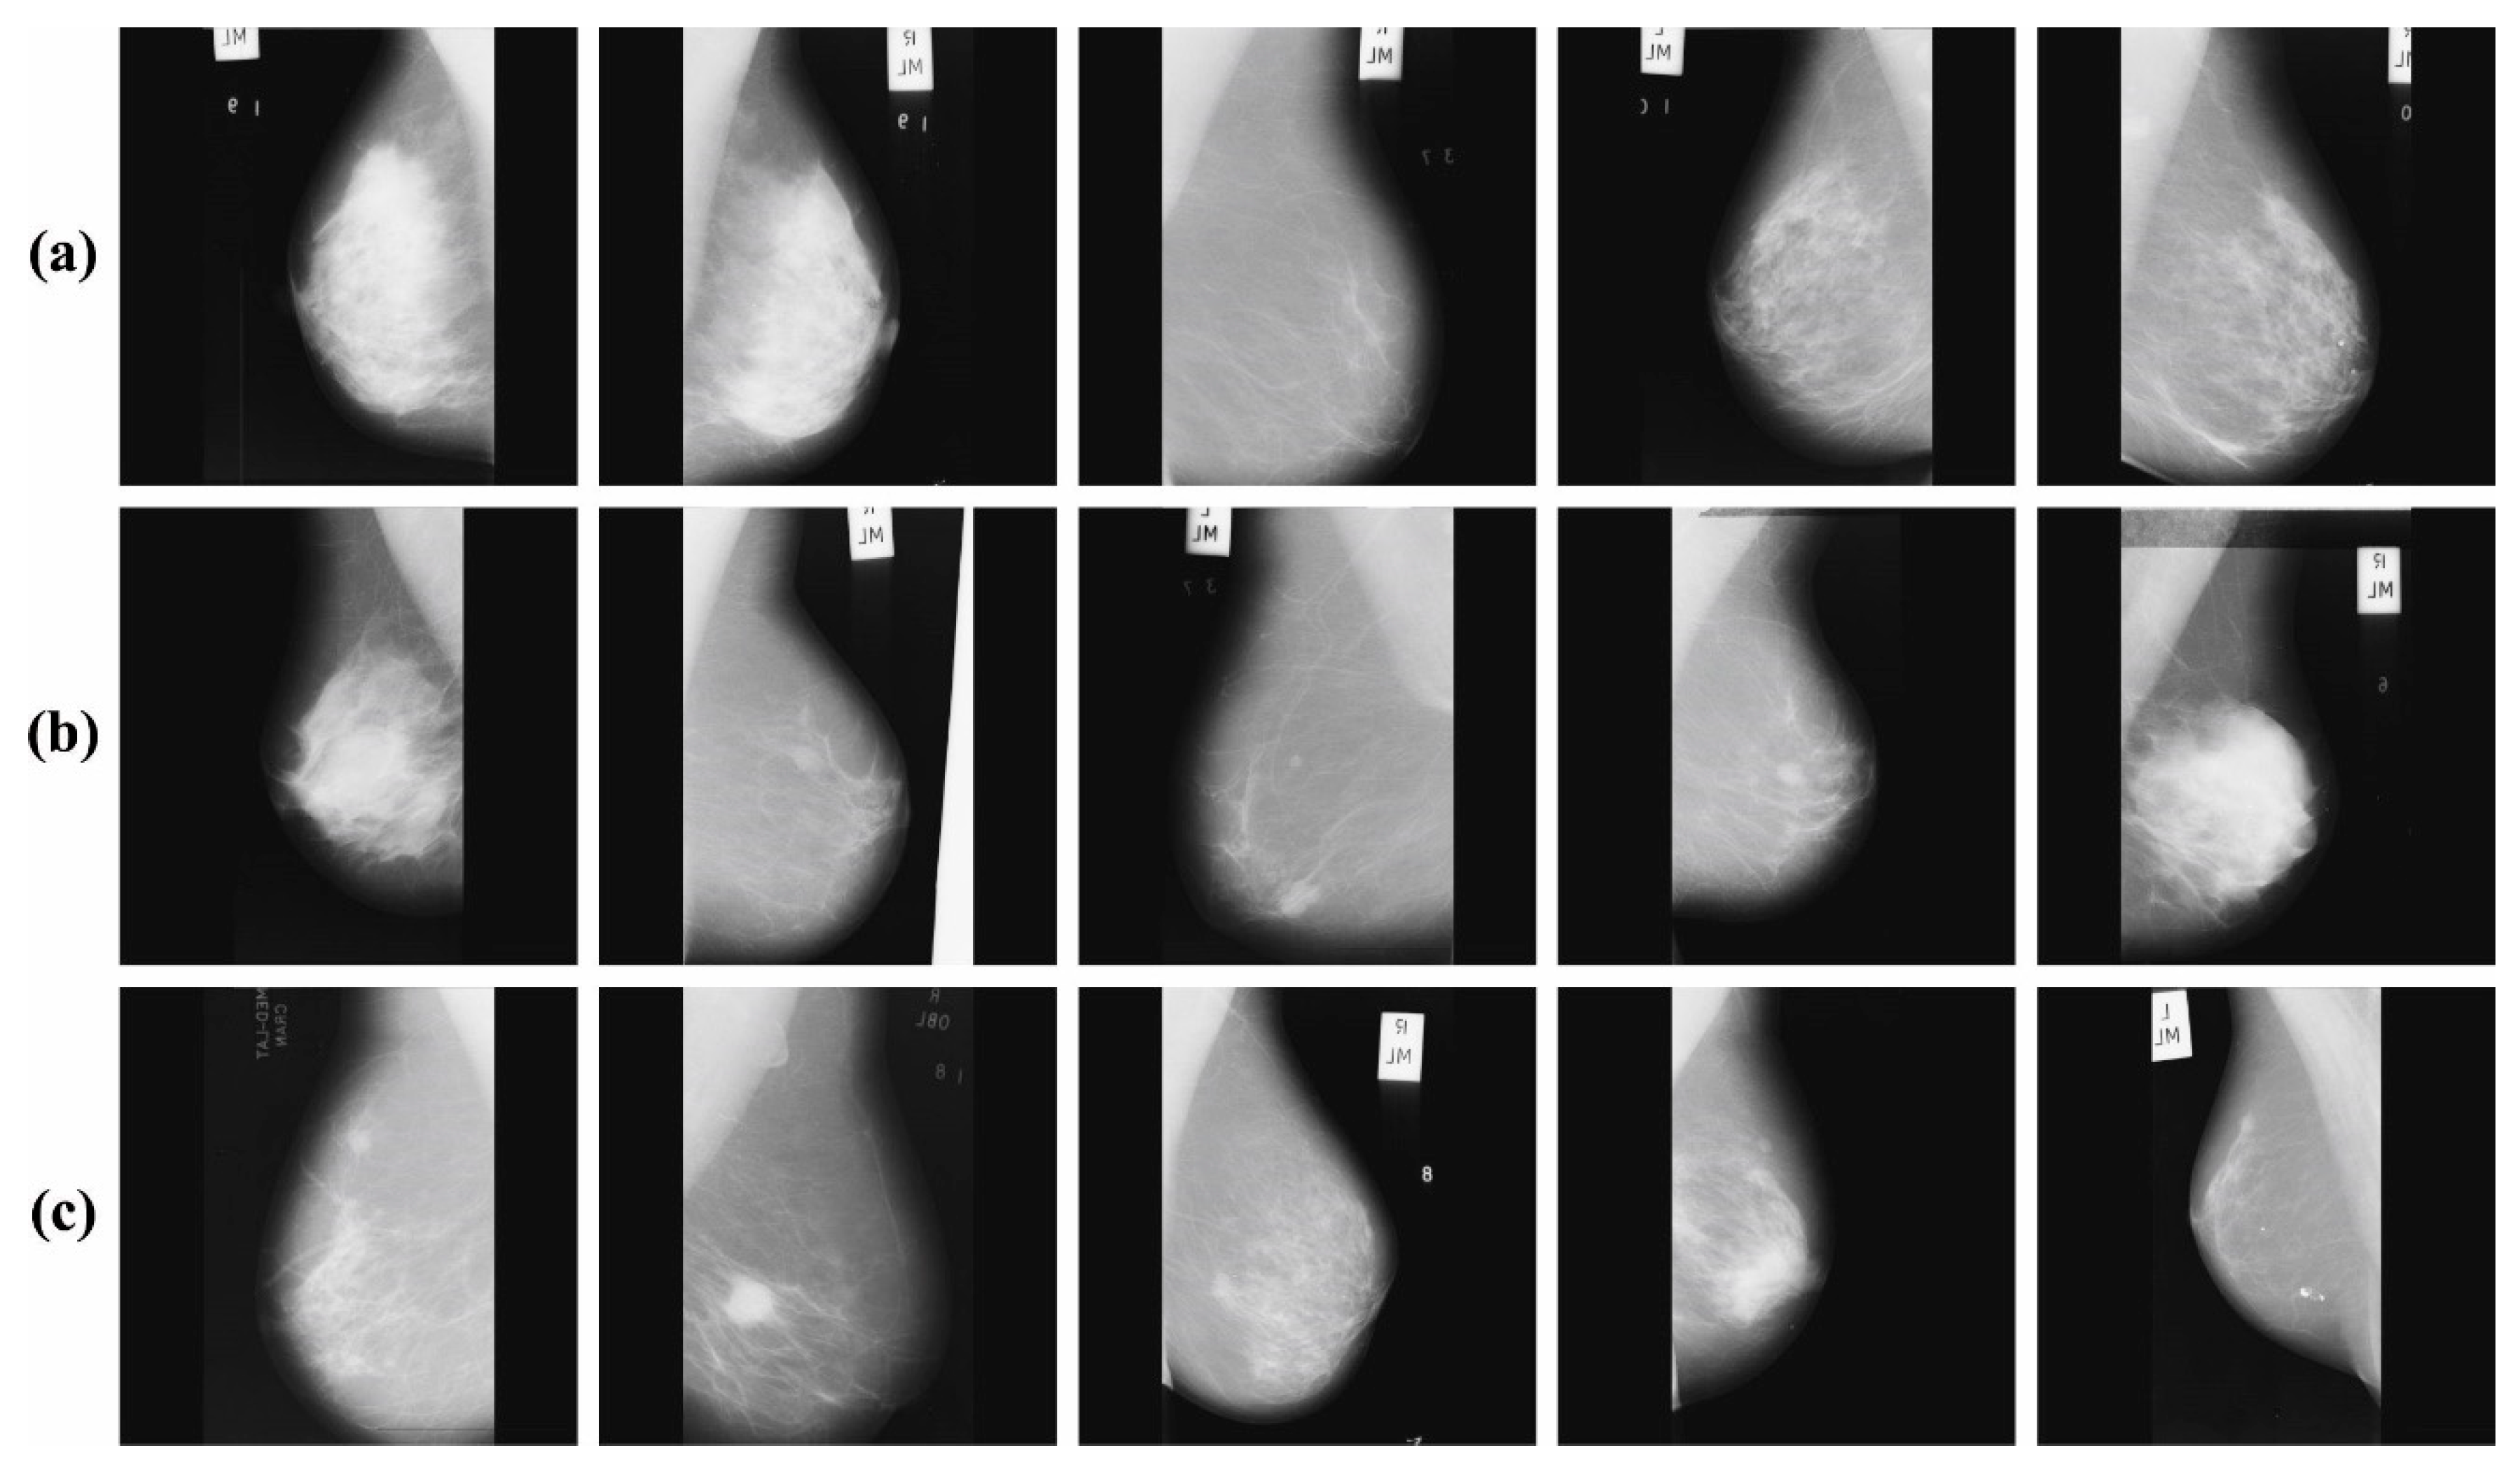
3.1. Image Pre-Processing
- (1)
- Define U-Net structure with the encoding and decoding part;
- (2)
- Input the image to the encoding part and downsample it;
- (3)
- Pass downsampling mapping features to the decoding part;
- (4)
- Upsample the mapping feature and concatenate it with the mapping feature in the respective encoding layer;
- (5)
- Repeat step 4 until image size is attained;
- (6)
- Execute convolution layer to concatenated mapping feature;
- (7)
- Output segmented images.
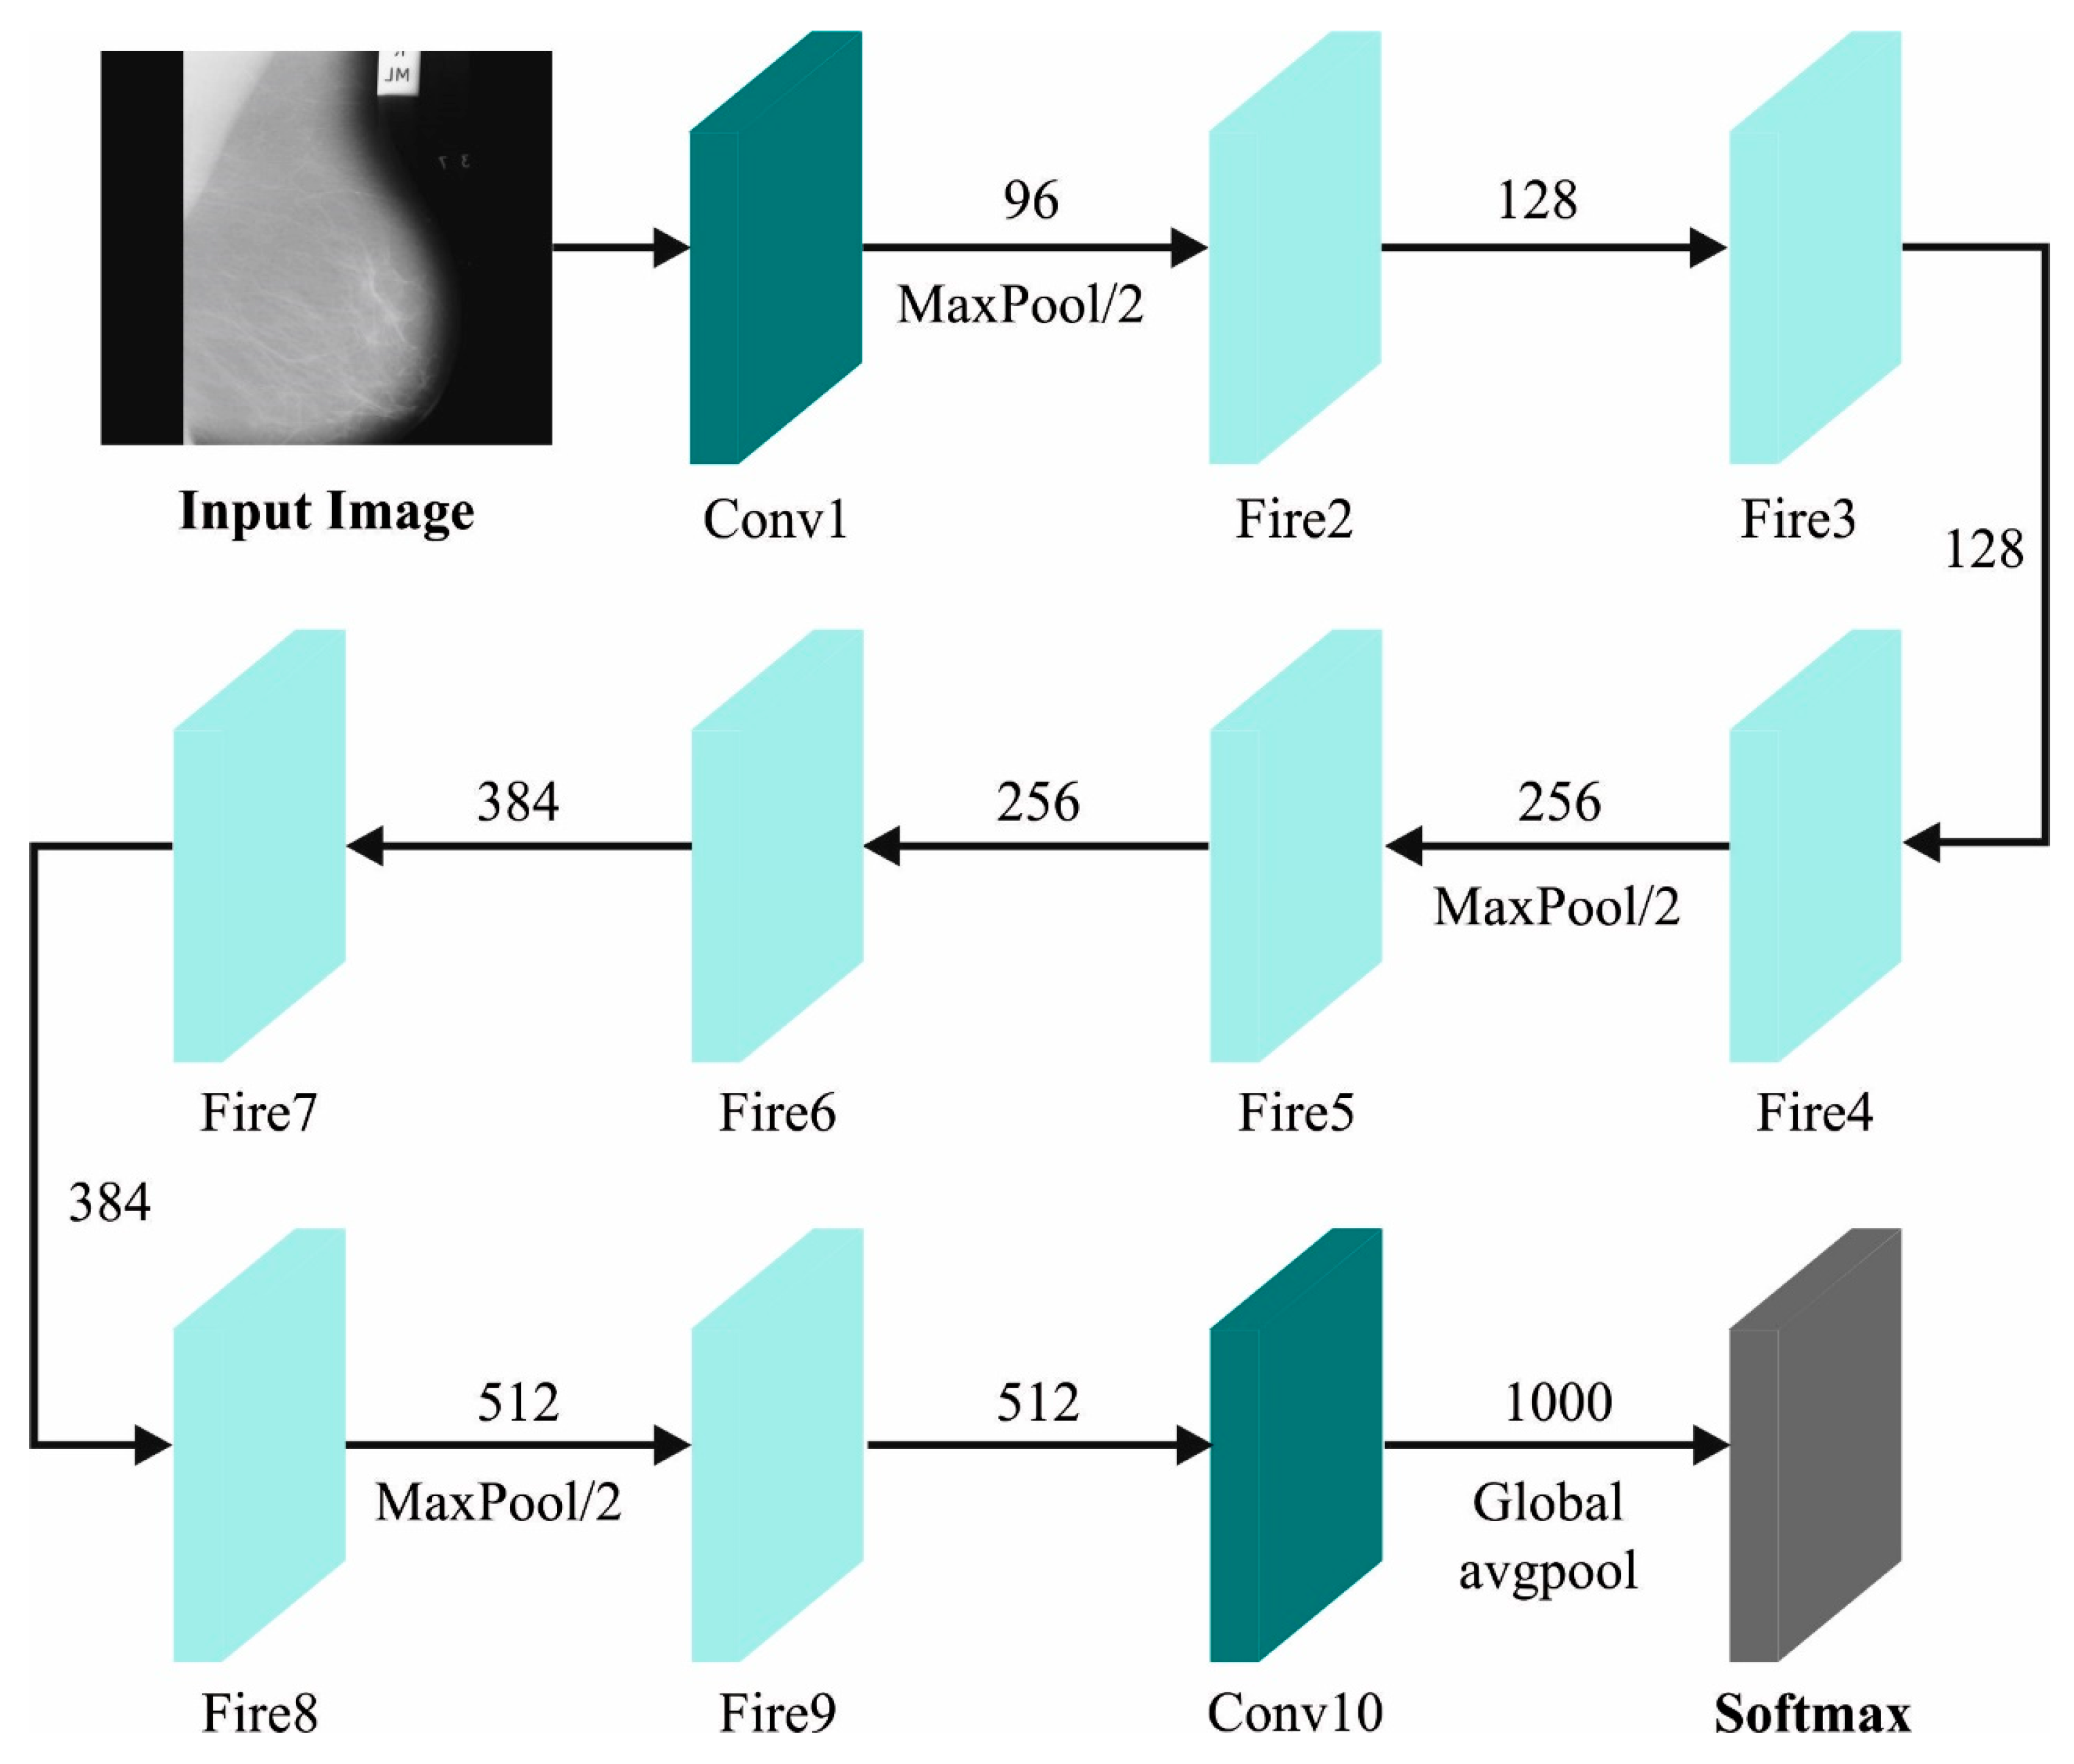
3.2. Feature Extraction Using Optimal SqueezeNet Model
3.3. Image Classification Using the DBN Model
4. Results and Discussion
5. Conclusions
Funding
Institutional Review Board Statement
Data Availability Statement
Conflicts of Interest
References
- Yurdusev, A.A.; Adem, K.; Hekim, M. Detection and classification of microcalcifications in mammograms images using difference filter and Yolov4 deep learning model. Biomed. Signal Process. Control. 2023, 80, 104360. [Google Scholar] [CrossRef]
- Ragab, M.; Nahhas, A.F. Optimal Deep Transfer Learning Model for Histopathological Breast Cancer Classification. Comput. Mater. Contin. 2022, 73, 2849–2864. [Google Scholar]
- Nemade, V.; Pathak, S.; Dubey, A.K. Deep learning-based ensemble model for classification of breast cancer. Microsyst. Technol. 2023, 1–15. [Google Scholar] [CrossRef]
- Al-Mansour, E.; Hussain, M.; Aboalsamh, H.A.; Amin, F.E. An Efficient Method for Breast Mass Classification Using Pre-Trained Deep Convolutional Networks. Mathematics 2022, 10, 2539. [Google Scholar] [CrossRef]
- Atrey, K.; Singh, B.K.; Bodhey, N.K.; Pachori, R.B. Mammography and ultrasound based dual modality classification of breast cancer using a hybrid deep learning approach. Biomed. Signal Process. Control 2023, 86, 104919. [Google Scholar] [CrossRef]
- Kumar, S.; Bhupati Bhambu, P.; Pachar, S.; Cotrina-Aliaga, J.C.; Arias-Gonzáles, J.L. Deep Learning-Based Comput-er-Aided Diagnosis Model for the Identification and Classification of Mammography Images. SN Comput. Sci. 2023, 4, 502. [Google Scholar] [CrossRef]
- Baccouche, A.; Garcia-Zapirain, B.; Elmaghraby, A.S. An integrated framework for breast mass classification and diagnosis using stacked ensemble of residual neural networks. Sci. Rep. 2022, 12, 12259. [Google Scholar] [CrossRef]
- Chakravarthy, S.S.; Rajaguru, H. Automatic Detection and Classification of Mammograms Using Improved Extreme Learning Machine with Deep Learning. IRBM 2022, 43, 49–61. [Google Scholar] [CrossRef]
- Li, H.; Niu, J.; Li, D.; Zhang, C. Classification of breast mass in two-view mammograms via deep learning. IET Image Process. 2021, 15, 454–467. [Google Scholar] [CrossRef]
- Mahmood, T.; Li, J.; Pei, Y.; Akhtar, F.; Rehman, M.U.; Wasti, S.H. Breast lesions classifications of mammographic images using a deep convolutional neural network-based approach. PLoS ONE 2022, 17, e0263126. [Google Scholar] [CrossRef]
- Cruz-Ramos, C.; García-Avila, O.; Almaraz-Damian, J.-A.; Ponomaryov, V.; Reyes-Reyes, R.; Sadovnychiy, S. Benign and Malignant Breast Tumor Classification in Ultrasound and Mammography Images via Fusion of Deep Learning and Handcraft Features. Entropy 2023, 25, 991. [Google Scholar] [CrossRef] [PubMed]
- Malebary, S.J.; Hashmi, A. Automated Breast Mass Classification System Using Deep Learning and Ensemble Learning in Digital Mammogram. IEEE Access 2021, 9, 55312–55328. [Google Scholar] [CrossRef]
- Jiang, J.; Peng, J.; Hu, C.; Jian, W.; Wang, X.; Liu, W. Breast cancer detection and classification in mammogram using a three-stage deep learning framework based on PAA algorithm. Artif. Intell. Med. 2022, 134, 102419. [Google Scholar] [CrossRef] [PubMed]
- Ragab, M. Leveraging mayfly optimization with deep learning for secure remote sensing scene image classification. Comput. Electr. Eng. 2023, 108, 108672. [Google Scholar] [CrossRef]
- Yu, X. Automatic Breast Mass Detection and Classification for Mammograms with Deep Learning. Ph.D. Thesis, University of Leicester, Leicester, UK, 2023. [Google Scholar]
- Narayanan, K.L.; Krishnan, R.S.; Robinson, Y.H. A Hybrid Deep Learning Based Assist System for Detection and Classification of Breast Cancer from Mammogram Images. Int. Arab. J. Inf. Technol. 2022, 19, 965–974. [Google Scholar] [CrossRef]
- Mahmood, T.; Li, J.; Pei, Y.; Akhtar, F.; Jia, Y.; Khand, Z.H. Breast Mass Detection and Classification Using Deep Convolutional Neural Networks for Radiologist Diagnosis Assistance. In Proceedings of the 2021 IEEE 45th Annual Computers, Software, and Applications Conference (COMPSAC), Madrid, Spain, 12–16 July 2021; pp. 1918–1923. [Google Scholar]
- Chakravarthy, S.S.; Bharanidharan, N.; Rajaguru, H. Deep Learning-Based Metaheuristic Weighted K-Nearest Neighbor Algorithm for the Severity Classification of Breast Cancer. IRBM 2023, 44, 100749. [Google Scholar] [CrossRef]
- Adebiyi, M.O.; Afolayan, J.O.; Arowolo, M.O.; Tyagi, A.K.; Adebiyi, A.A. Breast Cancer Detection Using a PSO-ANN Machine Learning Technique. In Using Multimedia Systems, Tools, and Technologies for Smart Healthcare Services; IGI Global: Hershey, PA, USA, 2023; pp. 96–116. [Google Scholar]
- Adebiyi, M.O.; Arowolo, M.O.; Mshelia, M.D.; Olugbara, O.O. A Linear Discriminant Analysis and Classification Model for Breast Cancer Diagnosis. Appl. Sci. 2022, 12, 11455. [Google Scholar] [CrossRef]
- Afolayan, J.O.; Adebiyi, M.O.; Arowolo, M.O.; Chakraborty, C.; Adebiyi, A.A. Breast Cancer Detection Using Particle Swarm Optimization and Decision Tree Machine Learning Technique. In Intelligent Healthcare: Infrastructure, Algorithms and ManagementI; Springer Nature Singapore: Singapore, 2022; pp. 61–83. [Google Scholar]
- Noor, A.; Zhao, Y.; Khan, R.; Wu, L.; Abdalla, F.Y. Median filters combined with denoising convolutional neural network for Gaussian and impulse noises. Multimed. Tools Appl. 2020, 79, 18553–18568. [Google Scholar] [CrossRef]
- Ragab, M.; Albukhari, A.; Alyami, J.; Mansour, R.F. Ensemble Deep-Learning-Enabled Clinical Decision Support System for Breast Cancer Diagnosis and Classification on Ultrasound Images. Biology 2022, 11, 439. [Google Scholar] [CrossRef]
- Bernardo, L.S.; Damaševičius, R.; Ling, S.H.; de Albuquerque, V.H.C.; Tavares, J.M.R.S. Modified SqueezeNet Architecture for Parkinson’s Disease Detection Based on Keypress Data. Biomedicines 2022, 10, 2746. [Google Scholar] [CrossRef]
- Fathy, A.; Alharbi, A.G.; Alshammari, S.; Hasanien, H.M. Archimedes optimization algorithm based maximum power point tracker for wind energy generation system. Ain Shams Eng. J. 2021, 13, 101548. [Google Scholar] [CrossRef]
- Jiang, K.; Huang, Z.; Zhou, X.; Tong, C.; Zhu, M.; Wang, H. Deep belief improved bidirectional LSTM for multivariate time series forecasting. Math. Biosci. Eng. 2023, 20, 16596–16627. [Google Scholar] [CrossRef]
- Available online: https://www.kaggle.com/datasets/kmader/mias-mammography (accessed on 12 June 2023).

| Class | No. of Samples |
|---|---|
| Normal | 300 |
| Benign | 350 |
| Malignant | 350 |
| Total Samples | 1000 |
| Class | ||||
|---|---|---|---|---|
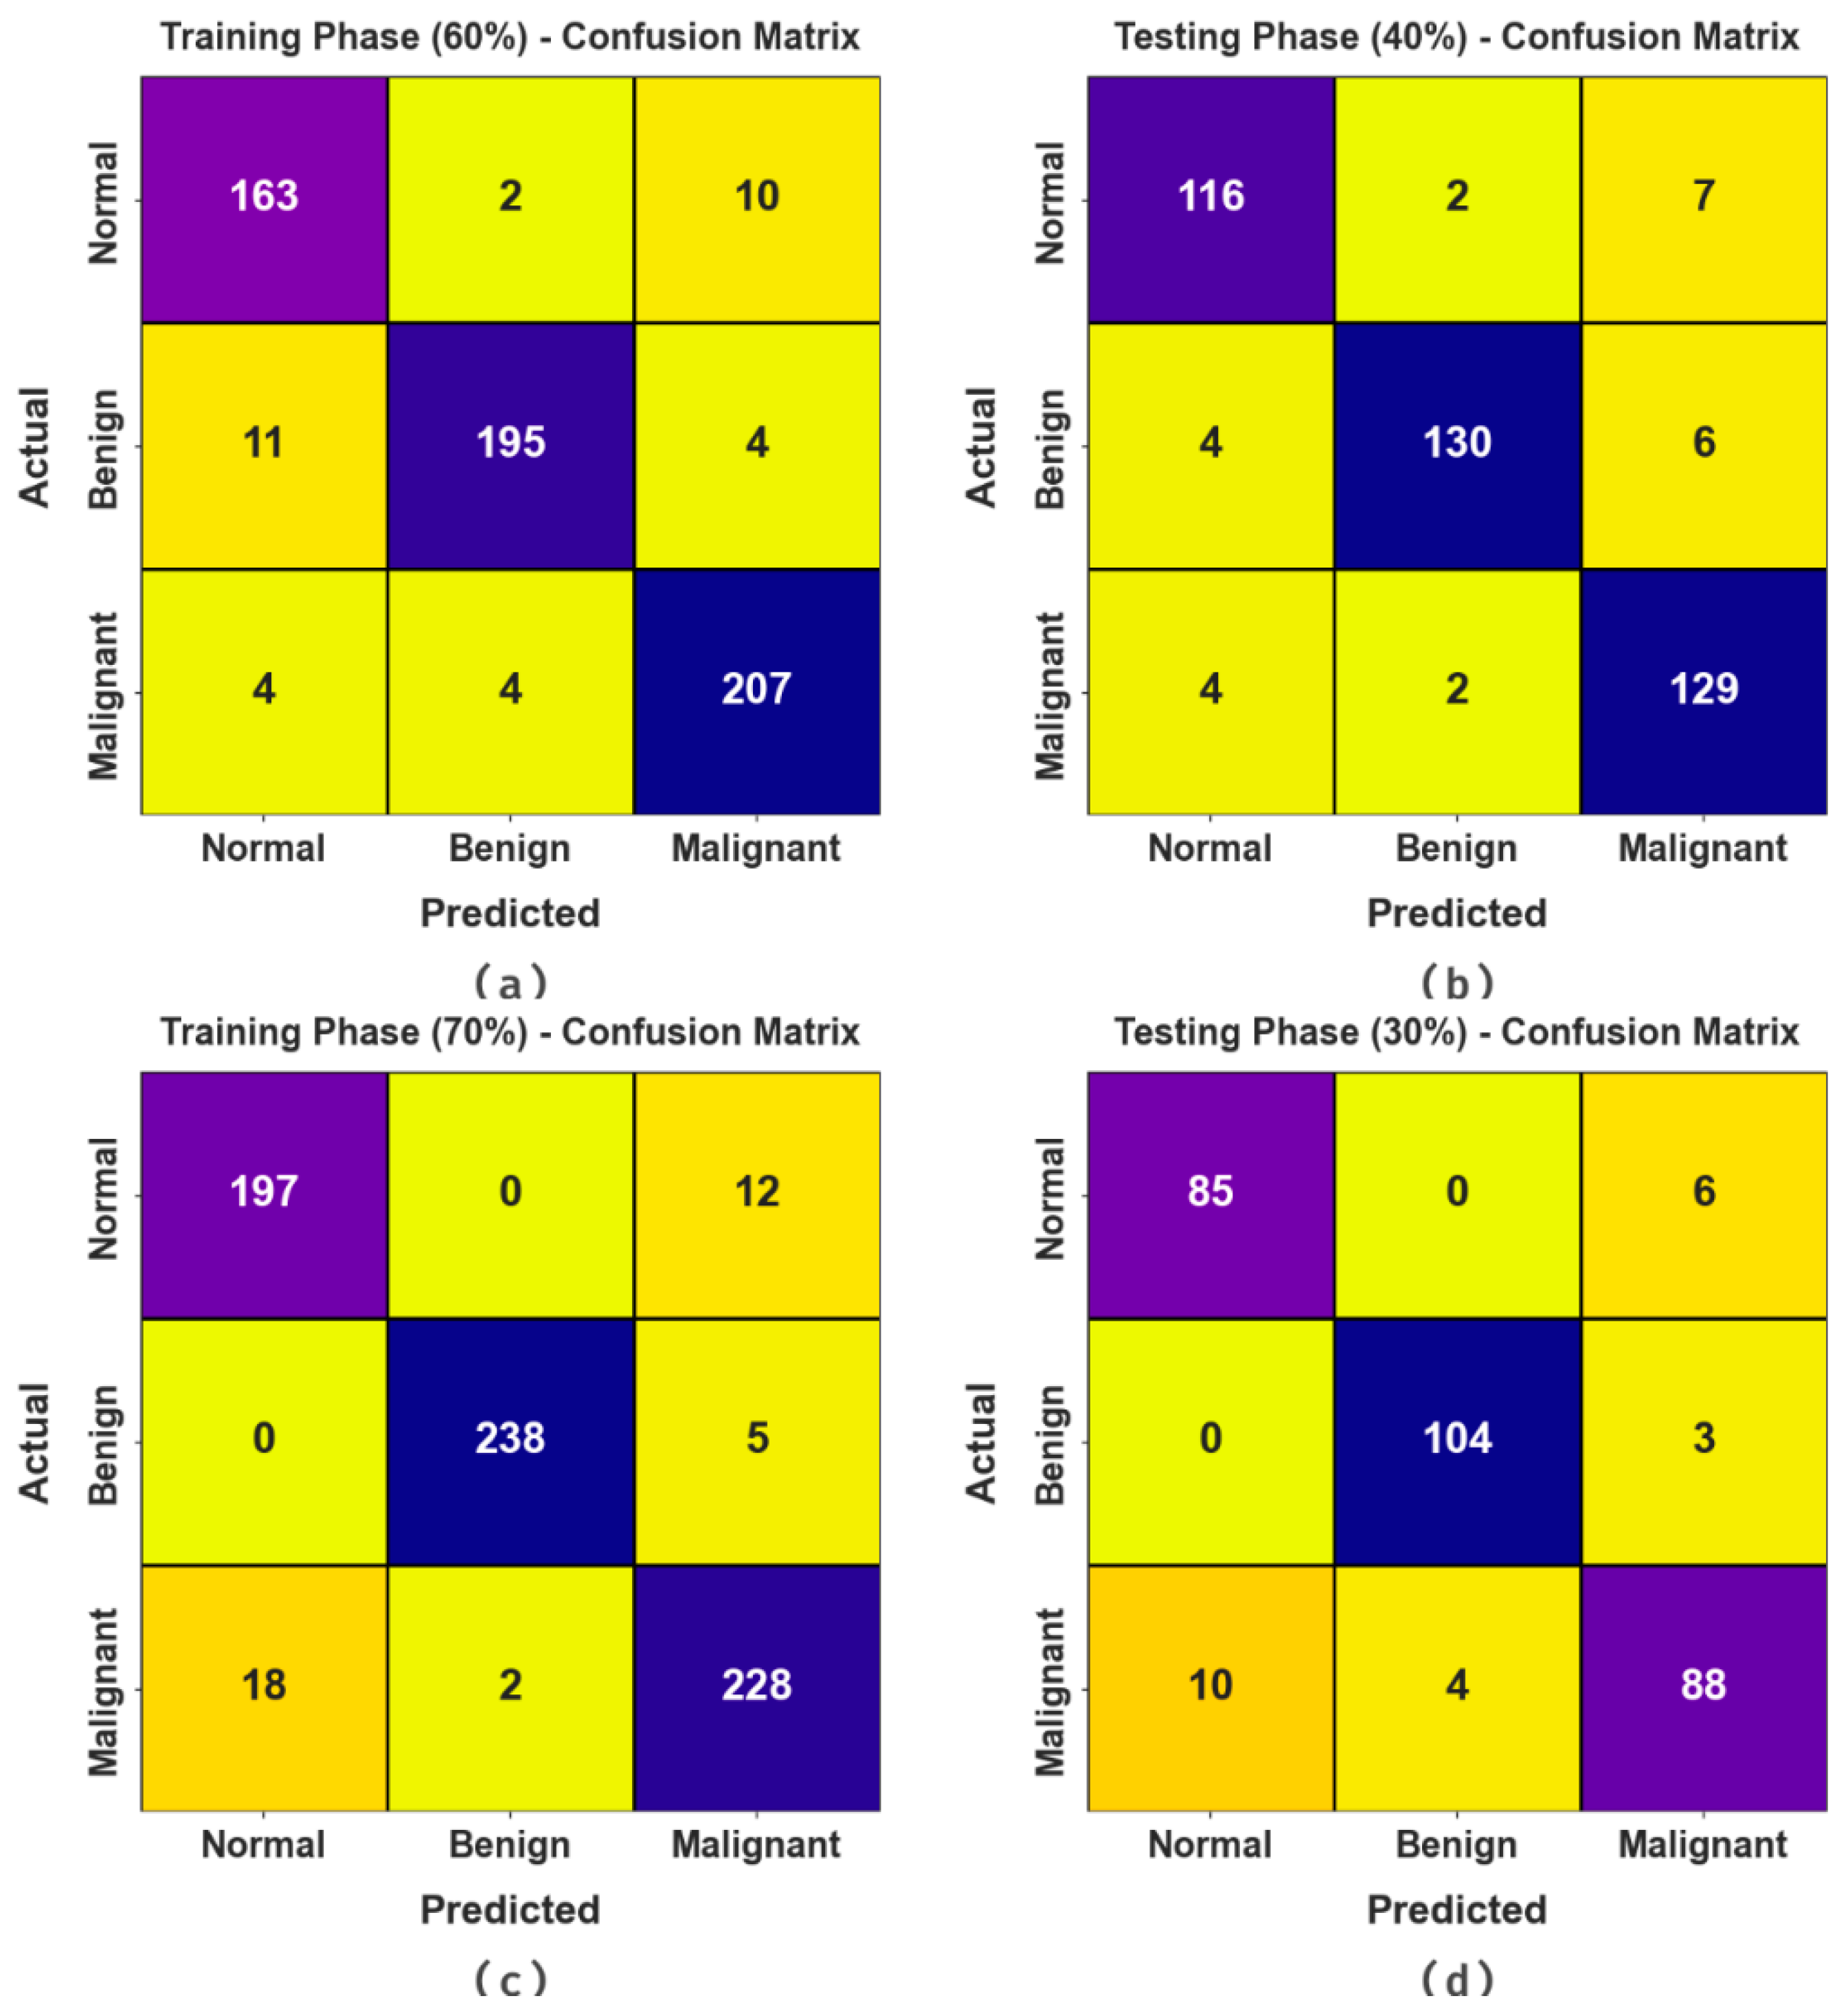
| TR set (60%) | ||||
| Normal | 95.50 | 93.14 | 96.47 | 92.35 |
| Benign | 96.50 | 92.86 | 98.46 | 94.89 |
| Malignant | 96.33 | 96.28 | 96.36 | 94.95 |
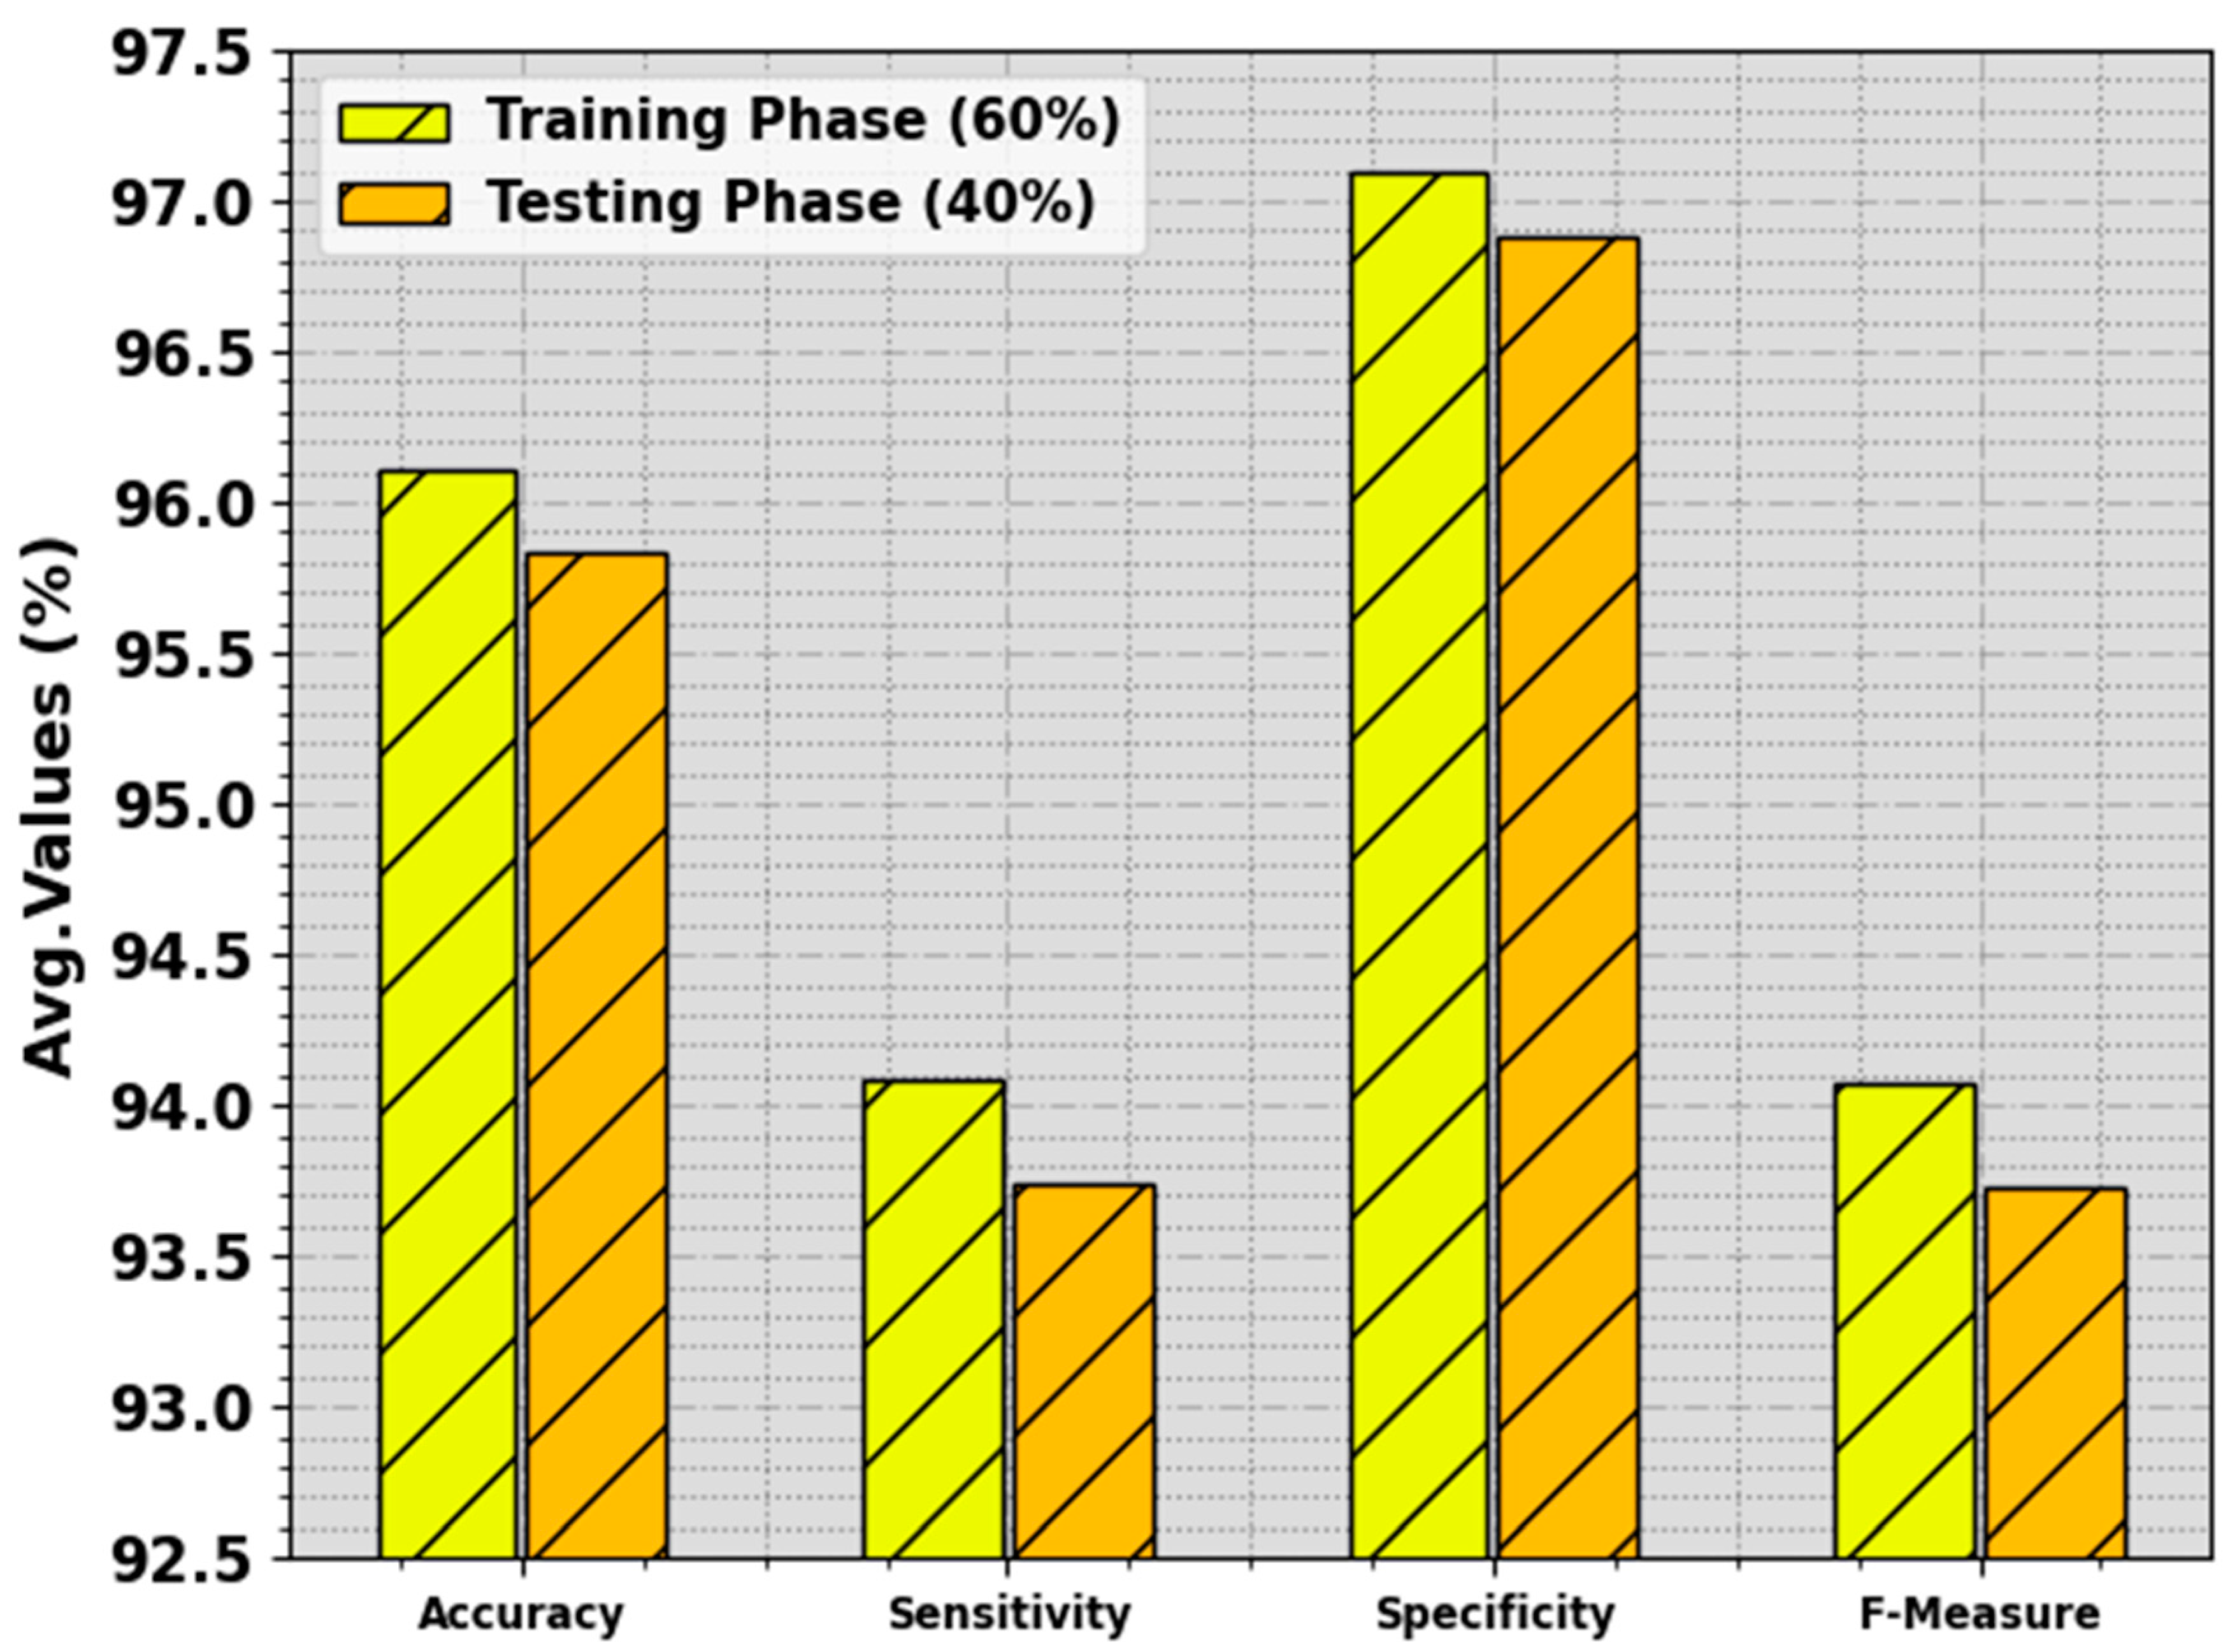
| Average | 96.11 | 94.09 | 97.10 | 94.07 |
| TS set (40%) | ||||
| Normal | 95.75 | 92.80 | 97.09 | 93.17 |
| Benign | 96.50 | 92.86 | 98.46 | 94.89 |
| Malignant | 95.25 | 95.56 | 95.09 | 93.14 |
| Average | 95.83 | 93.74 | 96.88 | 93.73 |
| Class | ||||
|---|---|---|---|---|
| TR set (70%) | ||||
| Normal | 95.71 | 94.26 | 96.33 | 92.92 |
| Benign | 99.00 | 97.94 | 99.56 | 98.55 |
| Malignant | 94.71 | 91.94 | 96.24 | 92.49 |
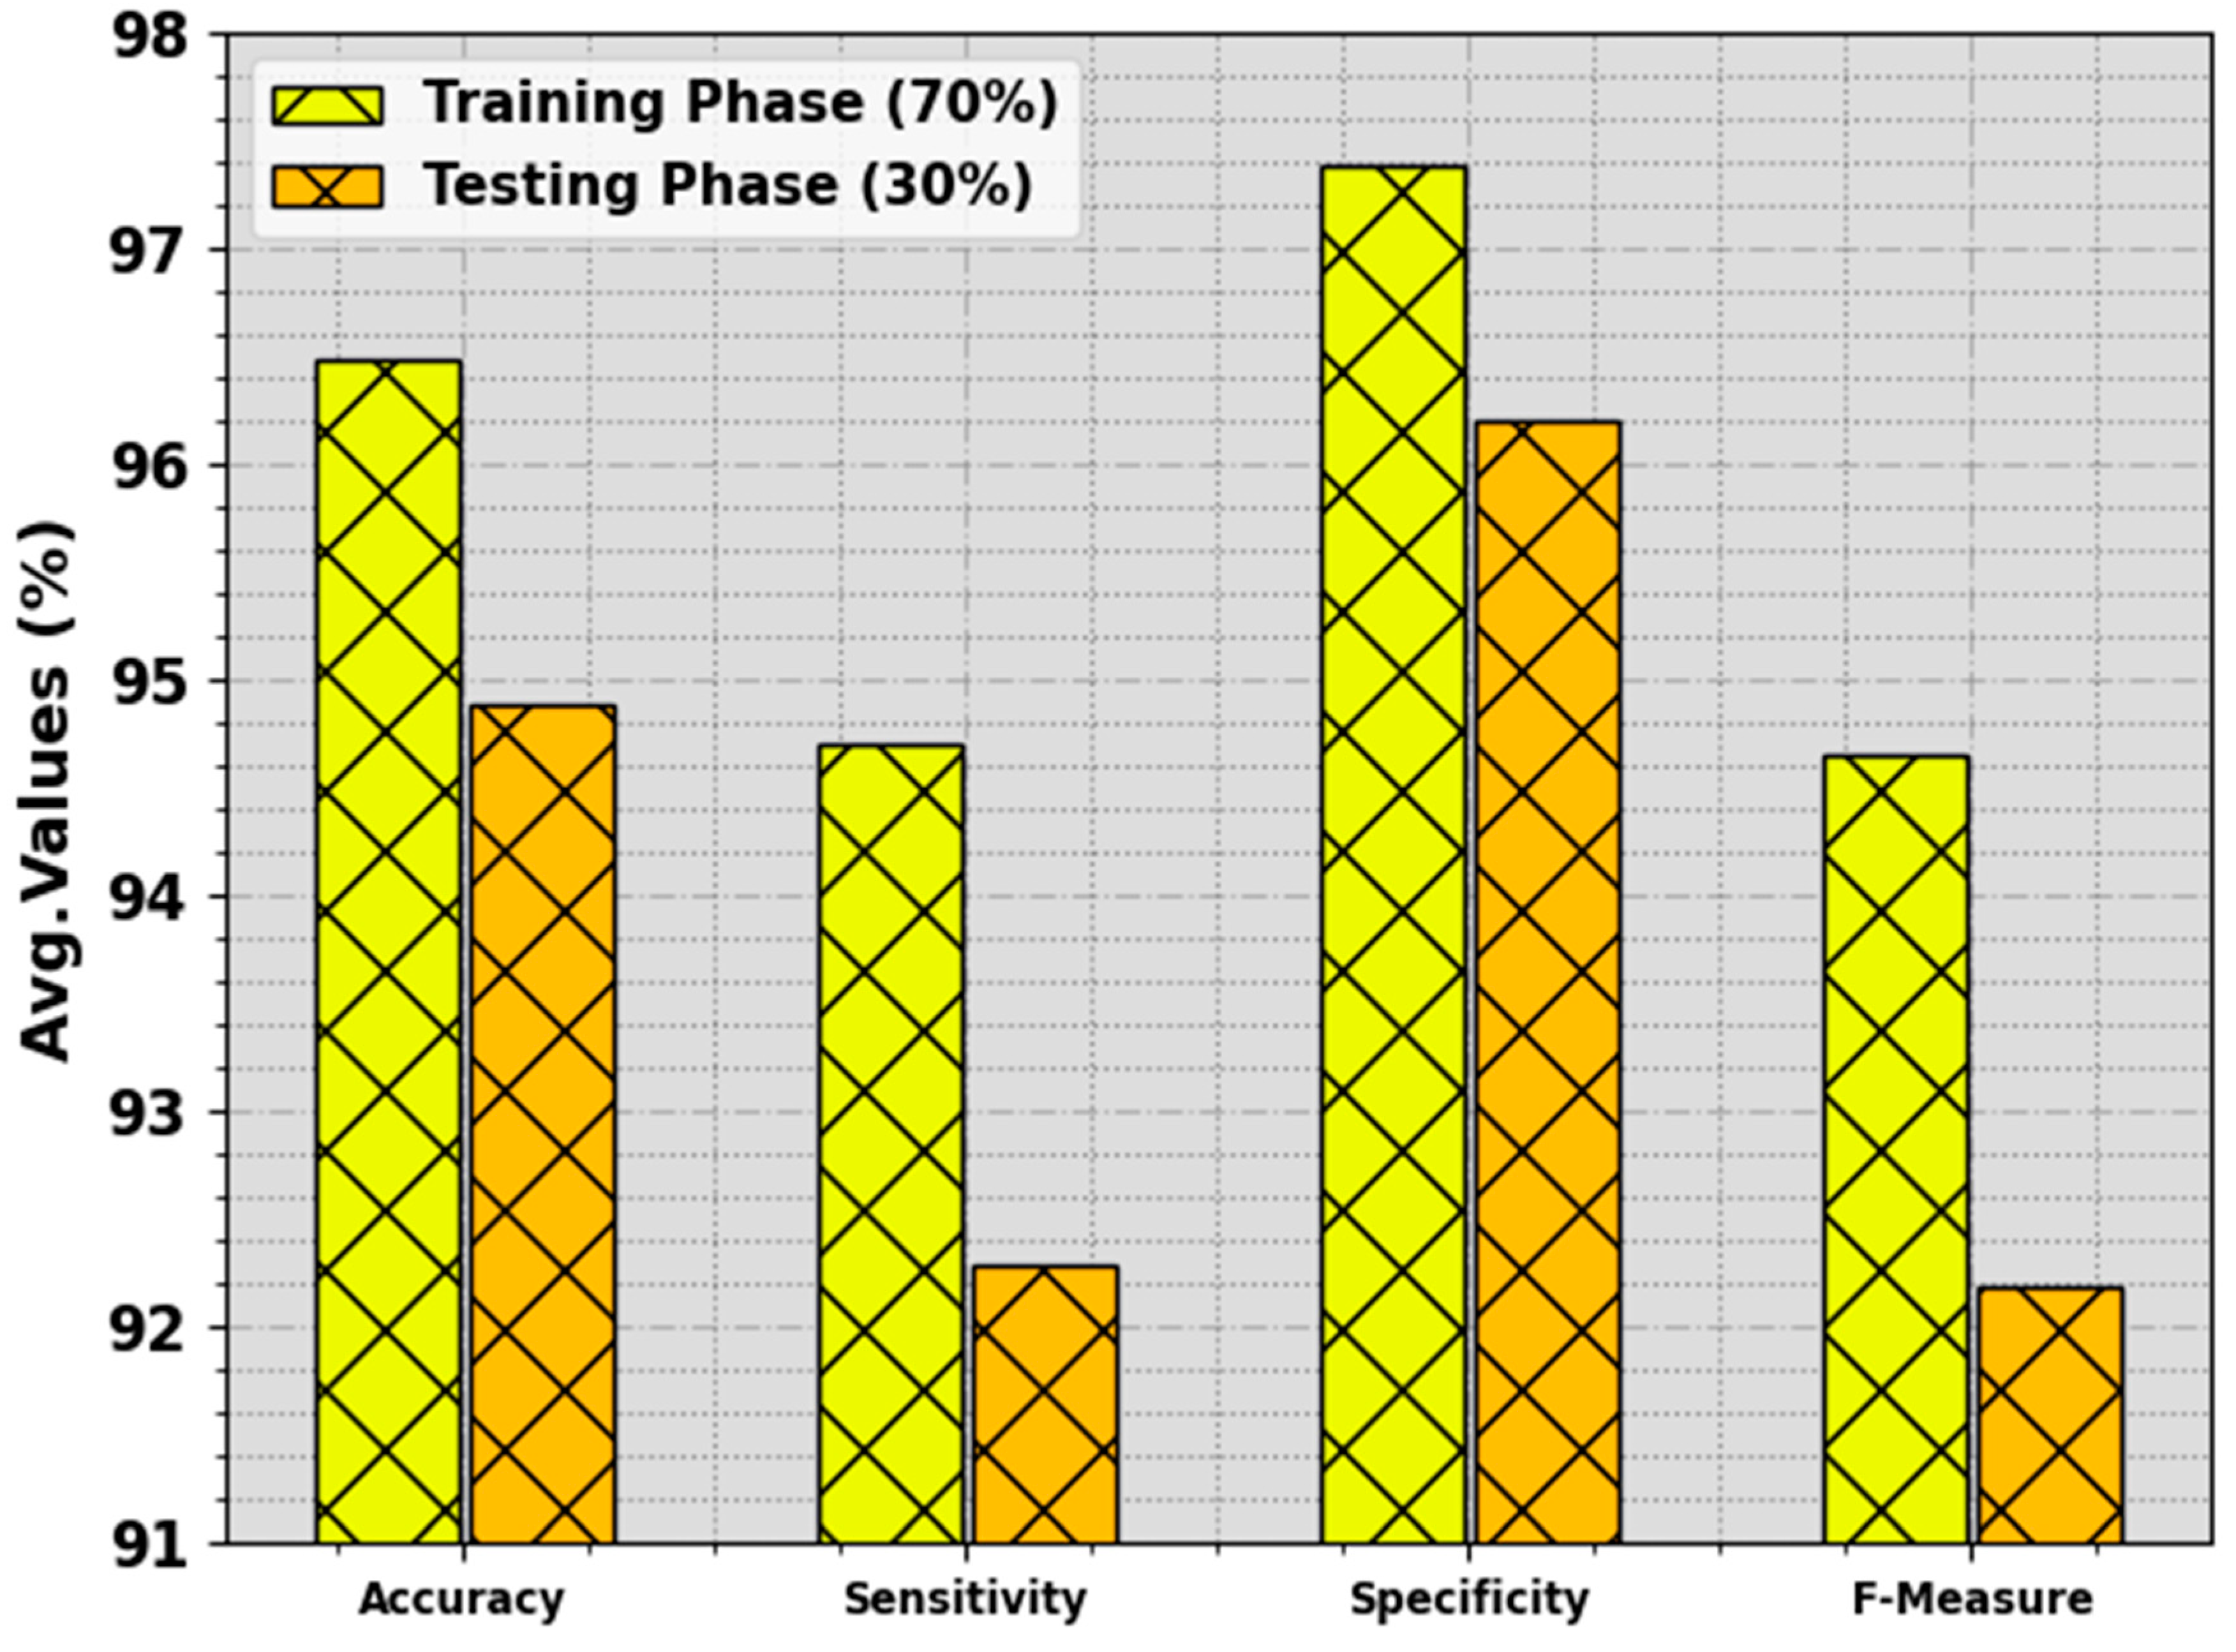
| Average | 96.48 | 94.71 | 97.38 | 94.66 |
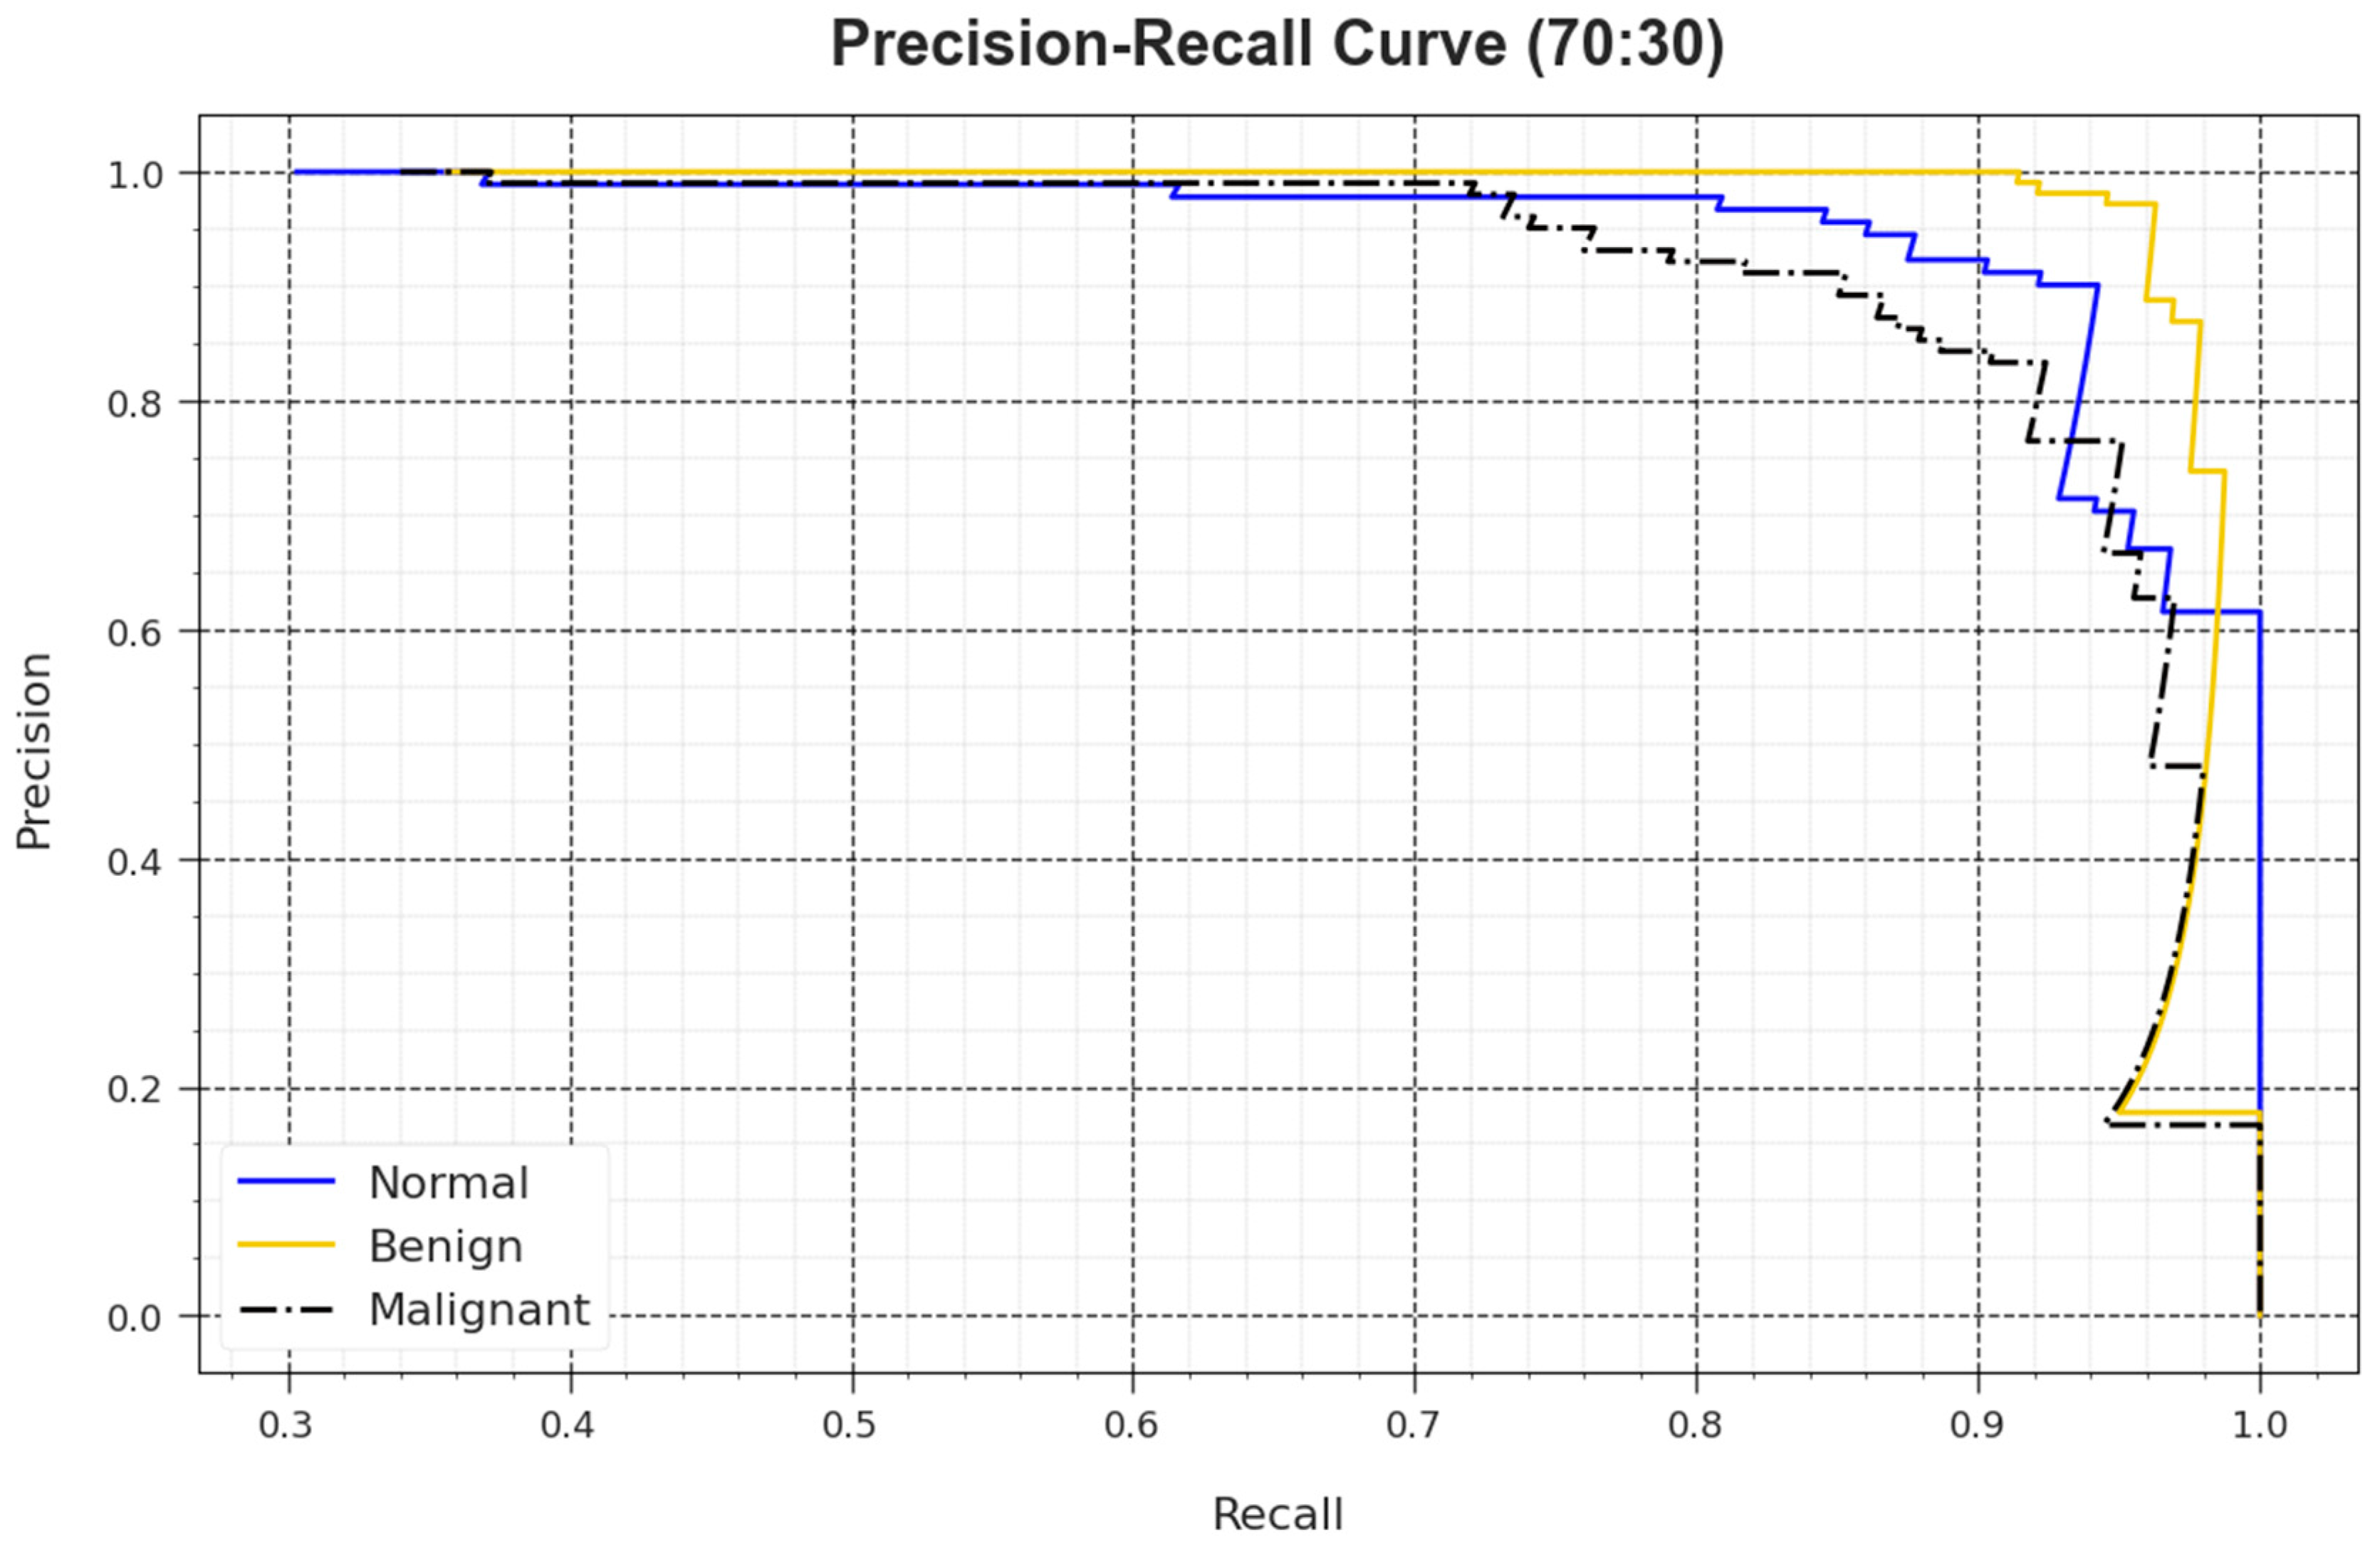
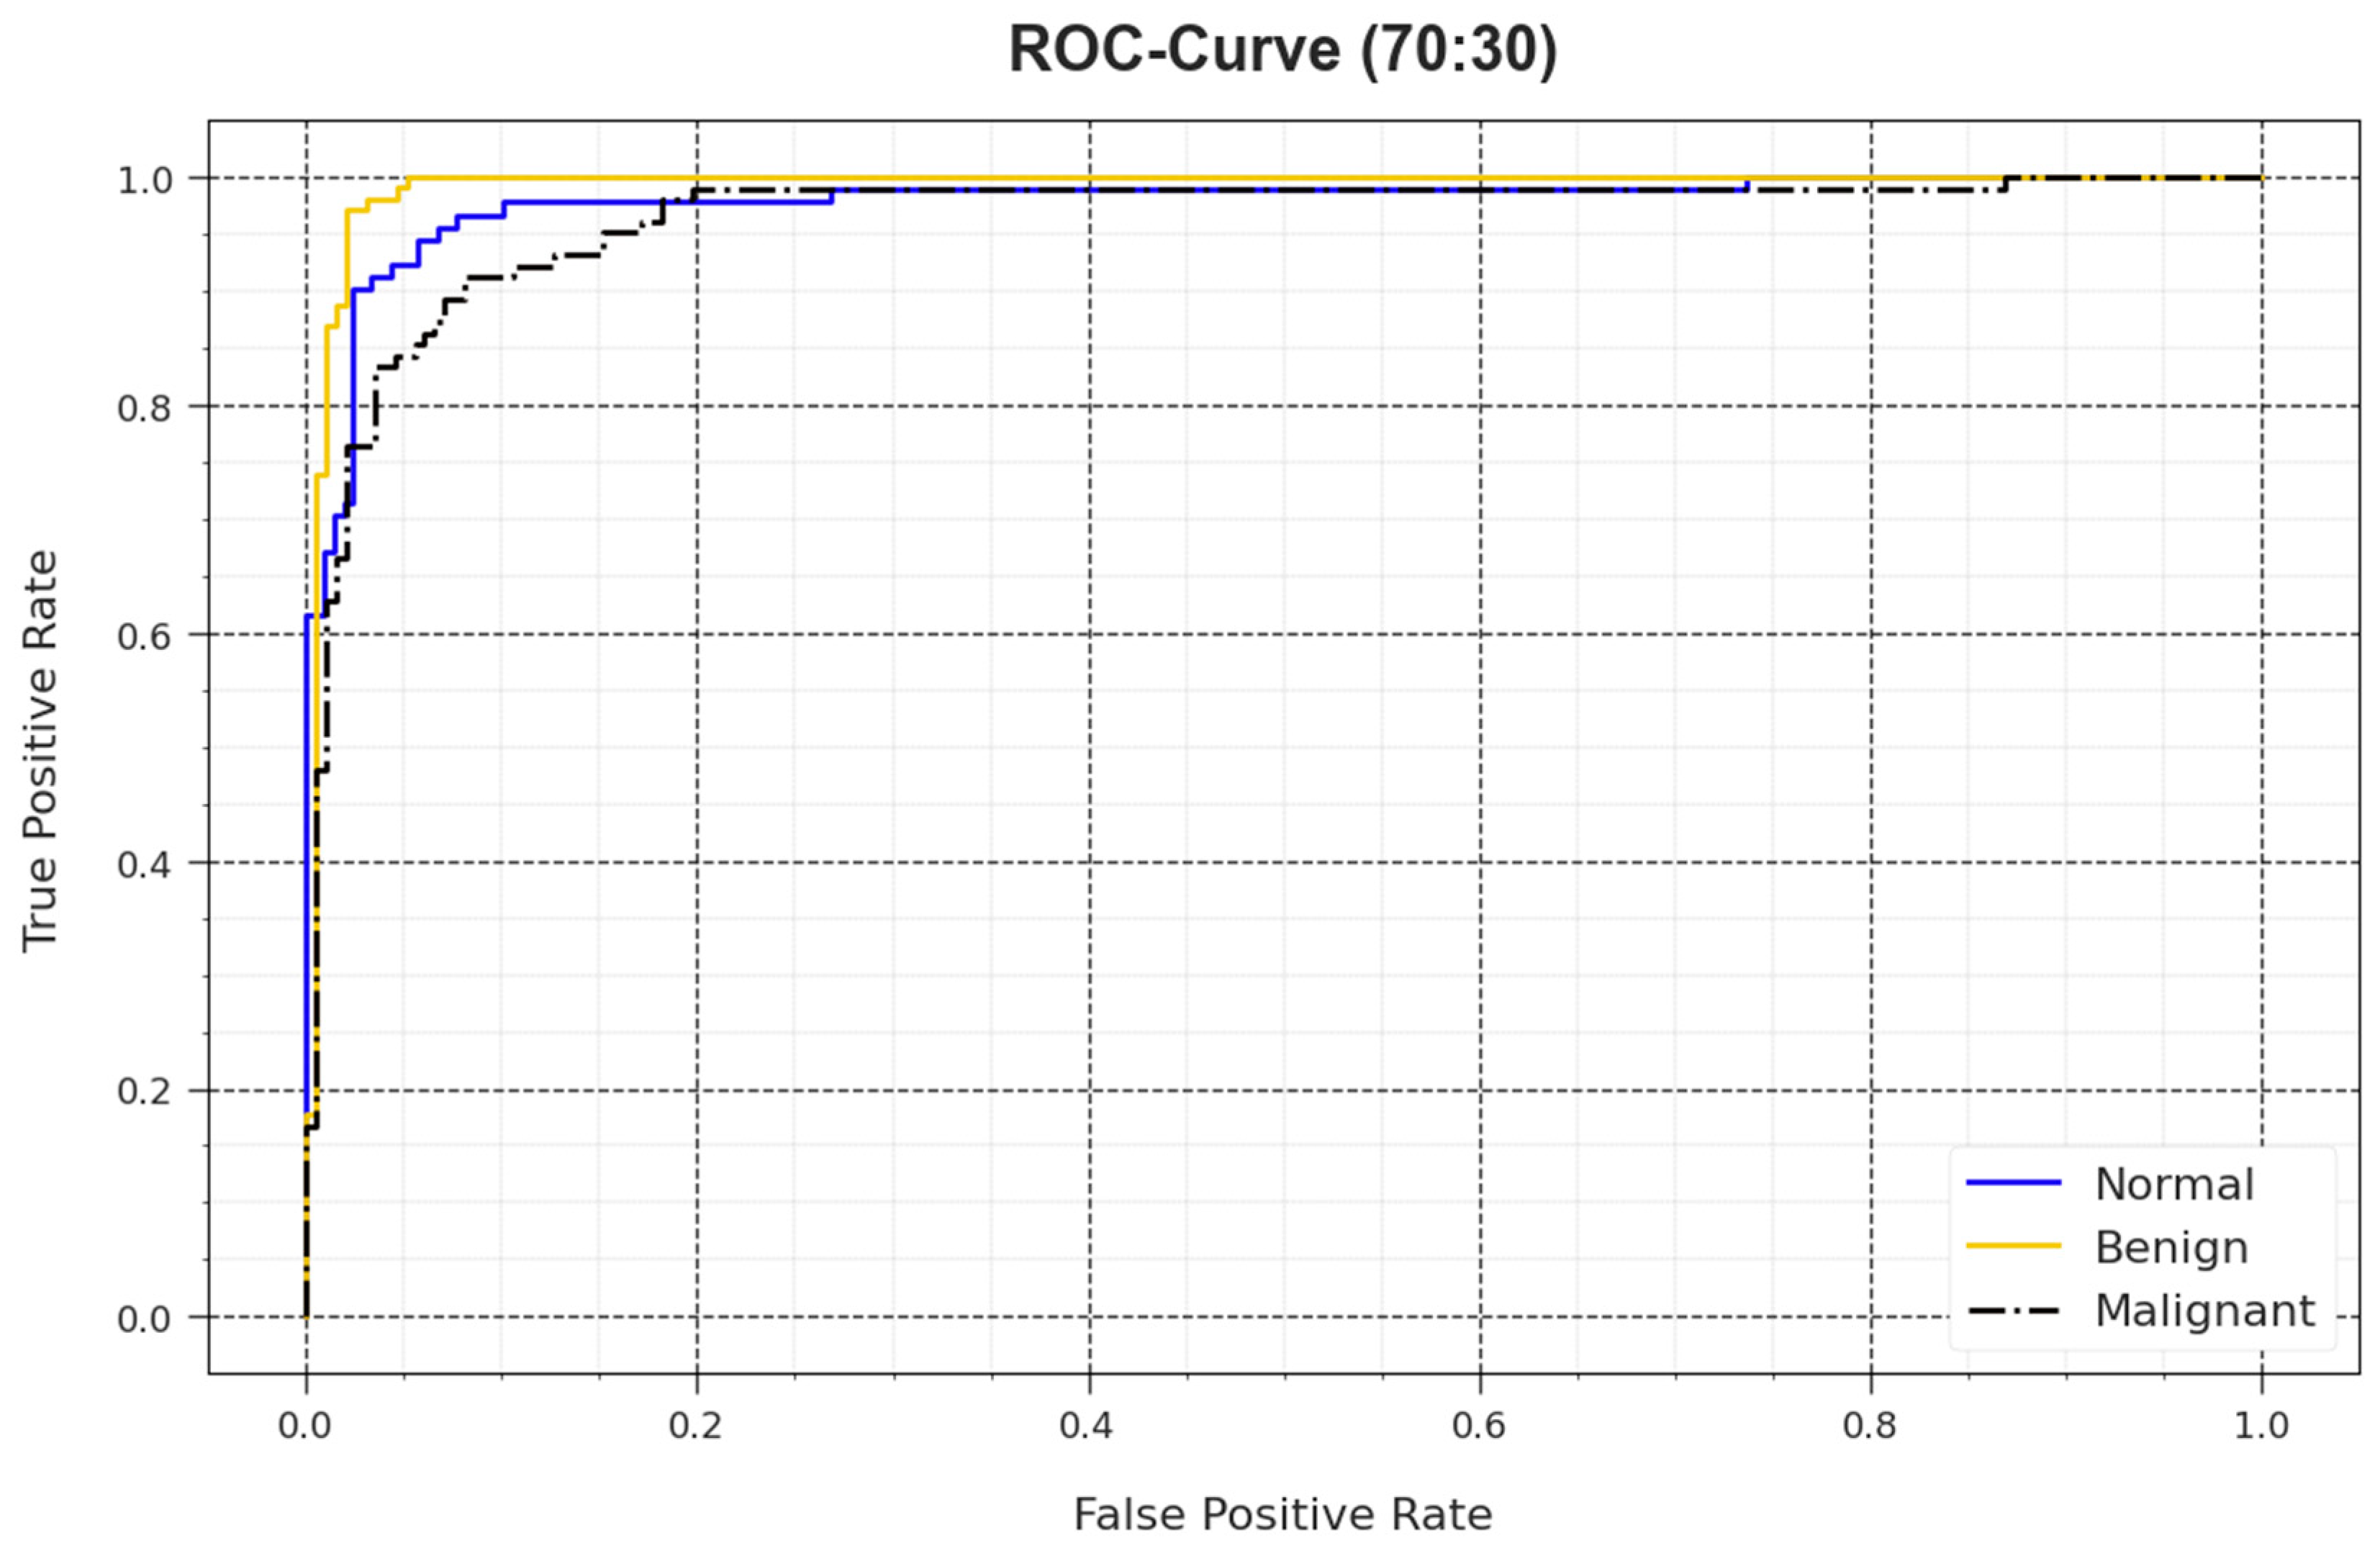
| TS set (30%) | ||||
| Normal | 94.67 | 93.41 | 95.22 | 91.40 |
| Benign | 97.67 | 97.20 | 97.93 | 96.74 |
| Malignant | 92.33 | 86.27 | 95.45 | 88.44 |
| Average | 94.89 | 92.29 | 96.20 | 92.19 |
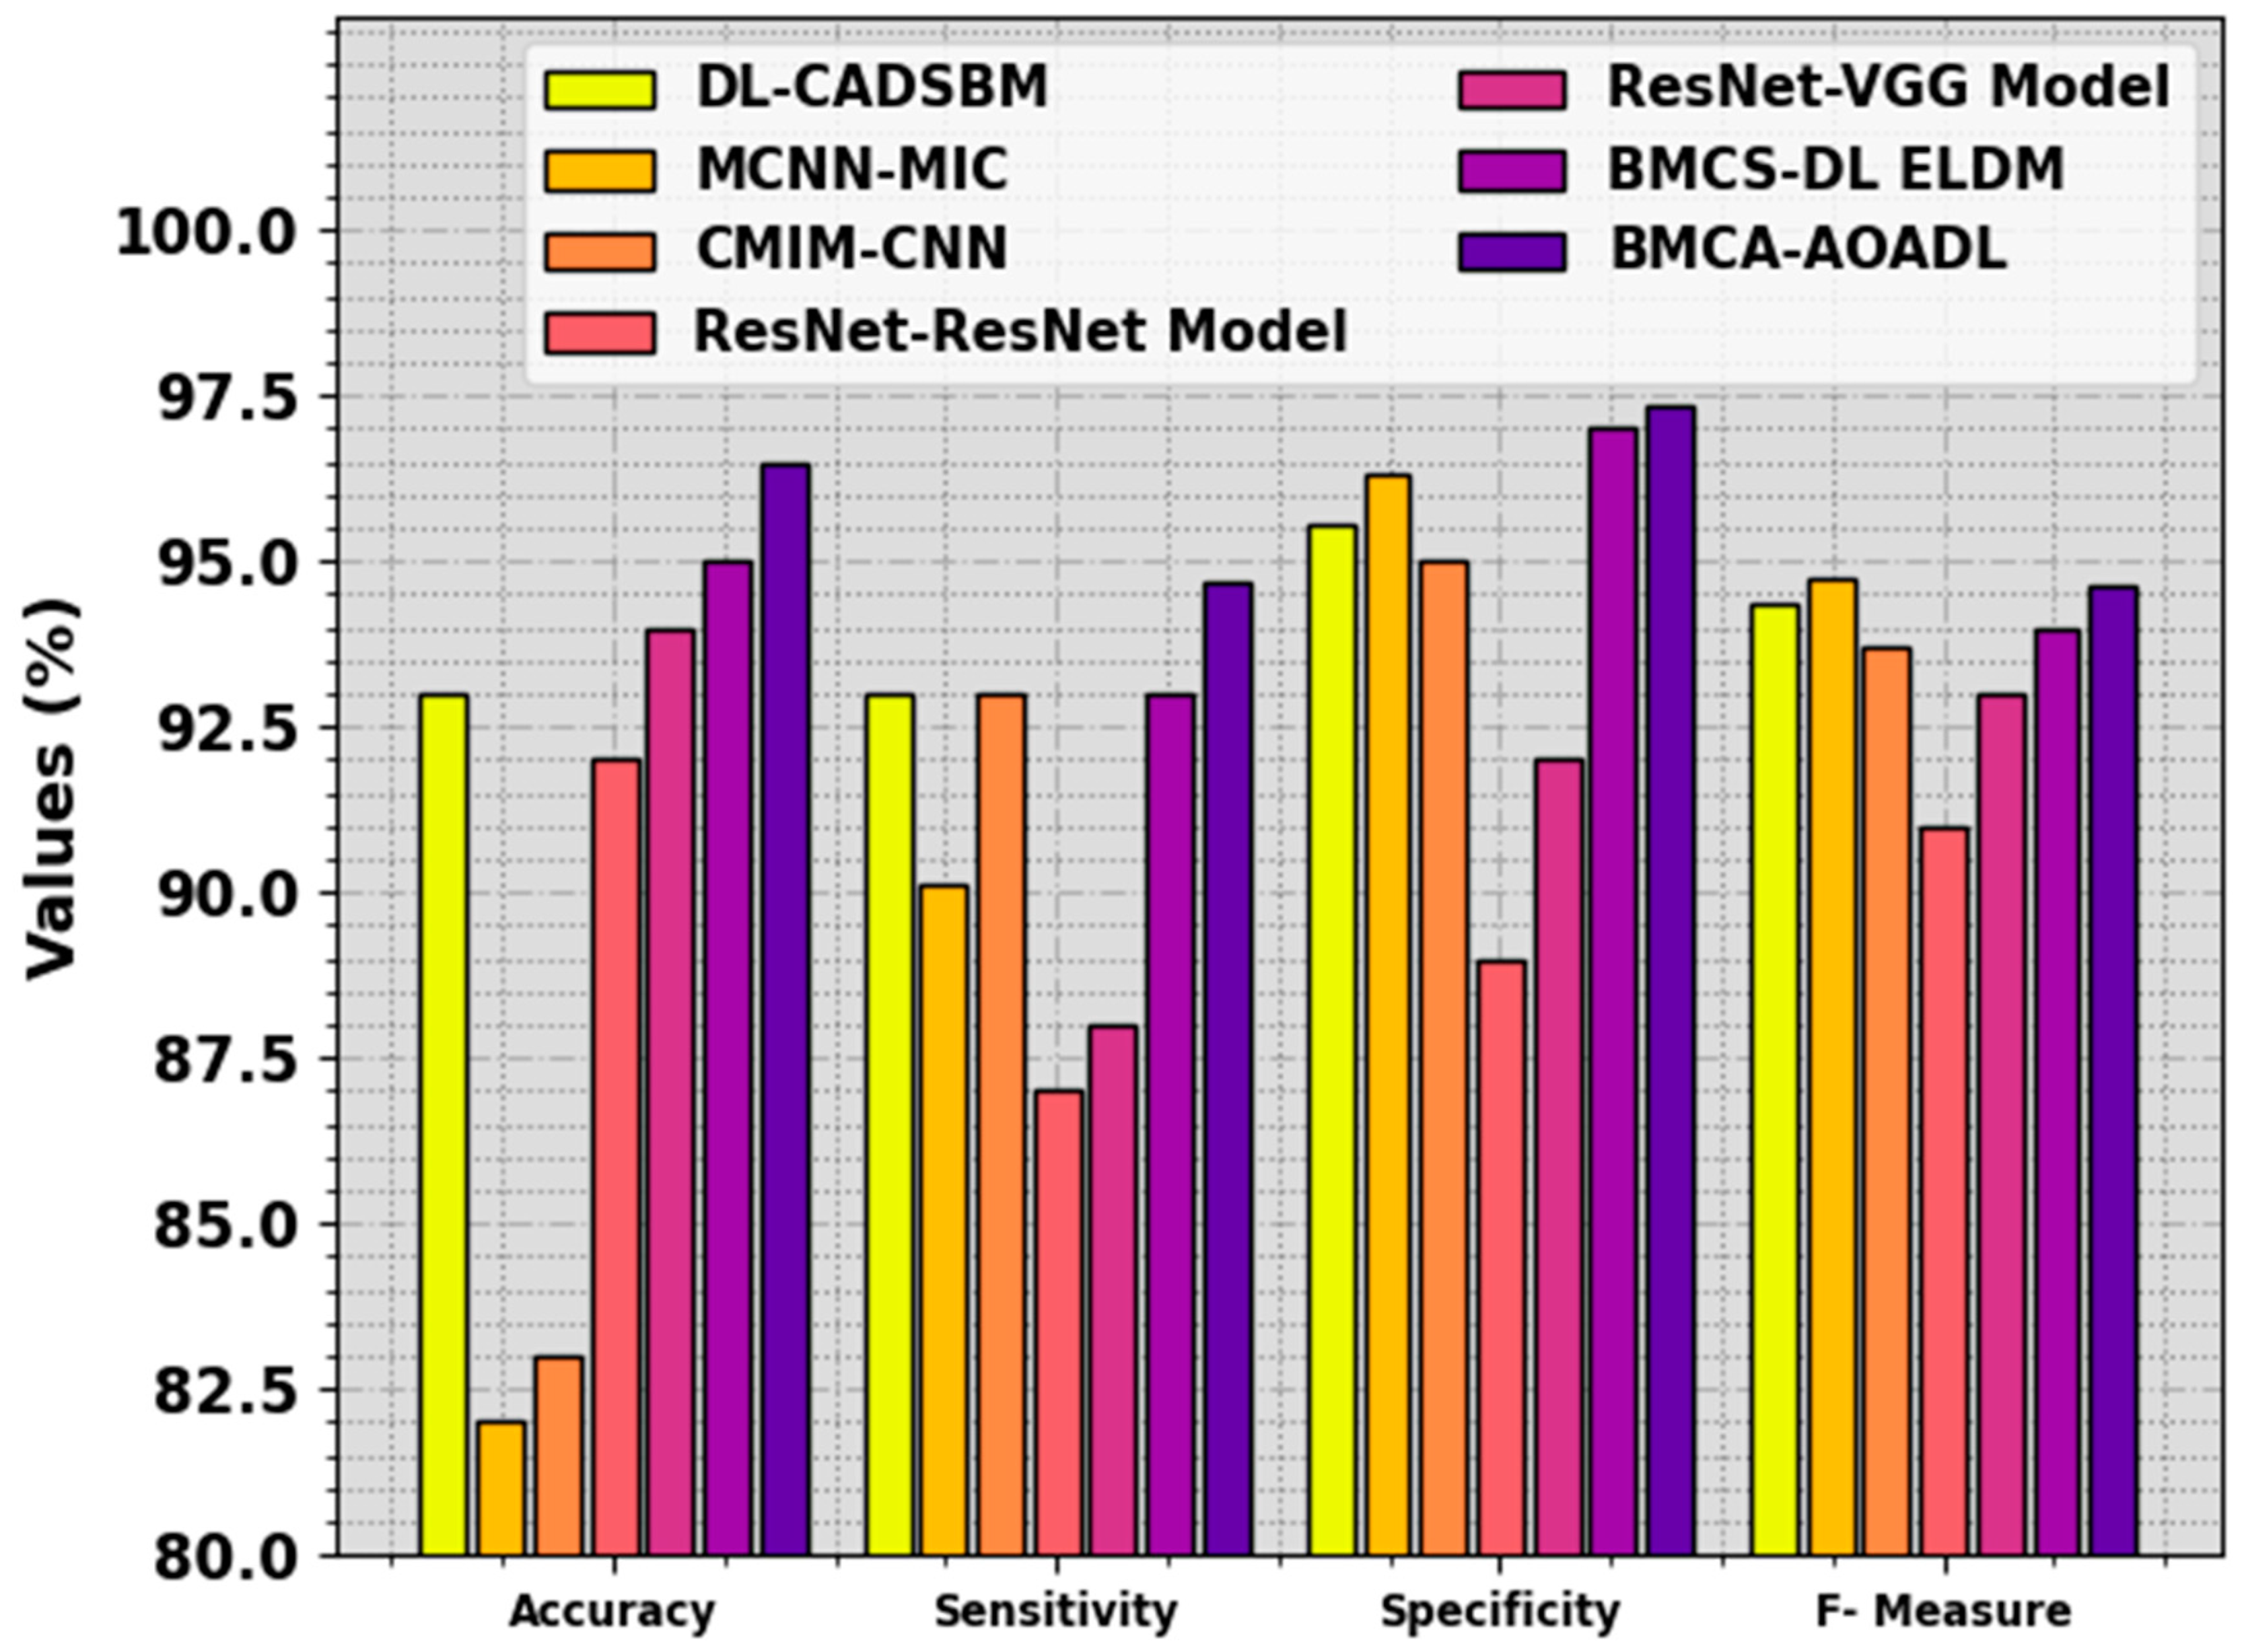
| Methods | ||||
|---|---|---|---|---|
| DL-CADSBM | 93.00 | 93.00 | 95.58 | 94.34 |
| MCNN-MIC | 82.00 | 90.13 | 96.31 | 94.76 |
| CMIM-CNN | 83.00 | 93.00 | 95.01 | 93.70 |
| ResNet-ResNet | 92.00 | 87.00 | 89.00 | 91.00 |
| ResNet-VGG | 94.00 | 88.00 | 92.00 | 93.00 |
| BMCS-DL ELDM | 95.00 | 93.00 | 97.00 | 94.00 |
| BMCA-AOADL | 96.48 | 94.71 | 97.38 | 94.66 |
Disclaimer/Publisher’s Note: The statements, opinions and data contained in all publications are solely those of the individual author(s) and contributor(s) and not of MDPI and/or the editor(s). MDPI and/or the editor(s) disclaim responsibility for any injury to people or property resulting from any ideas, methods, instructions or products referred to in the content. |
© 2023 by the author. Licensee MDPI, Basel, Switzerland. This article is an open access article distributed under the terms and conditions of the Creative Commons Attribution (CC BY) license (https://creativecommons.org/licenses/by/4.0/).
Share and Cite
Basheri, M. Intelligent Breast Mass Classification Approach Using Archimedes Optimization Algorithm with Deep Learning on Digital Mammograms. Biomimetics 2023, 8, 463. https://doi.org/10.3390/biomimetics8060463
Basheri M. Intelligent Breast Mass Classification Approach Using Archimedes Optimization Algorithm with Deep Learning on Digital Mammograms. Biomimetics. 2023; 8(6):463. https://doi.org/10.3390/biomimetics8060463
Chicago/Turabian StyleBasheri, Mohammed. 2023. "Intelligent Breast Mass Classification Approach Using Archimedes Optimization Algorithm with Deep Learning on Digital Mammograms" Biomimetics 8, no. 6: 463. https://doi.org/10.3390/biomimetics8060463
APA StyleBasheri, M. (2023). Intelligent Breast Mass Classification Approach Using Archimedes Optimization Algorithm with Deep Learning on Digital Mammograms. Biomimetics, 8(6), 463. https://doi.org/10.3390/biomimetics8060463