Multistrategy-Boosted Carnivorous Plant Algorithm: Performance Analysis and Application in Engineering Designs
Abstract
1. Introduction
- An enhanced CPA named UCDCPA is proposed. Three efficient strategies, i.e., good point set, Cauchy mutation, and differential evolution are applied to the UCDCPA to tackle the complex optimization tasks effectively.
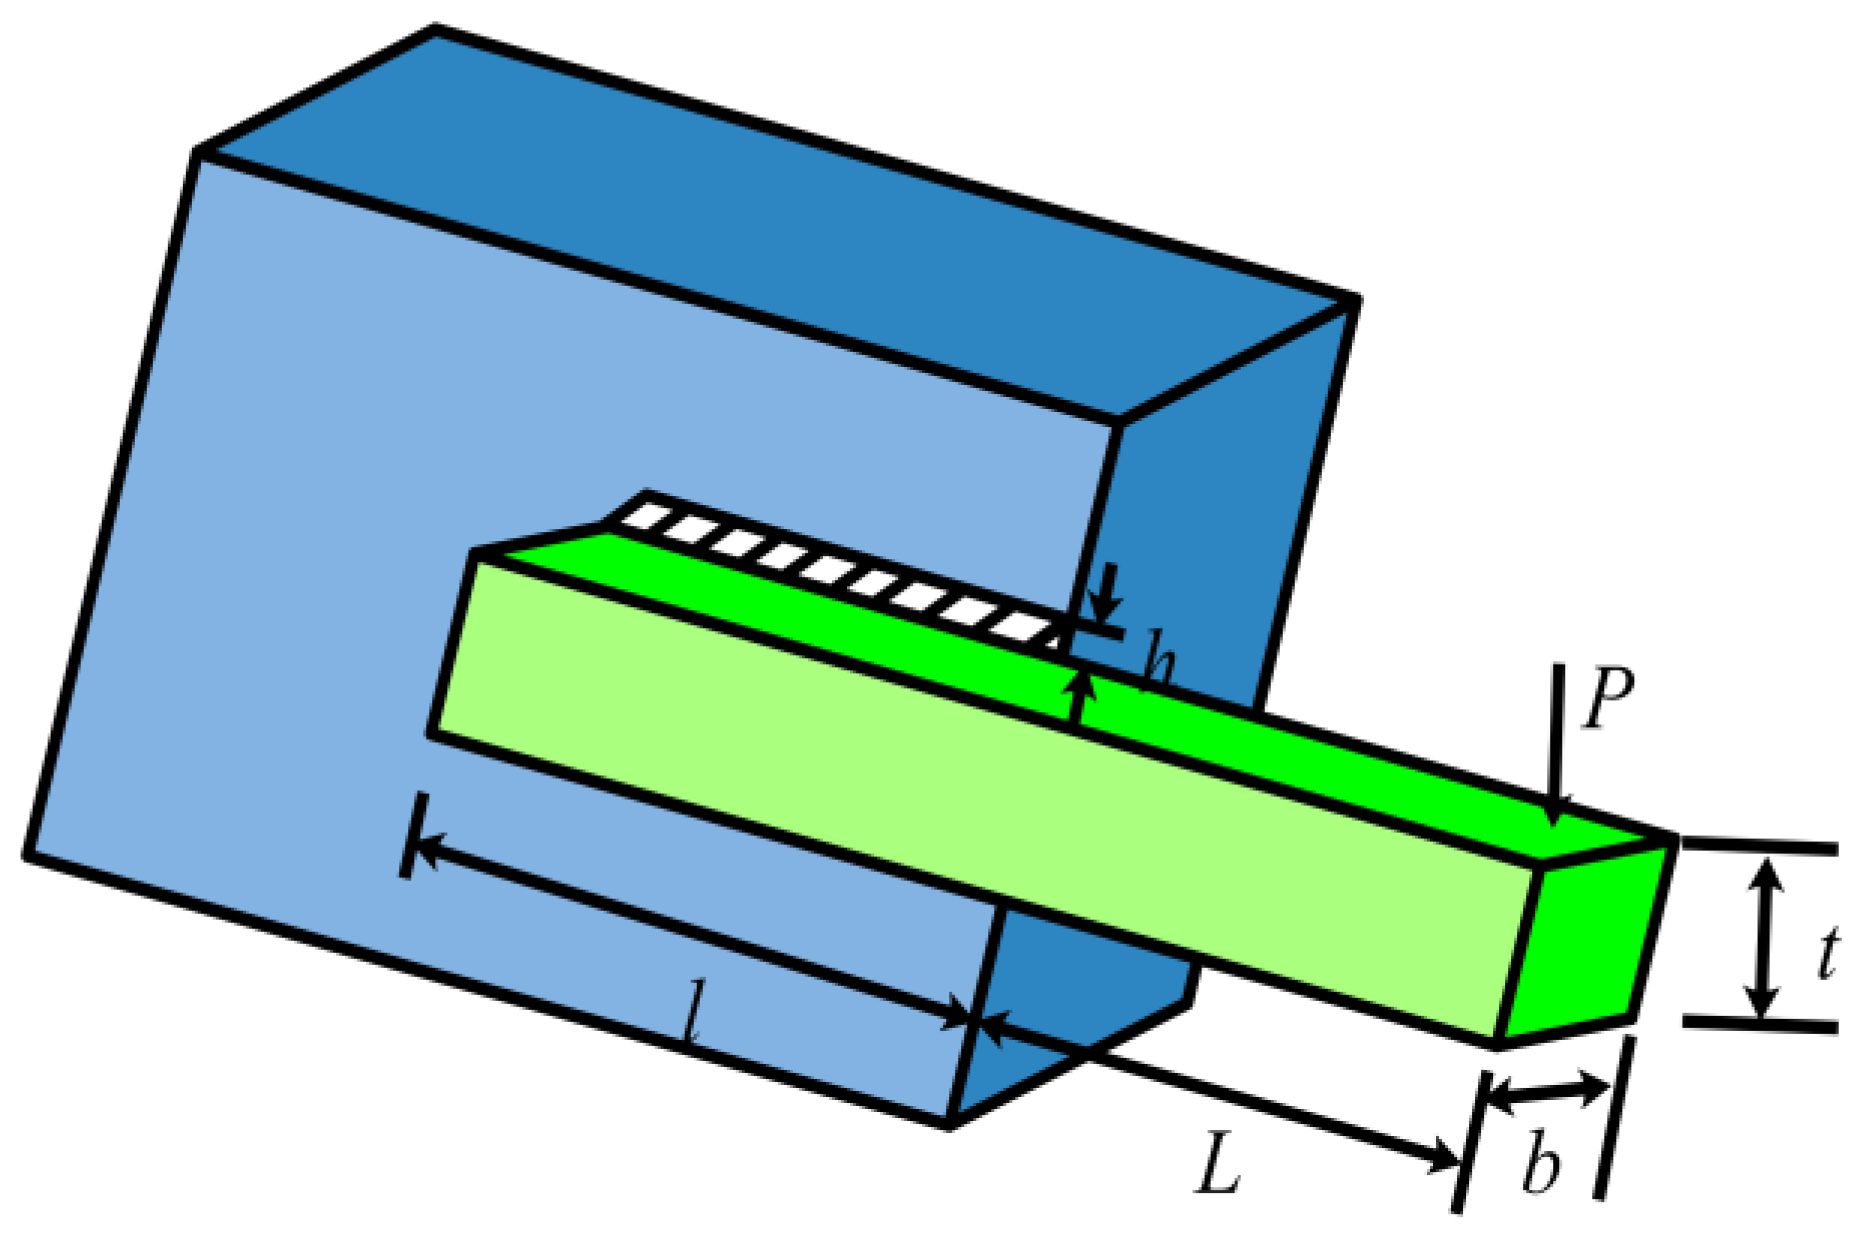
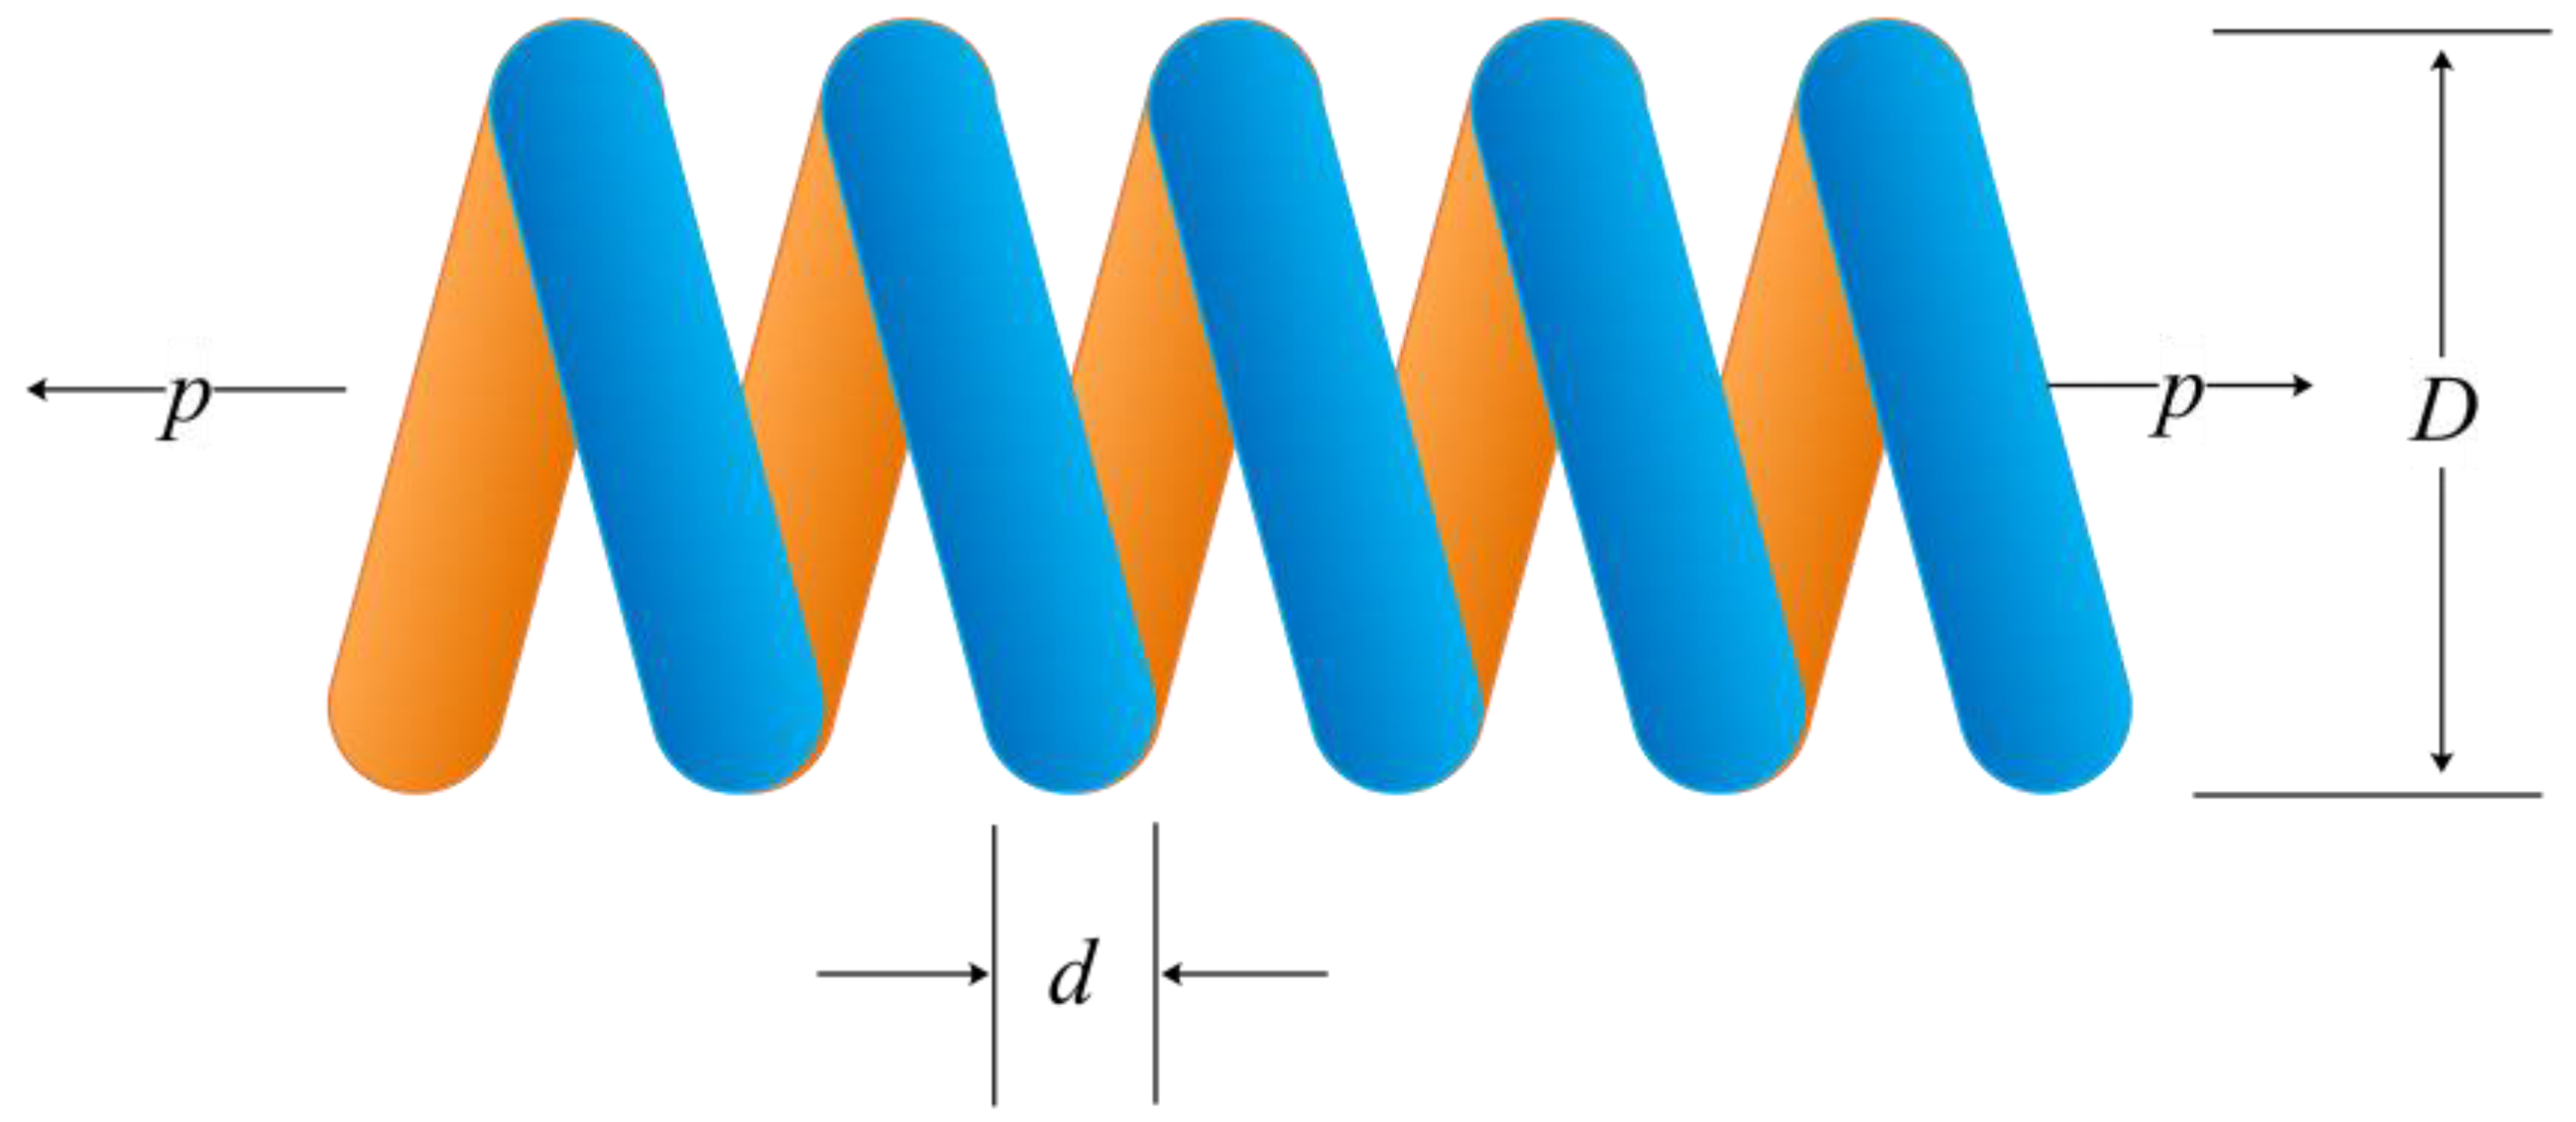
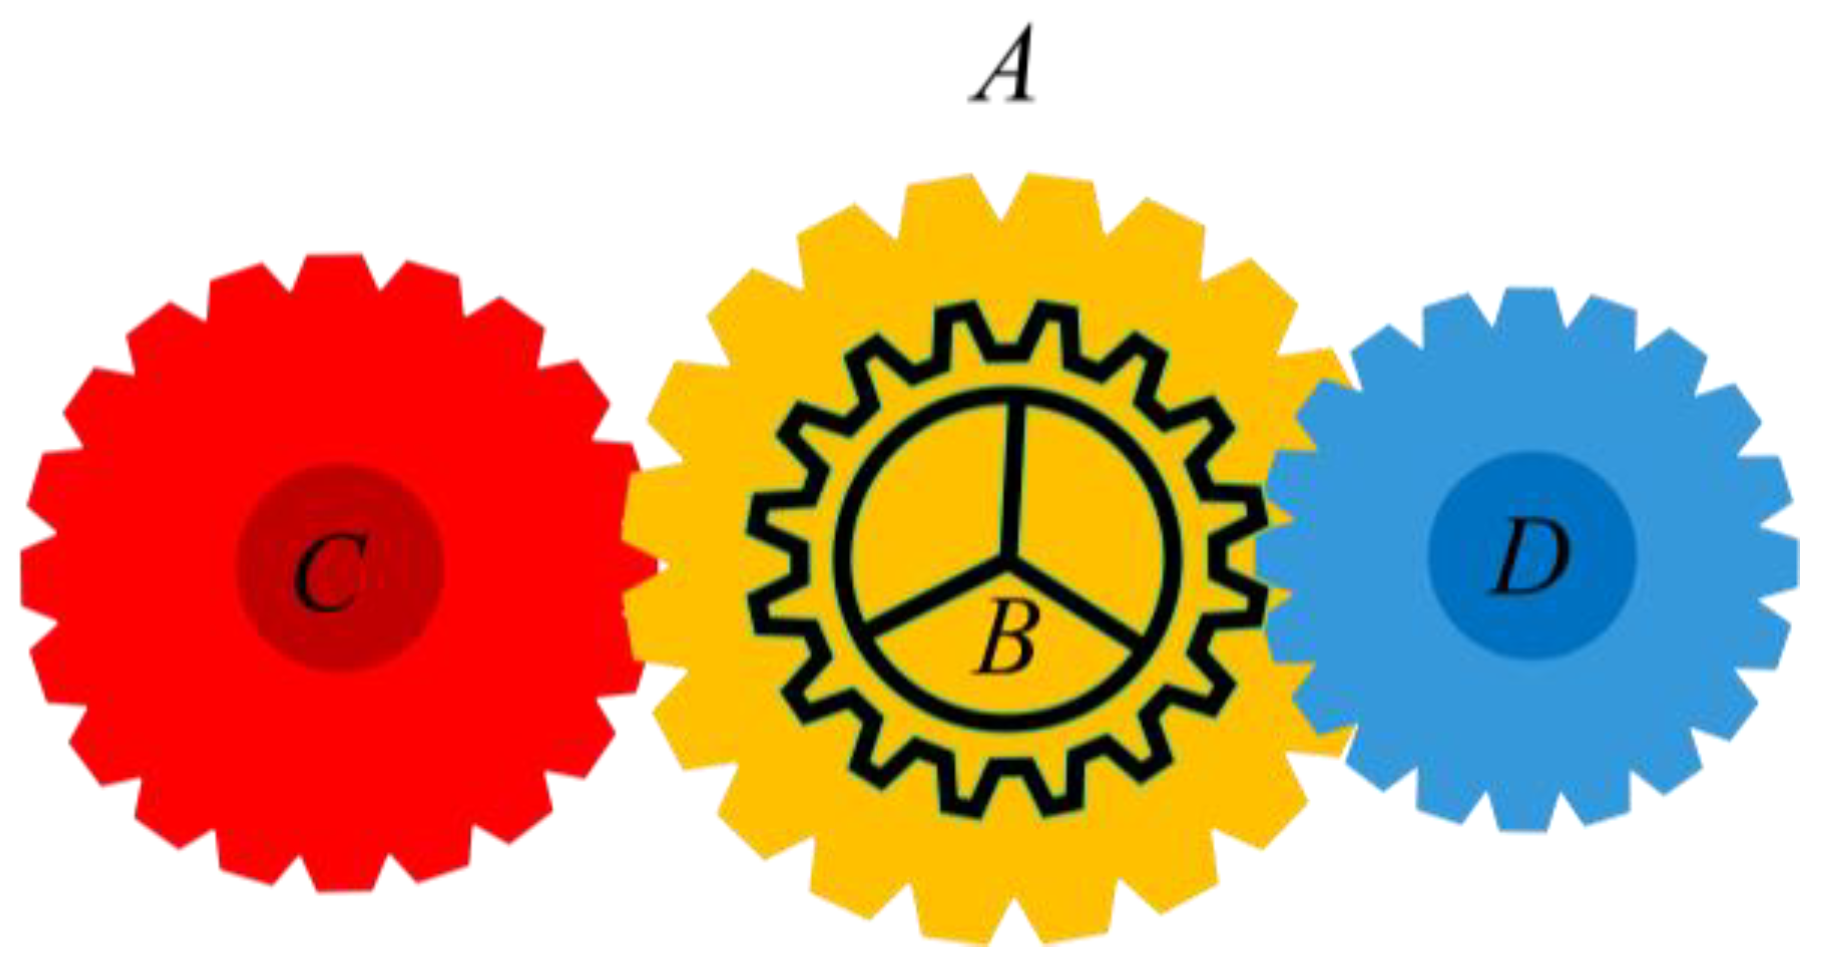
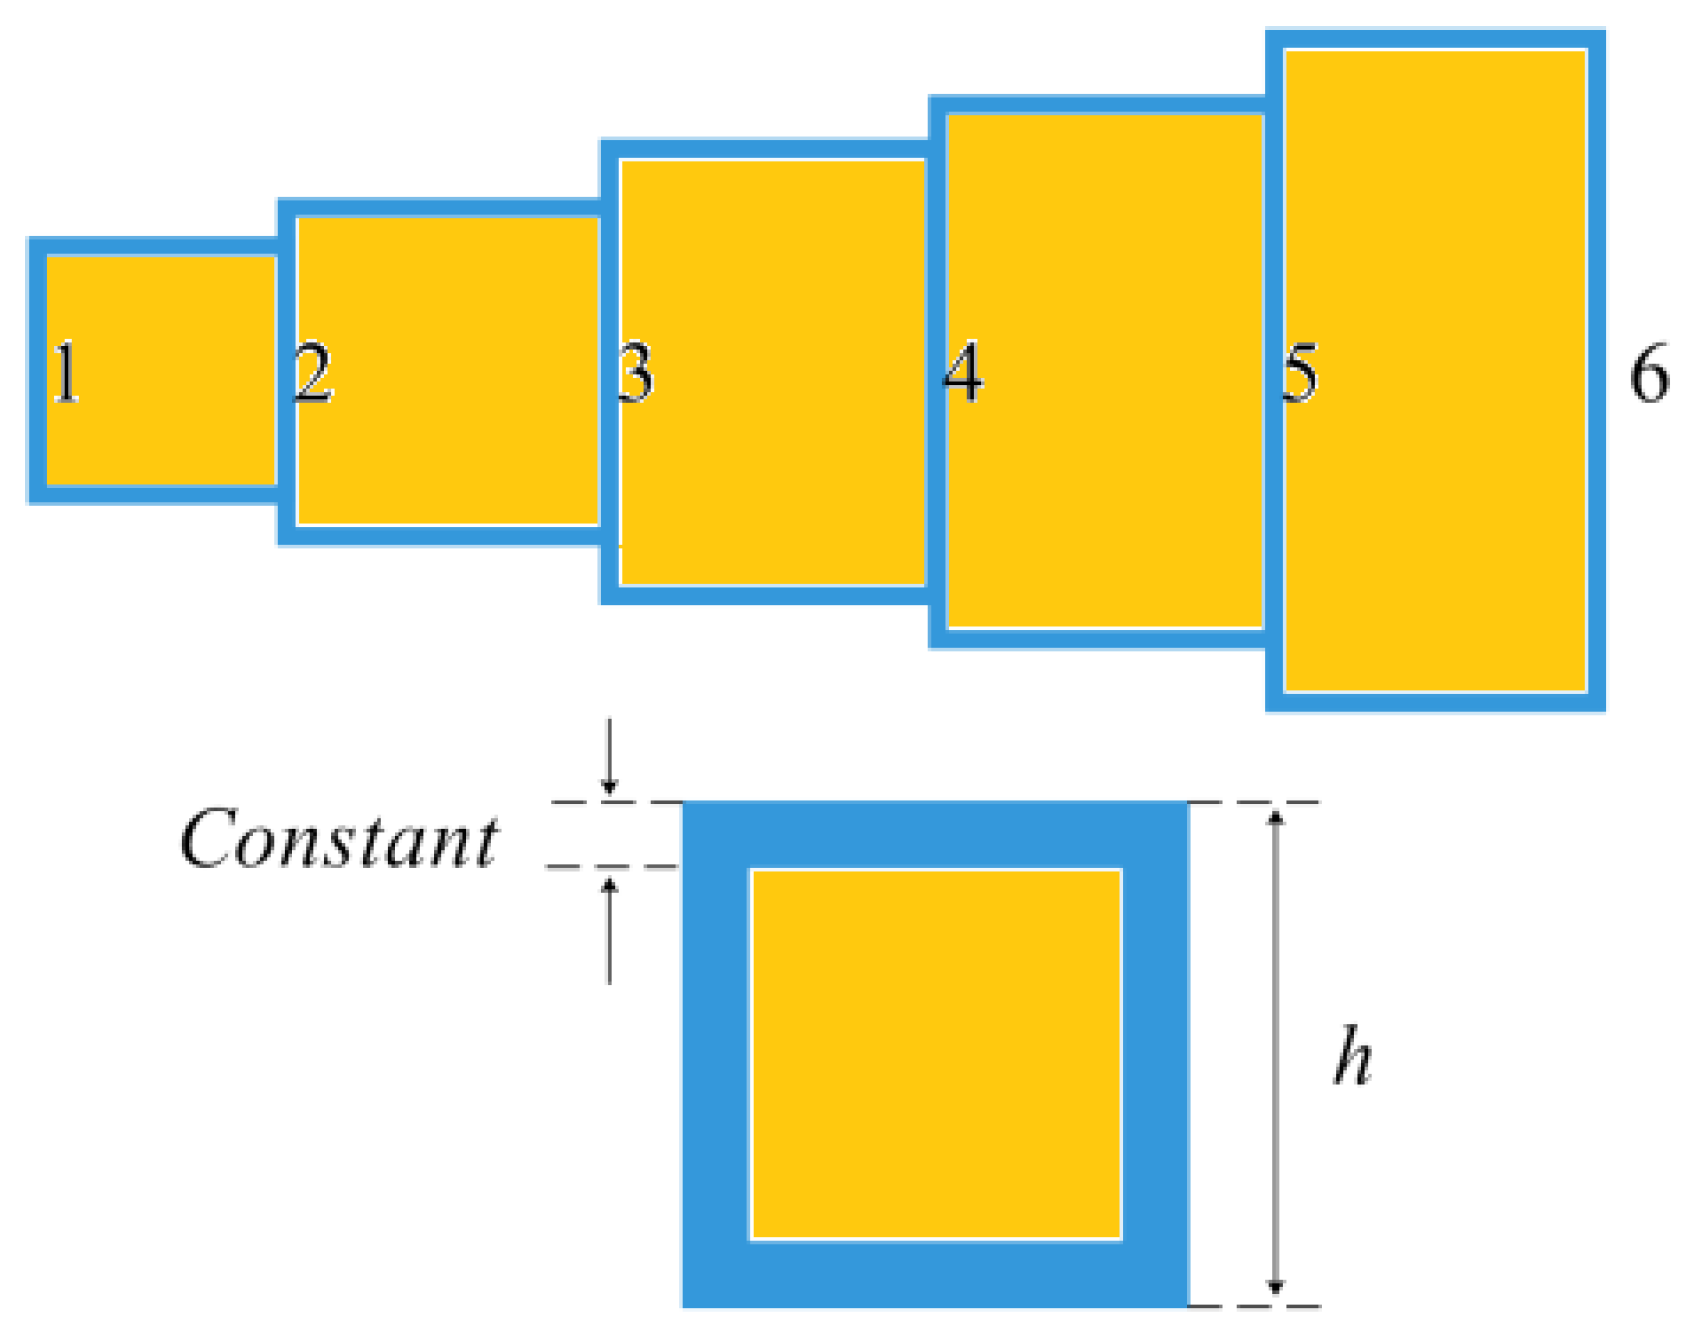
- The UCDCPA is applied to five classical engineering design problems. Specifically, pressure vessel design problems, welded beam design problems, tension/compression spring design (TCSD) problems, compound gear design problems, and cantilever structure problems. At the same time, some advanced algorithms are selected to compare their performance with the UCDCPA.
2. Overview of the CPA
2.1. Initialization
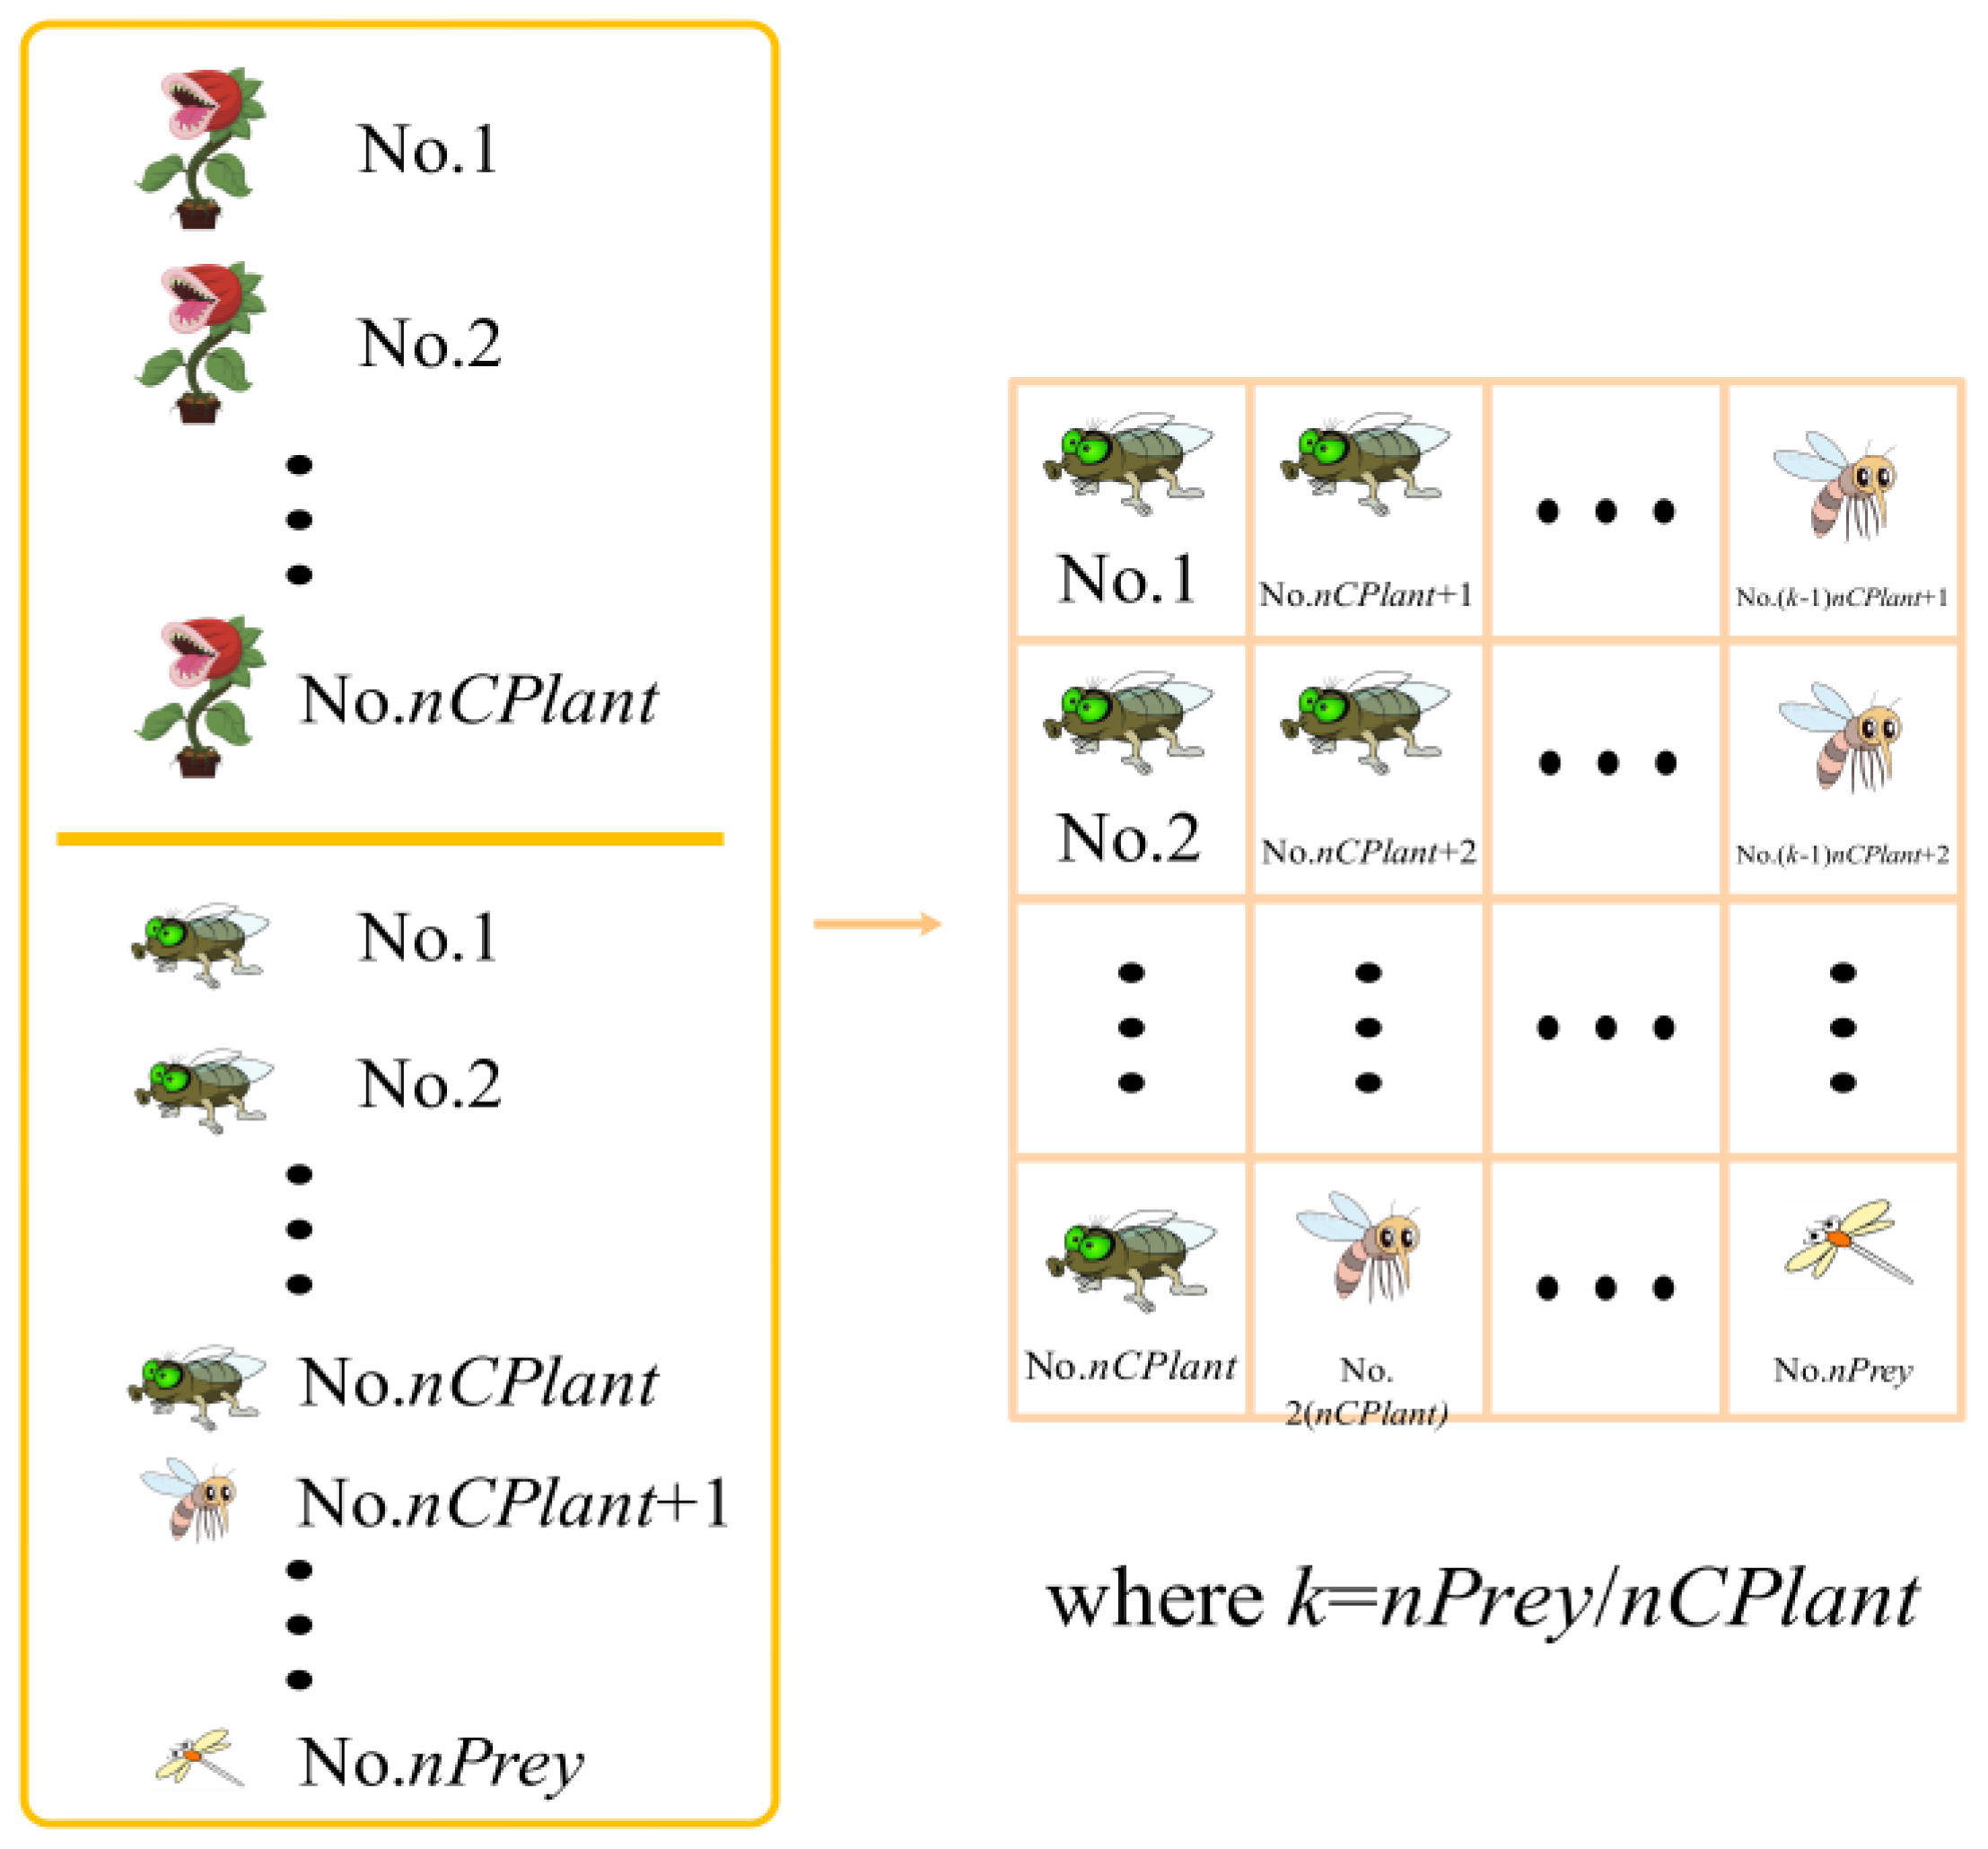
2.2. Classification and Grouping
2.3. Growth (Exploration)
2.4. Reproduction (Exploitation)
2.5. Fitness Update and Combine the Population
3. Improved Carnivorous Plant Algorithm
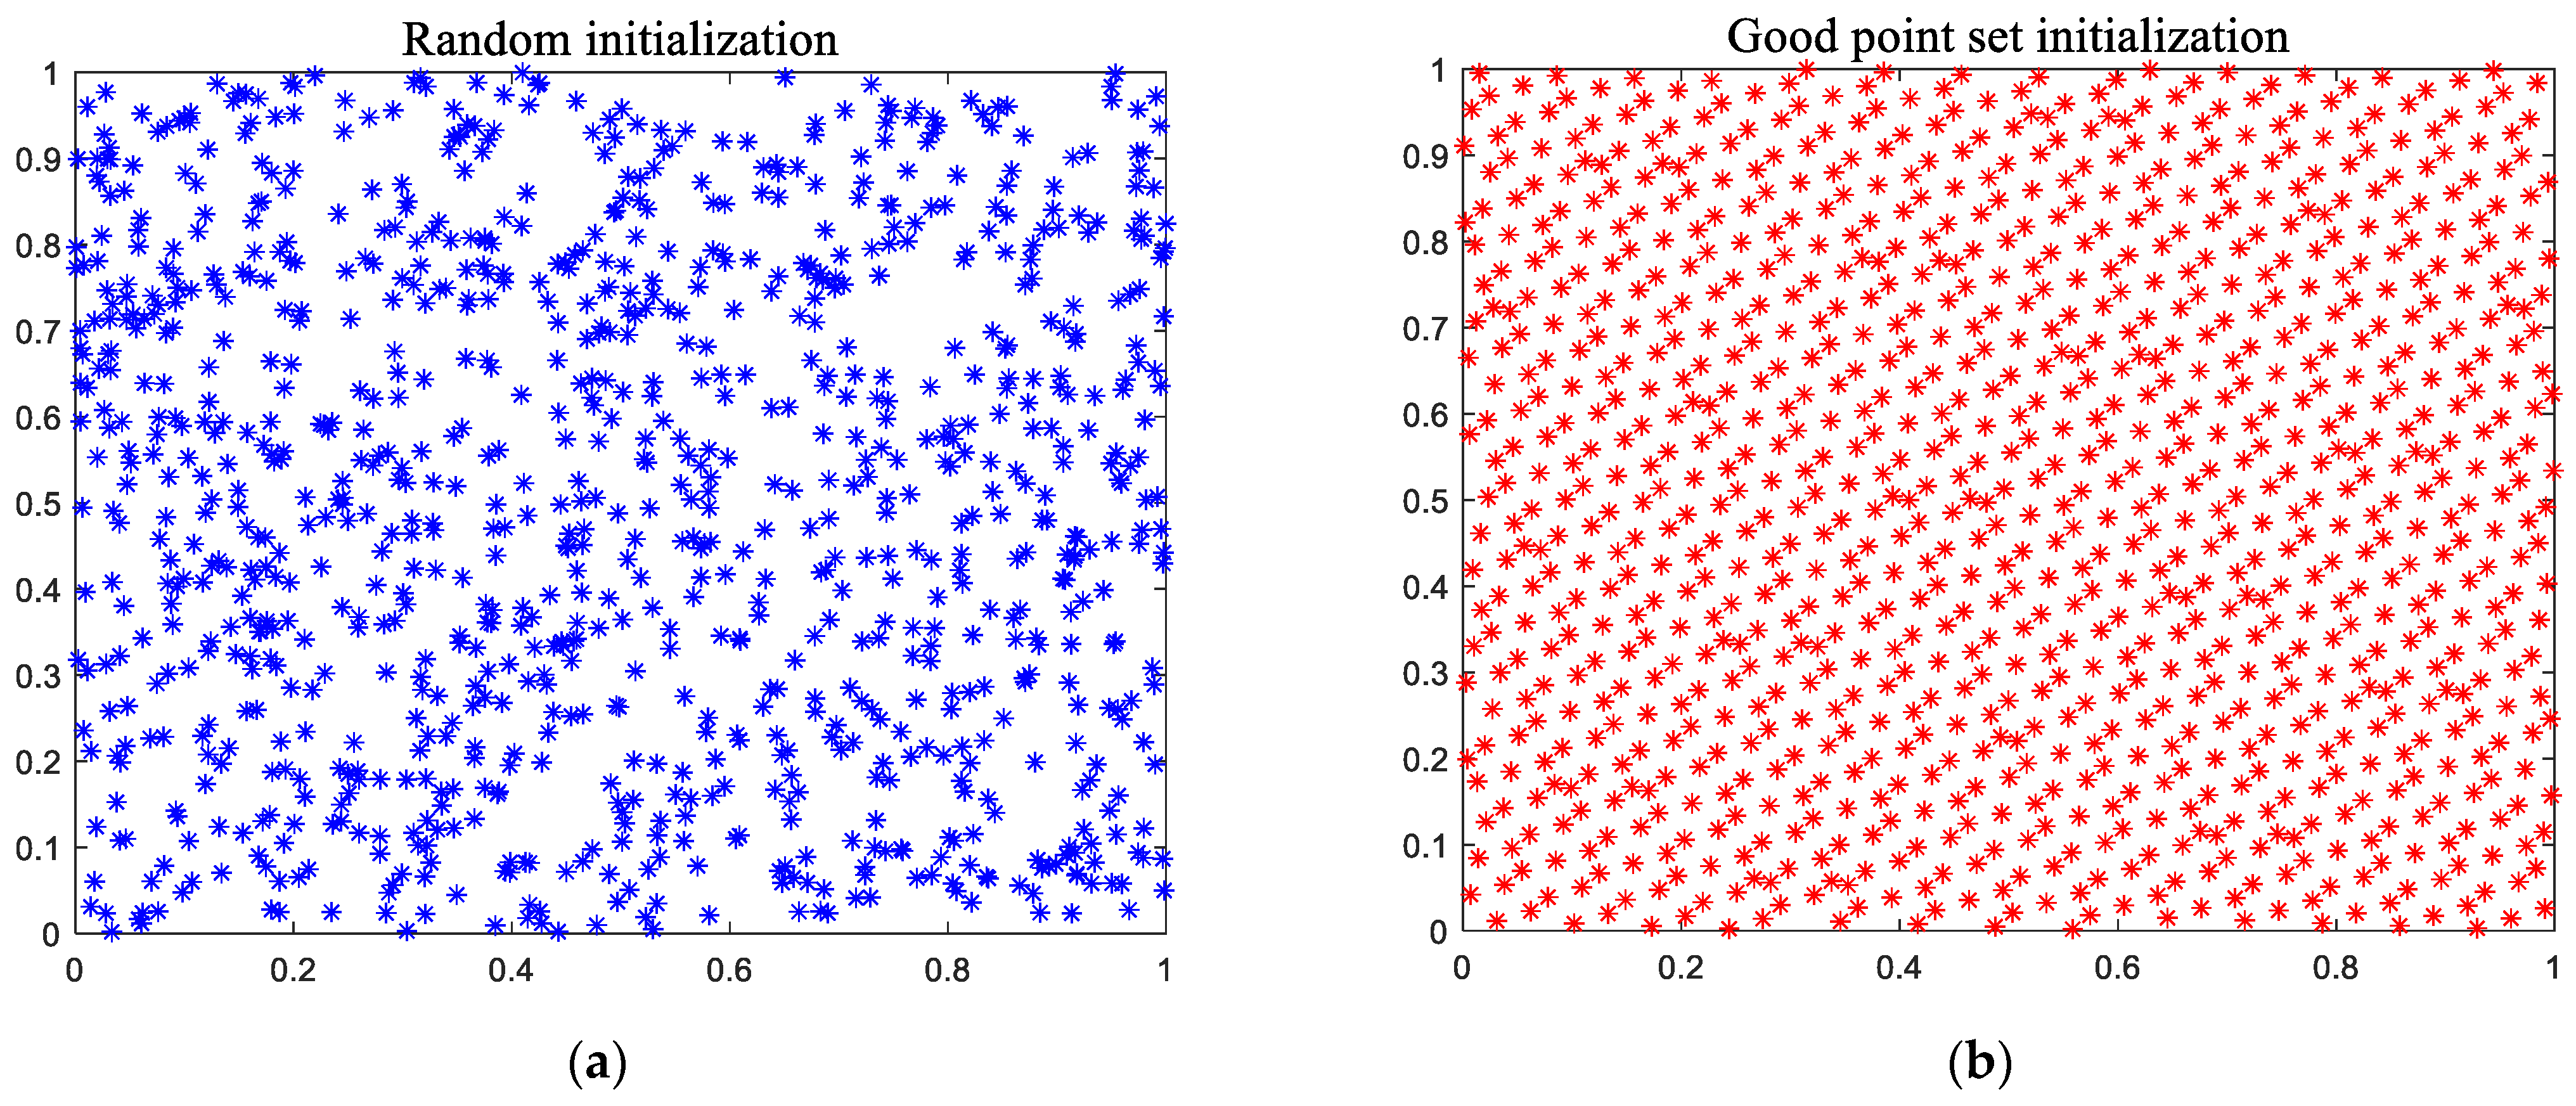
3.1. Good Point Set Uniform Initialization
3.2. Cauchy Mutation
3.3. Differential Evolution Theory
3.3.1. Operation of Mutation
3.3.2. Cross Operation
3.3.3. Survival Criterion (Greedy Choice)
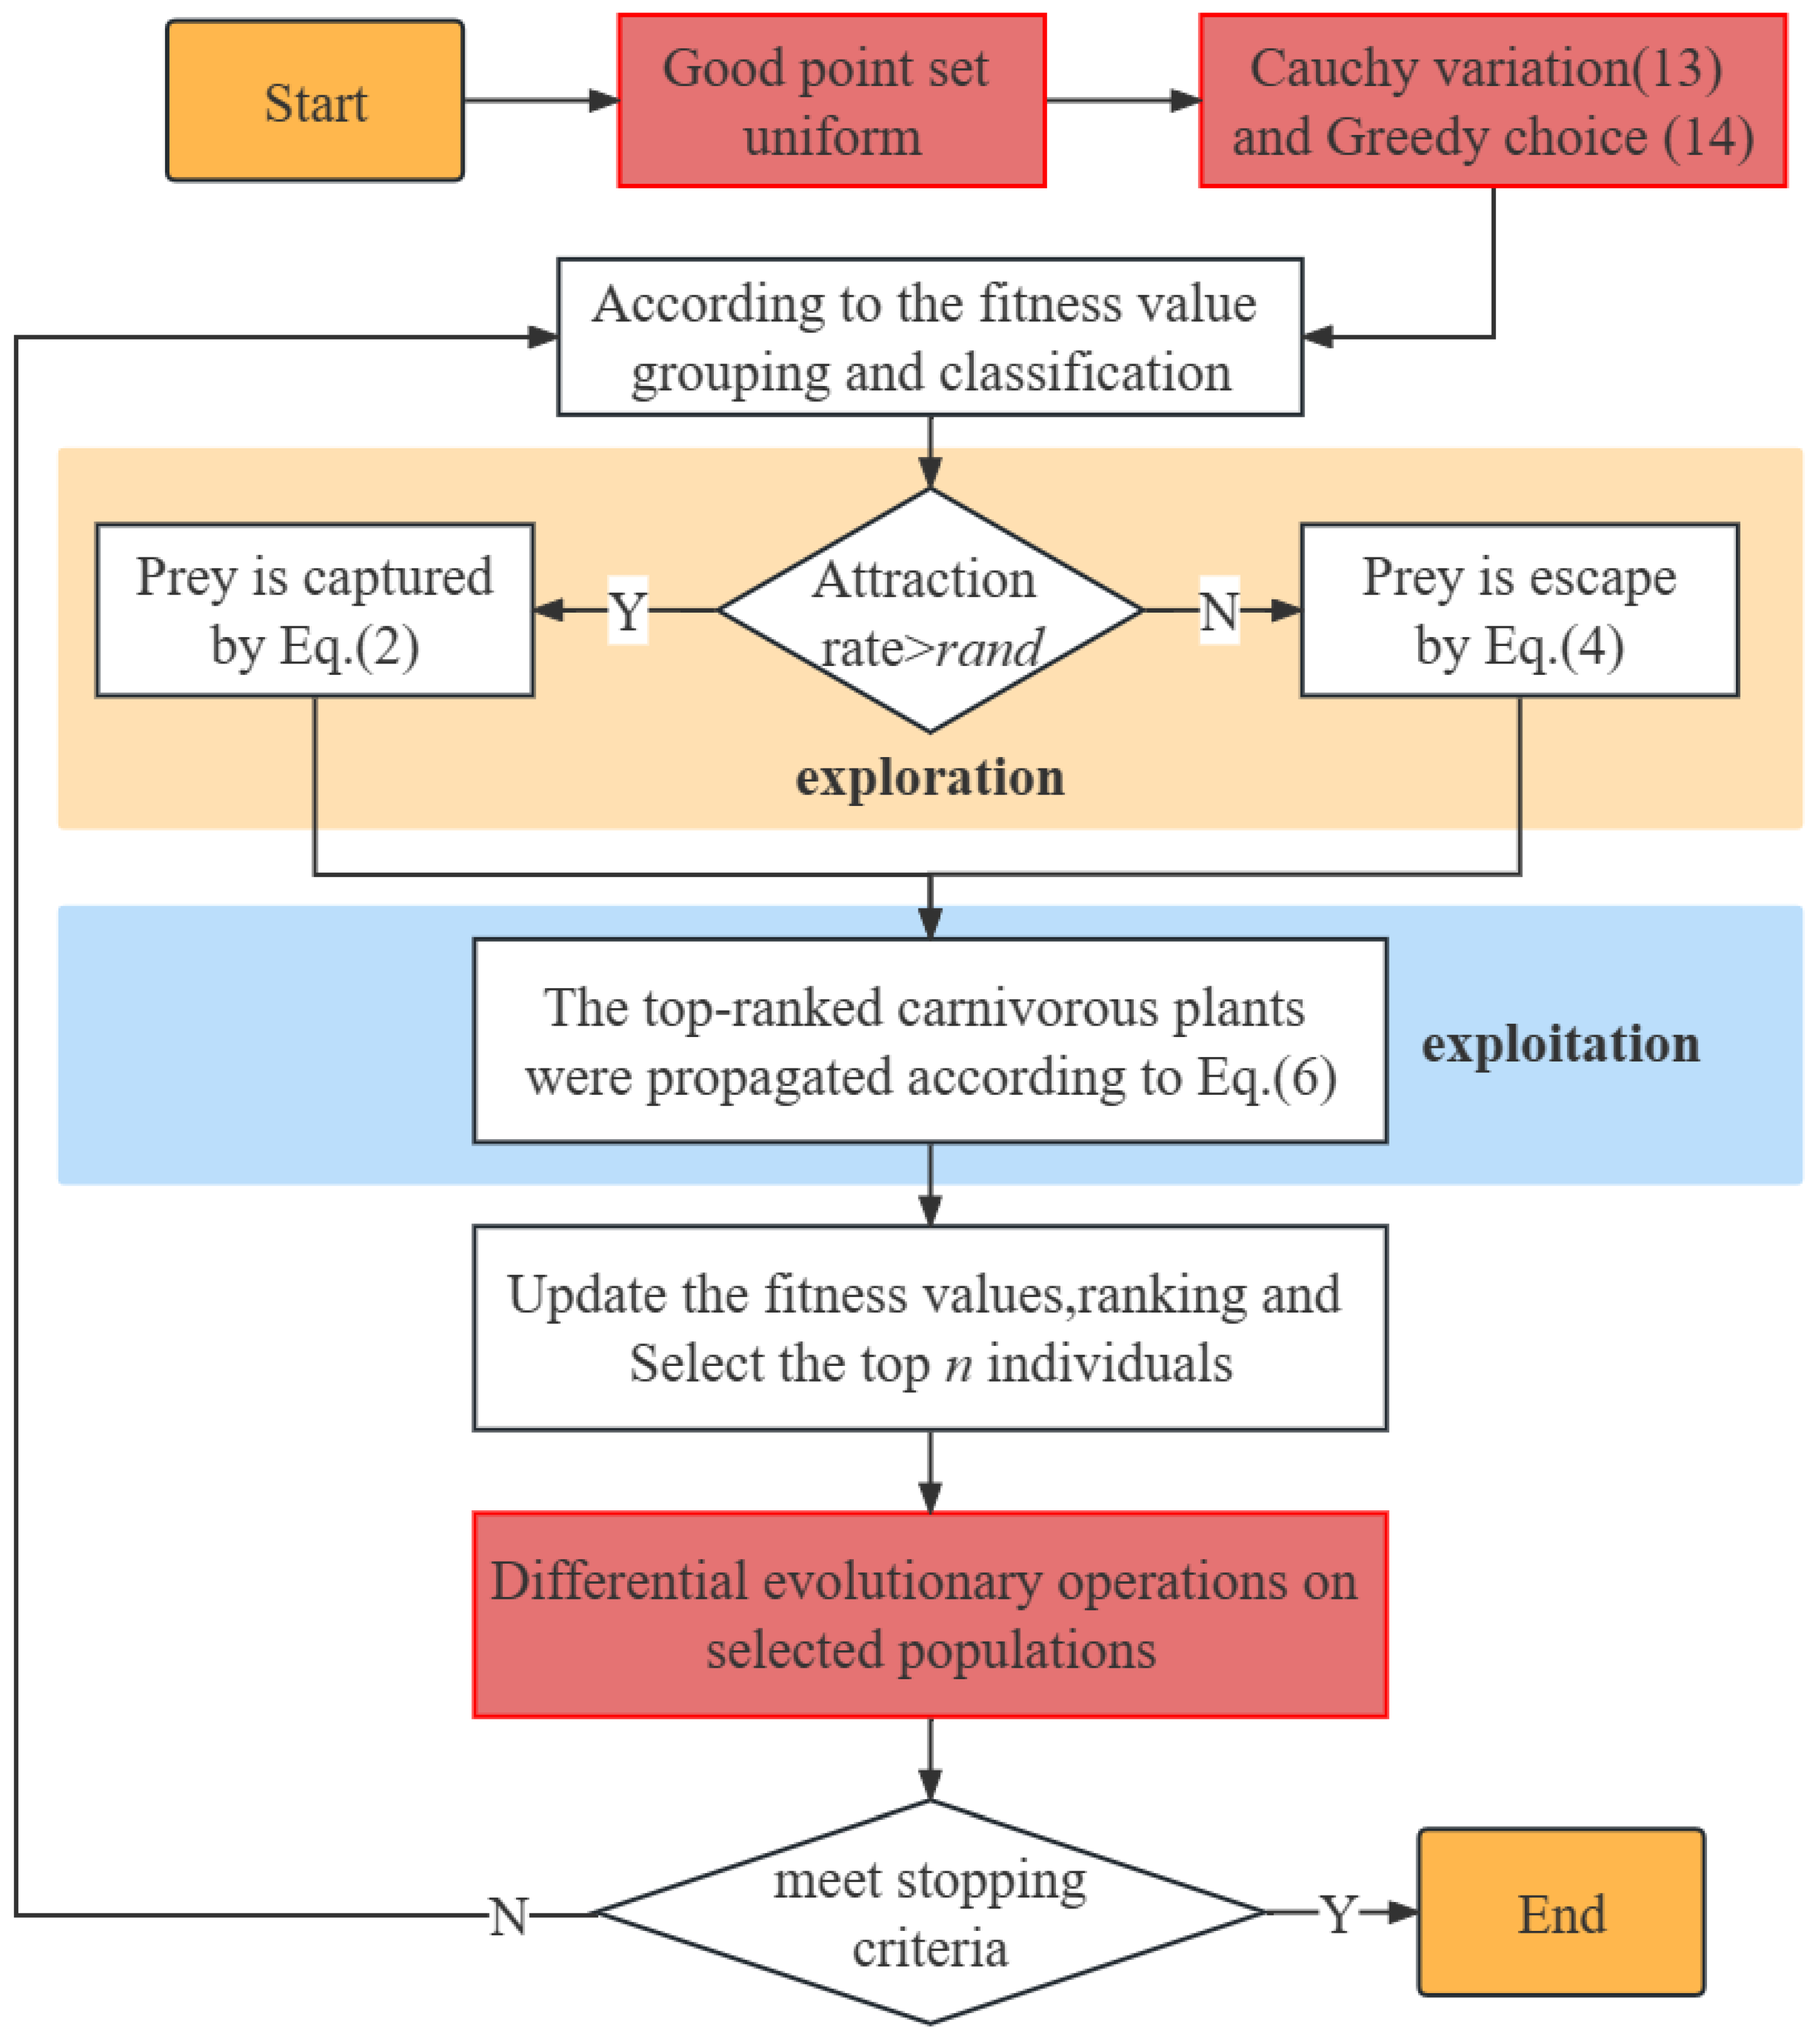
3.4. Detailed Description of the UCDCPA
| Algorithm 1: The Pseudo code of the UCDCPA |
|
4. Numerical Experiment and Analysis
4.1. Parameter Setting
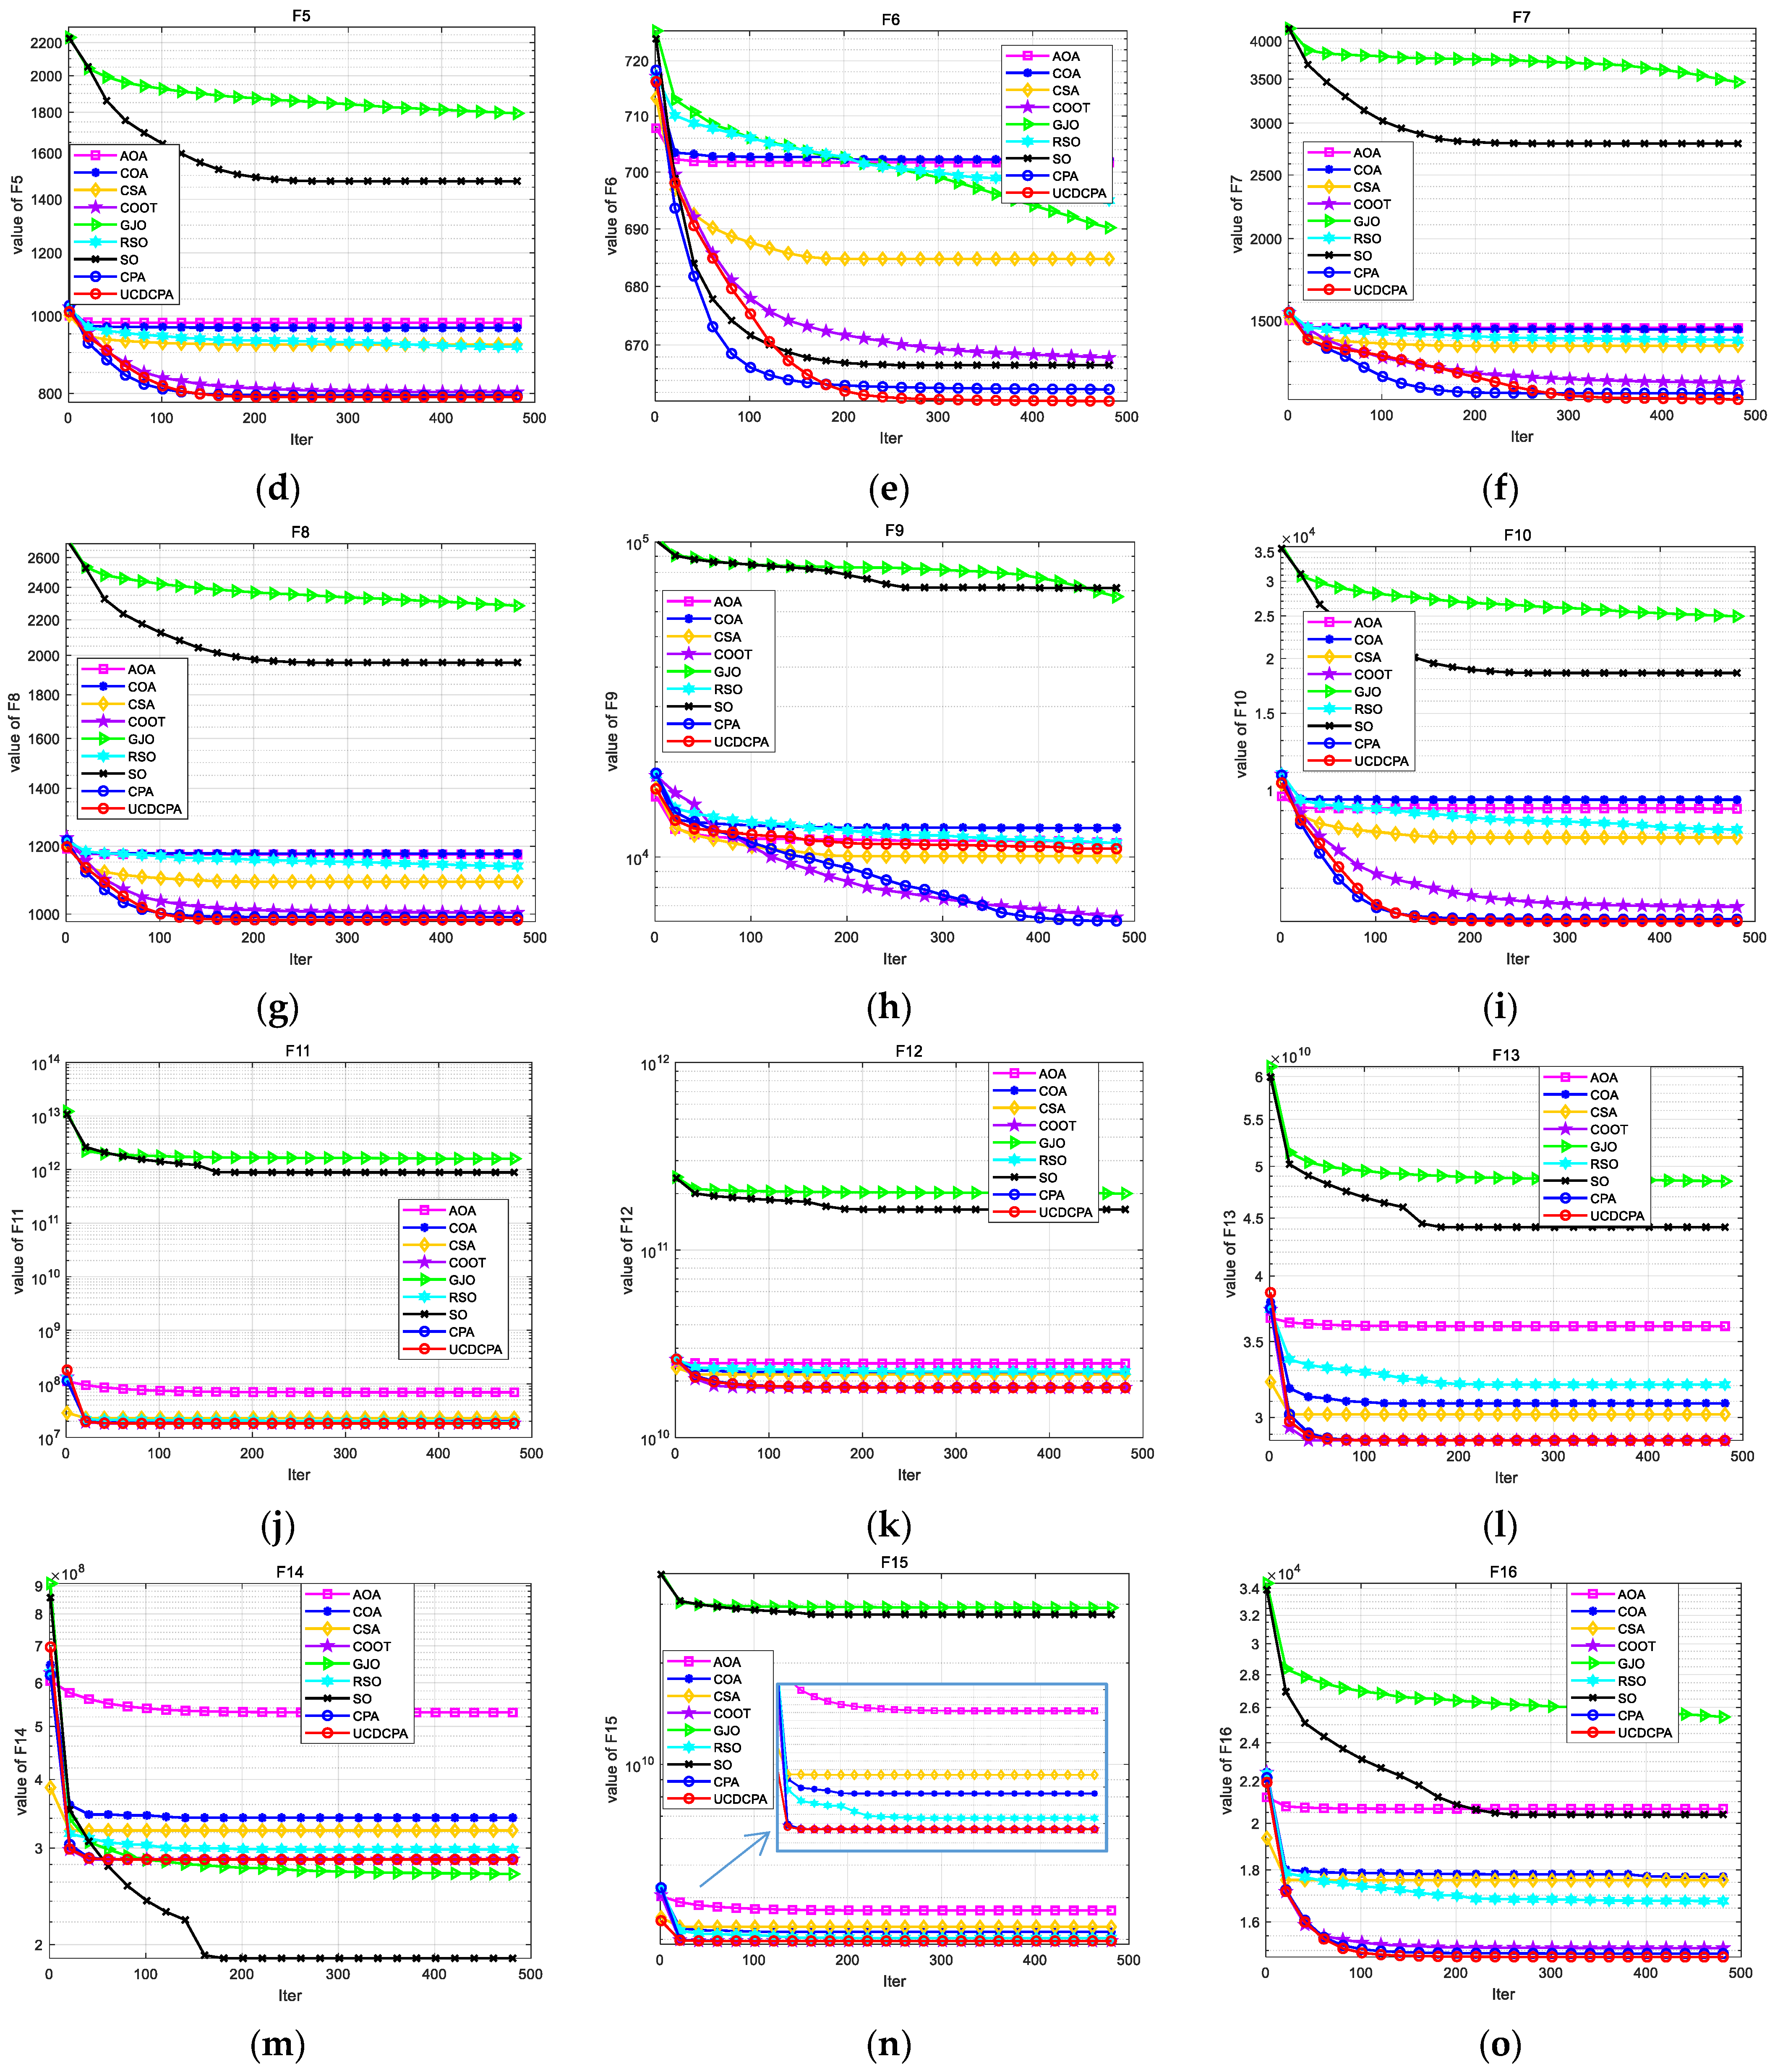
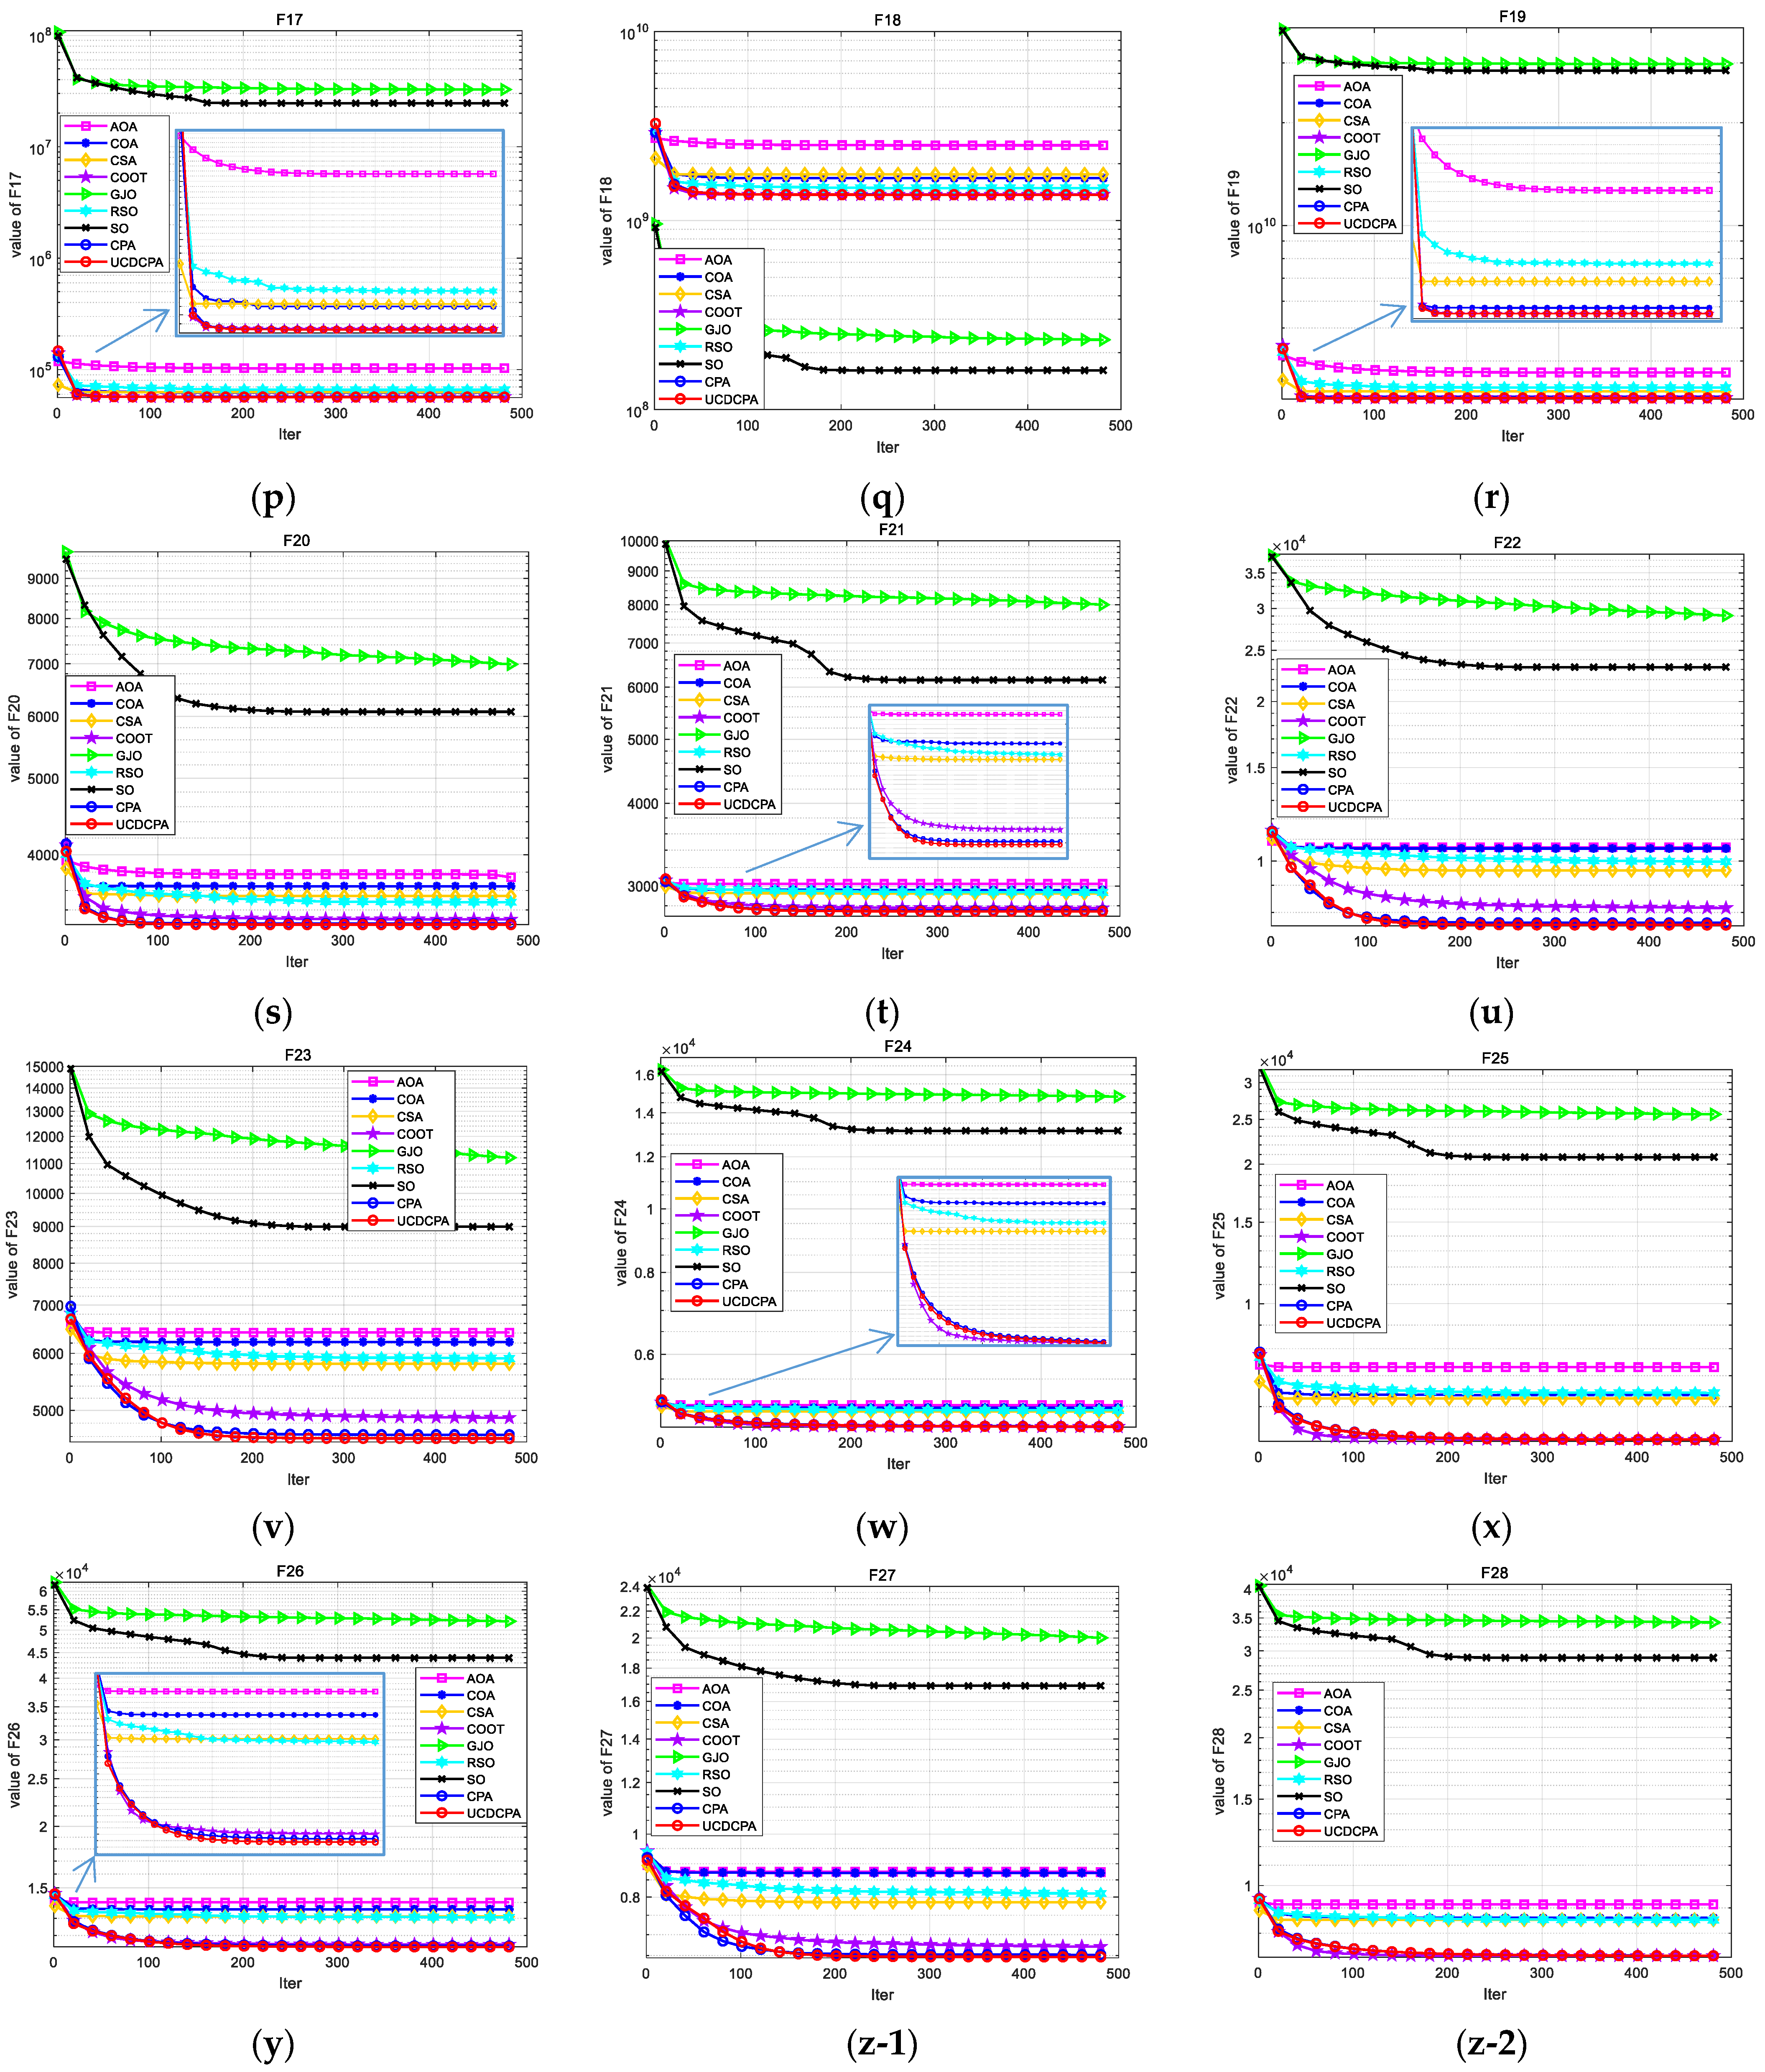
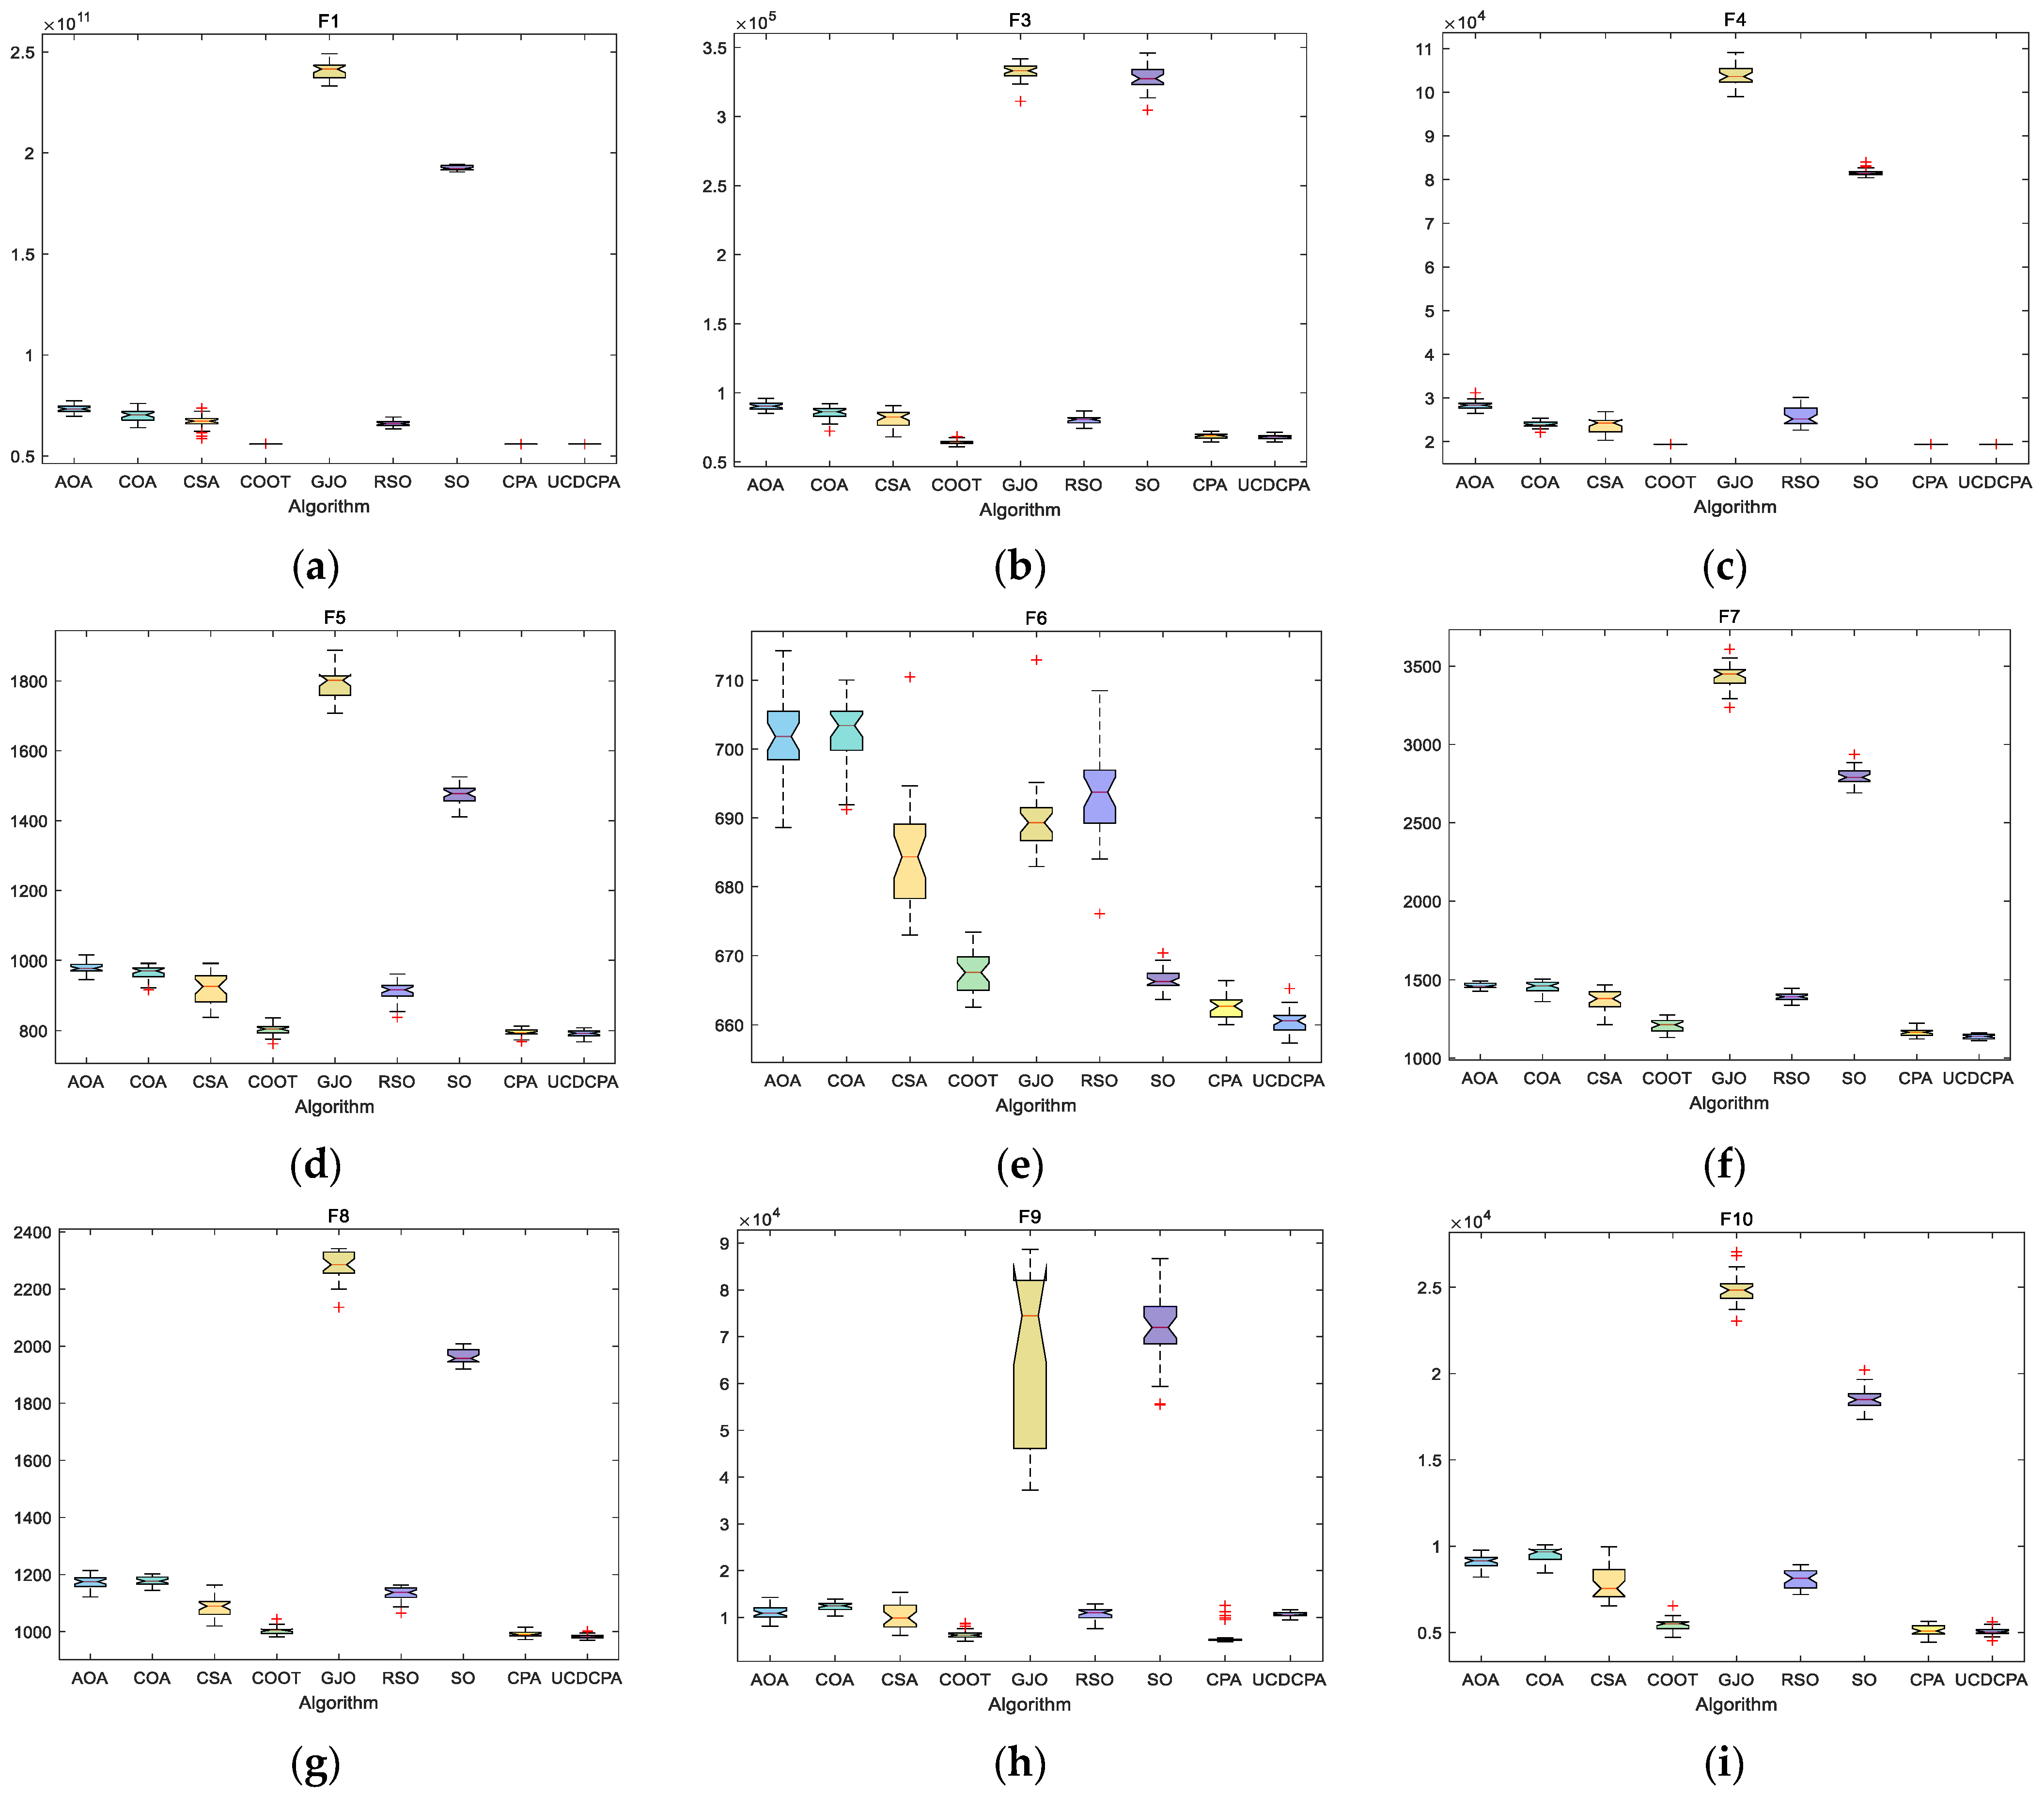
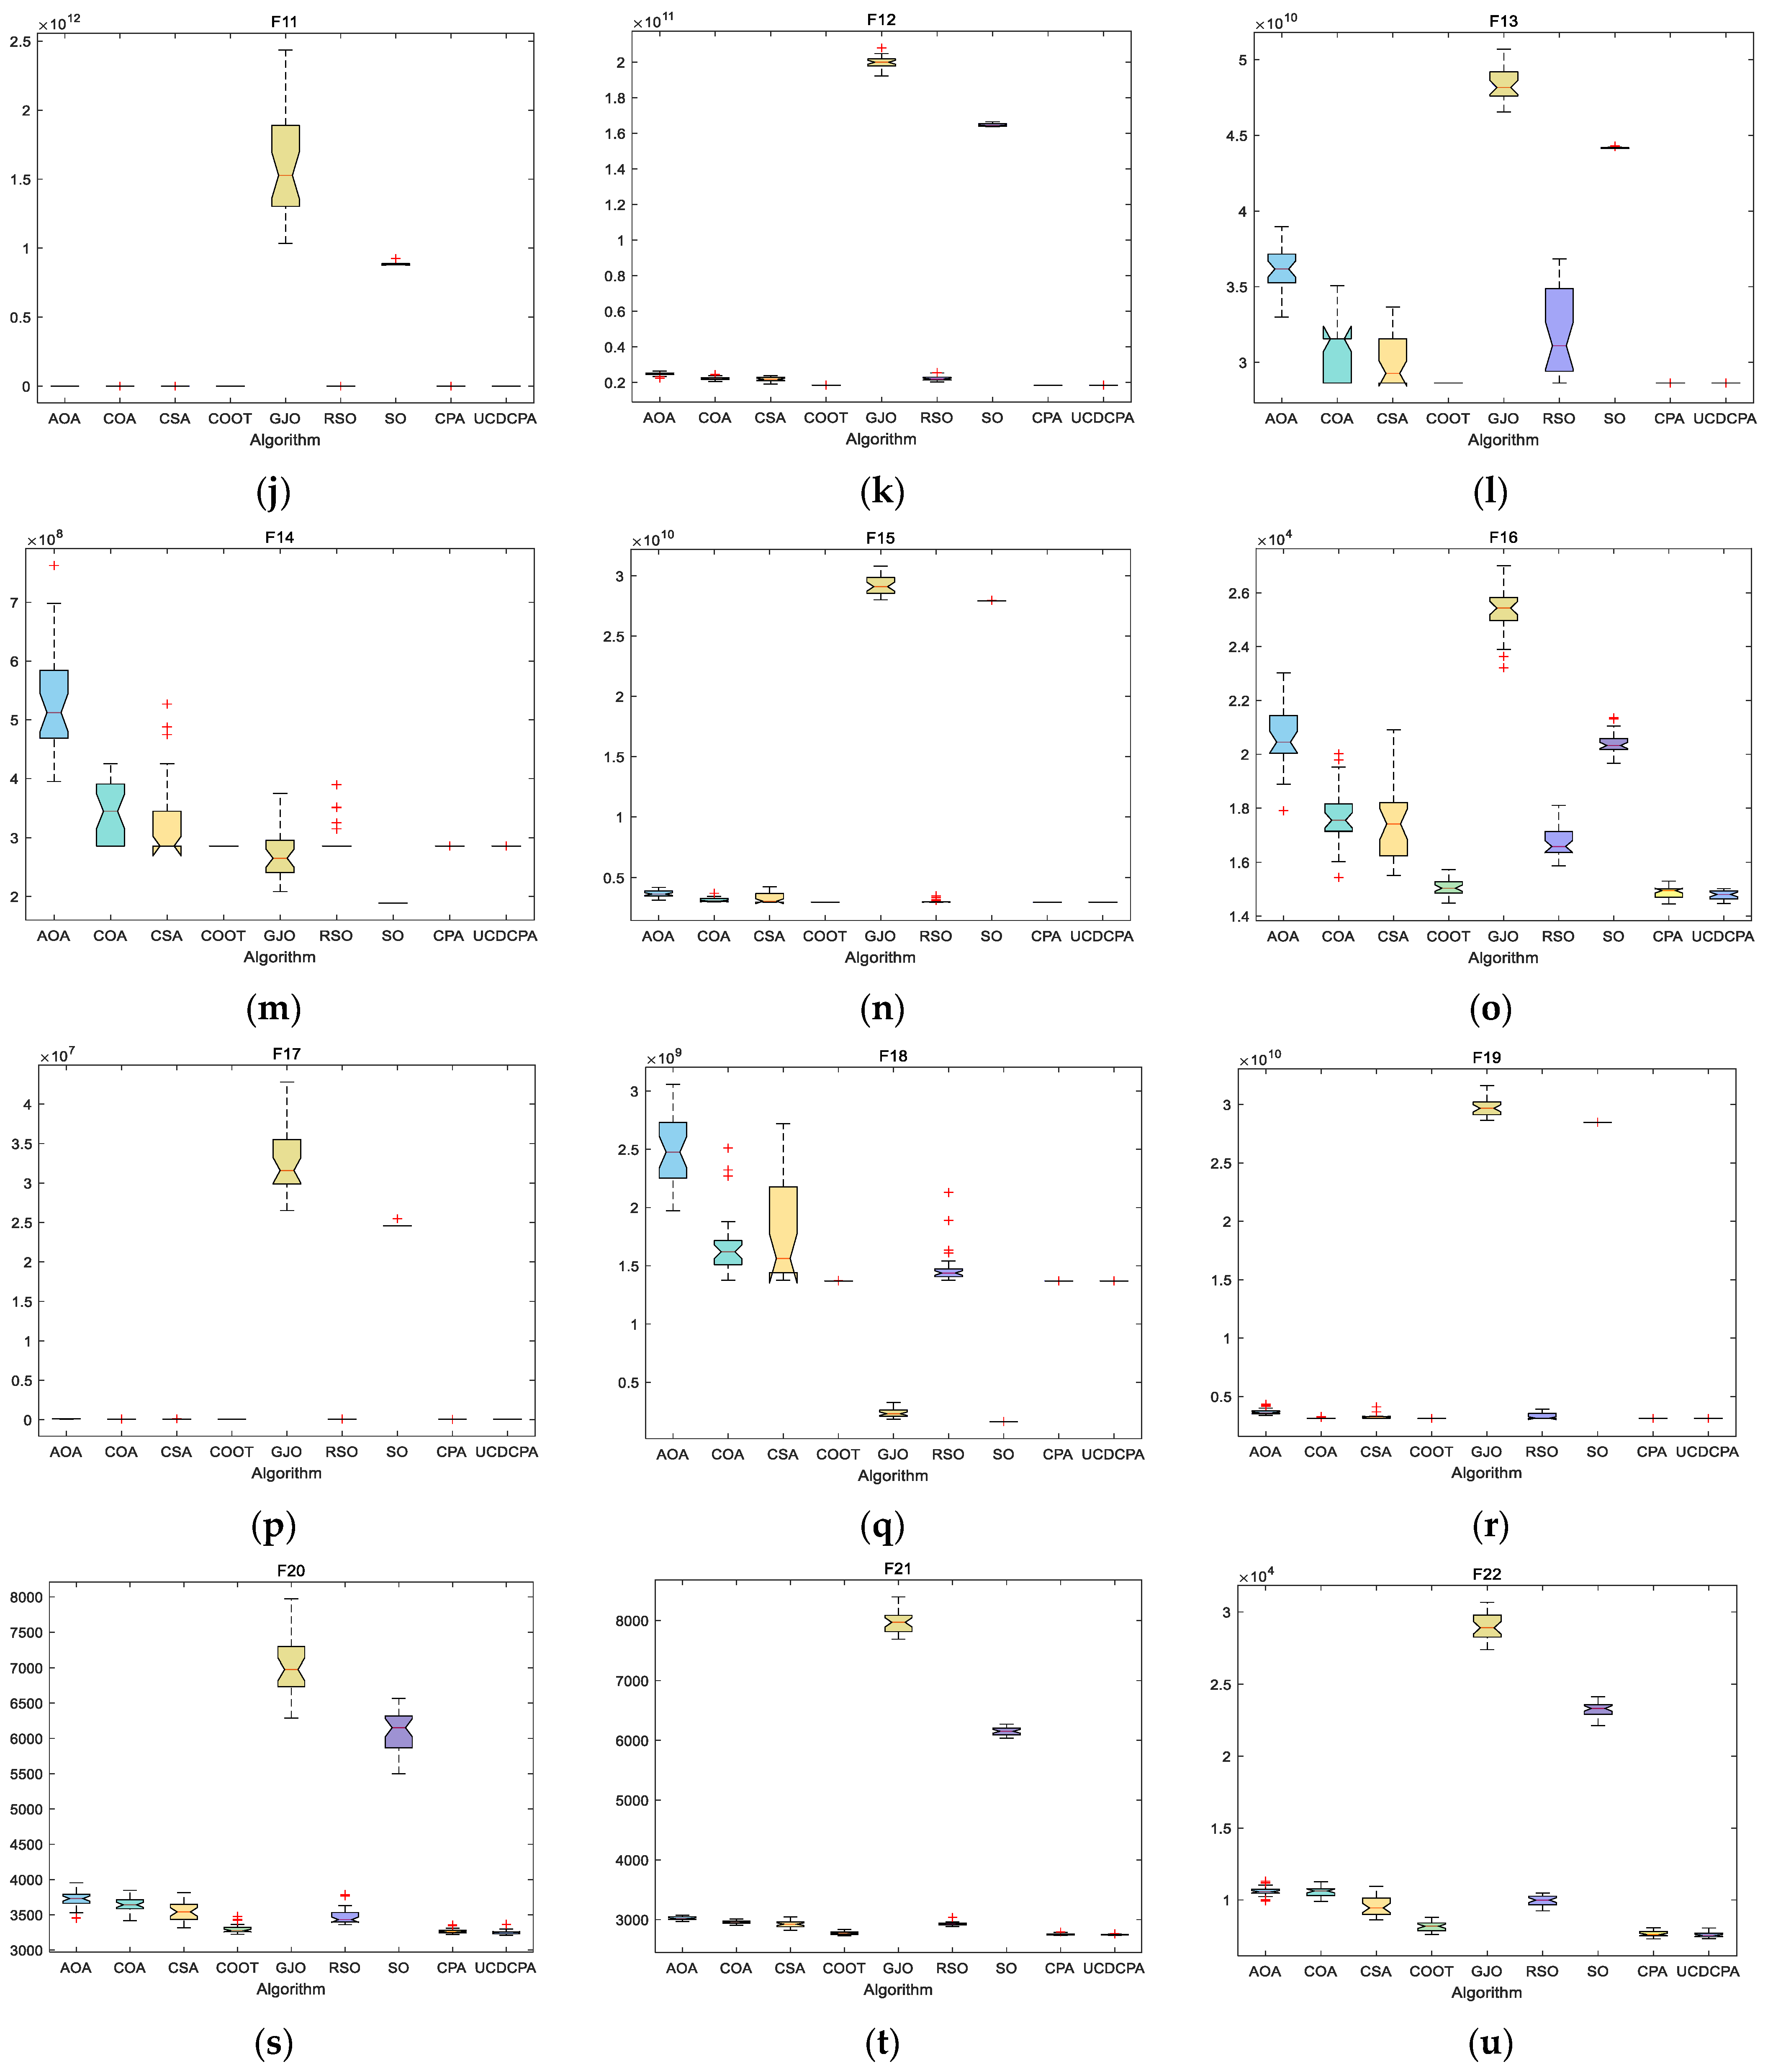
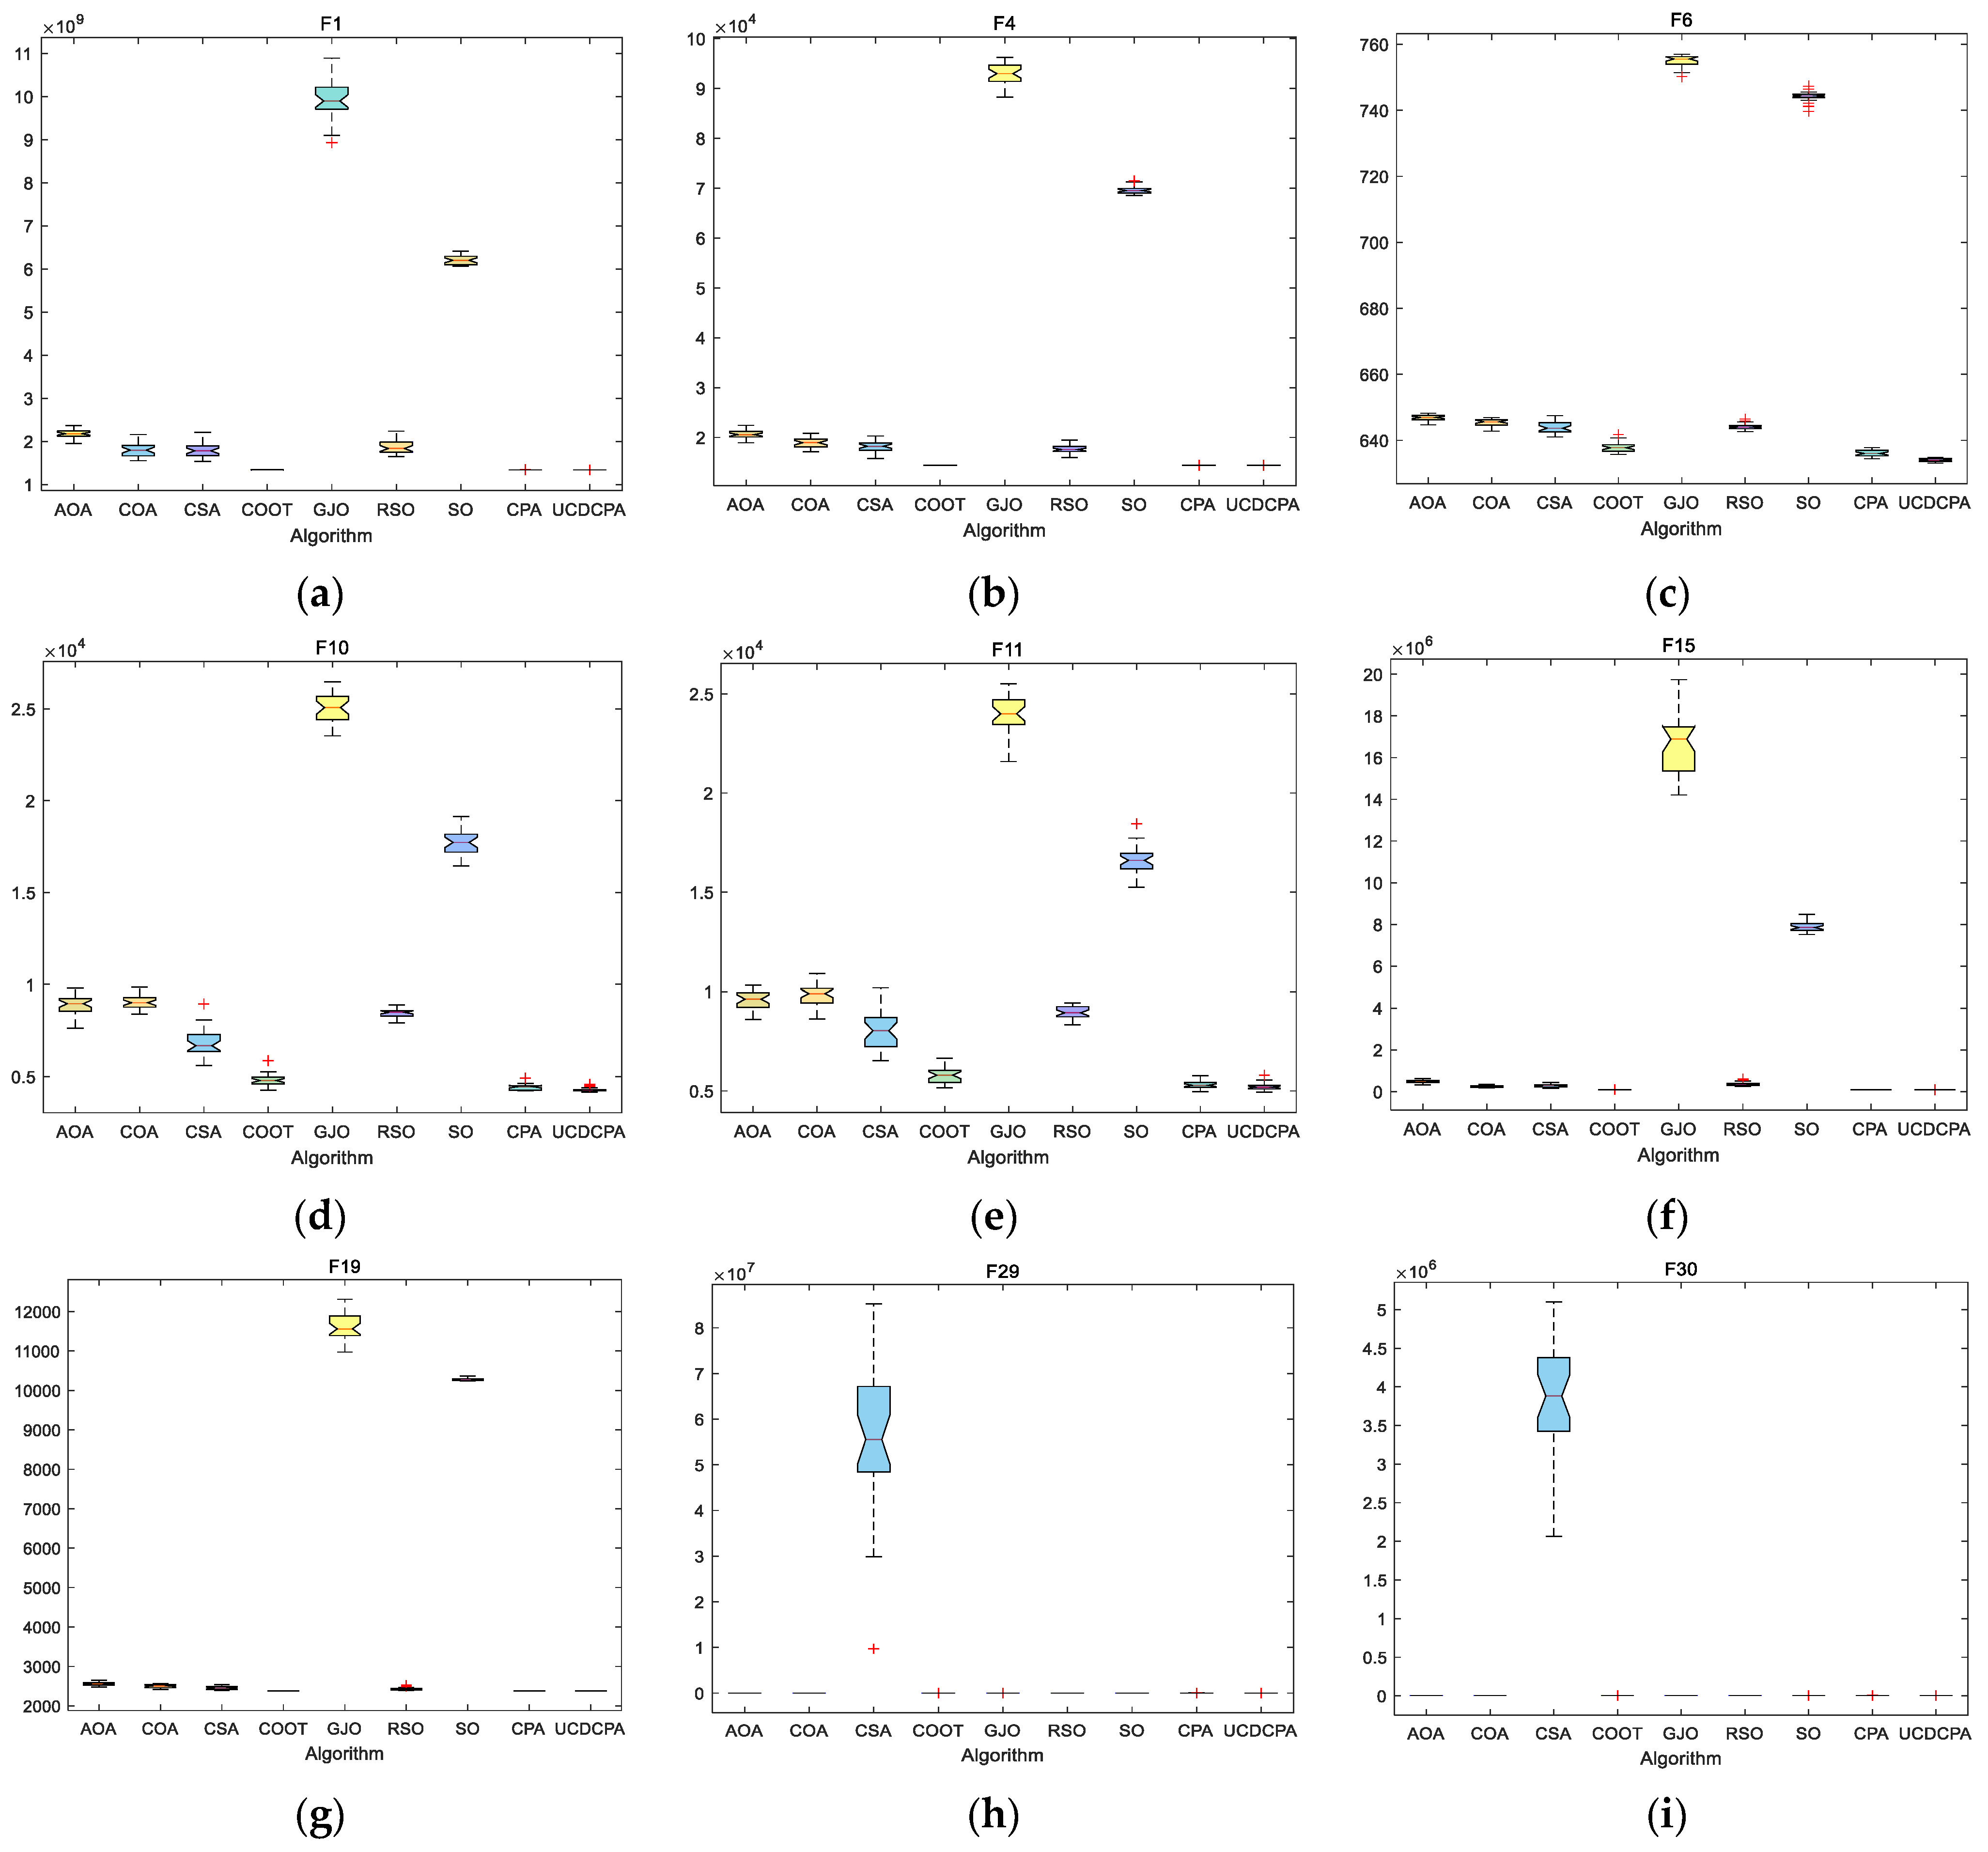
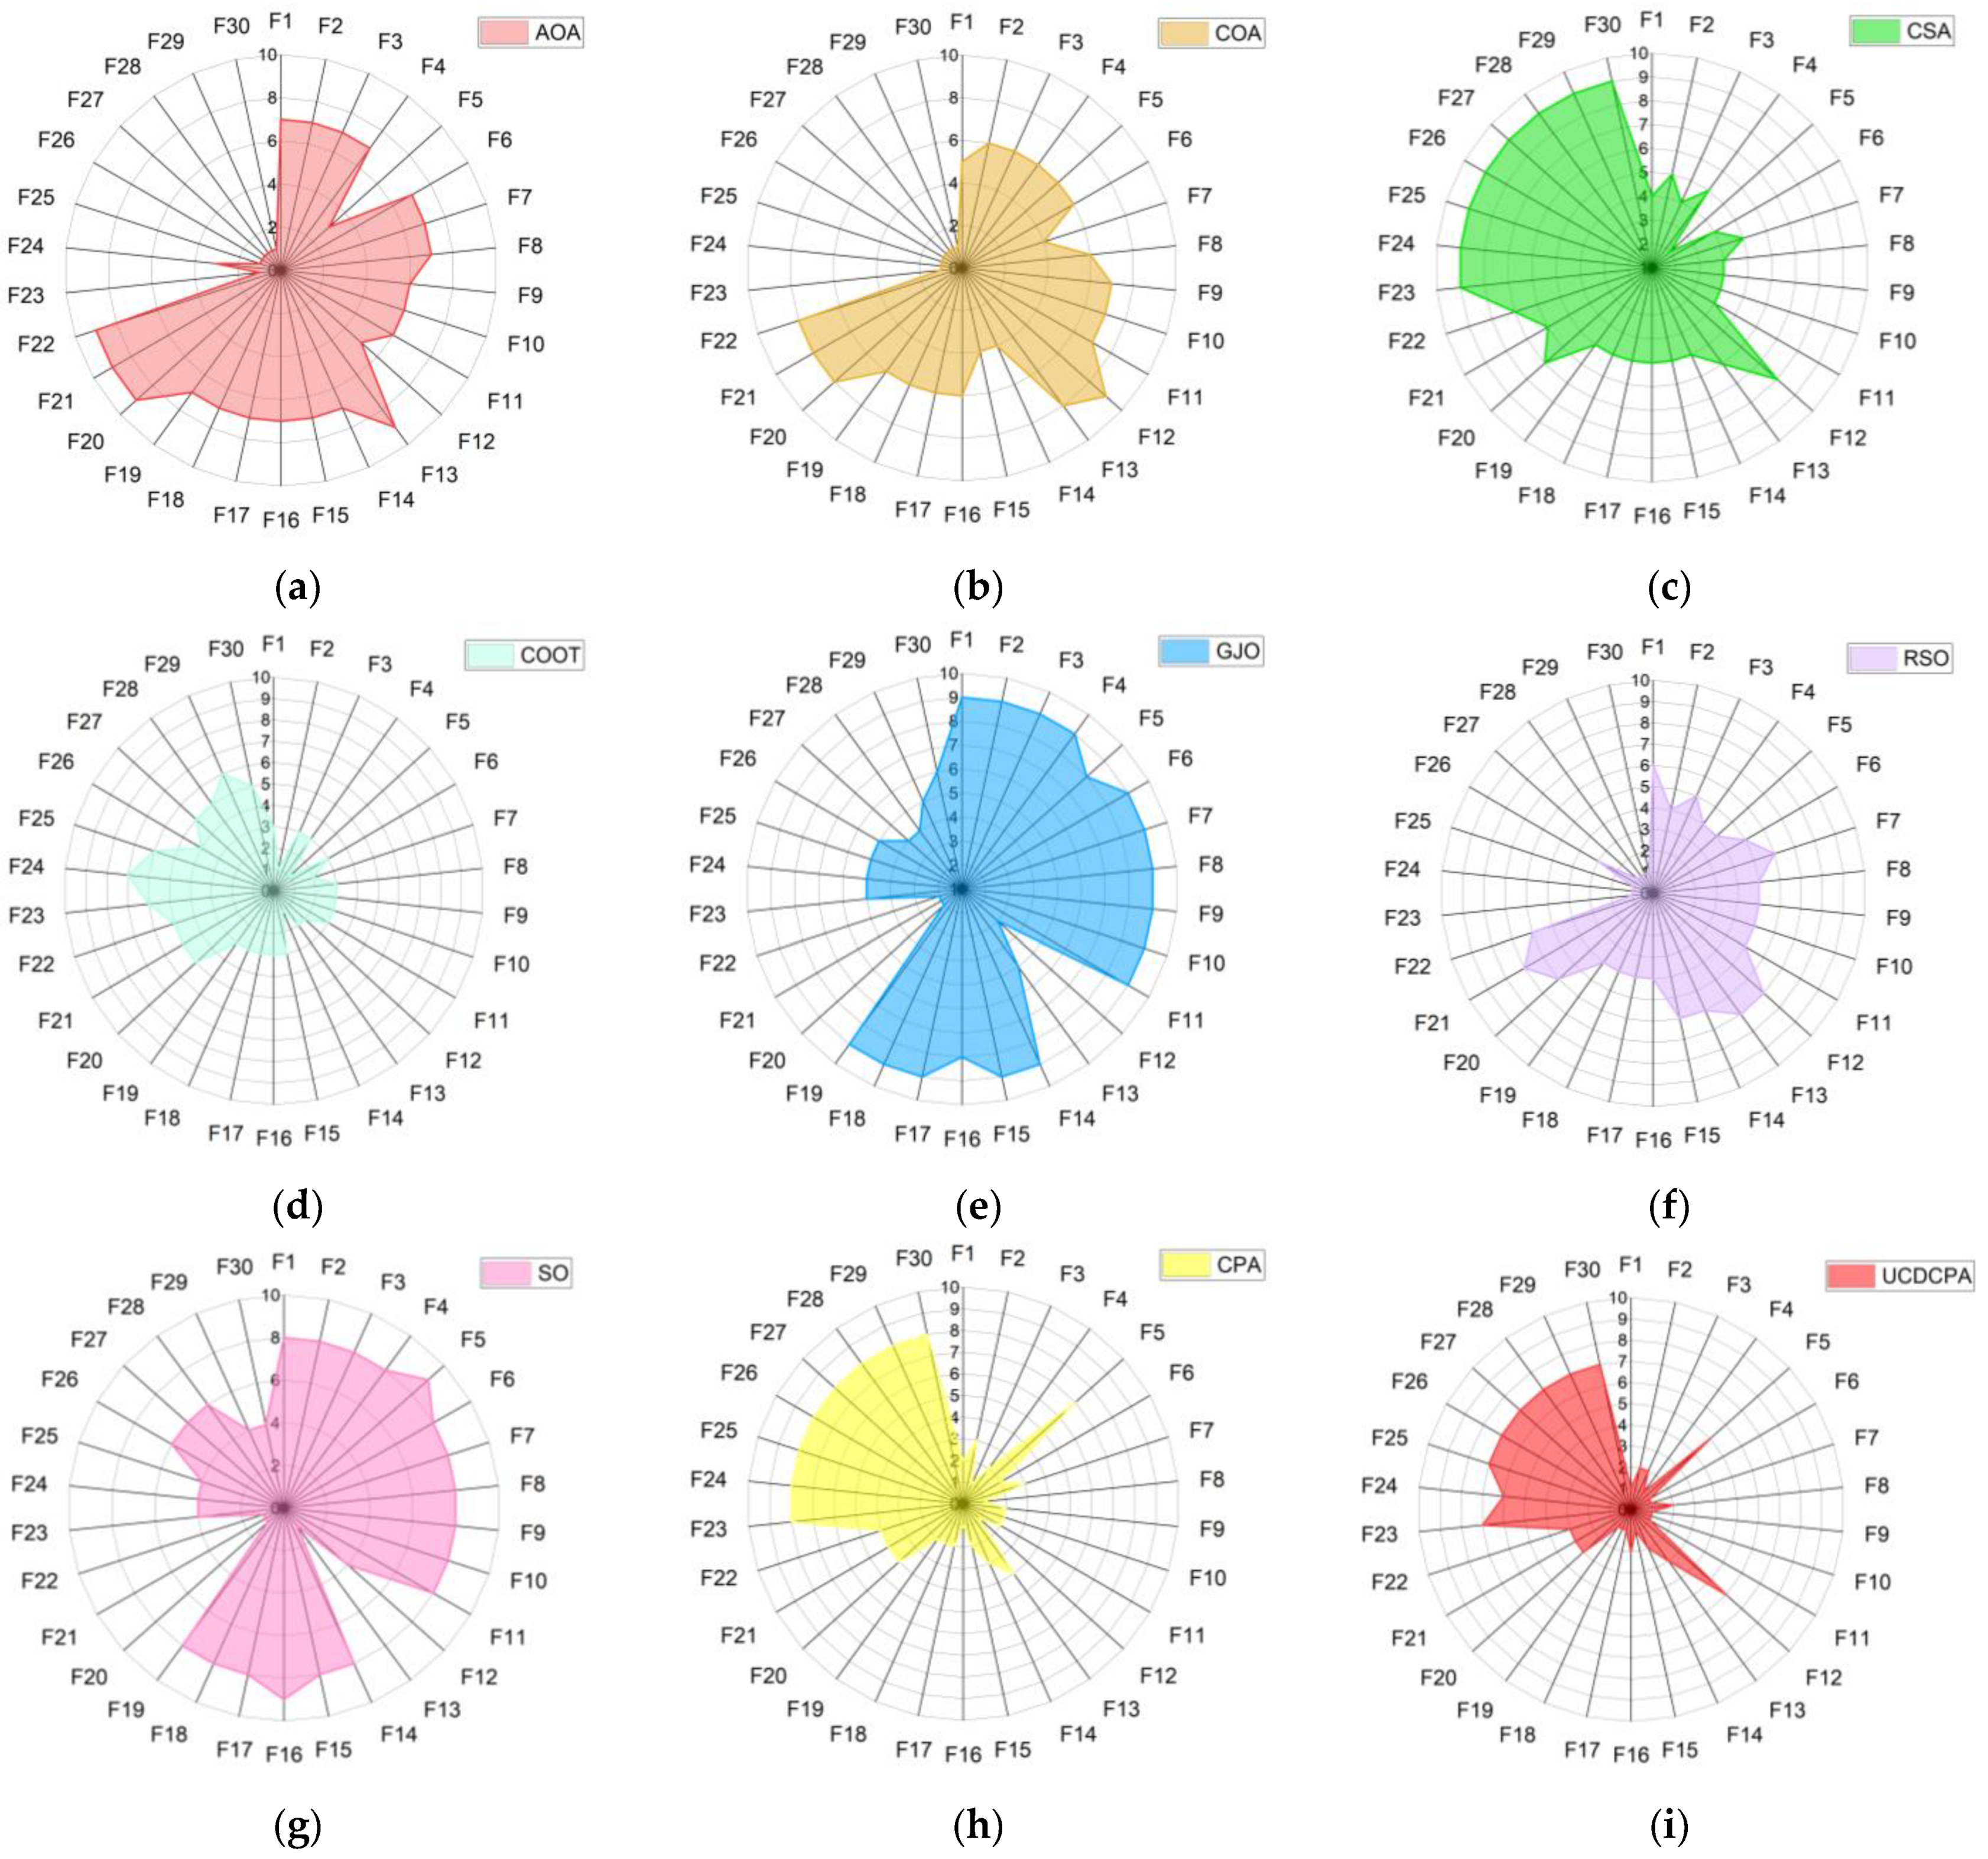
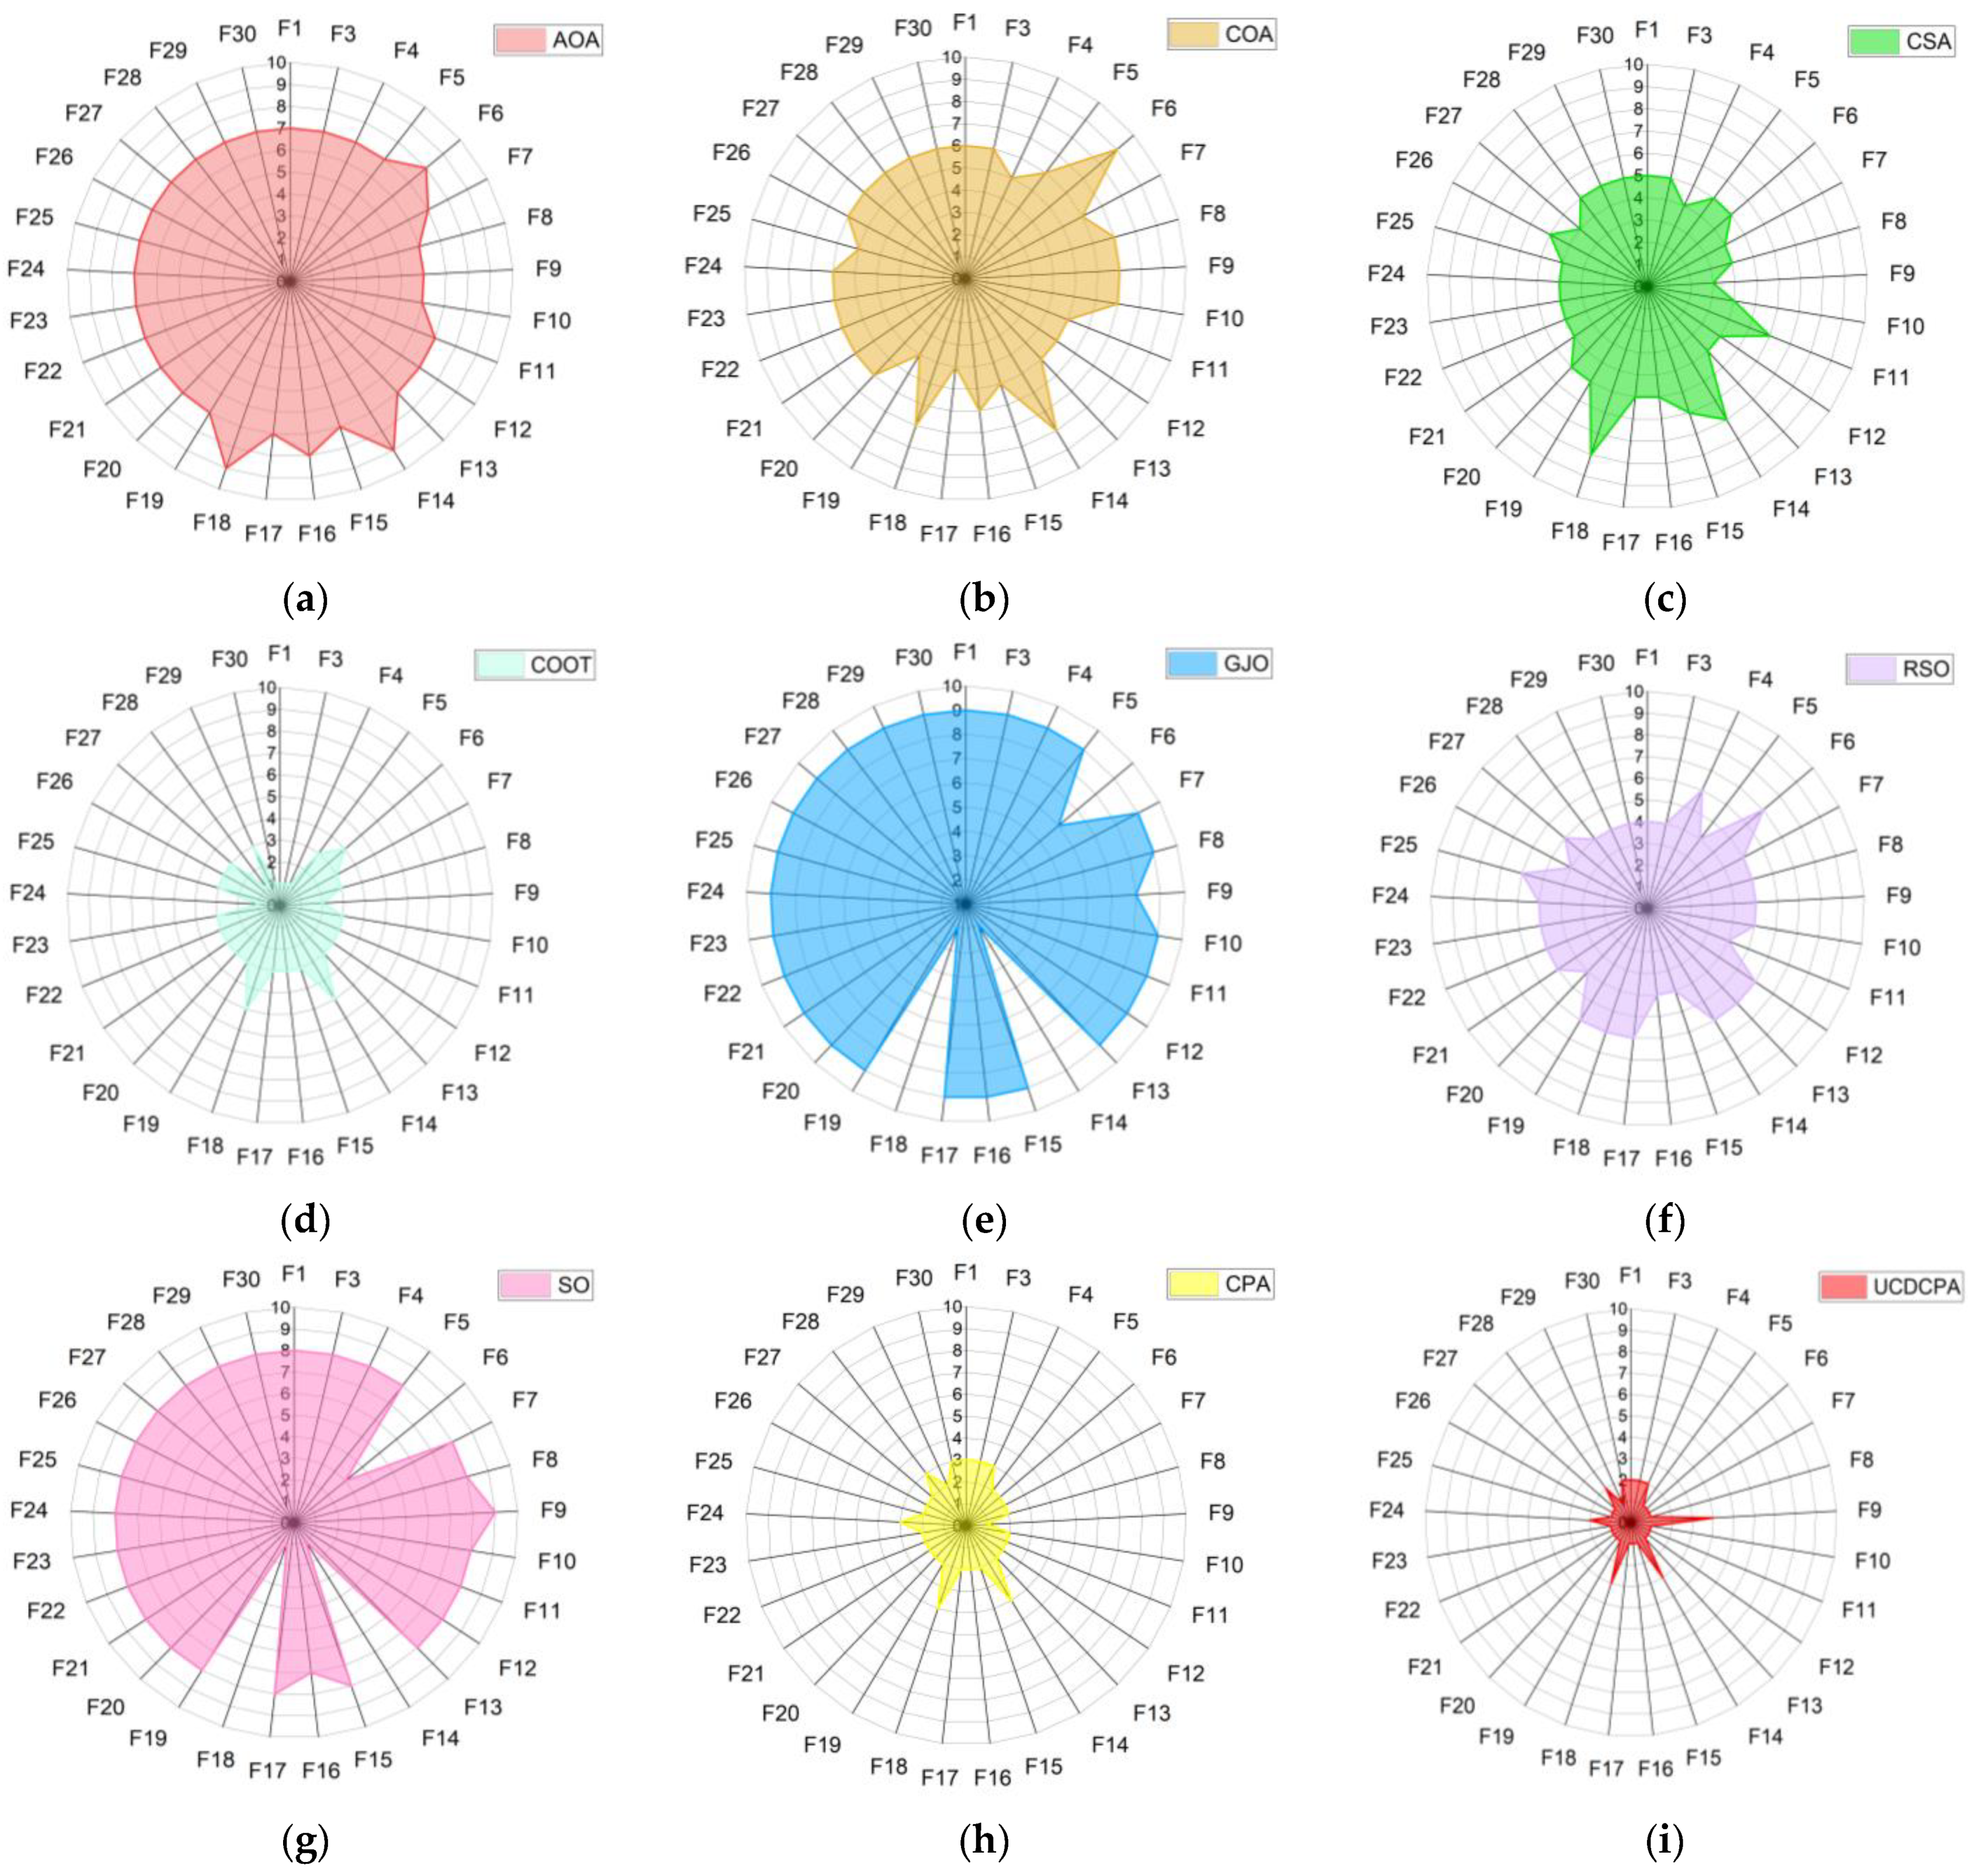
4.2. Comparison of UCDCPA and Other Algorithms
5. Improved Carnivorous Plant Algorithm (UCDCPA) for Engineering Design
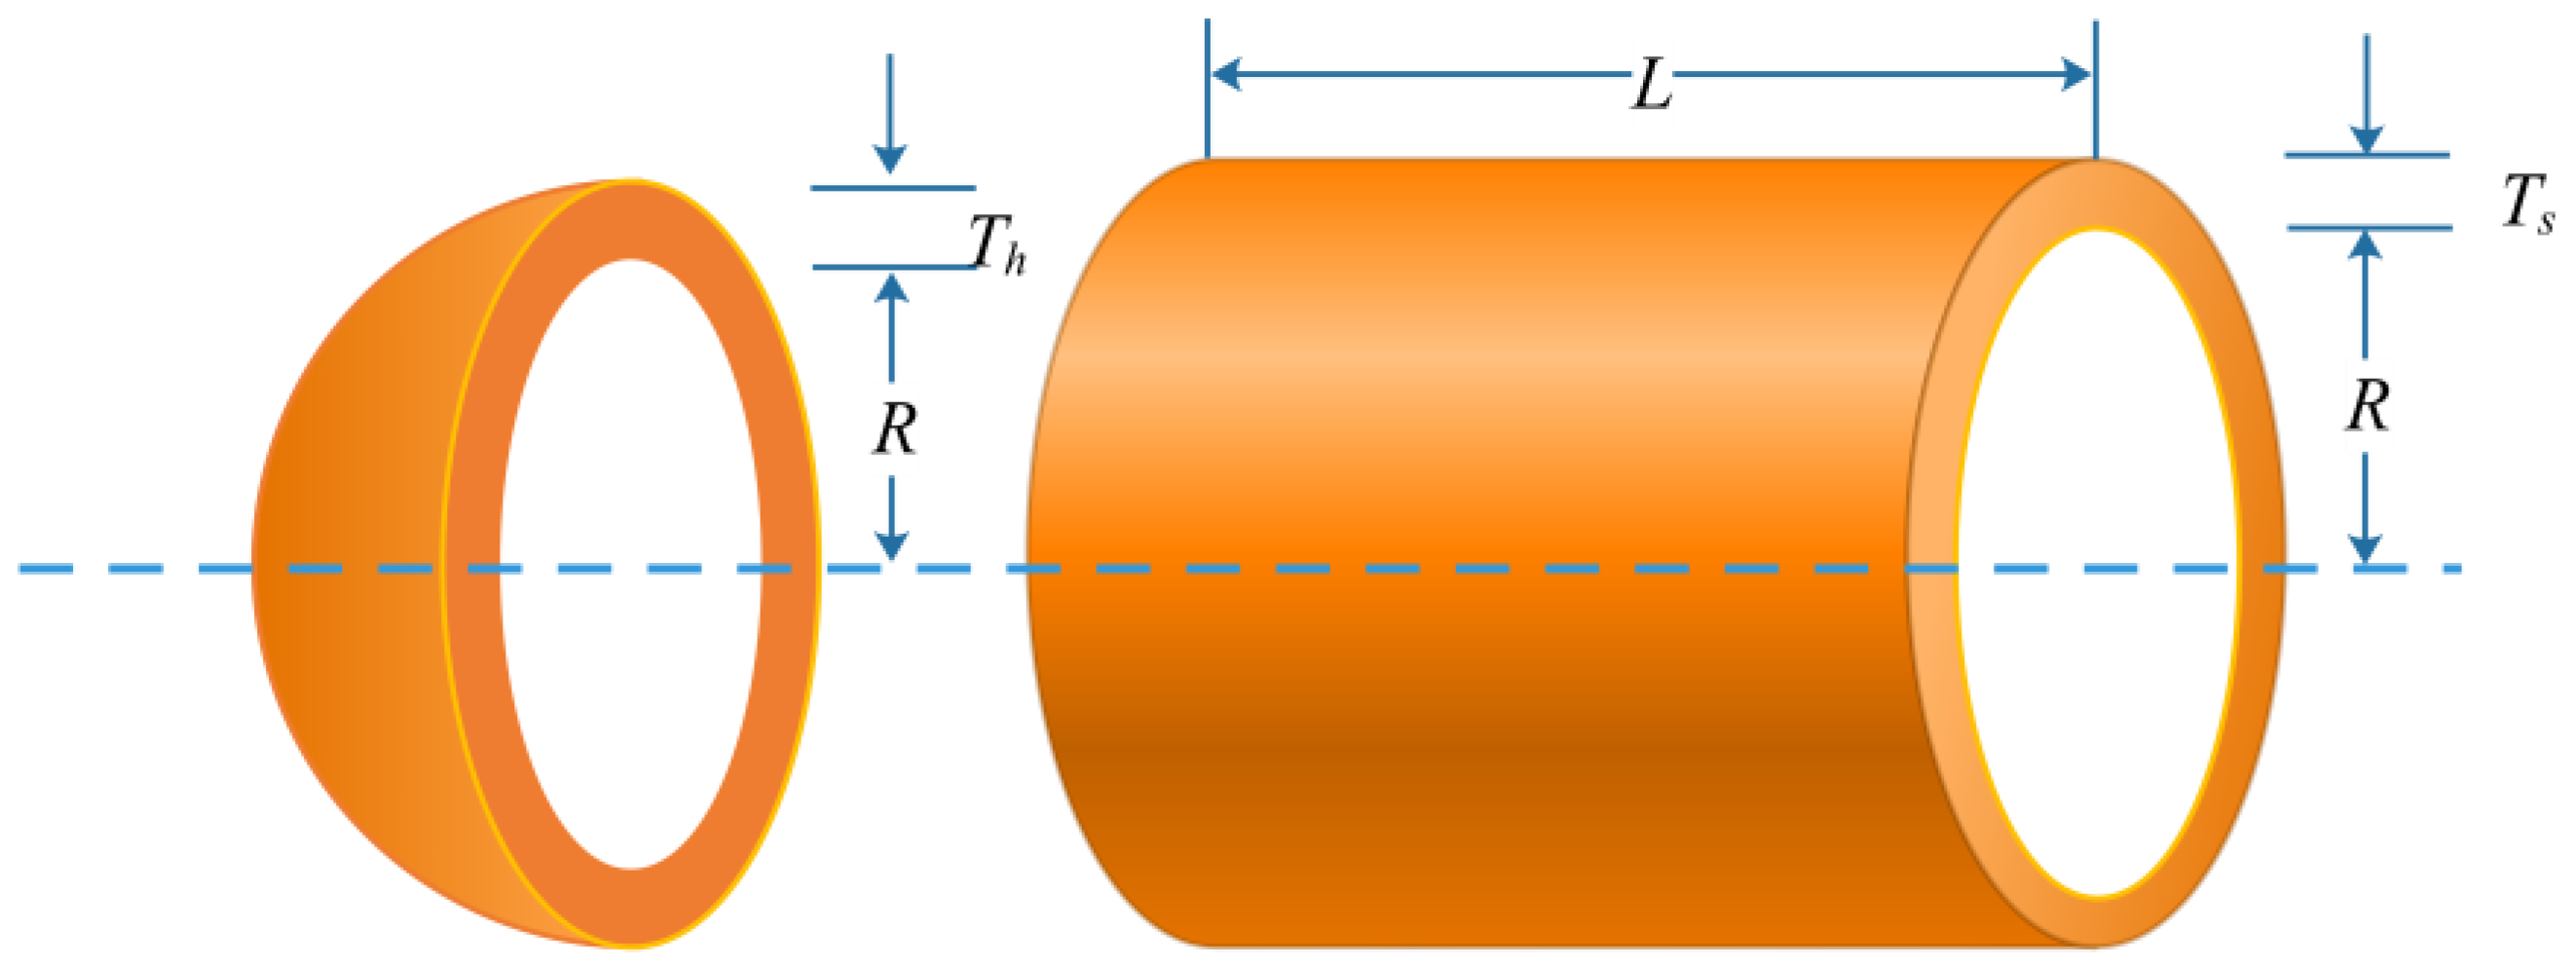
5.1. Pressure Vessel Design Problems
5.2. Welded Beam Design Problem
5.3. Tension/Compression Spring Design (TCSD) Problem
5.4. Compound Gear Design Problem
5.5. Cantilever Structure Problem
6. Conclusions
Author Contributions
Funding
Institutional Review Board Statement
Informed Consent Statement
Data Availability Statement
Conflicts of Interest
Appendix A

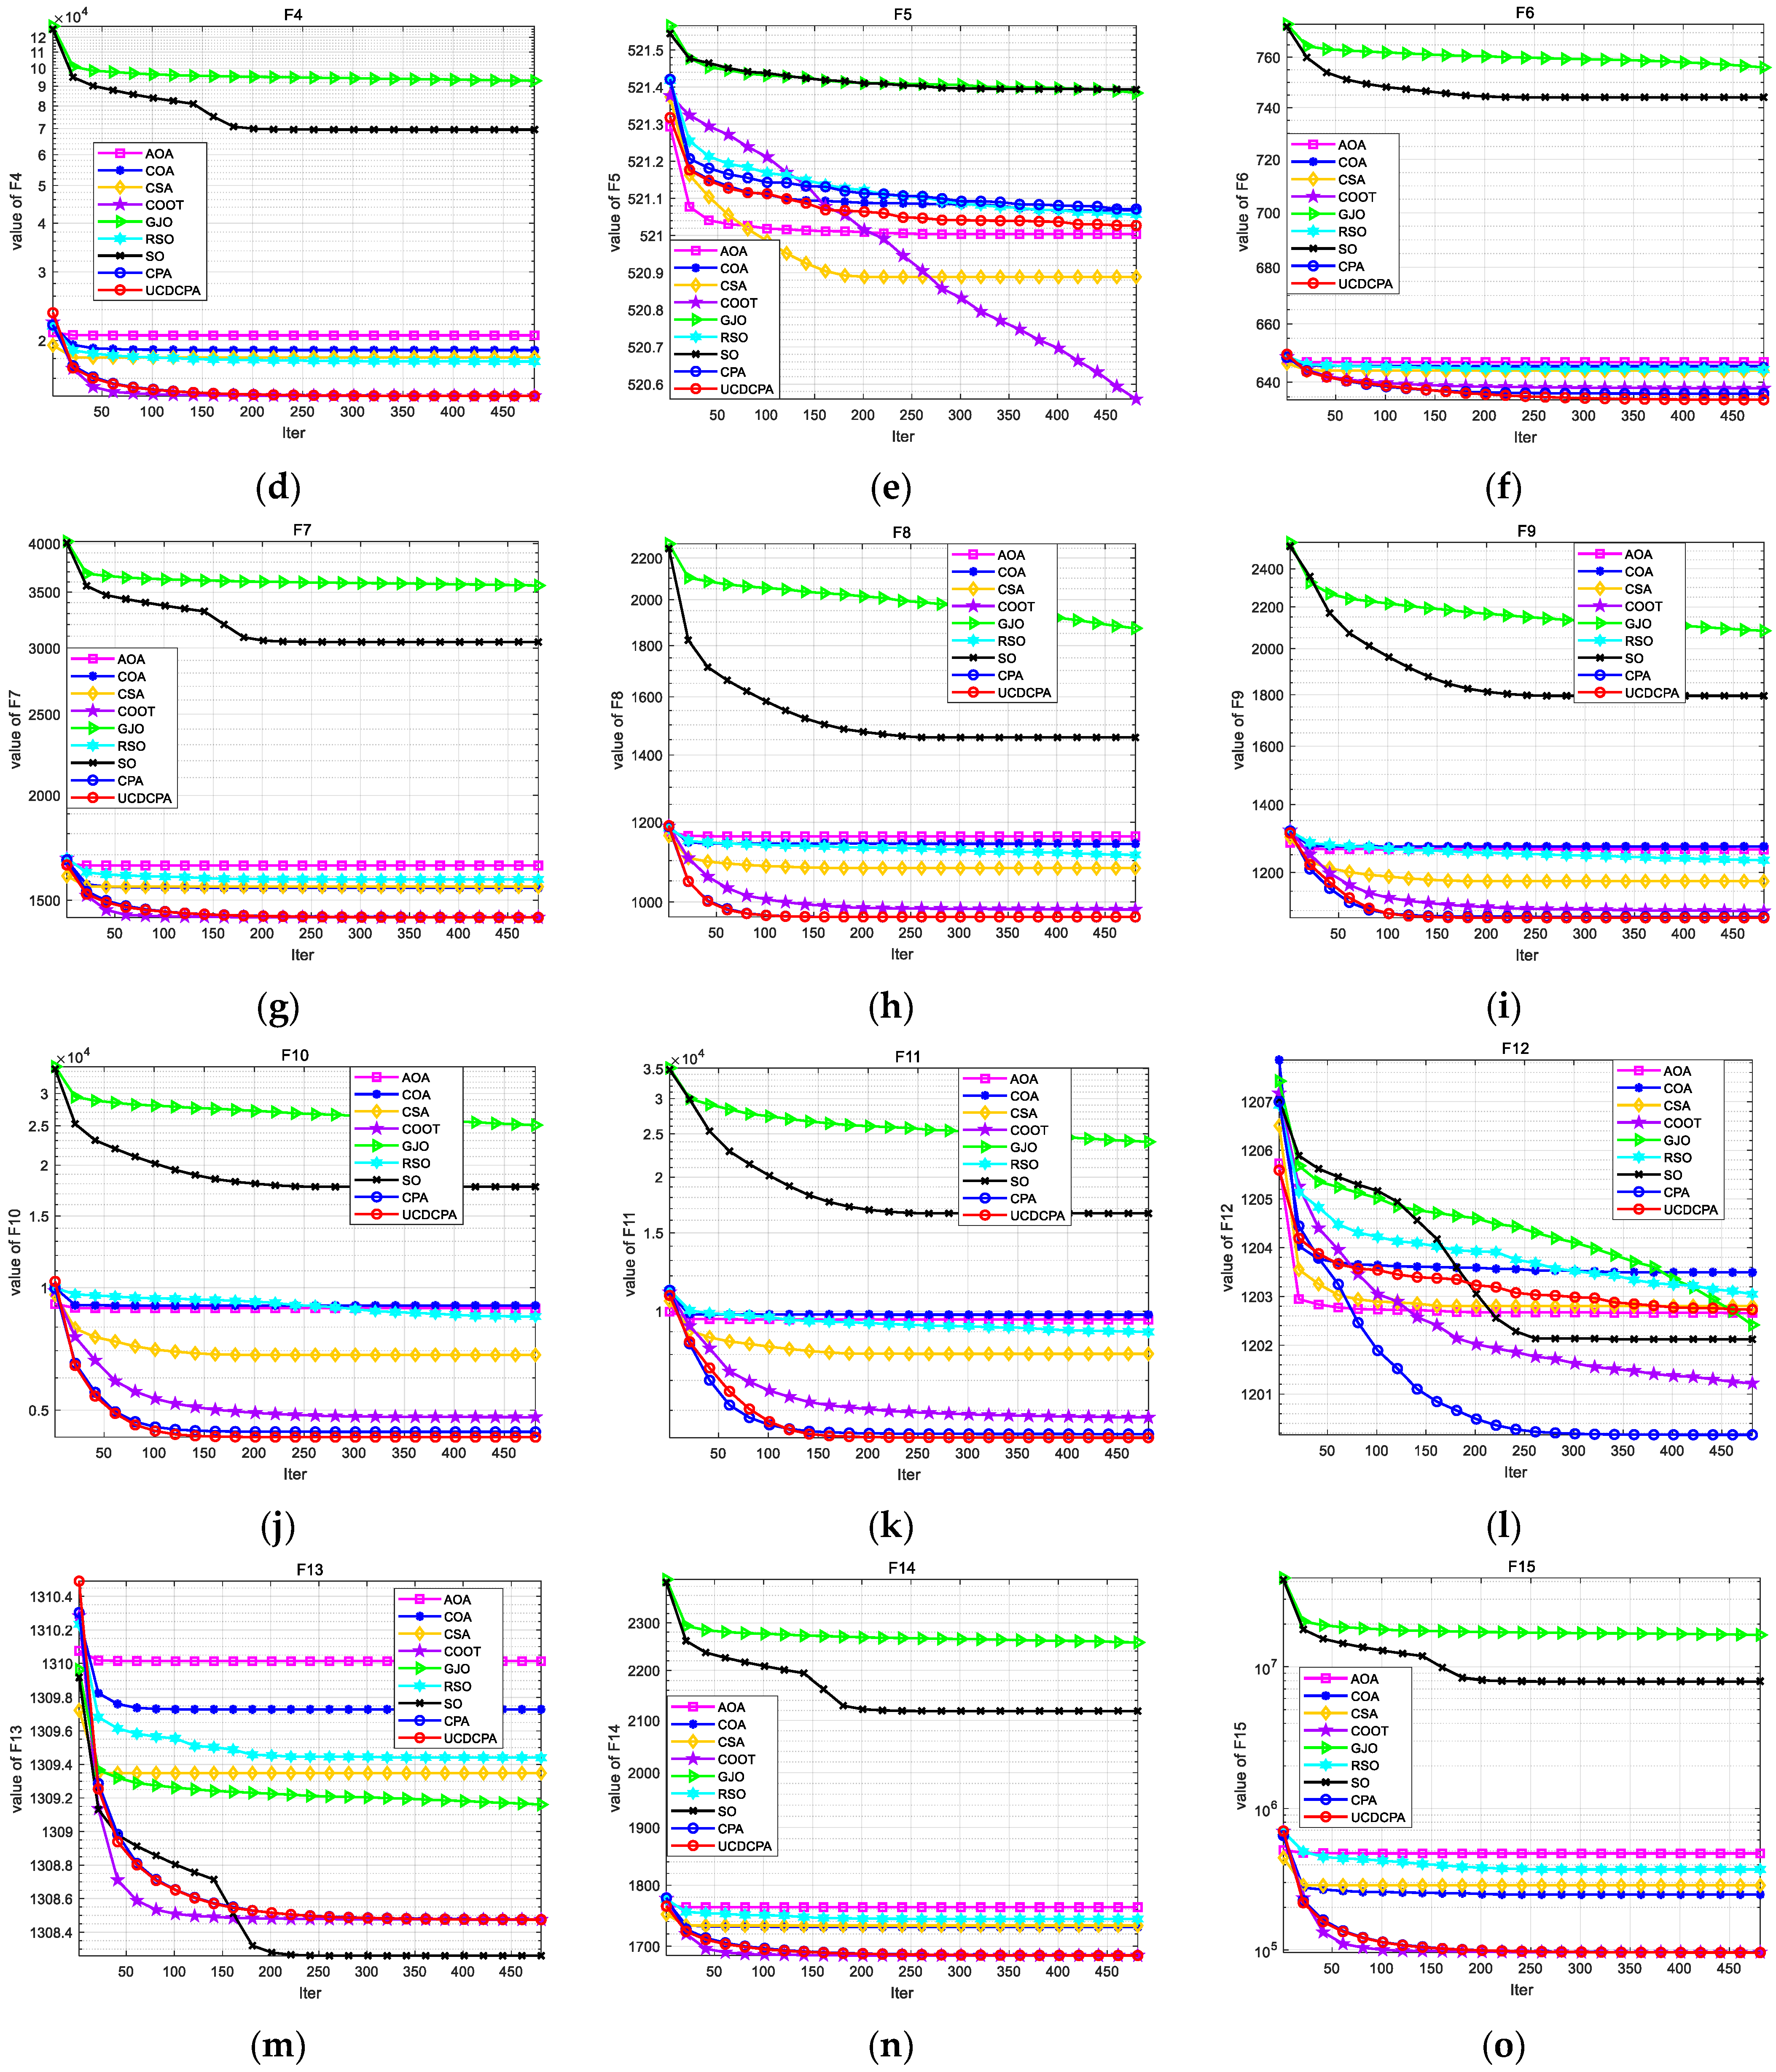
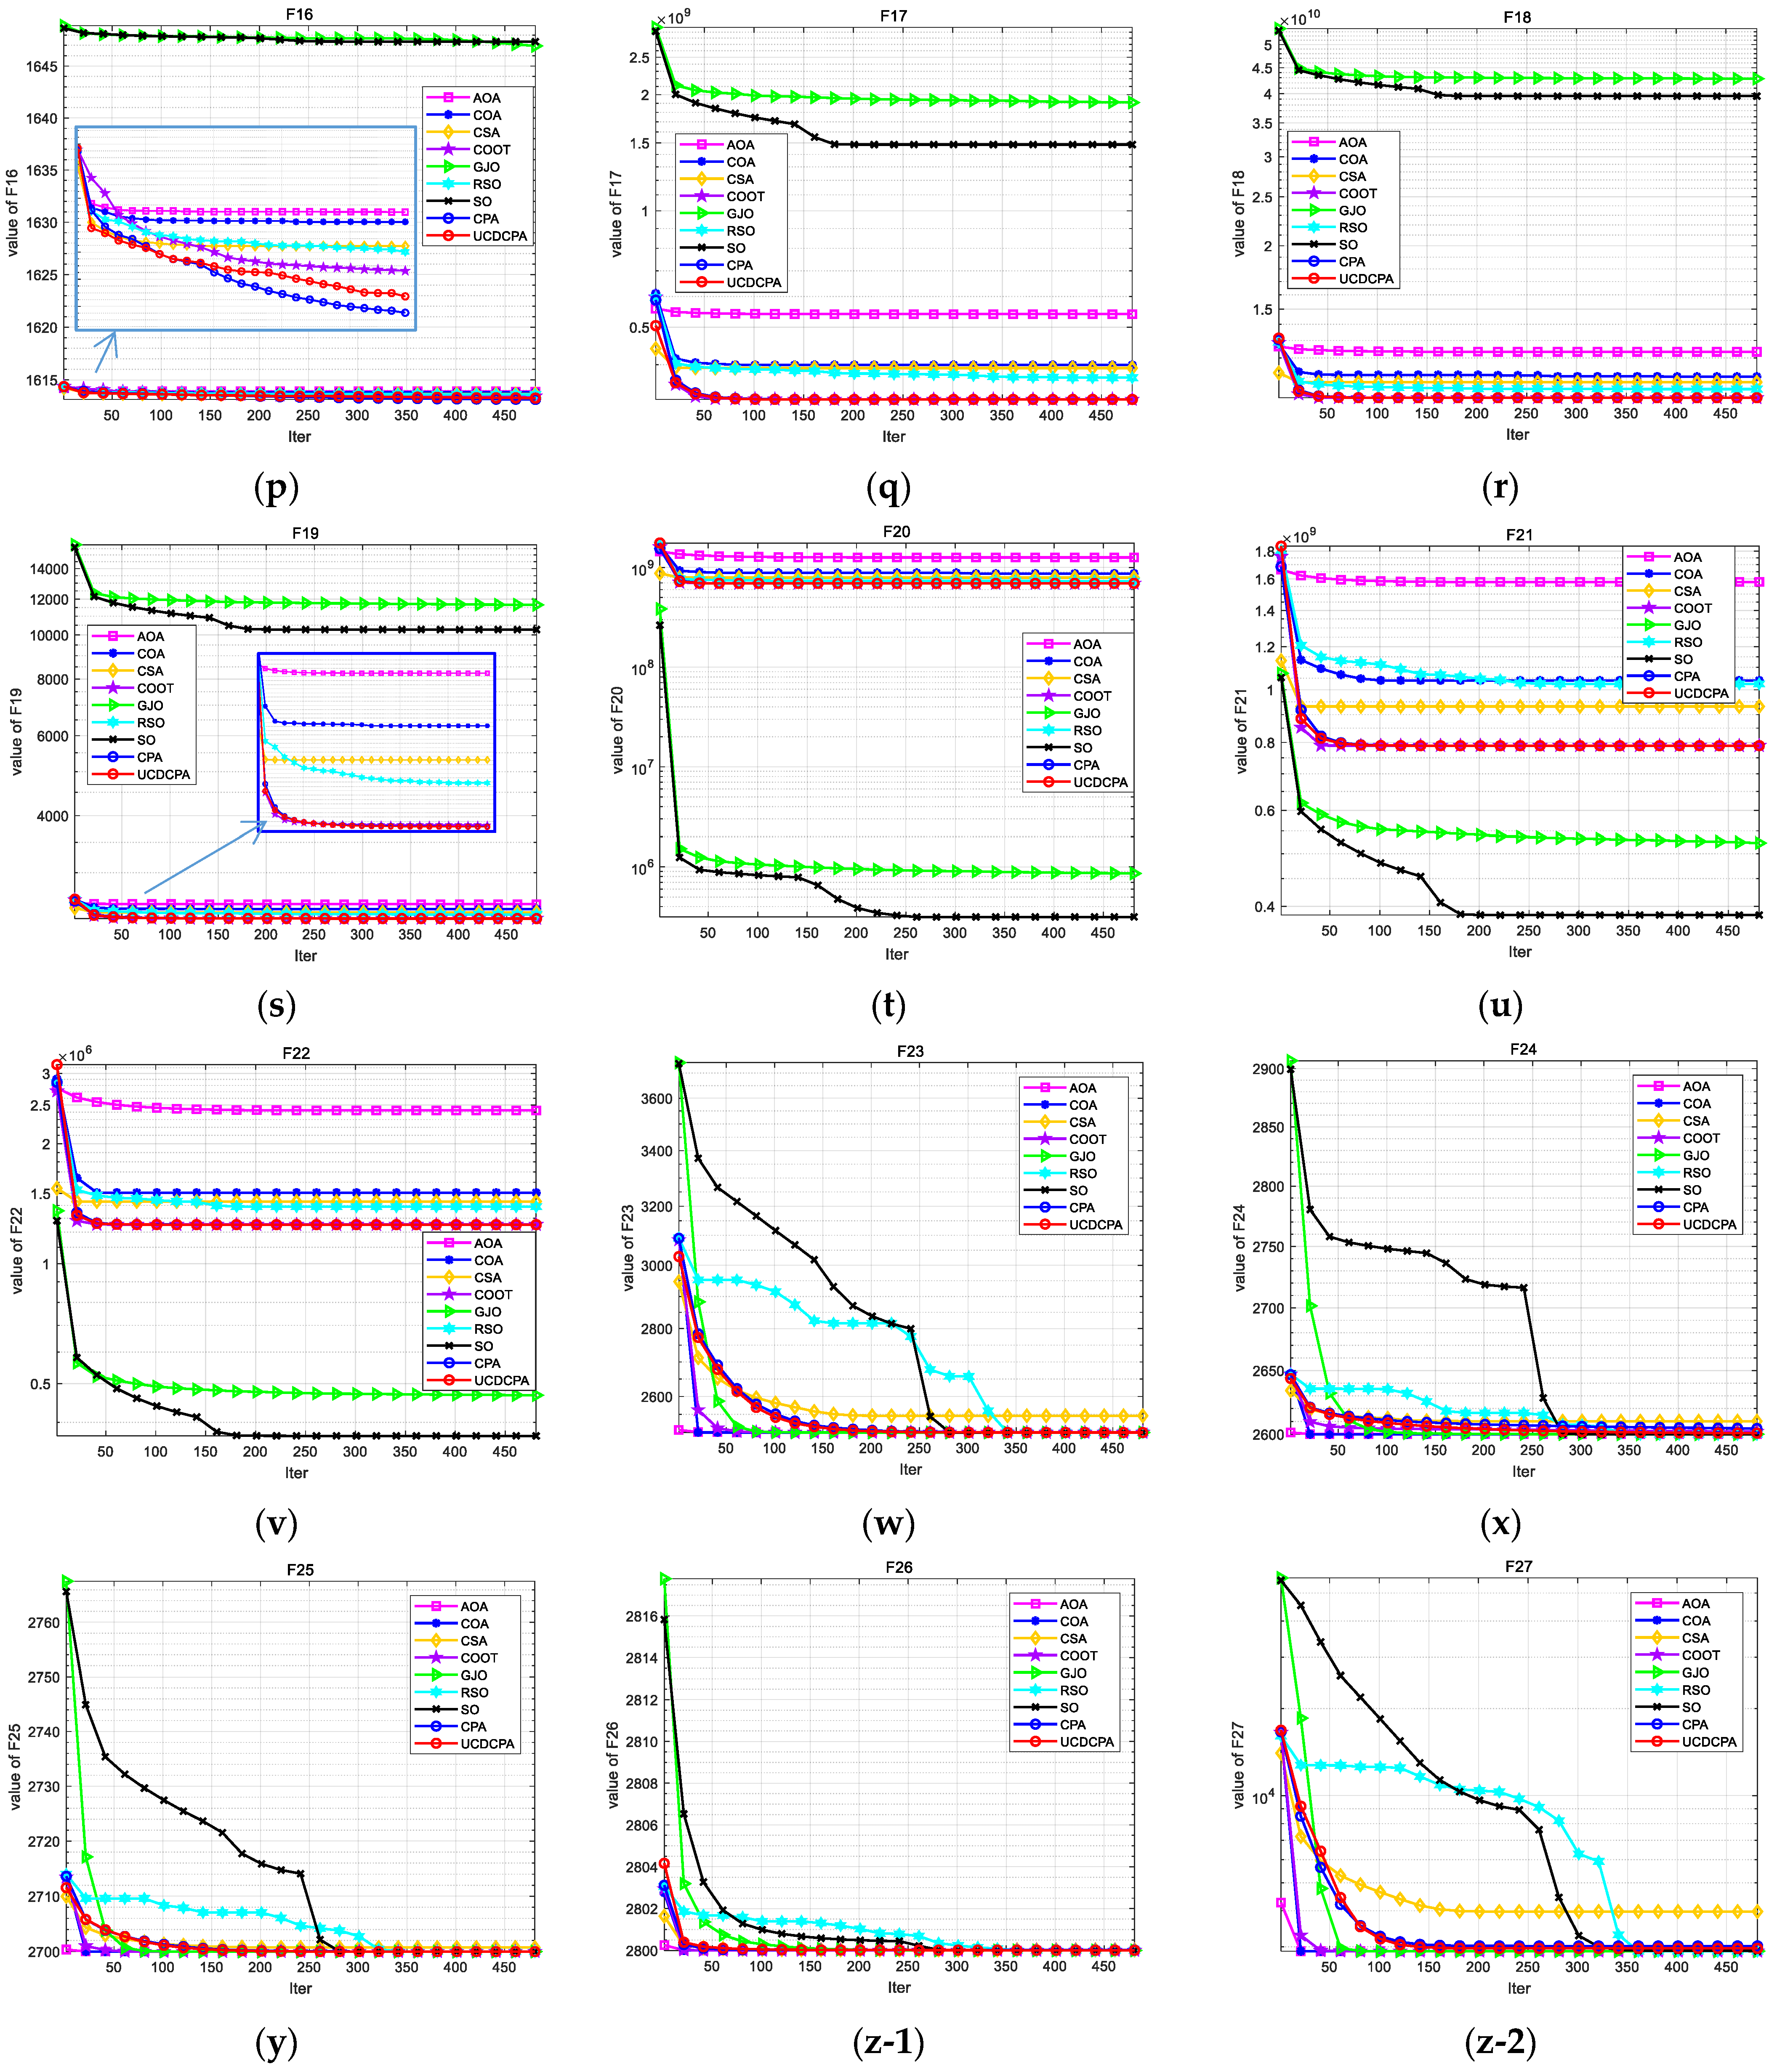


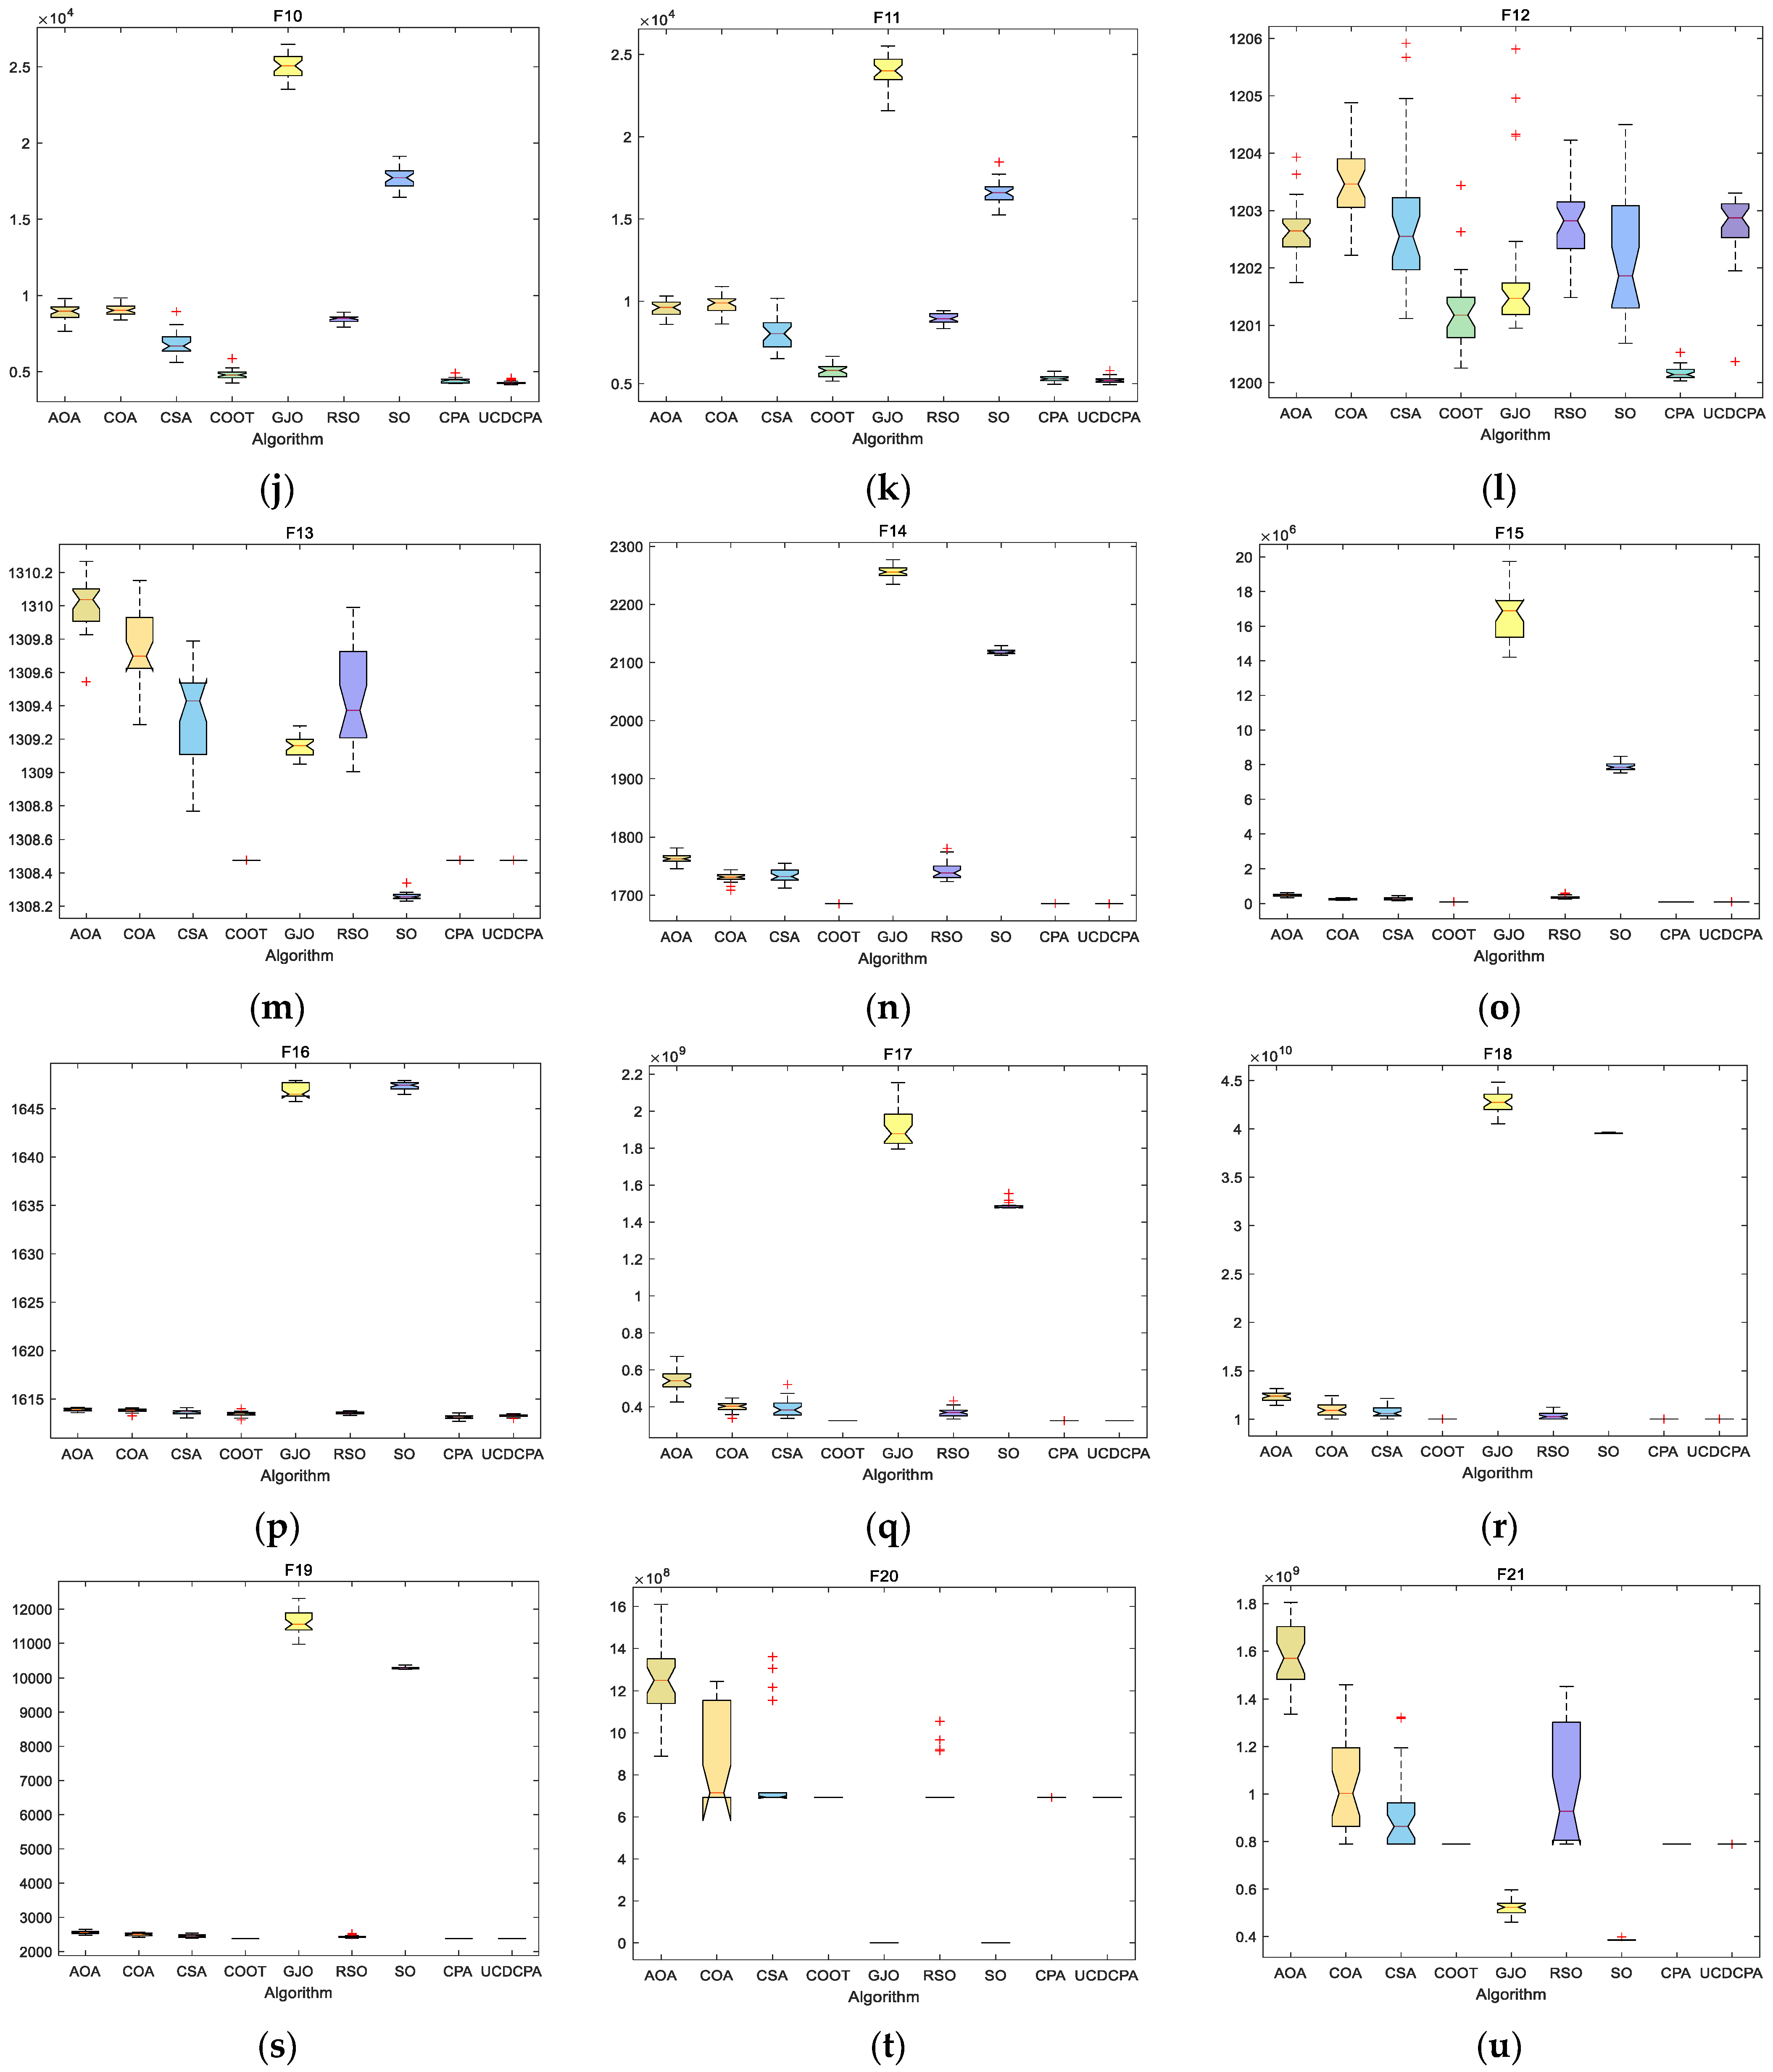
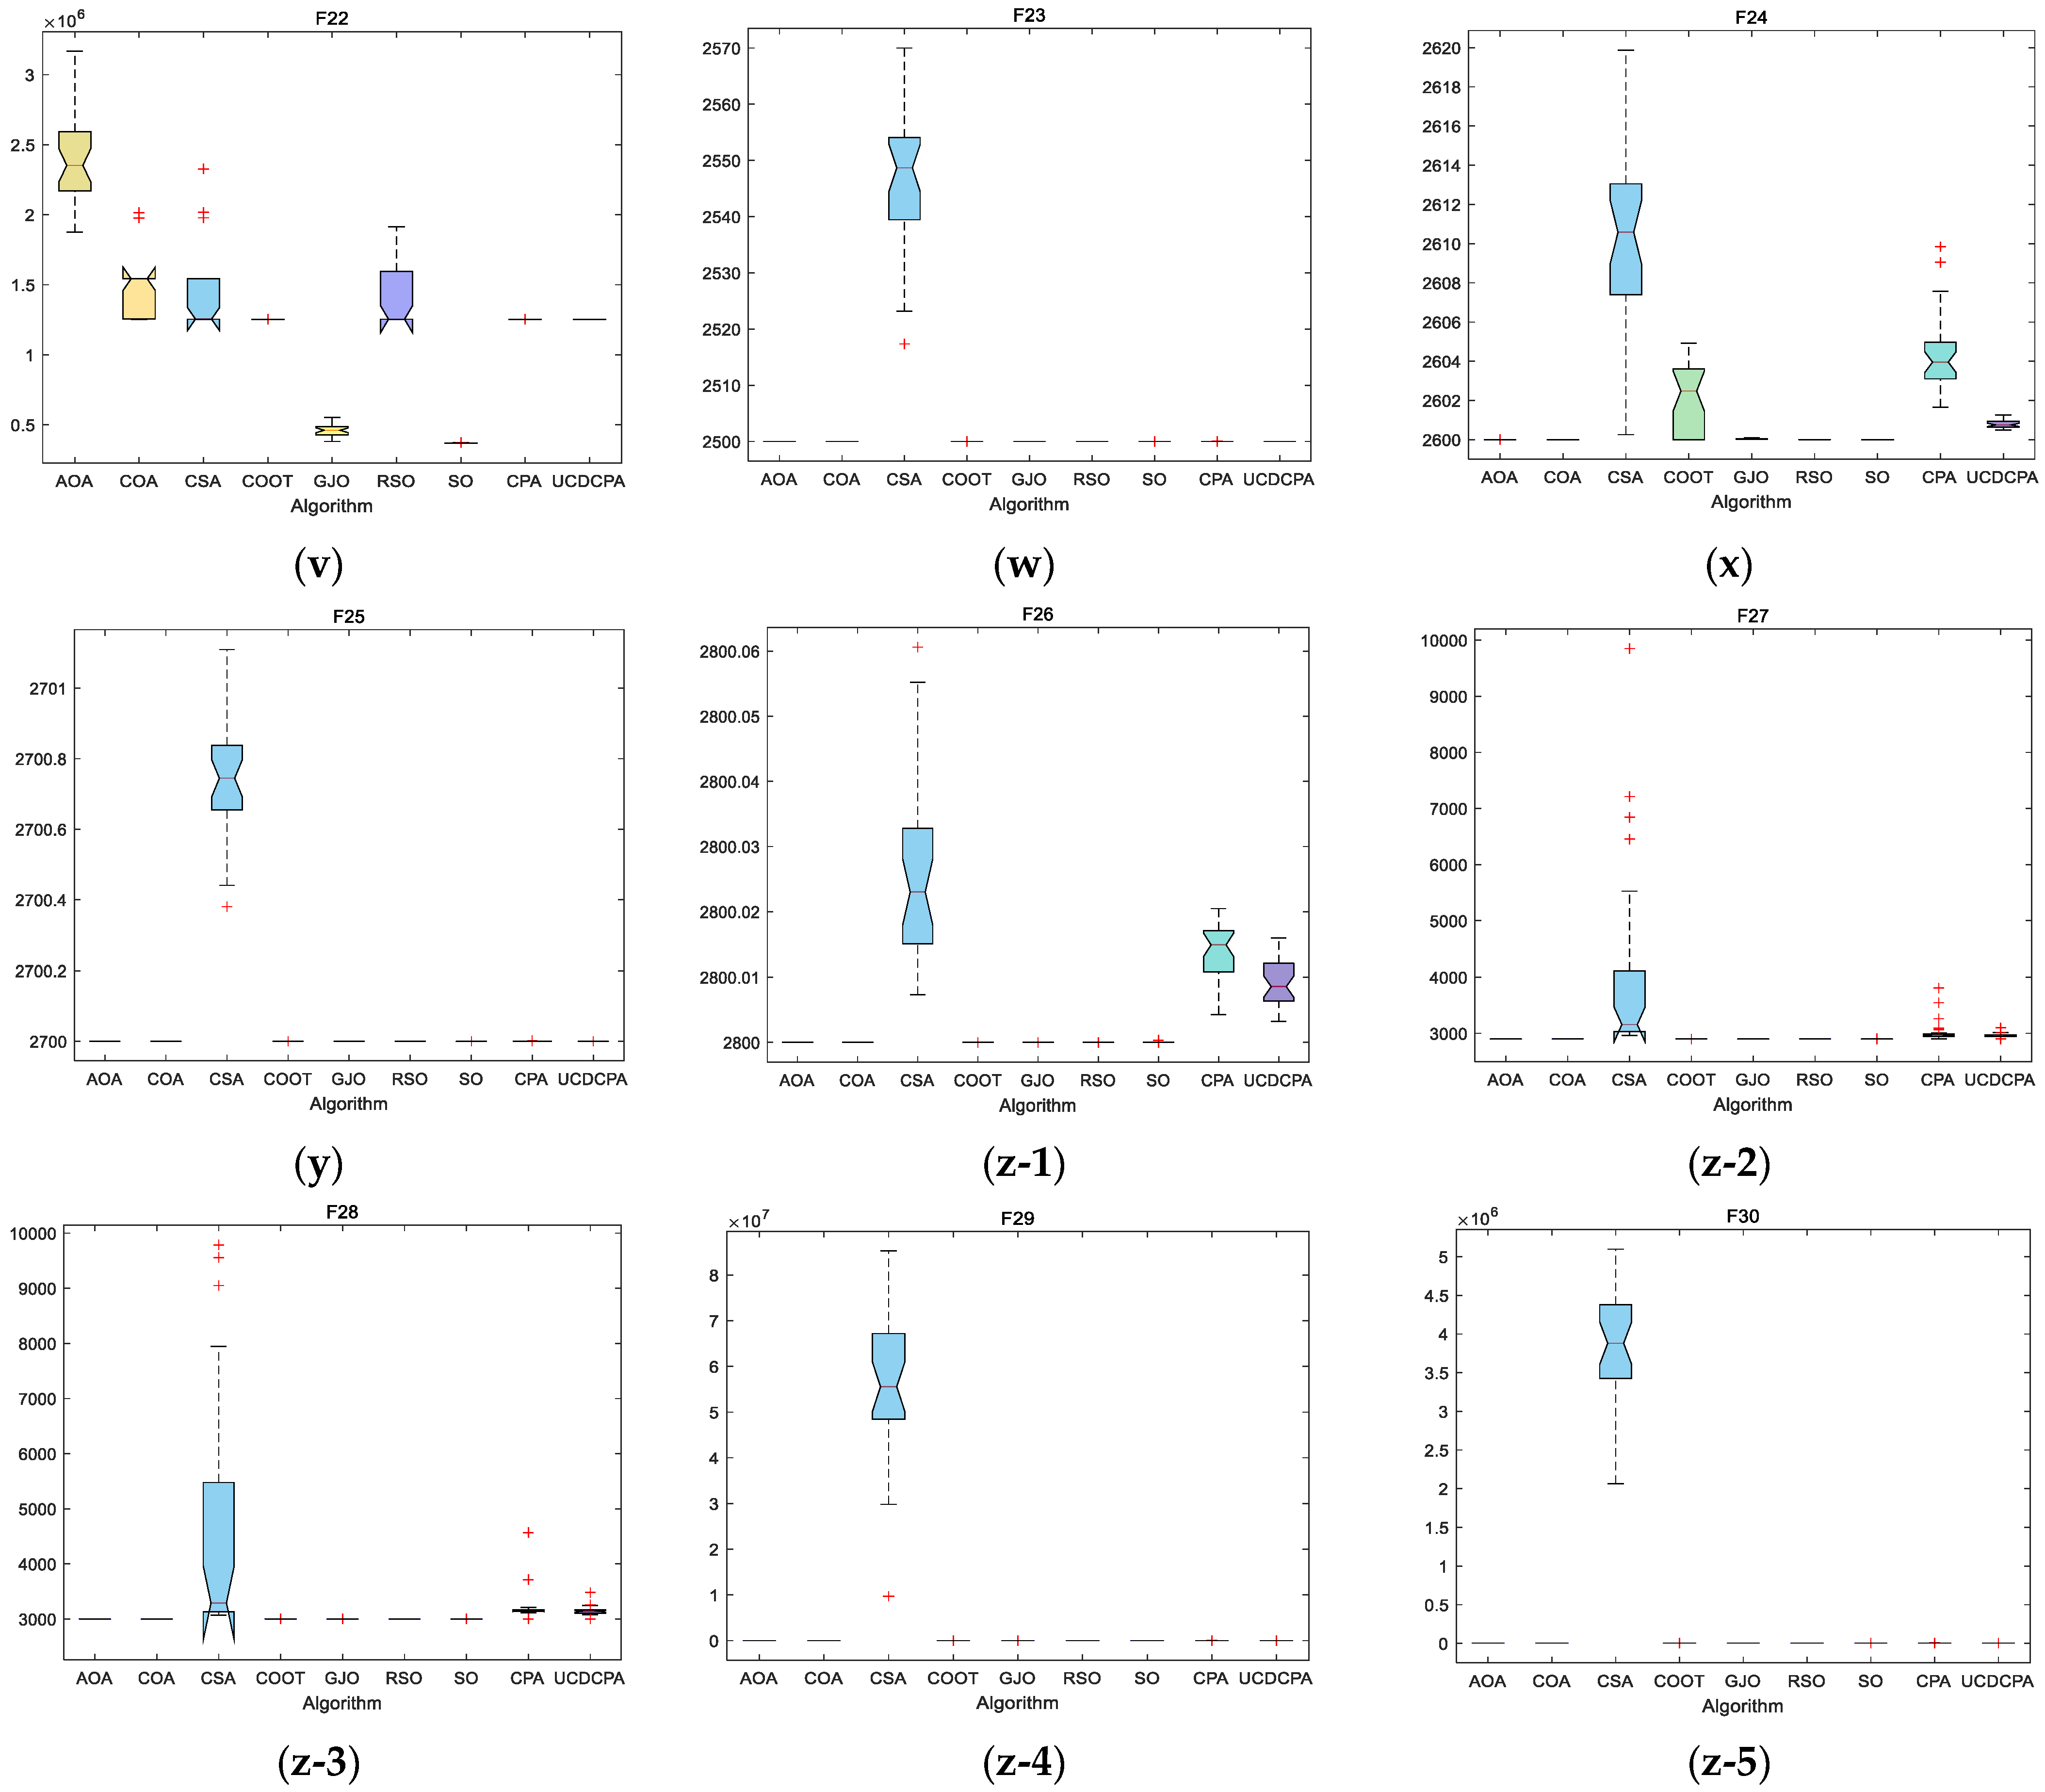


References
- Zhao, S.; Zhang, T.; Ma, S.; Chen, M. Dandelion Optimizer: A nature-inspired metaheuristic algorithm for engineering applications. Eng. Appl. Artif. Intell. 2022, 114, 105075. [Google Scholar] [CrossRef]
- Jahani, E.; Chizari, M. Tackling global optimization problems with a novel algorithm–Mouth Brooding Fish algorithm. Appl. Soft Comput. 2018, 62, 987–1002. [Google Scholar] [CrossRef]
- Sergeyev, Y.D.; Kvasov, D.; Mukhametzhanov, M. On the efficiency of nature-inspired metaheuristics in expensive global optimization with limited budget. Sci. Rep. 2018, 8, 453. [Google Scholar] [CrossRef]
- Liberti, L.; Kucherenko, S. Comparison of deterministic and stochastic approaches to global optimization. Int. Trans. Oper. Res. 2005, 12, 263–285. [Google Scholar] [CrossRef]
- Koc, I.; Atay, Y.; Babaoglu, I. Discrete tree seed algorithm for urban land readjustment. Eng. Appl. Artif. Intell. 2022, 112, 104783. [Google Scholar] [CrossRef]
- Dehghani, M.; Trojovská, E.; Trojovský, P. A new human-based metaheuristic algorithm for solving optimization problems on the base of simulation of driving training process. Sci. Rep. 2022, 12, 9924. [Google Scholar] [CrossRef]
- Zeidabadi, F.-A.; Dehghani, M.; Trojovský, P.; Hubálovský, Š.; Leiva, V.; Dhiman, G. Archery Algorithm: A Novel Stochastic Optimization Algorithm for Solving Optimization Problems. Comput. Mater. Contin. 2022, 72, 399–416. [Google Scholar] [CrossRef]
- Dhiman, G.; Kaur, A. STOA: A bio-inspired based optimization algorithm for industrial engineering problems. Eng. Appl. Artif. Intell. 2019, 82, 148–174. [Google Scholar] [CrossRef]
- Rajeev, S.; Krishnamoorthy, C.S. Discrete optimization of structures using genetic algorithms. J. Struct. Eng. 1992, 118, 1233–1250. [Google Scholar] [CrossRef]
- Storn, R.; Price, K. Differential evolution-a simple and efficient heuristic for global optimization over continuous spaces. J. Glob. Optim. 1997, 11, 341. [Google Scholar] [CrossRef]
- Cheng, M.Y.; Prayogo, D. Symbiotic organisms search: A new metaheuristic optimization algorithm. Comput. Struct. 2014, 139, 98–112. [Google Scholar] [CrossRef]
- Eskandar, H.; Sadollah, A.; Bahreininejad, A.; Hamdi, M. Water cycle algorithm–A novel metaheuristic optimization method for solving constrained engineering optimization problems. Comput. Struct. 2012, 110, 151–166. [Google Scholar] [CrossRef]
- Mirjalili, S.; Mirjalili, S.M.; Hatamlou, A. Multi-verse optimizer: A nature-inspired algorithm for global optimization. Neural Comput. Appl. 2016, 27, 495–513. [Google Scholar] [CrossRef]
- Hatamlou, A. Black hole: A new heuristic optimization approach for data clustering. Inf. Sci. 2013, 222, 175–184. [Google Scholar] [CrossRef]
- Van Laarhoven, P.J.; Aarts, E.H.; van Laarhoven, P.J.; Aarts, E. Simulated Annealing. In Simulated Annealing: Theory and Applications. Mathematics and Its Applications; Springer: Dordrecht, The Netherlands, 1987; pp. 7–15. [Google Scholar] [CrossRef]
- Rashedi, E.; Nezamabadi-Pour, H.; Saryazdi, S. GSA: A gravitational search algorithm. Inf. Sci. 2009, 179, 2232–2248. [Google Scholar] [CrossRef]
- Lam, A.Y.; Xu, J.; Li, V.O. Chemical reaction optimization for population transition in peer-to-peer live streaming. In IEEE Congress on Evolutionary Computation; IEEE: Piscataway, NJ, USA, 2010; pp. 1–8. [Google Scholar] [CrossRef]
- Yang, H.; Wan, Q.; Deng, Y. A bio-inspired optimal network division method. Phys. A Stat. Mech. Its Appl. 2019, 527, 121259. [Google Scholar] [CrossRef]
- Geem, Z.W.; Kim, J.H.; Loganathan, G.V. A new heuristic optimization algorithm: Harmony search. Simulation 2001, 76, 60–68. [Google Scholar] [CrossRef]
- Rao, R.V.; Savsani, V.J.; Vakharia, D.P. Teaching–learning-based optimization: A novel method for constrained mechanical design optimization problems. Comput.-Aided Des. 2011, 43, 303–315. [Google Scholar] [CrossRef]
- Atashpaz-Gargari, E.; Lucas, C. Imperialist competitive algorithm: An algorithm for optimization inspired by imperialistic competition. In 2007 IEEE Congress on Evolutionary Computation; IEEE: Piscataway, NJ, USA, 2007; pp. 4661–4667. [Google Scholar] [CrossRef]
- Dorigo, M.; Blum, C. Ant colony optimization theory: A survey. Theor. Comput. Sci. 2005, 344, 243–278. [Google Scholar] [CrossRef]
- Kennedy, J.; Eberhart, R. Particle swarm optimization. In Proceedings of the ICNN’95-International Conference on Neural Networks, Perth, Australia, 27 November–1 December 1995; pp. 1942–1948. [Google Scholar] [CrossRef]
- Mirjalili, S.; Mirjalili, S.M.; Lewis, A. Grey wolf optimizer. Adv. Eng. Softw. 2014, 69, 46–61. [Google Scholar] [CrossRef]
- Mirjalili, S. SCA: A sine cosine algorithm for solving optimization problems. Knowl. Based Syst. 2016, 96, 120–133. [Google Scholar] [CrossRef]
- Mirjalili, S.; Lewis, A. The whale optimization algorithm. Adv. Eng. Softw. 2016, 95, 51–67. [Google Scholar] [CrossRef]
- Mirjalili, S. Moth-flame optimization algorithm: A novel nature-inspired heuristic paradigm. Knowl. Based Syst. 2015, 89, 228–249. [Google Scholar] [CrossRef]
- Heidari, A.A.; Mirjalili, S.; Faris, H.; Aljarah, I.; Mafarja, M.; Chen, H. Harris hawks optimization: Algorithm and applications. Future Gener. Comput. Syst. 2019, 97, 849–872. [Google Scholar] [CrossRef]
- Ong, K.M.; Ong, P.; Sia, C.K. A carnivorous plant algorithm for solving global optimization problems. Appl. Soft Comput. 2021, 98, 106833. [Google Scholar] [CrossRef]
- Hu, G.; Du, B.; Wang, X.; Wei, G. An enhanced black widow optimization algorithm for feature selection. Knowl. Based Syst. 2022, 235, 107638. [Google Scholar] [CrossRef]
- Hu, G.; Wang, J.; Li, M.; Hussien, A.G.; Abbas, M. EJS: Multi-strategy enhanced jellyfish search algorithm for engineering applications. Mathematics 2023, 11, 851. [Google Scholar] [CrossRef]
- Hu, G.; Yang, R.; Qin, X.; Wei, G. MCSA: Multi-strategy boosted chameleon-inspired optimization algorithm for engineering applications. Comput. Methods Appl. Mech. Eng. 2023, 403, 115676. [Google Scholar] [CrossRef]
- Wang, J.; Li, Y.; Hu, G. Hybrid seagull optimization algorithm and its engineering application integrating Yin–Yang Pair idea. Eng. Comput. 2022, 38, 2821–2857. [Google Scholar] [CrossRef]
- Hu, G.; Zhong, J.; Wei, G.; Chang, C.-T. DTCSMO: An efficient hybrid starling murmuration optimizer for engineering applications. Comput. Methods Appl. Mech. Eng. 2023, 405, 115878. [Google Scholar] [CrossRef]
- Abualigah, L.; Diabat, A.; Mirjalili, S.; Abd Elaziz, M.; Gandomi, A.H. The arithmetic optimization algorithm. Comput. Methods Appl. Mech. Eng. 2021, 376, 113609. [Google Scholar] [CrossRef]
- Dehghani, M.; Montazeri, Z.; Trojovská, E.; Trojovský, P. Coati Optimization Algorithm: A new bio-inspired metaheuristic algorithm for solving optimization problems. Knowl. Based Syst. 2023, 259, 110011. [Google Scholar] [CrossRef]
- Qais, M.H.; Hasanien, H.M.; Turky, R.A.; Alghuwainem, S.; Tostado-Véliz, M.; Jurado, F. Circle search algorithm: A geometry-based metaheuristic optimization algorithm. Mathematics 2022, 10, 1626. [Google Scholar] [CrossRef]
- Chopra, N.; Ansari, M.M. Golden jackal optimization: A novel nature-inspired optimizer for engineering applications. Expert Syst. Appl. 2022, 198, 116924. [Google Scholar] [CrossRef]
- Dhiman, G.; Garg, M.; Nagar, A.; Kumar, V.; Dehghani, M. A novel algorithm for global optimization: Rat swarm optimizer. J. Ambient. Intell. Humaniz. Comput. 2021, 12, 8457–8482. [Google Scholar] [CrossRef]
- Hashim, F.A.; Hussien, A.G. Snake Optimizer: A novel meta-heuristic optimization algorithm. Knowl. Based Syst. 2022, 242, 108320. [Google Scholar] [CrossRef]
- Sandgren, E. Nonlinear integer and discrete programming in mechanical design optimization. J. Mech. Des. 1990, 112, 223–229. [Google Scholar] [CrossRef]
- Hayyolalam, V.; Kazem, A.A.P. Black widow optimization algorithm: A novel meta-heuristic approach for solving engineering optimization problems. Eng. Appl. Artif. Intell. 2020, 87, 103249. [Google Scholar] [CrossRef]
- Hashim, F.A.; Hussain, K.; Houssein, E.H.; Mabrouk, M.S.; Al-Atabany, W. Archimedes optimization algorithm: A new metaheuristic algorithm for solving optimization problems. Appl. Intell. 2021, 51, 1531–1551. [Google Scholar] [CrossRef]
- Abualigah, L.; Yousri, D.; Abd Elaziz, M.; Ewees, A.A.; Al-Qaness, M.A.; Gandomi, A.H. Aquila optimizer: A novel meta-heuristic optimization algorithm. Comput. Ind. Eng. 2021, 157, 107250. [Google Scholar] [CrossRef]
- Dhiman, G.; Kumar, V. Spotted hyena optimizer: A novel bio-inspired based metaheuristic technique for engineering applications. Adv. Eng. Softw. 2017, 114, 48–70. [Google Scholar] [CrossRef]
- Deb, K. Optimal design of a welded beam via genetic algorithms. AIAA J. 1991, 29, 2013–2015. [Google Scholar] [CrossRef]
- Kaveh, A.; Khanzadi, M.; Moghaddam, M.R. Billiards-inspired optimization algorithm; a new meta-heuristic method. Structures 2020, 27, 1722–1739. [Google Scholar] [CrossRef]
- Li, S.; Chen, H.; Wang, M.; Heidari, A.A.; Mirjalili, S. Slime mould algorithm: A new method for stochastic optimization. Future Gener. Comput. Syst. 2020, 111, 300–323. [Google Scholar] [CrossRef]
- Mirjalili, S. The ant lion optimizer. Adv. Eng. Softw. 2015, 83, 80–98. [Google Scholar] [CrossRef]
- Kaveh, A.; Eslamlou, A.D. Water strider algorithm: A new metaheuristic and applications. Structures 2020, 25, 520–541. [Google Scholar] [CrossRef]
- Naruei, I.; Keynia, F. Wild horse optimizer: A new meta-heuristic algorithm for solving engineering optimization problems. Eng. Comput. 2022, 38 (Suppl. S4), 3025–3056. [Google Scholar] [CrossRef]
- Hu, G.; Li, M.; Wang, X.; Wei, G.; Chang, C.T. An enhanced manta ray foraging optimization algorithm for shape optimization of complex CCG-Ball curves. Knowl. Based Syst. 2022, 240, 108071. [Google Scholar] [CrossRef]
- Hu, G.; Zhu, X.; Wei, G.; Chang, C.T. An improved marine predators algorithm for shape optimization of developable Ball surfaces. Eng. Appl. Artif. Intell. 2021, 105, 104417. [Google Scholar] [CrossRef]




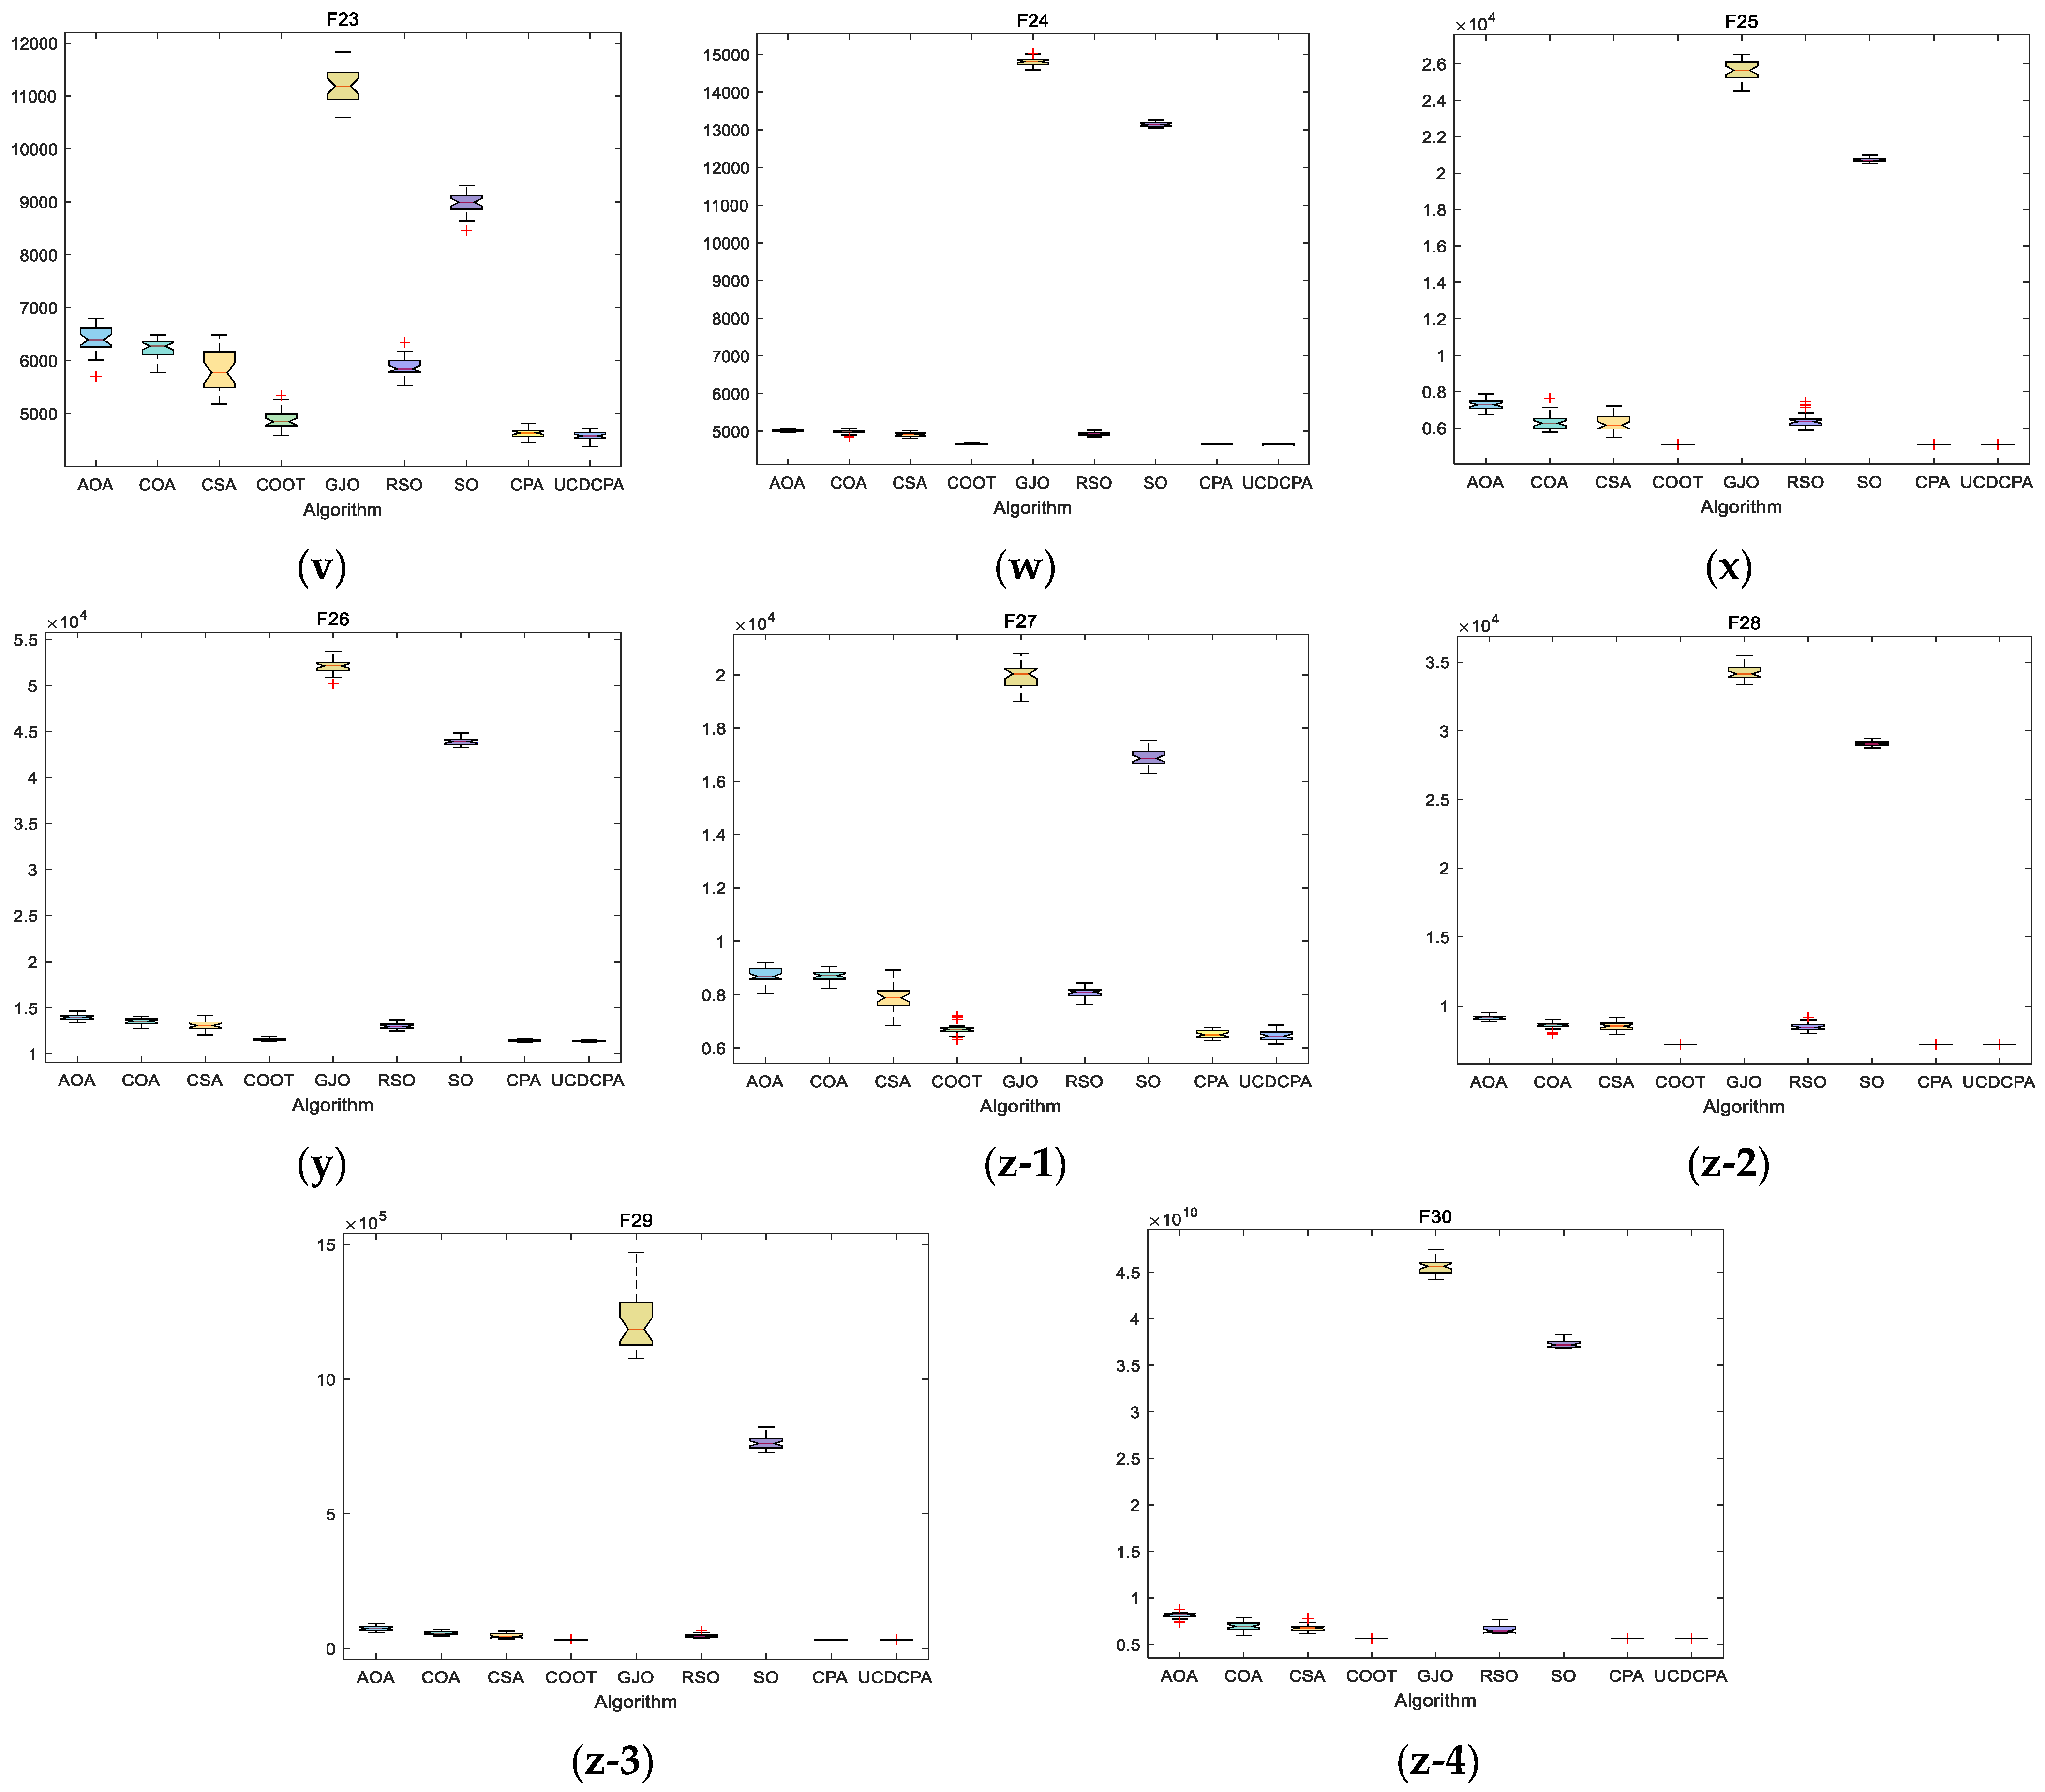
| Algorithm | Parameter | Set Value |
|---|---|---|
| SSA | Proportion of producers | P_percent = 0.2 |
| CPA | Each rate setting | attraction_rate = 0.8 |
| growth_rate = 2 | ||
| reproduction_rate = 1.8 | ||
| UCDCPA | Variation rate | |
| Cross rate | CR = 0.9 |
| F | Index | Algorithm | ||||||||
|---|---|---|---|---|---|---|---|---|---|---|
| AOA | COA | CSA | COOT | GJO | RSO | SO | CPA | UCDCPA | ||
| F1 | Best | 1.9514E+09 | 1.5536E+09 | 1.5395E+09 | 1.3384E+09 | 8.9338E+09 | 1.6496E+09 | 6.0687E+09 | 1.3384E+09 | 1.3384E+09 |
| Mean | 2.1804E+09 | 1.8037E+09 | 1.7997E+09 | 1.3416E+09 | 9.9229E+09 | 1.8955E+09 | 6.2075E+09 | 1.3387E+09 | 1.3385E+09 | |
| Std | 9.0926E+07 | 1.6225E+08 | 1.7284E+08 | 2.9883E+06 | 4.8937E+08 | 1.8298E+08 | 1.0778E+08 | 5.5732E+05 | 7.4499E+04 | |
| Rank | 7 | 5 | 4 | 3 | 9 | 6 | 8 | 2 | 1 | |
| F2 | Best | 8.8122E+10 | 7.9635E+10 | 7.4658E+10 | 6.5317E+10 | 2.6807E+11 | 7.4235E+10 | 2.2424E+11 | 6.5325E+10 | 6.5324E+10 |
| Mean | 8.9885E+10 | 8.6069E+10 | 8.2928E+10 | 6.5317E+10 | 2.7781E+11 | 8.1317E+10 | 2.2602E+11 | 6.5340E+10 | 6.5335E+10 | |
| Std | 1.0436E+09 | 3.5636E+09 | 4.3173E+09 | 4.0629E+02 | 4.6046E+09 | 3.5123E+09 | 1.4763E+09 | 1.2301E+07 | 6.7195E+06 | |
| Rank | 7 | 6 | 5 | 1 | 9 | 4 | 8 | 3 | 2 | |
| F3 | Best | 7.8285E+04 | 7.1451E+04 | 6.3714E+04 | 5.4267E+04 | 2.7270E+05 | 7.0994E+04 | 2.3188E+05 | 5.4378E+04 | 5.4426E+04 |
| Mean | 8.5159E+04 | 7.9614E+04 | 7.5663E+04 | 6.0061E+04 | 2.8741E+05 | 7.6962E+04 | 2.4460E+05 | 5.6205E+04 | 5.7388E+04 | |
| Std | 2.7135E+03 | 3.4274E+03 | 6.8448E+03 | 3.2032E+03 | 5.5788E+03 | 3.3212E+03 | 6.5889E+03 | 1.0904E+03 | 2.4630E+03 | |
| Rank | 7 | 6 | 4 | 3 | 9 | 5 | 8 | 1 | 2 | |
| F4 | Best | 1.8941E+04 | 1.7133E+04 | 1.5770E+04 | 1.4415E+04 | 8.8229E+04 | 1.5961E+04 | 6.8574E+04 | 1.4415E+04 | 1.4415E+04 |
| Mean | 2.0624E+04 | 1.8901E+04 | 1.8105E+04 | 1.4421E+04 | 9.2630E+04 | 1.7664E+04 | 6.9590E+04 | 1.4417E+04 | 1.4416E+04 | |
| Std | 7.5524E+02 | 9.9267E+02 | 1.1830E+03 | 6.8554E+00 | 2.3244E+03 | 8.7779E+02 | 6.8663E+02 | 1.8640E+00 | 1.0466E+00 | |
| Rank | 7 | 6 | 5 | 3 | 9 | 4 | 8 | 2 | 1 | |
| F5 | Best | 520.85 | 5.21E+02 | 5.20E+02 | 520.11 | 520.93 | 520.71 | 521.33 | 520.94 | 520.89 |
| Mean | 521.00 | 5.21E+02 | 5.21E+02 | 520.54 | 521.37 | 521.02 | 521.39 | 521.07 | 521.03 | |
| Std | 0.08 | 8.03E−02 | 3.07E−01 | 0.23 | 0.10 | 0.11 | 0.03 | 0.05 | 0.06 | |
| Rank | 3 | 6 | 2 | 1 | 8 | 4 | 9 | 7 | 5 | |
| F6 | Best | 644.73 | 642.78 | 641.01 | 635.73 | 750.17 | 642.61 | 739.72 | 634.42 | 633.06 |
| Mean | 646.80 | 645.42 | 643.86 | 637.83 | 754.97 | 644.17 | 744.09 | 636.09 | 634.03 | |
| Std | 0.96 | 1.14 | 1.76 | 1.49 | 1.74 | 0.92 | 1.56 | 0.94 | 0.50 | |
| Rank | 7 | 6 | 4 | 3 | 9 | 5 | 8 | 2 | 1 | |
| F7 | Best | 1617.92 | 1460.07 | 1451.98 | 1430.41 | 3488.85 | 1540.79 | 3032.47 | 1430.46 | 1430.45 |
| Mean | 1650.31 | 1551.33 | 1557.37 | 1430.53 | 3559.75 | 1588.44 | 3050.75 | 1430.56 | 1430.49 | |
| Std | 16.43 | 38.04 | 47.02 | 0.34 | 34.71 | 39.85 | 14.61 | 0.11 | 0.03 | |
| Rank | 7 | 4 | 5 | 2 | 9 | 6 | 8 | 3 | 1 | |
| F8 | Best | 1124.28 | 1112.08 | 1009.86 | 967.87 | 1812.76 | 1063.44 | 1418.59 | 961.85 | 963.65 |
| Mean | 1161.42 | 1142.87 | 1080.79 | 982.72 | 1867.41 | 1108.18 | 1457.42 | 966.28 | 966.36 | |
| Std | 18.94 | 10.73 | 38.60 | 11.22 | 30.18 | 19.77 | 19.49 | 1.53 | 1.29 | |
| Rank | 7 | 6 | 4 | 3 | 9 | 5 | 8 | 1 | 2 | |
| F9 | Best | 1219.58 | 1246.68 | 1124.28 | 1080.42 | 1958.59 | 1183.55 | 1720.72 | 1064.84 | 1073.25 |
| Mean | 1264.48 | 1273.83 | 1176.37 | 1098.62 | 2080.52 | 1232.56 | 1795.39 | 1084.63 | 1082.07 | |
| Std | 21.45 | 13.73 | 46.15 | 12.42 | 48.01 | 21.14 | 26.53 | 10.23 | 6.08 | |
| Rank | 6 | 7 | 4 | 3 | 9 | 5 | 8 | 2 | 1 | |
| F10 | Best | 7644.20 | 8397.83 | 5607.98 | 4252.20 | 23,535.81 | 7926.79 | 16,452.52 | 4218.94 | 4144.42 |
| Mean | 8880.93 | 9035.39 | 6833.78 | 4804.01 | 25,043.01 | 8469.02 | 17,701.11 | 4420.90 | 4289.61 | |
| Std | 515.89 | 345.36 | 761.04 | 309.82 | 807.52 | 248.72 | 684.07 | 182.88 | 114.29 | |
| Rank | 6 | 7 | 4 | 3 | 9 | 5 | 8 | 2 | 1 | |
| F11 | Best | 8593.04 | 8622.52 | 6516.24 | 5151.18 | 21,583.81 | 8337.22 | 15,249.30 | 4955.96 | 4936.69 |
| Mean | 9575.61 | 9830.41 | 8029.47 | 5772.96 | 23,926.04 | 8959.48 | 16,580.37 | 5308.01 | 5206.60 | |
| Std | 489.65 | 515.46 | 902.15 | 407.17 | 1062.96 | 307.49 | 677.47 | 197.94 | 176.11 | |
| Rank | 6 | 7 | 4 | 3 | 9 | 5 | 8 | 2 | 1 | |
| F12 | Best | 1201.74 | 1202.22 | 1201.12 | 1200.26 | 1200.95 | 1201.49 | 1200.69 | 1200.03 | 1200.37 |
| Mean | 1202.65 | 1203.49 | 1202.80 | 1201.19 | 1201.87 | 1202.74 | 1202.12 | 1200.17 | 1202.72 | |
| Std | 0.48 | 0.61 | 1.29 | 0.67 | 1.25 | 0.66 | 0.99 | 0.11 | 0.58 | |
| Rank | 5 | 9 | 8 | 2 | 3 | 7 | 4 | 1 | 6 | |
| F13 | Best | 1309.54 | 1309.29 | 1308.77 | 1308.47 | 1309.05 | 1309.00 | 1308.23 | 1308.47 | 1308.47 |
| Mean | 1310.01 | 1309.73 | 1309.35 | 1308.47 | 1309.15 | 1309.43 | 1308.26 | 1308.48 | 1308.47 | |
| Std | 0.15 | 0.23 | 0.27 | 0.00 | 0.06 | 0.28 | 0.02 | 0.00 | 0.00 | |
| Rank | 9 | 8 | 6 | 2 | 5 | 7 | 1 | 4 | 3 | |
| F14 | Best | 1745.65 | 1708.54 | 1712.35 | 1685.40 | 2234.88 | 1723.59 | 2112.58 | 1685.43 | 1685.42 |
| Mean | 1763.24 | 1730.73 | 1733.38 | 1685.40 | 2256.98 | 1743.86 | 2118.71 | 1685.48 | 1685.46 | |
| Std | 7.21 | 7.37 | 12.13 | 0.01 | 10.41 | 16.81 | 4.25 | 0.03 | 0.02 | |
| Rank | 7 | 4 | 5 | 1 | 9 | 6 | 8 | 3 | 2 | |
| F15 | Best | 332,373.40 | 170,995.00 | 161,041.51 | 95,661.51 | 14,209,601.07 | 252,677.50 | 7,516,854.07 | 95,688.99 | 95,677.95 |
| Mean | 480,825.82 | 245,627.59 | 285,726.42 | 96,109.98 | 16,696,930.44 | 367,890.48 | 7,913,546.51 | 95,726.60 | 95,707.22 | |
| Std | 74,855.30 | 49,660.44 | 77,446.38 | 1073.22 | 1,361,809.32 | 99,043.12 | 244,376.43 | 20.58 | 18.31 | |
| Rank | 7 | 4 | 5 | 3 | 9 | 6 | 8 | 2 | 1 | |
| F16 | Best | 1613.58 | 1613.26 | 1613.04 | 1612.84 | 1645.74 | 1613.29 | 1646.47 | 1612.70 | 1612.97 |
| Mean | 1613.90 | 1613.82 | 1613.65 | 1613.46 | 1646.83 | 1613.56 | 1647.35 | 1613.14 | 1613.27 | |
| Std | 0.16 | 0.18 | 0.26 | 0.22 | 0.72 | 0.13 | 0.38 | 0.21 | 0.12 | |
| Rank | 7 | 6 | 5 | 3 | 8 | 4 | 9 | 1 | 2 | |
| F17 | Best | 4.27E+08 | 3.38E+08 | 3.38E+08 | 3.25E+08 | 1.79E+09 | 3.34E+08 | 1.48E+09 | 3.25E+08 | 3.25E+08 |
| Mean | 5.40E+08 | 3.99E+08 | 3.92E+08 | 3.25E+08 | 1.90E+09 | 3.69E+08 | 1.48E+09 | 3.25E+08 | 3.25E+08 | |
| Std | 5.42E+07 | 2.54E+07 | 4.74E+07 | 4.47E+02 | 9.32E+07 | 2.33E+07 | 1.59E+07 | 7.40E+01 | 6.93E+01 | |
| Rank | 7 | 6 | 5 | 3 | 9 | 4 | 8 | 2 | 1 | |
| F18 | Best | 1.1436E+10 | 1.0018E+10 | 1.0018E+10 | 1.0016E+10 | 4.0532E+10 | 1.0016E+10 | 3.9518E+10 | 1.0016E+10 | 1.0016E+10 |
| Mean | 1.2344E+10 | 1.1023E+10 | 1.0752E+10 | 1.0016E+10 | 4.2795E+10 | 1.0418E+10 | 3.9545E+10 | 1.0016E+10 | 1.0016E+10 | |
| Std | 4.5746E+08 | 6.7397E+08 | 5.8952E+08 | 2.1281E+01 | 1.0419E+09 | 4.6019E+08 | 3.9749E+07 | 3.9205E+00 | 2.2977E+00 | |
| Rank | 7 | 6 | 5 | 3 | 9 | 4 | 8 | 2 | 1 | |
| F19 | Best | 2479.35 | 2412.94 | 2388.13 | 2379.70 | 10,973.13 | 2392.06 | 10,241.85 | 2378.28 | 2378.01 |
| Mean | 2558.96 | 2495.82 | 2455.76 | 2381.06 | 11,640.88 | 2428.73 | 10,276.93 | 2379.43 | 2378.89 | |
| Std | 43.80 | 45.65 | 46.06 | 1.09 | 320.71 | 34.17 | 33.56 | 0.60 | 0.42 | |
| Rank | 7 | 6 | 5 | 3 | 9 | 4 | 8 | 2 | 1 | |
| F20 | Best | 8.8904E+08 | 6.9325E+08 | 6.9322E+08 | 6.9318E+08 | 6.6115E+05 | 6.9321E+08 | 2.7941E+05 | 6.9318E+08 | 6.9318E+08 |
| Mean | 1.2599E+09 | 8.6846E+08 | 7.9064E+08 | 6.9318E+08 | 8.5743E+05 | 7.2958E+08 | 3.1482E+05 | 6.9318E+08 | 6.9318E+08 | |
| Std | 1.8284E+08 | 2.2780E+08 | 2.0671E+08 | 1.7719E+01 | 9.0647E+04 | 9.6233E+07 | 2.8322E+04 | 8.0687E+00 | 3.4602E+00 | |
| Rank | 9 | 8 | 7 | 5 | 2 | 6 | 1 | 4 | 3 | |
| F21 | Best | 1.3358E+09 | 7.8918E+08 | 7.8918E+08 | 7.8918E+08 | 4.6016E+08 | 7.8918E+08 | 3.8403E+08 | 7.8918E+08 | 7.8918E+08 |
| Mean | 1.5792E+09 | 1.0404E+09 | 9.3176E+08 | 7.8918E+08 | 5.2214E+08 | 1.0254E+09 | 3.8548E+08 | 7.8918E+08 | 7.8918E+08 | |
| Std | 1.3087E+08 | 1.9006E+08 | 1.5341E+08 | 4.0963E+02 | 3.7660E+07 | 2.4918E+08 | 2.7548E+06 | 1.5085E+02 | 1.2546E+02 | |
| Rank | 9 | 8 | 6 | 5 | 2 | 7 | 1 | 4 | 3 | |
| F22 | Best | 1.8761E+06 | 1.2536E+06 | 1.2534E+06 | 1.2528E+06 | 3.8079E+05 | 1.2535E+06 | 3.6752E+05 | 1.2528E+06 | 1.2528E+06 |
| Mean | 2.4232E+06 | 1.5075E+06 | 1.4324E+06 | 1.2533E+06 | 4.6737E+05 | 1.3894E+06 | 3.6966E+05 | 1.2530E+06 | 1.2530E+06 | |
| Std | 3.5813E+05 | 2.7838E+05 | 2.9168E+05 | 2.4260E+02 | 5.1250E+04 | 2.2597E+05 | 1.3882E+03 | 1.6331E+02 | 1.2373E+02 | |
| Rank | 9 | 8 | 7 | 5 | 2 | 6 | 1 | 4 | 3 | |
| F23 | Best | 2500.00 | 2500.00 | 2517.34 | 2500.00 | 2500.00 | 2500.00 | 2500.00 | 2500.00 | 2500.00 |
| Mean | 2500.00 | 2500.00 | 2545.93 | 2500.00 | 2500.00 | 2500.00 | 2500.00 | 2500.01 | 2500.00 | |
| Std | 0.00E+00 | 0 | 1.26E+01 | 2.21E−06 | 9.13E−13 | 0 | 2.07E−13 | 4.89E−03 | 2.96E−05 | |
| Rank | 1 | 1 | 9 | 6 | 5 | 1 | 4 | 8 | 7 | |
| F24 | Best | 2600.00 | 2600.00 | 2600.25 | 2600.00 | 2600.01 | 2600.00 | 2600.00 | 2601.65 | 2600.50 |
| Mean | 2600.00 | 2600.00 | 2610.15 | 2602.02 | 2600.04 | 2600.00 | 2600.00 | 2604.32 | 2600.81 | |
| Std | 1.15E−03 | 0.00E+00 | 4.51E+00 | 1.85E+00 | 2.15E−02 | 0.00E+00 | 4.47E−04 | 1.97E+00 | 2.07E−01 | |
| Rank | 3 | 1 | 9 | 7 | 5 | 1 | 4 | 8 | 6 | |
| F25 | Best | 2700.00 | 2700.00 | 2700.38 | 2700.00 | 2700.00 | 2700.00 | 2700.00 | 2700.00 | 2700.00 |
| Mean | 2700.00 | 2700.00 | 2700.74 | 2700.00 | 2700.00 | 2700.00 | 2700.00 | 2700.00 | 2700.00 | |
| Std | 0.00E+00 | 0.00E+00 | 1.59E−01 | 9.09E−10 | 1.83E−12 | 0.00E+00 | 2.23E−13 | 2.90E−04 | 1.47E−06 | |
| Rank | 1 | 1 | 9 | 6 | 5 | 1 | 4 | 8 | 7 | |
| F26 | Best | 2800.00 | 2800.00 | 2800.01 | 2800.00 | 2800.00 | 2800.00 | 2800.00 | 2800.00 | 2800.00 |
| Mean | 2800.00 | 2800.00 | 2800.03 | 2800.00 | 2800.00 | 2800.00 | 2800.00 | 2800.01 | 2800.01 | |
| Std | 0.00E+00 | 0.00E+00 | 1.44E−02 | 7.66E−12 | 1.30E−08 | 2.07E−13 | 6.00E−05 | 4.25E−03 | 3.46E−03 | |
| Rank | 1 | 1 | 9 | 4 | 5 | 3 | 6 | 8 | 7 | |
| F27 | Best | 2900.00 | 2900.00 | 2959.45 | 2900.00 | 2900.00 | 2900.00 | 2900.00 | 2900.00 | 2900.00 |
| Mean | 2900.00 | 2900.00 | 3975.98 | 2900.00 | 2900.00 | 2900.00 | 2900.13 | 3021.24 | 2963.95 | |
| Std | 0.00E+00 | 0.00E+00 | 1.63E+03 | 2.99E−09 | 7.83E−13 | 0.00E+00 | 7.31E−01 | 1.94E+02 | 4.19E+01 | |
| Rank | 1 | 1 | 9 | 5 | 4 | 1 | 6 | 8 | 7 | |
| F28 | Best | 3000.00 | 3000.00 | 3069.40 | 3000.00 | 3000.00 | 3000.00 | 3000.00 | 3000.00 | 3000.00 |
| Mean | 3000.00 | 3000.00 | 4567.59 | 3000.00 | 3000.00 | 3000.00 | 3000.00 | 3209.08 | 3149.76 | |
| Std | 0.00E+00 | 0.00E+00 | 2.23E+03 | 2.92E−09 | 2.02E−12 | 0.00E+00 | 2.57E−05 | 2.81E+02 | 8.02E+01 | |
| Rank | 1 | 1 | 9 | 5 | 4 | 1 | 6 | 8 | 7 | |
| F29 | Best | 3.10E+03 | 3100 | 9,706,580.724 | 3100.00 | 3100 | 3100 | 3100 | 4177.03 | 3125.08 |
| Mean | 3.10E+03 | 3100 | 56,600,545.86 | 3100.00 | 3100 | 3100 | 3100 | 10,297.95 | 3201.08 | |
| Std | 0.00E+00 | 0 | 15,192,070.38 | 5.21E−03 | 1.37E−07 | 0 | 3.38E−13 | 5467.43 | 80.62 | |
| Rank | 1 | 1 | 9 | 6 | 5 | 1 | 4 | 8 | 7 | |
| F30 | Best | 3.20E+03 | 3200 | 2,064,310.154 | 3200 | 3200.000583 | 3200 | 3200 | 3360.02 | 3200.82 |
| Mean | 3.20E+03 | 3200 | 3,813,585.33 | 3200.00 | 3200.001049 | 3200.00 | 3200 | 3858.60 | 3205.79 | |
| Std | 0.00E+00 | 0 | 851,270.6626 | 0.00 | 0.000287461 | 0.00E+00 | 9.03E−12 | 434.30 | 5.03 | |
| Rank | 1 | 1 | 9 | 5 | 6 | 1 | 4 | 8 | 7 | |
| Mean rank | 5.43 | 4.90 | 6.03 | 3.57 | 6.80 | 4.17 | 6.13 | 4.00 | 3.30 | |
| Result | 6 | 5 | 7 | 2 | 9 | 4 | 8 | 3 | 1 | |
| +/=/− | 8/2/20 | 8/0/22 | 0/2/28 | 13/2/15 | 12/0/18 | 8/2/20 | 13/0/17 | 3/7/20 | −/−/−/ | |
| F | Index | Algorithm | ||||||||
|---|---|---|---|---|---|---|---|---|---|---|
| AOA | COA | CSA | COOT | GJO | RSO | SO | CPA | UCDCPA | ||
| F1 | Best | 6.96E+10 | 6.40E+10 | 5.86E+10 | 5.59E+10 | 2.33E+11 | 6.34E+10 | 1.91E+11 | 5.59E+10 | 5.59E+10 |
| Mean | 7.32E+10 | 7.00E+10 | 6.70E+10 | 5.59E+10 | 2.41E+11 | 6.60E+10 | 1.93E+11 | 5.59E+10 | 5.59E+10 | |
| Std | 1.88E+09 | 3.17E+09 | 3.41E+09 | 2.67E+07 | 4.20E+09 | 1.44E+09 | 1.08E+09 | 1.88E+07 | 4.78E+06 | |
| Rank | 7 | 6 | 5 | 1 | 9 | 4 | 8 | 3 | 2 | |
| F3 | Best | 85,044.97 | 72,332.55 | 68,149.83 | 60,867.5 | 311,129.87 | 74,233.75 | 304,642.3 | 64,533.78 | 64,517.17 |
| Mean | 90,479.28 | 85,647.27 | 81,644.45 | 64,245.49 | 332,312.2 | 80,393.4 | 327,971.08 | 68,794.97 | 68,164.19 | |
| Std | 2847.68 | 4355.04 | 6275.45 | 1737.85 | 6184.6 | 2943.46 | 9416.48 | 1966.07 | 1509.82 | |
| Rank | 7 | 6 | 5 | 1 | 9 | 4 | 8 | 3 | 2 | |
| F4 | Best | 26,488.83 | 22,108.1 | 20,314.41 | 19,393.32 | 99,000.51 | 22,653.84 | 80,416.02 | 19,393.97 | 19,393.72 |
| Mean | 28,358.87 | 23,957.51 | 23,833.92 | 19,393.92 | 103,966.78 | 25,730.38 | 81,616.57 | 19,396.35 | 19,394.45 | |
| Std | 1005.02 | 723.92 | 1715.46 | 1.09 | 2432.27 | 2241.11 | 763.89 | 3.25 | 0.49 | |
| Rank | 7 | 5 | 4 | 1 | 9 | 6 | 8 | 3 | 2 | |
| F5 | Best | 946.24 | 916.64 | 838.25 | 762.31 | 1707.55 | 838.28 | 1410.9 | 768.81 | 768.19 |
| Mean | 980.14 | 966.36 | 921.17 | 802.49 | 1791.65 | 911.64 | 1475.34 | 795.23 | 791.25 | |
| Std | 17.53 | 18.19 | 44.59 | 16.65 | 43.84 | 27.96 | 25.48 | 10.92 | 10.18 | |
| Rank | 7 | 6 | 5 | 3 | 9 | 4 | 8 | 2 | 1 | |
| F6 | Best | 688.63 | 691.21 | 672.97 | 662.55 | 682.94 | 676.08 | 663.69 | 660.02 | 657.37 |
| Mean | 701.71 | 702.21 | 684.78 | 667.72 | 689.74 | 693.4 | 666.59 | 662.5 | 660.53 | |
| Std | 5.81 | 5.22 | 7.57 | 3.06 | 5.38 | 6.49 | 1.48 | 1.76 | 1.65 | |
| Rank | 8 | 9 | 5 | 4 | 6 | 7 | 3 | 2 | 1 | |
| F7 | Best | 1428.41 | 1361.23 | 1214.3 | 1132.17 | 3236 | 1336.76 | 2690.8 | 1122.69 | 1112.87 |
| Mean | 1463 | 1455.69 | 1374.18 | 1207.06 | 3437.53 | 1391.88 | 2792.63 | 1163.45 | 1137.49 | |
| Std | 18.12 | 36.49 | 59.98 | 42.37 | 78.32 | 26.1 | 54.53 | 23.89 | 15.34 | |
| Rank | 7 | 6 | 4 | 3 | 9 | 5 | 8 | 2 | 1 | |
| F8 | Best | 1121.69 | 1144.29 | 1020.03 | 981.54 | 2135.87 | 1065.63 | 1920.28 | 972.56 | 970.28 |
| Mean | 1172.48 | 1176.61 | 1090.92 | 1003.63 | 2282.34 | 1134 | 1962.08 | 992.03 | 984.31 | |
| Std | 20.78 | 15.85 | 40.25 | 13.72 | 46.93 | 22.89 | 26.01 | 9.41 | 7.43 | |
| Rank | 6 | 7 | 4 | 3 | 9 | 5 | 8 | 2 | 1 | |
| F9 | Best | 8120.94 | 10,311.72 | 6153.63 | 4882.99 | 37,198.65 | 7647.01 | 55,433.95 | 4809.7 | 9504.28 |
| Mean | 11,063.65 | 12,331.8 | 10,051.96 | 6365.98 | 65,082.02 | 10,760.46 | 71,394.03 | 6248.02 | 10,566.12 | |
| Std | 1370.08 | 932.13 | 2721.43 | 901.49 | 18,797.13 | 1286.47 | 7660.7 | 2372.38 | 541.29 | |
| Rank | 6 | 7 | 3 | 2 | 8 | 5 | 9 | 1 | 4 | |
| F10 | Best | 8210.32 | 8449.16 | 6531.75 | 4721.36 | 23,052.26 | 7194.6 | 17,350.85 | 4437.85 | 4524.28 |
| Mean | 9075.77 | 9531.32 | 7835.56 | 5439.08 | 24,892.66 | 8074.75 | 18,536.66 | 5101.85 | 5046.05 | |
| Std | 395.89 | 418.53 | 948.21 | 398.42 | 899.62 | 533.48 | 635.83 | 319 | 224.01 | |
| Rank | 6 | 7 | 4 | 3 | 9 | 5 | 8 | 2 | 1 | |
| F11 | Best | 2.16E+07 | 1.83E+07 | 1.83E+07 | 1.83E+07 | 1.04E+12 | 1.83E+07 | 8.79E+11 | 1.83E+07 | 1.83E+07 |
| Mean | 6.94E+07 | 2.02E+07 | 2.30E+07 | 1.83E+07 | 1.59E+12 | 1.93E+07 | 8.82E+11 | 1.83E+07 | 1.83E+07 | |
| Std | 3.13E+07 | 6.87E+06 | 1.18E+07 | 17.18 | 3.94E+11 | 2,995,138.49 | 9,003,578,632 | 6.05 | 5.19 | |
| Rank | 7 | 5 | 6 | 3 | 9 | 4 | 8 | 2 | 1 | |
| F12 | Best | 2.24E+10 | 2.06E+10 | 1.91E+10 | 1.85E+10 | 1.92E+11 | 2.02E+10 | 1.64E+11 | 1.85E+10 | 1.85E+10 |
| Mean | 2.49E+10 | 2.24E+10 | 2.17E+10 | 1.85E+10 | 2.00E+11 | 2.25E+10 | 1.65E+11 | 1.85E+10 | 1.85E+10 | |
| Std | 9.48E+08 | 9.79E+08 | 1.25E+09 | 3.23E+06 | 3.50E+09 | 1.49E+09 | 8.12E+08 | 5.35E+04 | 1.98E+04 | |
| Rank | 7 | 5 | 4 | 3 | 9 | 6 | 8 | 2 | 1 | |
| F13 | Best | 3.30E+10 | 2.86E+10 | 2.86E+10 | 2.86E+10 | 4.66E+10 | 2.86E+10 | 4.41E+10 | 2.86E+10 | 2.86E+10 |
| Mean | 3.61E+10 | 3.09E+10 | 3.02E+10 | 2.86E+10 | 4.85E+10 | 3.21E+10 | 4.42E+10 | 2.86E+10 | 2.86E+10 | |
| Std | 1.46E+09 | 1.85E+09 | 1.80E+09 | 1.54E+02 | 1.10E+09 | 2.79E+09 | 4.77E+07 | 4.67E+01 | 3.47E+01 | |
| Rank | 7 | 5 | 4 | 3 | 9 | 6 | 8 | 2 | 1 | |
| F14 | Best | 3.95E+08 | 2.86E+08 | 2.86E+08 | 2.86E+08 | 2.08E+08 | 2.86E+08 | 1.89E+08 | 2.86E+08 | 2.86E+08 |
| Mean | 5.30E+08 | 3.41E+08 | 3.23E+08 | 2.86E+08 | 2.69E+08 | 2.98E+08 | 1.89E+08 | 2.86E+08 | 2.86E+08 | |
| Std | 8.81E+07 | 5.86E+07 | 6.89E+07 | 1.51E+01 | 3.70E+07 | 2.71E+07 | 1.52E+05 | 6.54E+00 | 4.37E+00 | |
| Rank | 9 | 8 | 7 | 5 | 2 | 6 | 1 | 4 | 3 | |
| F15 | Best | 3.14E+09 | 2.97E+09 | 2.97E+09 | 2.97E+09 | 2.80E+10 | 2.97E+09 | 2.79E+10 | 2.97E+09 | 2.97E+09 |
| Mean | 3.66E+09 | 3.16E+09 | 3.27E+09 | 2.97E+09 | 2.93E+10 | 3.03E+09 | 2.79E+10 | 2.97E+09 | 2.97E+09 | |
| Std | 3.13E+08 | 1.86E+08 | 3.88E+08 | 1.73E+03 | 7.98E+08 | 1.21E+08 | 1.34E+07 | 8.94E+00 | 8.55E+00 | |
| Rank | 7 | 5 | 6 | 3 | 9 | 4 | 8 | 2 | 1 | |
| F16 | Best | 17,902.11 | 15,436.27 | 15,509.67 | 14,481.07 | 23,217.34 | 15,864.76 | 19,668.88 | 14,458.22 | 14,473.92 |
| Mean | 20,667.79 | 17,722.05 | 17,581.48 | 15,076.45 | 25,378.02 | 16,751.56 | 20,397.27 | 14,891.61 | 14,776.26 | |
| Std | 1149.15 | 1028.18 | 1436.1 | 341.67 | 809.46 | 555.94 | 421.89 | 219.71 | 166.64 | |
| Rank | 8 | 6 | 5 | 3 | 9 | 4 | 7 | 2 | 1 | |
| F17 | Best | 66,689.36 | 57,907.37 | 57,117.16 | 56,609.44 | 26,517,855.16 | 57,391.92 | 24,582,274.02 | 56,590.26 | 56,589.9 |
| Mean | 102,835.52 | 61,986.7 | 62,600.6 | 56,895.25 | 32,596,475.94 | 65,765.57 | 24,615,145.06 | 56,771.83 | 56,736.15 | |
| Std | 14,040.69 | 4745.2 | 9976.28 | 172.09 | 4,126,332.61 | 12,805.85 | 163,000.24 | 107.86 | 97.93 | |
| Rank | 7 | 4 | 5 | 3 | 9 | 6 | 8 | 2 | 1 | |
| F18 | Best | 1.97E+09 | 1.38E+09 | 1.38E+09 | 1.37E+09 | 1.82E+08 | 1.38E+09 | 1.61E+08 | 1.37E+09 | 1.37E+09 |
| Mean | 2.50E+09 | 1.67E+09 | 1.76E+09 | 1.37E+09 | 2.33E+08 | 1.49E+09 | 1.61E+08 | 1.37E+09 | 1.37E+09 | |
| Std | 2.69E+08 | 2.68E+08 | 4.13E+08 | 9.87E+05 | 3.58E+07 | 1.59E+08 | 5.02E+05 | 2.11E+01 | 2.96E+00 | |
| Rank | 9 | 7 | 8 | 5 | 2 | 6 | 1 | 4 | 3 | |
| F19 | Best | 3.38E+09 | 3.12E+09 | 3.12E+09 | 3.12E+09 | 2.86E+10 | 3.12E+09 | 2.85E+10 | 3.12E+09 | 3.12E+09 |
| Mean | 3.71E+09 | 3.15E+09 | 3.26E+09 | 3.12E+09 | 2.98E+10 | 3.35E+09 | 2.85E+10 | 3.12E+09 | 3.12E+09 | |
| Std | 2.72E+08 | 3.86E+07 | 1.95E+08 | 3.13E+03 | 8.12E+08 | 2.85E+08 | 8.67E+05 | 5.05E+00 | 5.14E+00 | |
| Rank | 7 | 4 | 5 | 3 | 9 | 6 | 8 | 2 | 1 | |
| F20 | Best | 3.45E+03 | 3.42E+03 | 3.32E+03 | 3.22E+03 | 6.29E+03 | 3.36E+03 | 5.50E+03 | 3.22E+03 | 3.21E+03 |
| Mean | 3.73E+03 | 3.65E+03 | 3.54E+03 | 3.31E+03 | 6.98E+03 | 3.47E+03 | 6.08E+03 | 3.27E+03 | 3.26E+03 | |
| Std | 1.25E+02 | 8.94E+01 | 1.21E+02 | 7.20E+01 | 4.18E+02 | 1.09E+02 | 2.79E+02 | 3.32E+01 | 3.81E+01 | |
| Rank | 7 | 6 | 5 | 3 | 9 | 4 | 8 | 2 | 1 | |
| F21 | Best | 2.97E+03 | 2.91E+03 | 2.82E+03 | 2.73E+03 | 7.69E+03 | 2.89E+03 | 6.04E+03 | 2.74E+03 | 2.74E+03 |
| Mean | 3.02E+03 | 2.96E+03 | 2.92E+03 | 2.78E+03 | 7.97E+03 | 2.93E+03 | 6.15E+03 | 2.75E+03 | 2.75E+03 | |
| Std | 2.89E+01 | 2.57E+01 | 5.49E+01 | 2.67E+01 | 1.86E+02 | 2.75E+01 | 6.98E+01 | 1.51E+01 | 7.63E+00 | |
| Rank | 7 | 6 | 4 | 3 | 9 | 5 | 8 | 2 | 1 | |
| F22 | Best | 9.94E+03 | 9.91E+03 | 8.62E+03 | 7.61E+03 | 2.74E+04 | 9.24E+03 | 2.21E+04 | 7.29E+03 | 7.31E+03 |
| Mean | 1.06E+04 | 1.06E+04 | 9.61E+03 | 8.15E+03 | 2.90E+04 | 9.94E+03 | 2.32E+04 | 7.64E+03 | 7.57E+03 | |
| Std | 3.33E+02 | 3.34E+02 | 7.18E+02 | 3.23E+02 | 9.22E+02 | 3.44E+02 | 4.74E+02 | 2.02E+02 | 1.82E+02 | |
| Rank | 7 | 6 | 4 | 3 | 9 | 5 | 8 | 2 | 1 | |
| F23 | Best | 5.70E+03 | 5.78E+03 | 5.18E+03 | 4.58E+03 | 1.06E+04 | 5.54E+03 | 8.46E+03 | 4.45E+03 | 4.37E+03 |
| Mean | 6.39E+03 | 6.22E+03 | 5.81E+03 | 4.88E+03 | 1.12E+04 | 5.88E+03 | 8.99E+03 | 4.63E+03 | 4.57E+03 | |
| Std | 2.51E+02 | 1.79E+02 | 3.94E+02 | 1.96E+02 | 3.53E+02 | 1.97E+02 | 1.89E+02 | 8.54E+01 | 8.39E+01 | |
| Rank | 7 | 6 | 4 | 3 | 9 | 5 | 8 | 2 | 1 | |
| F24 | Best | 4.98E+03 | 4.85E+03 | 4.80E+03 | 4.64E+03 | 1.46E+04 | 4.85E+03 | 1.31E+04 | 4.64E+03 | 4.64E+03 |
| Mean | 5.02E+03 | 4.98E+03 | 4.91E+03 | 4.65E+03 | 1.48E+04 | 4.93E+03 | 1.31E+04 | 4.66E+03 | 4.65E+03 | |
| Std | 2.50E+01 | 4.77E+01 | 5.59E+01 | 1.76E+01 | 1.12E+02 | 4.68E+01 | 5.86E+01 | 1.67E+01 | 1.89E+01 | |
| Rank | 7 | 6 | 4 | 1 | 9 | 5 | 8 | 3 | 2 | |
| F25 | Best | 6.74E+03 | 5.78E+03 | 5.48E+03 | 5.09E+03 | 2.45E+04 | 5.88E+03 | 2.05E+04 | 5.09E+03 | 5.09E+03 |
| Mean | 7.30E+03 | 6.35E+03 | 6.25E+03 | 5.09E+03 | 2.56E+04 | 6.42E+03 | 2.07E+04 | 5.09E+03 | 5.09E+03 | |
| Std | 2.62E+02 | 4.38E+02 | 4.59E+02 | 2.67E+00 | 5.73E+02 | 4.09E+02 | 1.04E+02 | 4.11E−01 | 3.13E−01 | |
| Rank | 7 | 5 | 4 | 3 | 9 | 6 | 8 | 2 | 1 | |
| F26 | Best | 1.35E+04 | 1.28E+04 | 1.21E+04 | 1.13E+04 | 5.02E+04 | 1.25E+04 | 4.33E+04 | 1.13E+04 | 1.12E+04 |
| Mean | 1.40E+04 | 1.36E+04 | 1.31E+04 | 1.15E+04 | 5.20E+04 | 1.30E+04 | 4.39E+04 | 1.14E+04 | 1.14E+04 | |
| Std | 2.91E+02 | 3.24E+02 | 5.53E+02 | 1.35E+02 | 7.89E+02 | 3.38E+02 | 4.56E+02 | 1.02E+02 | 7.71E+01 | |
| Rank | 7 | 6 | 5 | 3 | 9 | 4 | 8 | 2 | 1 | |
| F27 | Best | 8.04E+03 | 8.25E+03 | 6.84E+03 | 6.31E+03 | 1.90E+04 | 7.64E+03 | 1.63E+04 | 6.29E+03 | 6.15E+03 |
| Mean | 8.74E+03 | 8.71E+03 | 7.86E+03 | 6.71E+03 | 2.00E+04 | 8.08E+03 | 1.69E+04 | 6.52E+03 | 6.47E+03 | |
| Std | 2.87E+02 | 2.00E+02 | 5.73E+02 | 2.20E+02 | 4.24E+02 | 1.84E+02 | 3.19E+02 | 1.36E+02 | 1.80E+02 | |
| Rank | 7 | 6 | 4 | 3 | 9 | 5 | 8 | 2 | 1 | |
| F28 | Best | 8.87E+03 | 7.97E+03 | 7.94E+03 | 7.19E+03 | 3.33E+04 | 8.02E+03 | 2.87E+04 | 7.19E+03 | 7.19E+03 |
| Mean | 9.15E+03 | 8.60E+03 | 8.52E+03 | 7.19E+03 | 3.43E+04 | 8.51E+03 | 2.91E+04 | 7.20E+03 | 7.19E+03 | |
| Std | 1.70E+02 | 2.23E+02 | 3.24E+02 | 1.12E+00 | 5.45E+02 | 2.89E+02 | 1.87E+02 | 1.06E+00 | 7.13E−01 | |
| Rank | 7 | 6 | 5 | 1 | 9 | 4 | 8 | 3 | 2 | |
| F29 | Best | 5.87E+04 | 4.59E+04 | 3.51E+04 | 3.15E+04 | 1.08E+06 | 3.67E+04 | 7.26E+05 | 3.15E+04 | 3.15E+04 |
| Mean | 7.46E+04 | 5.64E+04 | 4.70E+04 | 3.19E+04 | 1.22E+06 | 4.58E+04 | 7.62E+05 | 3.18E+04 | 3.16E+04 | |
| Std | 9.69E+03 | 5.89E+03 | 9.72E+03 | 4.84E+02 | 1.12E+05 | 6.61E+03 | 2.34E+04 | 3.38E+02 | 2.46E+02 | |
| Rank | 7 | 6 | 5 | 3 | 9 | 4 | 8 | 2 | 1 | |
| F30 | Best | 7.38E+09 | 5.97E+09 | 6.16E+09 | 5.65E+09 | 4.42E+10 | 6.19E+09 | 3.67E+10 | 5.65E+09 | 5.65E+09 |
| Mean | 8.15E+09 | 6.96E+09 | 6.77E+09 | 5.65E+09 | 4.56E+10 | 6.64E+09 | 3.73E+10 | 5.65E+09 | 5.65E+09 | |
| Std | 3.11E+08 | 4.41E+08 | 3.96E+08 | 1.54E+06 | 7.63E+08 | 5.17E+08 | 4.18E+08 | 1.85E+06 | 4.04E+05 | |
| Rank | 7 | 6 | 5 | 1 | 9 | 4 | 8 | 3 | 2 | |
| Mean rank | 7.1 | 5.97 | 4.76 | 2.72 | 8.38 | 4.97 | 7.34 | 2.31 | 1.45 | |
| Result | 7 | 6 | 4 | 3 | 9 | 5 | 8 | 2 | 1 | |
| +/=/− | 2000/1/28 | 0/0/29 | 2000/1/28 | 2008/1/20 | 2/0/27 | 2000/1/28 | 2/0/27 | 1/13/15 | −/−/−/ | |
| Algorithms | Ts | Th | R | L | Optimum Cost |
|---|---|---|---|---|---|
| BWO [42] | 1.35762647 | 1.093437138 | 67.69082252 | 113.0682817 | 7452.833749 |
| GSA [16] | 0.90125717 | 0.881298174 | 46.32687683 | 167.7379974 | 8900.046643 |
| AOA [43] | 0.780590299 | 0.385783281 | 40.44361782 | 198.3877341 | 5894.187289 |
| AO [44] | 0.847809404 | 0.433226318 | 43.66107194 | 160.3307465 | 6149.803509 |
| HHO [28] | 0.882129626 | 0.438803464 | 45.70354005 | 136.5566478 | 6098.410688 |
| RSO [39] | 1.023595723 | 0.548121786 | 53.00397707 | 78.53244426 | 6752.320707 |
| SCA [25] | 0.828990697 | 0.453075845 | 42.86366246 | 171.8211562 | 6238.443072 |
| WOA [26] | 0.845217747 | 0.414401057 | 42.25129909 | 174.7516586 | 6193.691409 |
| PSO [23] | 0.789311349 | 0.389923651 | 40.87077061 | 192.4817157 | 5907.740366 |
| SHO [45] | 1.45363783 | 0.864019419 | 69.21011101 | 10 | 10,953.58287 |
| MVO [13] | 0.83997938 | 0.41617848 | 43.49393648 | 160.2903645 | 6011.610548 |
| HS [19] | 1.057860805 | 0.616265357 | 53.79451517 | 128.7466594 | 9381.627416 |
| CPA [29] | 0.779207674 | 0.385163555 | 40.37358135 | 199.2501794 | 5887.103014 |
| UCDCPA | 0.818807403 | 0.404738252 | 42.42550141 | 172.6257773 | 5885.317546 |
| Algorithms | Best | Mean | Worst | Std |
|---|---|---|---|---|
| BWO [42] | 7452.833749 | 8668.096187 | 9835.931831 | 645.6007505 |
| GSA [16] | 8900.046643 | 22,826.83618 | 33,709.70179 | 6739.746909 |
| AOA [43] | 5894.187289 | 6073.39365 | 6467.034139 | 176.6077507 |
| AO [44] | 6149.803509 | 6703.38539 | 7650.836881 | 445.6648705 |
| HHO [28] | 6098.410688 | 6773.338116 | 7321.578979 | 373.4757438 |
| RSO [39] | 6752.320707 | 13,303.19277 | 36,017.19213 | 7139.553858 |
| SCA [25] | 6238.443072 | 6740.990306 | 8667.698978 | 596.9230292 |
| WOA [26] | 6193.691409 | 7788.515478 | 14,356.43308 | 2207.831263 |
| PSO [23] | 5907.740366 | 6215.186207 | 6817.609346 | 308.9590064 |
| SHO [45] | 10,953.58287 | 20,683.71124 | 38,772.72675 | 7522.154569 |
| MVO [13] | 6011.610548 | 6454.018394 | 7244.10122 | 305.5658618 |
| HS [19] | 9381.627416 | 13,219.79192 | 16,750.36369 | 2431.426944 |
| CPA [29] | 5887.103014 | 6011.158017 | 6307.525495 | 1.25E+02 |
| UCDCPA | 5885.317546 | 5885.317546 | 5885.317546 | 1.87E−12 |
| Algorithms | h | l | t | b | Optimum Cost |
|---|---|---|---|---|---|
| GSA [16] | 0.162851394 | 4.54597146 | 8.638236427 | 0.250005147 | 2.060084936 |
| AOA [43] | 0.204277902 | 3.303984088 | 9.04125477 | 0.205706549 | 1.700621531 |
| AO [44] | 0.189374632 | 3.547522386 | 9.134755541 | 0.206786696 | 1.73521502 |
| HHO [28] | 0.188109377 | 3.905038631 | 9.030136455 | 0.206025348 | 1.755250851 |
| RSO [39] | 0.149913681 | 6.263663498 | 8.735493845 | 0.223742119 | 2.060920727 |
| SCA [25] | 0.197001179 | 3.447630359 | 9.061850711 | 0.210734829 | 1.750779615 |
| WOA [26] | 0.187626514 | 3.496137108 | 9.55526453 | 0.203278952 | 1.770945189 |
| GWO [24] | 0.205639834 | 3.258414504 | 9.038918564 | 0.205727445 | 1.696210777 |
| PSO [23] | 0.205717244 | 3.253567261 | 9.036950989 | 0.205728009 | 1.695333367 |
| SHO [45] | 0.15716373 | 4.788258496 | 9.265491874 | 0.243779909 | 2.172339171 |
| HS [19] | 0.133846407 | 5.896646319 | 9.090787017 | 0.239299182 | 2.199069081 |
| CPA [29] | 0.20572964 | 3.253120041 | 9.03662391 | 0.20572964 | 1.695247165 |
| UCDCPA | 0.20572964 | 3.253120041 | 9.03662391 | 0.20572964 | 1.695247165 |
| Algorithms | Best | Mean | Worst | Std |
|---|---|---|---|---|
| GSA [16] | 2.060084936 | 2.260378901 | 2.395427434 | 0.103945911 |
| AOA [43] | 1.700621531 | 2.010126216 | 3.41715675 | 0.456539458 |
| AO [44] | 1.73521502 | 1.858312119 | 2.045979674 | 0.089512879 |
| HHO [28] | 1.755250851 | 1.843976042 | 2.196985884 | 0.105249207 |
| RSO [39] | 2.060920727 | 5.242901347 | 46.8049853 | 9.818645738 |
| SCA [25] | 1.750779615 | 1.83018928 | 1.927682829 | 0.043302748 |
| WOA [26] | 1.770945189 | 2.078361923 | 3.598644235 | 0.456109982 |
| GWO [24] | 1.696210777 | 1.698075685 | 1.706826075 | 0.002303005 |
| PSO [23] | 1.695333367 | 1.696054342 | 1.700382568 | 0.001099938 |
| SHO [45] | 2.172339171 | 8.41388697 | 57.61069741 | 12.82400304 |
| HS [19] | 2.199069081 | 2.961271545 | 3.338760975 | 0.264197415 |
| CPA [29] | 1.695247165 | 1.695247165 | 1.695247165 | 1.14E−16 |
| UCDCPA | 1.695247165 | 1.695247165 | 1.695247165 | 0 |
| Algorithms | d | D | N | Optimum Cost |
|---|---|---|---|---|
| GSA [16] | 0.054336606 | 0.411182717 | 9.27940294 | 0.013693233 |
| AO [44] | 0.053858024 | 0.382210602 | 11.05851677 | 0.014477628 |
| HHO [28] | 0.055518108 | 0.456022463 | 7.191402658 | 0.012919253 |
| RSO [39] | 0.051578783 | 0.351426469 | 11.86143225 | 0.012959396 |
| WOA [26] | 0.053192553 | 0.393977515 | 9.397755032 | 0.012705521 |
| PSO [23] | 0.052695325 | 0.379080507 | 10.26803936 | 0.012913703 |
| SMA [48] | 0.050025201 | 0.317991335 | 13.98116224 | 0.012717488 |
| SHO [45] | 0.05 | 0.314726583 | 15 | 0.01337588 |
| MVO [13] | 0.05 | 0.316210131 | 14.19550214 | 0.012802955 |
| HS [19] | 0.054112945 | 0.413019501 | 9.910684619 | 0.014404879 |
| ALO [49] | 0.050987891 | 0.340082479 | 12.33528746 | 0.012674323 |
| CPA [29] | 0.051858341 | 0.360803904 | 11.05336423 | 0.012665752 |
| UCDCPA | 0.052565382 | 0.378168224 | 10.13392929 | 0.012665231 |
| Algorithms | Best | Mean | Worst | Std |
|---|---|---|---|---|
| GSA [16] | 0.013693233 | 0.017446335 | 0.021225117 | 0.002099083 |
| AO [44] | 0.014477628 | 0.016524122 | 0.020944277 | 0.001749639 |
| HHO [28] | 0.012919253 | 0.01367488 | 0.015510811 | 0.000733611 |
| RSO [39] | 0.012959396 | 4176.97903 | 42208.32165 | 10463.97555 |
| WOA [26] | 0.012705521 | 0.013497022 | 0.017773562 | 0.001085082 |
| PSO [23] | 0.012913703 | 0.013681989 | 0.014907415 | 0.000629188 |
| SMA [48] | 0.012717488 | 0.013097227 | 0.014225745 | 0.00051897 |
| SHO [45] | 0.01337588 | 1562.290559 | 16836.22462 | 4721.617609 |
| MVO [13] | 0.012802955 | 0.01692502 | 0.018300031 | 0.001618284 |
| HS [19] | 0.014404879 | 0.023626948 | 0.050181296 | 0.007737902 |
| ALO [49] | 0.012674323 | 0.013843033 | 0.017642955 | 0.001814955 |
| CPA [29] | 0.012665752 | 0.012762078 | 0.013068728 | 0.00012129 |
| UCDCPA | 0.012665231 | 0.012665231 | 0.012665232 | 2.66E−10 |
| Algorithms | x1 | x2 | x3 | x4 | Optimum Cost |
|---|---|---|---|---|---|
| GSA [16] | 49.09926771 | 16.58870178 | 19.96015692 | 43.40356866 | 2.700857E−12 |
| AOA [43] | 43.71647858 | 19.7208177 | 16.4232225 | 49.45682569 | 2.700857E−12 |
| AO [44] | 49.83084862 | 16.24845435 | 19.71874271 | 43.324778 | 2.700857E−12 |
| RSO [39] | 27.29887237 | 12 | 12 | 37.17778148 | 1.827380E−08 |
| SCA [25] | 49.86378029 | 19.81902942 | 16.50739713 | 43.29977556 | 2.700857E−12 |
| GWO [24] | 49.92736013 | 19.55850161 | 16.4773682 | 43.05012785 | 2.700857E−12 |
| PSO [23] | 49.33432112 | 19.39566196 | 16.54612986 | 43.10005969 | 2.700857E−12 |
| SMA [48] | 51.70131506 | 13.74783833 | 30.30206275 | 53.45404325 | 2.307816E−11 |
| SHO [45] | 55.97209247 | 40.47794844 | 12 | 60 | 1.381144E−06 |
| WHO [51] | 43.86923887 | 19.45848526 | 16.13971724 | 49.58874223 | 2.700857E−12 |
| MVO [13] | 43.18211959 | 19.81774931 | 16.368027 | 49.42425551 | 2.700857E−12 |
| MFO [27] | 51.02233936 | 26.4068411 | 15.37123392 | 53.66313366 | 2.307816E−11 |
| ALO [49] | 53.90915117 | 20.30000998 | 13.44122459 | 34.0496304 | 2.307816E−11 |
| CPA [29] | 43.9192177 | 19.83148672 | 16.99034087 | 49.37036408 | 2.700857E−12 |
| UCDCPA | 49.97261094 | 19.91168483 | 16.87627009 | 43.89722598 | 2.700857E−12 |
| Algorithms | Best | Mean | Worst | Std |
|---|---|---|---|---|
| GSA [16] | 2.700857E−12 | 1.010642E−09 | 2.357641E−09 | 9.394177E−10 |
| AOA [43] | 2.700857E−12 | 2.442156E−09 | 1.827380E−08 | 4.358741E−09 |
| AO [44] | 2.700857E−12 | 1.248539E−09 | 4.503304E−09 | 1.289949E−09 |
| RSO [39] | 1.827380E−08 | 1.542447E−04 | 1.646172E−03 | 3.713617E−04 |
| SCA [25] | 2.700857E−12 | 9.134559E−10 | 2.357641E−09 | 7.666596E−10 |
| GWO [24] | 2.700857E−12 | 1.138729E−10 | 9.921580E−10 | 3.005126E−10 |
| PSO [23] | 2.700857E−12 | 6.440009E−11 | 9.921580E−10 | 2.185927E−10 |
| SMA [48] | 2.307816E−11 | 4.989225E−09 | 2.726451E−08 | 7.559668E−09 |
| SHO [45] | 1.381144E−06 | 1.471356E−04 | 8.349042E−04 | 2.498206E−04 |
| WHO [51] | 2.700857E−12 | 2.655999E−10 | 9.921580E−10 | 3.816328E−10 |
| MVO [13] | 2.700857E−12 | 4.861756E−10 | 2.357641E−09 | 6.039829E−10 |
| MFO [27] | 2.307816E−11 | 1.850996E−09 | 4.503304E−09 | 1.318984E−09 |
| ALO [49] | 2.307816E−11 | 3.192183E−09 | 1.827380E−08 | 4.885282E−09 |
| CPA [29] | 2.700857E−12 | 4.639657E−10 | 4.503304E−09 | 1.112919E−09 |
| UCDCPA | 2.700857E−12 | 1.858504E−11 | 1.166116E−10 | 2.521680E−11 |
| Algorithms | x1 | x2 | x3 | x4 | x5 | Optimum Cost |
|---|---|---|---|---|---|---|
| BWO [42] | 1.91112381 | 3.371424243 | 3.136849543 | 3.984923889 | 1.830067654 | 0.895341162 |
| GSA [16] | 2.742172682 | 2.227520474 | 2.039099093 | 1.600194337 | 0.987632636 | 0.685438760 |
| AOA [43] | 2.837698938 | 1.949856649 | 1.857736678 | 1.523619661 | 1.031383307 | 0.697298770 |
| AO [44] | 2.726339704 | 2.243634883 | 2.035880163 | 1.580650671 | 0.97798304 | 0.685429422 |
| RSO [39] | 2.397288674 | 2.002288903 | 1.594785803 | 2.701129185 | 0.513855729 | 0.941856920 |
| SCA [25] | 2.7851993 | 2.163499301 | 1.945893374 | 1.639149628 | 1.082000068 | 0.687731007 |
| PSO [23] | 3.336873677 | 2.237796936 | 1.603377869 | 1.935560703 | 0.831736446 | 0.726407620 |
| SHO [45] | 2.782322365 | 2.254589461 | 2.42138236 | 1.930452462 | 1.056199247 | 0.704087739 |
| HS [19] | 3.094335154 | 1.649156667 | 7.852158097 | 1.758757853 | 1.270419628 | 1.051561683 |
| CPA [29] | 2.732785709 | 2.228074467 | 2.046348837 | 1.590249628 | 0.977632633 | 0.685408058 |
| UCDCPA | 2.732172679 | 2.228520482 | 2.041099089 | 1.590194328 | 0.977632631 | 0.685406037 |
| Algorithms | Best | Mean | Worst | Std |
|---|---|---|---|---|
| BWO [42] | 0.895341162 | 0.989495691 | 1.095570621 | 0.057368242 |
| GSA [16] | 0.685438760 | 0.685424155 | 0.685768406 | 8.10282E−05 |
| AOA [43] | 0.697298770 | 0.743549727 | 0.813673683 | 0.027671128 |
| AO [44] | 0.685429422 | 0.685533512 | 0.685860485 | 0.000101308 |
| RSO [39] | 0.941856920 | 2.016025356 | 4.559510955 | 1.097470827 |
| SCA [25] | 0.687731007 | 0.693337949 | 0.707001376 | 0.00448995 |
| PSO [23] | 0.726407620 | 0.816503624 | 0.914341693 | 0.048147663 |
| SHO [45] | 0.704087739 | 2.0610002 | 5.193706033 | 1.737868709 |
| HS [19] | 1.051561683 | 1.529689345 | 2.035159822 | 0.287530949 |
| CPA [29] | 0.685408058 | 0.685408058 | 0.685408058 | 1.13875E−16 |
| UCDCPA | 0.685406037 | 0.685406037 | 0.685406037 | 1.13906E−16 |
Disclaimer/Publisher’s Note: The statements, opinions and data contained in all publications are solely those of the individual author(s) and contributor(s) and not of MDPI and/or the editor(s). MDPI and/or the editor(s) disclaim responsibility for any injury to people or property resulting from any ideas, methods, instructions or products referred to in the content. |
© 2023 by the authors. Licensee MDPI, Basel, Switzerland. This article is an open access article distributed under the terms and conditions of the Creative Commons Attribution (CC BY) license (https://creativecommons.org/licenses/by/4.0/).
Share and Cite
Peng, M.; Jing, W.; Yang, J.; Hu, G. Multistrategy-Boosted Carnivorous Plant Algorithm: Performance Analysis and Application in Engineering Designs. Biomimetics 2023, 8, 162. https://doi.org/10.3390/biomimetics8020162
Peng M, Jing W, Yang J, Hu G. Multistrategy-Boosted Carnivorous Plant Algorithm: Performance Analysis and Application in Engineering Designs. Biomimetics. 2023; 8(2):162. https://doi.org/10.3390/biomimetics8020162
Chicago/Turabian StylePeng, Min, Wenlong Jing, Jianwei Yang, and Gang Hu. 2023. "Multistrategy-Boosted Carnivorous Plant Algorithm: Performance Analysis and Application in Engineering Designs" Biomimetics 8, no. 2: 162. https://doi.org/10.3390/biomimetics8020162
APA StylePeng, M., Jing, W., Yang, J., & Hu, G. (2023). Multistrategy-Boosted Carnivorous Plant Algorithm: Performance Analysis and Application in Engineering Designs. Biomimetics, 8(2), 162. https://doi.org/10.3390/biomimetics8020162


