Abstract
This study presents an improved variant of the greater cane rat algorithm (GCRA), called adaptive and global-guided greater cane rat algorithm (AGG-GCRA), which aims to alleviate some key limitations of the original GCRA regarding convergence speed, solution precision, and stability. GCRA simulates the foraging behavior of the greater cane rat during both mating and non-mating seasons, demonstrating intelligent exploration capabilities. However, the original algorithm still faces challenges such as premature convergence and inadequate local exploitation when applied to complex optimization problems. To address these issues, this paper introduces four key improvements to the GCRA: (1) a global optimum guidance term to enhance the convergence directionality; (2) a flexible parameter adjustment system designed to maintain a dynamic balance between exploration and exploitation; (3) a mechanism for retaining top-quality solutions to ensure the preservation of optimal results.; and (4) a local perturbation mechanism to help escape local optima. To comprehensively evaluate the optimization performance of AGG-GCRA, 20 separate experiments were carried out across 26 standard benchmark functions and six real-world engineering optimization problems, with comparisons made against 11 advanced metaheuristic optimization methods. The findings indicate that AGG-GCRA surpasses the competing algorithms in aspects of convergence rate, solution precision, and robustness. In the stability analysis, AGG-GCRA consistently obtained the global optimal solution in multiple runs for five engineering cases, achieving an average rank of first place and a standard deviation close to zero, highlighting its exceptional global search capabilities and excellent repeatability. Statistical tests, including the Friedman ranking and Wilcoxon signed-rank tests, provide additional validation for the effectiveness and importance of the proposed algorithm. In conclusion, AGG-GCRA provides an efficient and stable intelligent optimization tool for solving various optimization problems.
1. Introduction
Recently, influenced by the collective behaviors observed in biological populations, swarm intelligence-driven metaheuristic optimization algorithms have shown remarkable adaptability and versatility in addressing intricate optimization challenges [1,2,3,4,5]. By simulating behaviors such as co-evolution [6], foraging strategies [7,8,9], or social interactions of biological populations [10,11,12], these algorithms can efficiently perform global searches and local development in complex search spaces, including high-dimensional [13,14,15,16], multimodal, and nonlinear ones [17,18,19,20,21,22]. The core principles of biomimetics—drawing on the self-organization, self-adaptation, and collaboration mechanisms of natural organisms—provide a rich theoretical foundation and practical guidance for the design of optimization algorithms [23]. This has led to their widespread application and in-depth research in fields such as engineering optimization, machine learning parameter tuning, structural design, and robotic control [24,25,26,27,28,29]. For example, the particle swarm optimization (PSO) algorithm is influenced by the collective foraging behaviors of bird and fish groups [30]; the ant colony optimization (ACO) algorithm relies on the pheromone-based navigation of ants [31]; the butterfly optimization algorithm (BOA) is inspired by butterflies’ innate foraging and mating patterns [32]; the whale optimization algorithm (WOA) emulates the bubble-net hunting technique of humpback whales [33]; and the goose optimization algorithm (GOOSE) mirrors the V-shaped formation and coordinated navigation seen during goose migration [34]. These algorithms, by simulating collective behaviors in animal populations, have enabled the efficient exploration and exploitation of complex search spaces, thereby advancing fields such as engineering optimization.
However, these bio-inspired algorithms often face challenges, including slow convergence rates, suboptimal solution accuracy, and limited stability, frequently resulting in premature convergence to local optima. To address these issues, various improvements have been proposed by researchers. For example, Cao et al. [35] developed a global-best guided phase based optimization (GPBO) algorithm, incorporating a global optimum guidance term to enhance convergence directionality in large-scale optimization problems. Yang et al. [36] introduced a spatial information sampling strategy for adaptive parameter control in meta-heuristic algorithms, dynamically adjusting parameters based on the spatial distribution of solutions. Wu et al. [37] enhanced PSO with an elite retention mechanism to improve convergence performance and avoid premature local optima in solving the flexible job shop scheduling problem. Öztaş and Tuş [38] developed a hybrid iterated local search algorithm that incorporates a local perturbation mechanism to explore diverse regions of the search space and improve solutions for the vehicle routing problem with simultaneous pickup and delivery.
The greater cane rat algorithm (GCRA), a recently introduced biologically inspired method, emulates the foraging behavior of the greater cane rat during both mating and non-mating periods, integrating global search and local development features [39]. In the GCRA framework, the greater cane rat’s behavior is modeled in two distinct phases: the non-mating foraging phase and the mating period. During the non-mating phase, the individuals forage independently while sharing indirect information about promising food sources, which, in the algorithm, corresponds to global exploration of the search space. In the mating phase, individuals tend to cluster and compete for mates, representing intensified local search around high-quality areas. These biological strategies are mathematically encoded in position-updating equations, where movement decisions are guided by both random exploration and attraction toward elite individuals, thus translating observed animal behaviors into optimization processes. However, despite its good performance in certain optimization problems, GCRA still faces challenges in high-dimensional, multimodal, and constrained optimization problems, including slow convergence, limited solution precision, and a tendency to become trapped in local optima, restricting its practical application and value.
In order to improve the performance of the GCRA, this paper proposes the adaptive and global-guided greater cane rat algorithm (AGG-GCRA). This algorithm integrates four key improvements into the original GCRA framework, systematically enhancing its convergence, accuracy, and stability. First, AGG-GCRA introduces a global guidance term that incorporates historical best solution information into the individual position update process [40], effectively improving the population’s convergence direction toward the optimal solution region and enhancing its global search ability. Second, an adaptive parameter adjustment mechanism is designed, enabling key parameters to dynamically change during the iteration process, thus balancing exploration and exploitation. Third, an elite retention mechanism periodically retains the current best individual to prevent the loss of high-quality solutions due to random operations, thereby improving the stability and repeatability of the results. Finally, a local perturbation mechanism is introduced to apply minor disturbances to some high-quality individuals [41], enhancing population diversity and assisting the algorithm in avoiding local optima, thereby improving global optimization effectiveness.
To comprehensively evaluate the optimization performance of AGG-GCRA, comprehensive comparative experiments were performed using 26 standard benchmark functions and six practical engineering optimization problems. The results were evaluated against 11 other leading metaheuristic algorithms, such as PSO, WOA, and GOOSE. The experimental results show that AGG-GCRA outperforms the comparison algorithms in terms of convergence speed, solution accuracy, and robustness, particularly in demonstrating lower standard deviations in engineering cases, reflecting its excellent stability and repeatability. Additionally, the statistical significance of the proposed algorithm’s advantages was confirmed using Friedman ranking [42,43] and Wilcoxon signed-rank tests [44,45].
In conclusion, AGG-GCRA addresses the shortcomings of the original GCRA, exhibiting robust global search, local exploitation, and stable convergence, thus establishing it as an effective and dependable optimization tool for a range of complex problems. The primary contributions of this paper are as follows:
- A new greater cane rat optimization algorithm (AGG-GCRA) is introduced, incorporating adaptive mechanisms and global guidance techniques to enhance the algorithm’s convergence rate, solution precision, and stability.
- A comprehensive comparison of AGG-GCRA with 11 mainstream metaheuristic algorithms on 26 benchmark functions shows that AGG-GCRA surpasses the other algorithms in terms of optimization precision, convergence efficiency, and robustness, with its significance confirmed through statistical tests.
- AGG-GCRA was applied to six practical engineering optimization problems, with the algorithm consistently producing high-quality solutions in multiple independent runs, demonstrating its practical value and reliability in engineering applications.
The structure of the paper is organized as follows: Section 2 introduces the basic principles and mechanisms of the original GCRA; Section 3 provides a detailed description of the proposed AGG-GCRA; Section 4 presents experimental comparisons and analyses of AGG-GCRA and 11 comparison algorithms on standard test functions and practical engineering optimization problems; Section 5 concludes the paper and outlines directions for future research.
2. Greater Cane Rat Algorithm
The GCRA is a novel metaheuristic optimization technique drawn from the foraging and social behaviors of the African greater cane rat (scientific name: Thryonomys swinderianus). This section elucidates the biological inspiration, mathematical model, and algorithm structure of the GCRA.
2.1. Biological Inspiration and Conceptual Model
The African greater cane rat, native to sub-Saharan Africa, has a distinct social structure and foraging behavior, which inspired the design of the GCRA. In its social system, a dominant male leads a group consisting of several females and juveniles. Greater cane rats forage at night, with the males memorizing paths to food and water sources and guiding the group members to them. During the mating season, males and females separate into groups and focus their activities around abundant food areas, thus enhancing foraging efficiency.
Figure 1 illustrates the natural habitat of the African greater cane rat. These rats are excellent swimmers, often using water to avoid danger, and are quick and agile on land. While primarily nocturnal, they may also be active during the day. They reside in a matriarchal society, governed by a dominant male, and typically nest in dense vegetation or occasionally in burrows vacated by other animals or termites. When threatened, they either produce a grunting sound or swiftly escape into the water for protection. The shaded region in the figure indicates the water source, with tall reeds growing nearby. The white regions and trails denote the routes to known food sources.
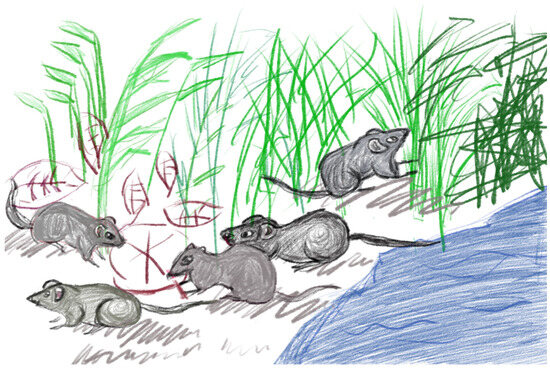
Figure 1.
Natural habitat of the greater cane rat.
These biological traits are transformed into the exploration, exploitation, and information-sharing mechanisms within the algorithm, which simulate the global and local search processes within the search space.
2.2. Population Initialization
The optimization process of the GCRA begins with the random generation of a cane rat population , which consists of individuals, each representing a candidate solution located at a specific position in a -dimensional search space. The population initialization formula is shown as Equation (1):
where the position of the -th individual in the -th dimension is determined by Equation (2):
where is a random number uniformly distributed, and and represent the upper and lower bounds of the -th dimension, respectively. This initialization guarantees that the population is evenly spread across the search space, which, in turn, enhances the algorithm’s diversity and exploration capacity.
Figure 2 presents the conceptual framework of the GCRA. Assuming the target food resource is located at coordinates , the path to this location is initially identified by the dominant male individual within the group, which then disseminates the corresponding path information to other members, enabling them to adjust their positions accordingly. Positioned at , the dominant individual possesses knowledge of the target location and explores several accessible neighboring positions, as guided by Equations (4) and (5). In subsequent iterations, the dominant individual located at the relative position continues to execute similar path update procedures. During the breeding season, information regarding food resource locations is shared across the group, prompting the population to segregate into male and female subsets. Each subset migrates toward food-rich regions and establishes provisional campsites in those areas.
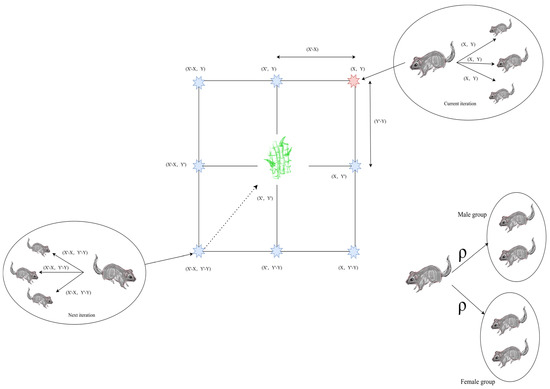
Figure 2.
2D possible position vectors.
2.3. Behavioral Modeling and Position Update
The GCRA alternates between two main phases based on the control parameter (representing the environmental shifts between the rainy and dry seasons): the exploration phase and the exploitation phase.
In the exploration phase (path construction period), cane rat individuals either explore unknown areas or follow the paths remembered by the dominant male. The fundamental position update rule is shown as Equation (3):
where denotes the position of the -th individual in the -th dimension, and is the position of another random individual in the same dimension. To enhance the update strategy, three additional coefficients are introduced as Equations (4)–(6):
where is the fitness value of individual , and are the current iteration and maximum iteration count, and and are random variables uniformly distributed in the range .
In the exploitation phase (mating season foraging period), males and females search independently, focusing on approaching the position of a randomly selected female to accelerate the local search. The position update formula is shown as Equation (7):
where represents the position of the randomly selected female individual, simulates the offspring count for each female rat, with possible values in the set , and is the weight parameter controlling the step size.
In addition, the original formulation of the GCRA also defines an alternative exploitation variant, expressed as Equation (8):
After generating a candidate position , the update is only accepted if the new position yields a better fitness; otherwise, the previous position is retained, as shown in Equation (9):
2.4. Dominant Male Selection and Fitness Evaluation
In the GCRA, the dominant male is the individual with the highest fitness in the current population, symbolizing the optimal solution. Other individuals modify their strategies accordingly. Other individuals adjust their strategies based on the position information of the dominant male, thereby optimizing their search direction. The dominant male is updated whenever a better solution emerges in the population, which can be formulated as Equation (10):
where denotes the index of the newly selected dominant male, represents the operation of finding the index that yields the minimum value of among all individuals, and refers to the fitness value of individual .
In each iteration, if a better solution is found, the dominant male is updated to ensure the algorithm progresses toward the global optimum. If no better solution is found, the position is updated or adjusted according to the current phase rules to avoid convergence to local optima.
The importance of the GCRA lies not merely in its novelty but in its unique balance between exploration and exploitation inspired by the greater cane rat’s real-world adaptive foraging strategies. Unlike many generic swarm-based metaheuristics, the GCRA integrates memory-based path following and seasonal behavior switching, which naturally encode both long-range search and localized intensification. These mechanisms address the frequent imbalance between global and local search observed in conventional metaheuristics. Furthermore, the separation of male and female subgroups during exploitation phases introduces a structured diversity preservation mechanism, reducing the risk of premature convergence and enhancing performance in complex multimodal optimization landscapes. This combination of behavioral realism and search efficiency underpins its relevance and value for both theoretical study and practical applications.
The algorithm flow of the GCRA is shown in Figure 3.
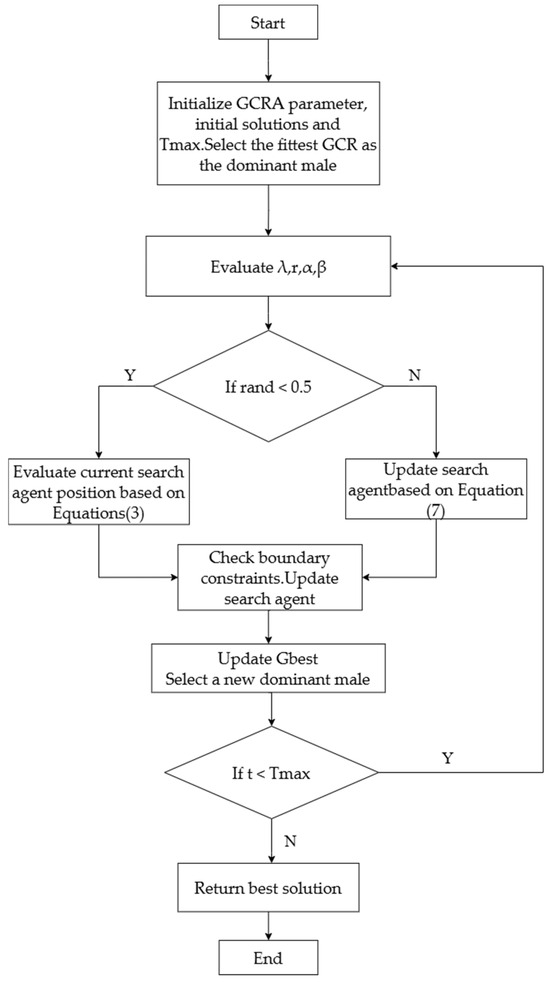
Figure 3.
Flowchart of the GCRA.
3. Adaptive and Global-Guided Greater Cane Rat Algorithm
To improve the global search capability, local exploitation ability, and convergence stability of the GCRA in addressing complex optimization challenges, this paper introduces an enhanced algorithm, AGG-GCRA, which integrates adaptive global guidance and elite mechanisms. By introducing a global optimum guidance term, an adaptive parameter adjustment strategy, an elite retention mechanism, and a local perturbation mechanism, the AGG-GCRA effectively addresses the issues in the GCRA, including the tendency to become trapped in local optima and slow convergence.
This section highlights the main enhancements of the AGG-GCRA and offers an in-depth description of the four fundamental mechanisms.
3.1. Global Optimum Guidance Term
To enhance the convergence precision and search efficiency of the GCRA, a global optimum guidance term is introduced by modifying the original position update formula (Equation (3)), adding a guidance component from the global best position . In each iteration, the individual position update is influenced not only by a randomly selected individual but also by the current global optimum solution , as shown in Equation (11):
where is the global guidance learning rate parameter, which dynamically adjusts the influence of the global best solution on individual position updates based on the iteration number and population state. This adjustment improves the convergence directionality while effectively preventing premature convergence. The dynamic mechanism helps maintain population diversity and avoids stagnation.
3.2. Adaptive Parameter Adjustment
In order to maintain a dynamic balance between exploration and exploitation, an adaptive parameter adjustment strategy is proposed. The adaptive factor is defined as Equation (12):
where is the initial balance factor, is the current iteration, is the maximum number of iterations, and is the relative ratio of the current best solution’s fitness fluctuation to the historical best.
Based on the value of , the algorithm dynamically decides the proportion of exploration and exploitation formulas to be used: when , exploration operations are prioritized; otherwise, exploitation operations are prioritized. This strategy enhances the algorithm’s search adaptability across different stages.
3.3. Elite Preservation Mechanism
To ensure that high-quality solutions in the population are not disrupted by random updates, an elite preservation mechanism is embedded as an additional position update step extending Equation (7). The top 20% of individuals are selected to form an elite set , and the average solution of these elite individuals is used to guide the position updates of regular individuals as Equation (13):
where the adaptive learning rate is defined as Equation (14):
The learning rate decreases linearly as the iterations progress, enabling the algorithm to gradually shift from exploration to exploitation. Moreover, using the average position of the elite subset rather than solely relying on the global best individual enhances the algorithm’s robustness by preventing overdependence on a single solution and better maintaining population diversity. This mechanism helps individuals converge toward high-quality regions, improving the accuracy of later-stage searches.
3.4. Local Perturbation Strategy
To enhance the algorithm’s capability to avoid becoming trapped in local optima, a local perturbation strategy is introduced. The updated position of an individual incorporates a perturbation term , expressed as Equation (15):
where follows a mixed distribution as Equation (16):
where represents a normal distribution perturbation, and represents a Lévy flight distribution. is the perturbation weight.
The Lévy flight component introduces a probability-driven mechanism for generating occasional long-distance jumps, which follows a heavy-tailed distribution. This allows the algorithm to escape from local optima by occasionally exploring far regions of the search space that are inaccessible to purely Gaussian perturbations. The combination of Gaussian perturbations for fine-tuning and Lévy flights for large-scale jumps strikes a balance between local exploitation and global exploration, ensuring that the search process remains diverse while improving the chances of finding better solutions. This combines Gaussian noise and Lévy flight for fine-tuned local search and occasional long jumps, acting as a stochastic refinement after the main update steps (modifying Equations (3) and (7)), which enhances the local search capability while maintaining global exploration.
3.5. Complexity Analysis
The AGG-GCRA consists mainly of two stages: population initialization and iterative updates. During initialization, the algorithm generates random initial positions for each search agent and dimension, resulting in a time complexity of . In the main loop, during each iteration, the algorithm updates the positions and evaluates the fitness of all agents across the dimensions. The total number of iterations is , and the overall time complexity is mainly determined by this part. Elite replacement and local perturbation operations are relatively small in comparison and can be ignored. Thus, the time complexity of the algorithm is shown as Equation (17):
where is the maximum number of iterations, is the population size, and is the dimensionality of the problem. If the objective function is computationally intensive, the time complexity will rise accordingly. More specifically, the position update stage involves vector operations with a computational cost of per agent, while the fitness evaluation stage typically incurs the highest cost at per agent, where denotes the time complexity of the objective function. Consequently, the full computational complexity can be expressed as . In cases where dominates, this term becomes the primary contributor to runtime, whereas, for simpler objective functions, the algorithm’s complexity is effectively linear in both the population size and problem dimension.
3.6. Summary of the AGG-GCRA
This section systematically presents the core improvement strategies of the AGG-GCRA, covering the four aspects of global optimum guidance, adaptive parameter adjustment, elite retention, and local perturbation. These strategies maintain a well-balanced approach between global exploration and local refinement throughout the search process. By dynamically regulating the transition between exploration and exploitation phases, the algorithm’s adaptability and robustness are improved. The elite set effectively prevents premature convergence, while the local perturbation mechanism improves population diversity, ensuring the algorithm’s capability to avoid local optima in complex search spaces. Overall, the AGG-GCRA achieves multi-level optimization over the original GCRA, accelerating convergence speed and improving the stability and accuracy of the final solution.
To facilitate understanding and practical implementation, Algorithm 1 provides a detailed pseudocode for the AGG-GCRA, clearly illustrating the execution logic of each key step. Additionally, the algorithm flowchart in Figure 4 offers a visual representation of the operational framework. The algorithm is well structured and scientifically designed, providing a solid foundation for performance verification and application in subsequent sections.
| Algorithm 1. AGG-GCRA |
| Input: Population size M, maximum iterations T_max, parameters α0, γ0, λ, σ12, β, θ1, θ2, ω Output: Optimal solution q_best 1. Initialize population positions qₘ (m = 1, 2, …, M) 2. Evaluate fitness f(qₘ) for each individual 3. Set q_best as the global best solution 4. For t = 1 to T_max do 4.1 Adaptive Parameter Adjustment — (Equation (12)) Compute σ(t) = α0 × (1 - t / T_max) × (1 − δ) (12) 4.2 For m = 1 to M do If σ(t) > 0.5 then // Exploration Phase Global Optimum Guidance Term — (Equation (11)) qₘ,ₖⁿᵉʷ = qₘ,ₖ + λ × (q_best,ₖ − qₘ,ₖ) (11) Else // Exploitation Phase Elite Preservation Mechanism — (Equation (13)–(14)) Find top 20% individuals → elite set E Compute elite mean position q̄_E Adaptive learning rate: γ = γ0 × (1 − t / T_max) (14) Update position: qₘ,ₖⁿᵉʷ = qₘ,ₖ + γ × (q̄_E,ₖ − qₘ,ₖ) (13) End If Local Perturbation Strategy—(Equation (15)–(16)) Generate perturbation: Δ = θ1 × N(0, σ12) + θ2 × Lévy(β) (16) Apply perturbation: qₘ,ₖⁿᵉʷ = qₘ,ₖⁿᵉʷ + ω × Δ (15) Evaluate fitness of qₘⁿᵉʷ and update qₘ if better End For Update elite set E and global best q_best End For Input: Population size M, maximum iterations T_max, parameters α0, γ0, λ, σ12, β, θ1, θ2, ω |
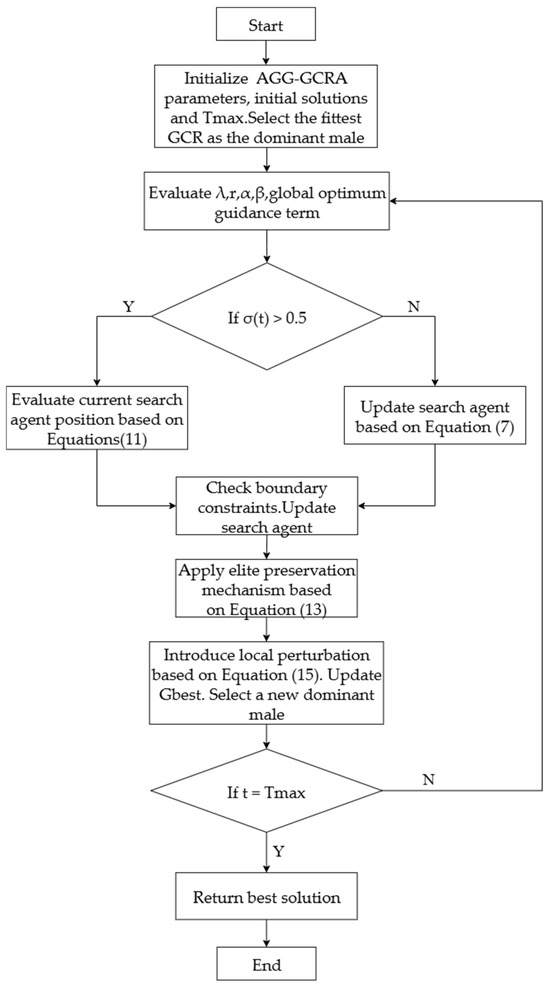
Figure 4.
Flowchart of the AGG-GCRA.
4. Results and Analytical Evaluation of the Experiment
To validate the performance and effectiveness of the proposed AGG-GCRA, this section performs a comparative analysis from two perspectives: standard benchmark functions and practical engineering problems. Specifically, it consists of (1) a comparison with 11 mainstream optimization algorithms on 26 classic benchmark functions, including the GCRA, BOA, WOA, GOOSE, AOA [46], PSO, DE [47], ACO, NSM-BO [48], PSOBOA [49], and FDB-AGSK [50]. The sources of the algorithms are provided in the Appendix A. The parameter configurations for each algorithm can be found in Table 1. For fairness, parameters commonly used across algorithms—such as maximum iterations, population size, and termination conditions—were set according to widely accepted values reported in previous studies, while algorithm-specific parameters were further refined through experimental tuning. This tuning process involved evaluating multiple parameter combinations on representative benchmark functions and selecting those that consistently produced high average performance. Such adjustment of literature-based values ensures that each algorithm performs reasonably and competitively. In Table 1, the term “Agents” denotes the population size, meaning the number of candidate solutions maintained by the algorithm at each iteration; (2) an application verification on six typical engineering optimization problems, followed by a performance analysis compared to the aforementioned algorithms.

Table 1.
Parameter settings of 12 algorithms.
Experimental setup: The proposed AGG-GCRA, along with other metaheuristic methods, was implemented in MATLAB 2023a. All tests were carried out on a Windows 10 platform with an Intel(R) Core(TM) i9-14900KF processor (3.10 GHz) and 32 GB of RAM.
4.1. Tests on 26 Benchmark Functions
To thoroughly assess the performance of the proposed AGG-GCRA, this paper selects 26 classic test functions as the benchmark set [51,52,53,54,55,56]. These test functions are widely used in metaheuristic optimization, because they effectively reflect the characteristics and difficulty of various optimization problems, making them a crucial tool for validating algorithm performance.
In accordance with the benchmarking guidelines outlined by Beiranvand et al. [57], and aligned with the principles emphasized by Piotrowski et al. [58,59], all experiments were conducted under uniform experimental settings to ensure fair and reproducible comparisons. Each algorithm was executed on all 26 benchmark functions with a fixed dimensionality of 30, a maximum of 500 iterations, and a population size of 30. To guarantee statistical reliability, each algorithm was independently run 30 times on each function. Key performance metrics—including the best, mean, and standard deviation of the obtained objective values, as well as computational time—were recorded. Furthermore, the convergence behavior of each algorithm across all test functions was documented. Statistical analyses, including Friedman ranking scores and Wilcoxon signed-rank tests, were performed to rigorously assess and compare the relative performance of the algorithms. These procedures collectively ensure that the experimental evaluation is thorough, systematic, and consistent with established best practices in the literature.
To ensure that the performance evaluation of the proposed algorithm is both comprehensive and representative, this study follows the problem landscape characteristic coverage principle in selecting the benchmark test functions. Specifically, the test set is designed to cover various typical characteristics of optimization problems, thereby enabling a thorough assessment of the algorithm’s capabilities under different difficulty levels and structural conditions. The selected functions fall into the following categories:
- Unimodal Functions—These functions have a single global optimum and are primarily used to evaluate the convergence speed and local exploitation ability of the algorithm.Examples from the selected set: F1 (Sphere), F2 (Schwefel 2.22), F3 (Schwefel 1.2), F4 (Schwefel 2.21), F5 (Step), F6 (Quartic), F7 (Exponential), F8 (Sum Power), F9 (Sum Square), F10 (Rosenbrock), F11 (Zakharov), F12 (Trid), F13 (Elliptic), and F14 (Cigar).
- Multimodal Functions—These functions have multiple local optima, allowing for the assessment of the algorithm’s global search capability and its ability to escape from local optima.Examples from the selected set: F15 (Rastrigin), F16 (NCRastrigin), F17 (Ackley), F18 (Griewank), F19 (Alpine), F20 (Penalized 1), F21 (Penalized 2), F23 (Lévy), F24 (Weierstrass), F25 (Solomon), and F26 (Bohachevsky).
- Separable and Non-separable Functions—These functions are used to test the algorithm’s adaptability in handling problems with either independent variables or strong inter-variable coupling.Examples from the selected set:
- ·
- Separable: F1, F2, F3, F5, F8, F9, and F16.
- ·
- Non-separable: F10, F12, F17, F18, F20, F23, and F24.
- Ill-conditioned and Anisotropic Functions—These functions exhibit large variations in gradient magnitude across different search directions, testing the algorithm’s stability in highly non-uniform search spaces.Examples from the selected set: F10 (Rosenbrock), F13 (Elliptic), and F14 (Cigar).
- Non-differentiable/Discontinuous Functions—These functions are used to evaluate the robustness of the algorithm under conditions where gradient information is unavailable or the function is non-smooth.Examples from the selected set: F5 (Step) and F16 (NCRastrigin).
- Scalable Functions—These functions allow the dimensionality to be adjusted, enabling the analysis of the algorithm’s computational efficiency and performance trends in high-dimensional spaces.
- Examples from the selected set: F1, F2, F3, F4, F7, F8, F9, F10, F11, F12, F13, F15, F16, F17, F18, F20, and F24.
By adopting such a balanced and diverse test set design, the proposed algorithm can be thoroughly evaluated across a variety of search scenarios. This ensures a comprehensive examination of its global search capability, local exploitation ability, convergence speed, and stability, thereby enhancing the generality and persuasiveness of the conclusions.
The selection of these 26 test functions enables a comprehensive and systematic validation of the proposed algorithm’s adaptability and superiority across various types of optimization problems. The detailed information about the test functions can be found in Table 2.

Table 2.
Details of the 26 test functions.
4.1.1. Performance Indicators
To thoroughly assess the performance of the proposed algorithm, 30 independent repetitions of experiments were conducted for the AGG-GCRA and 11 comparison algorithms. The results were analyzed using three metrics: best, mean, and standard deviation (Std). The best value represents the optimal solution achieved across multiple runs, the mean value reflects the overall search performance, and the standard deviation measures the stability of the results. These three metrics enable a thorough evaluation of the algorithm’s convergence accuracy, stability, and global search capacity.
The formulas for calculating the best value, mean, and standard deviation are given in Equations (18)–(20), respectively:
where represents the fitness score obtained from the -th independent run, and is the total number of runs, which is 30 in this case.
4.1.2. Numerical Results Analysis
In this study, we conducted a comprehensive evaluation of the proposed AGG-GCRA and 11 comparison algorithms on 26 benchmark functions. Each test was assessed based on five performance metrics: best fitness, average fitness, standard deviation, average computational time, and average ranking based on average fitness. The experimental results are shown in Table 3. Additionally, we included two benchmark algorithms for comparison: Latin Hypercube Sampling combined with parallel local search (LHS-PLS), which generates uniformly distributed initial samples and performs independent local searches from each to enhance global coverage, and pattern search, a classical derivative-free method that explores the neighborhood of the current point along predefined directions and adapts the step size to converge to local optima. Both are typical standard methods for derivative-free optimization. Given that double-precision floating-point calculations typically provide about 16 significant digits of precision, and due to rounding errors, differences below 1 × 10⁻⁸ are considered insignificant in the analysis. Therefore, all values below this threshold were rounded to zero before analysis.

Table 3.
The best fitness, average fitness, standard deviation, average computational time, and average ranking based on average fitness for the 14 algorithms across the 26 test functions.
The numerical results indicate that the AGG-GCRA demonstrates superior optimization performance on most test functions. Specifically, it achieved the best fitness value on 25 out of the 26 benchmark functions, ranking first among all 14 comparison algorithms. The only exception was function F13, where it ranked 12th. The average ranking across all benchmark functions was 1.42, with an overall ranking of first. This suggests that the algorithm exhibits strong and stable performance across a variety of optimization problems.
Furthermore, the standard deviation results confirm the algorithm’s excellent stability: For many functions, the standard deviation was zero, indicating that the AGG-GCRA consistently converged to the same optimal value across all 30 independent runs. The computational time remained within a reasonable range for all test functions, highlighting the practicality of the AGG-GCRA in optimization scenarios.
4.1.3. Convergence Curve Analysis
To further assess the effectiveness of the proposed AGG-GCRA on standard test functions, this paper examines its convergence curves across 26 test functions in comparison with 11 other algorithms. The experimental results show that the AGG-GCRA is able to approach the optimal solution in fewer iterations on 23 of the test functions (F1–F6, F8–F12, F14, and F16–F26) and demonstrates outstanding stability, showing faster convergence and higher accuracy. This result clearly demonstrates that the AGG-GCRA has a significant advantage in balancing global search and local exploitation capabilities, effectively avoiding local optima and enhancing both optimization efficiency and solution accuracy. The relevant convergence curves are shown in Figure 5.
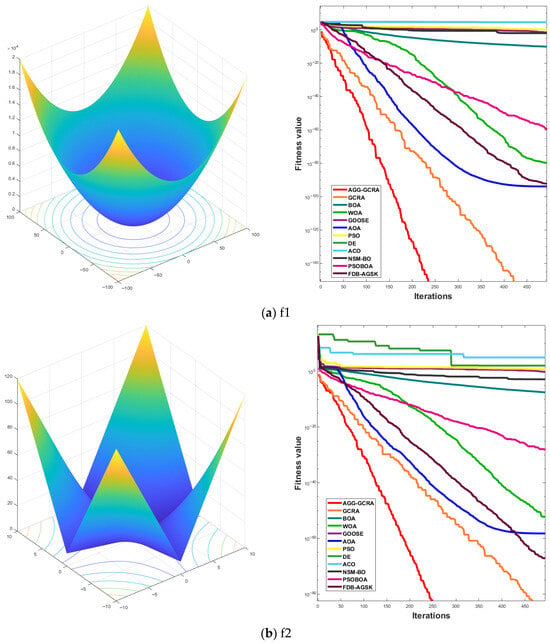
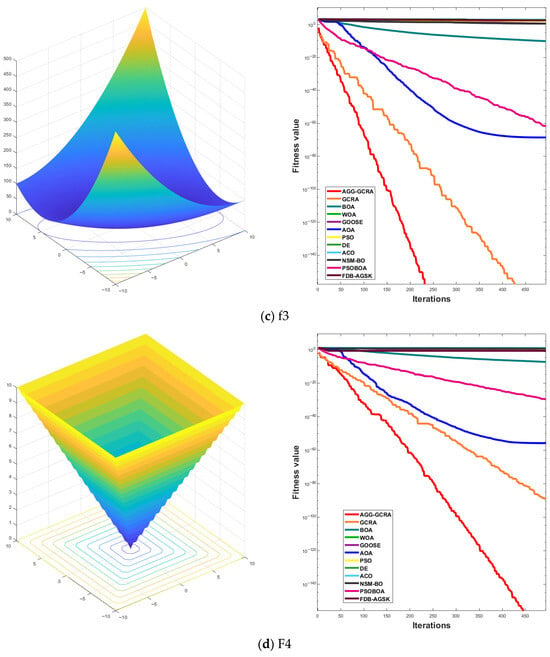
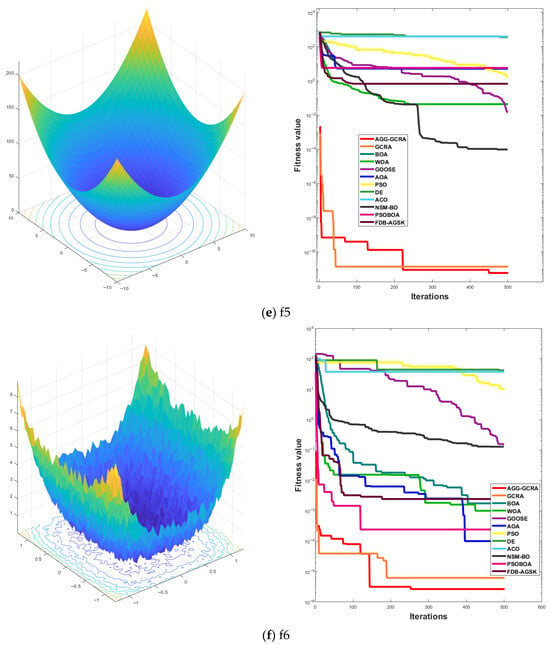
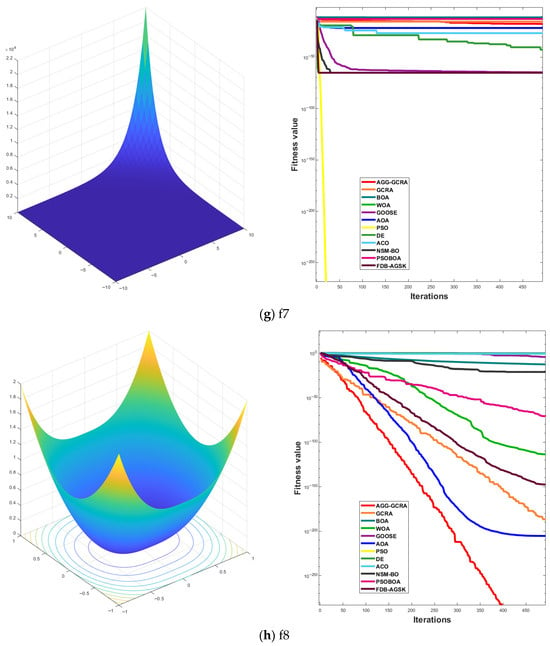
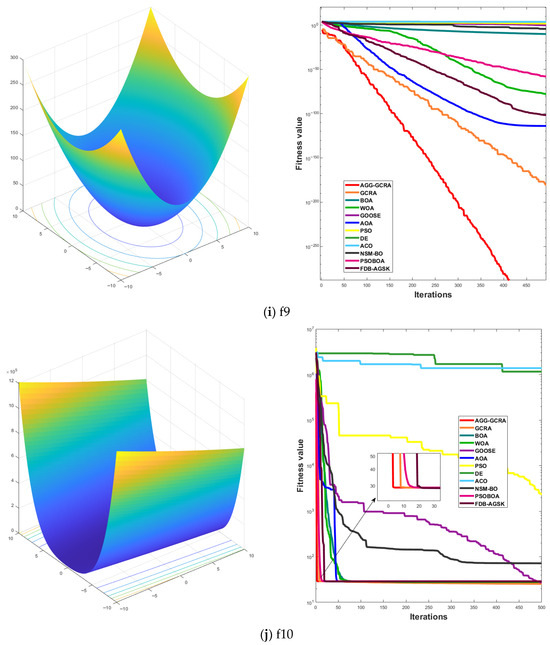
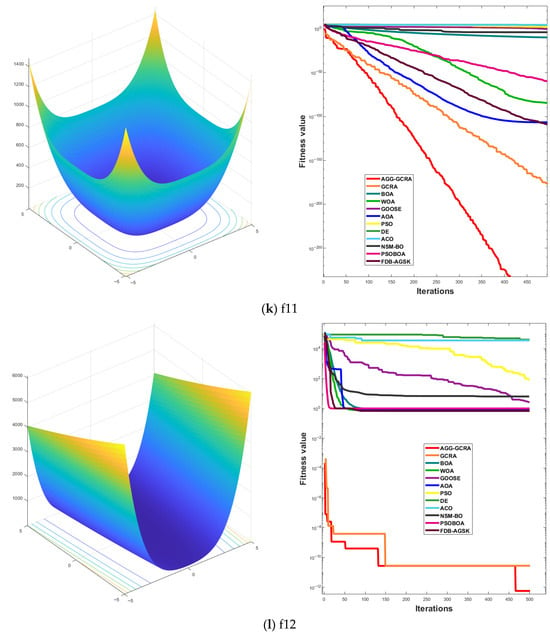
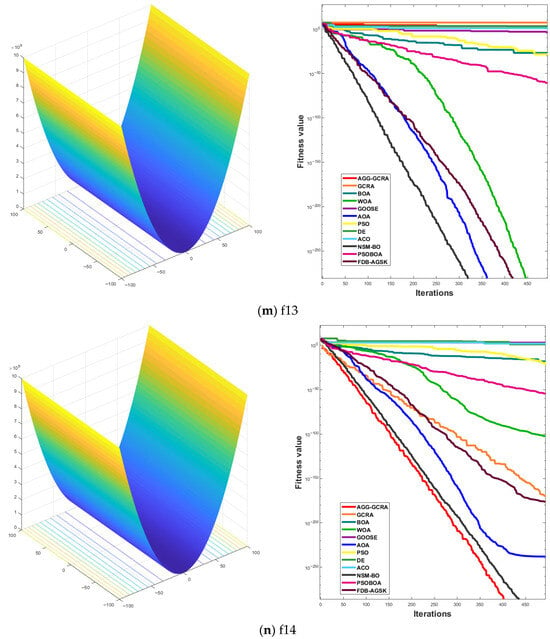
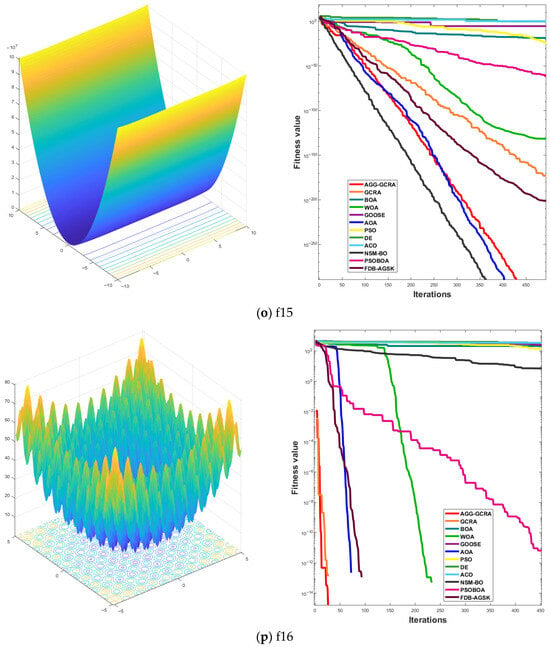
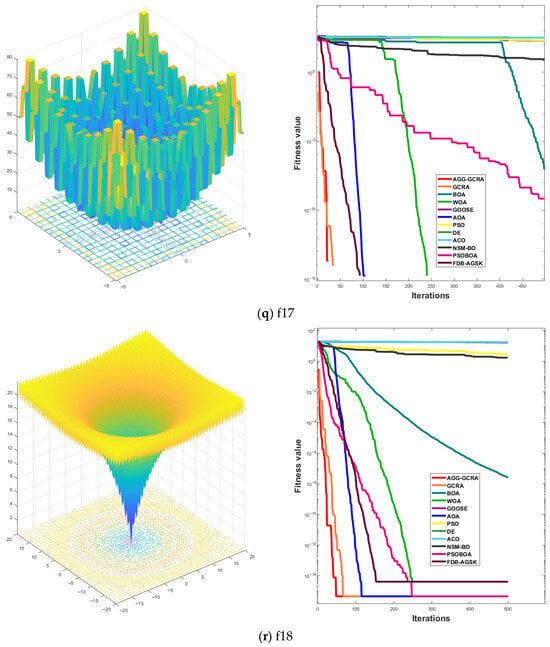
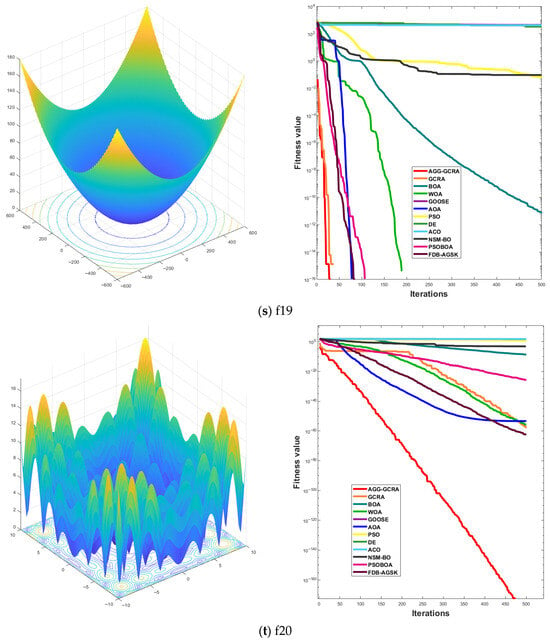
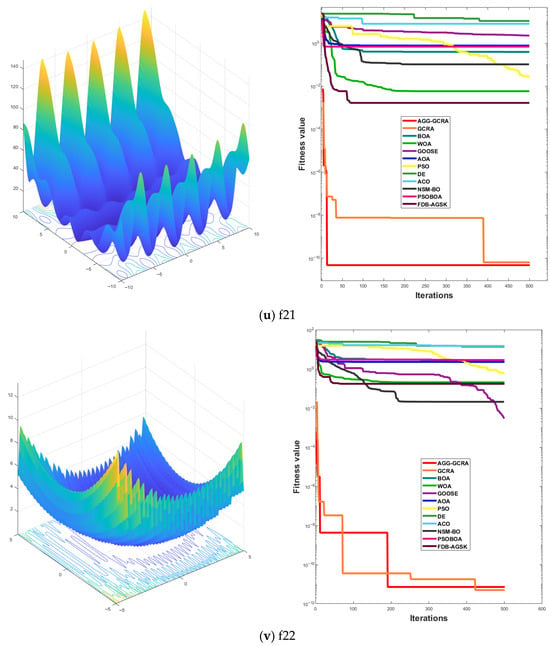
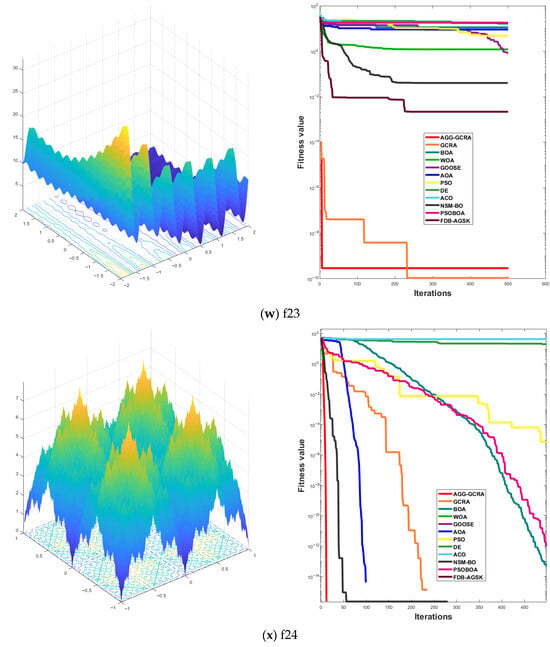
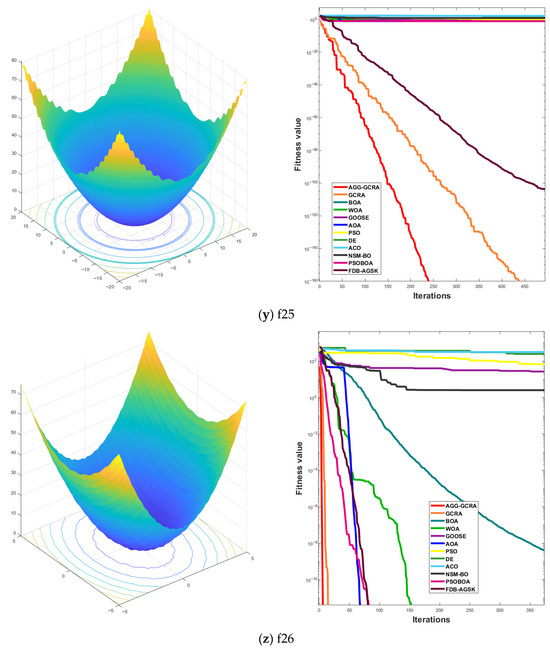
Figure 5.
Convergence curves of 12 algorithms across 26 test functions.
4.1.4. Friedman Ranking Scores and Wilcoxon Signed-Rank Analysis Results
Based on the results from 26 benchmark test functions, Table 4 presents the Friedman ranking scores and corresponding rankings for the proposed AGG-GCRA; 11 competing algorithms (GCRA, BOA, WOA, GOOSE, AOA, PSO, DE, ACO, NSM-BO, PSOBOA, and FDB-AGSK); and 2 baseline algorithms (LHS combined with parallel local search and Patternsearch).

Table 4.
Friedman ranking scores of 14 algorithms.
The AGG-GCRA achieves the lowest Friedman score of 1.7308, ranking first among all 14 algorithms, which demonstrates its superior overall optimization performance. The next best performers are the GCRA (3.3077) and FDB-AGSK (4.9231), indicating that the improvements in the AGG-GCRA provide a noticeable performance gain over its base version. In contrast, the ACO algorithm records the highest score (13.0769) and ranks last, reflecting its relatively weaker performance on the test set. Algorithms such as the BOA, PSO, and GOOSE are positioned in the middle-to-lower ranking range and do not outperform the top-ranked methods. Overall, the Friedman ranking analysis confirms that the AGG-GCRA consistently delivers better performance and stability compared to all other tested algorithms.
At a significance level of α = 0.05, the Wilcoxon signed-rank test was performed to evaluate pairwise performance differences between the AGG-GCRA and each of the other 13 algorithms across the 26 functions. As shown in Table 5, all p-values are less than 0.05, indicating statistically significant performance differences in every comparison. Notably, the AGG-GCRA achieves extremely small p-values against DE (9.3386 × 10⁻⁶), ACO (9.3386 × 10⁻⁶), PSO (7.0443 × 10⁻⁵), BOA (9.6755 × 10⁻⁵), and GOOSE (7.0443 × 10⁻⁵), highlighting its substantial advantage. Even in comparisons with strong competitors such as the GCRA (1.3183 × 10⁻⁴) and FDB-AGSK (2.3556 × 10⁻³), the AGG-GCRA still shows a statistically significant improvement.

Table 5.
Wilcoxon signed-rank test results for the AGG-GCRA compared to the other 13 algorithms.
These results, validated by both the Friedman ranking and the Wilcoxon signed-rank test, demonstrate that the AGG-GCRA not only outperforms twelve state-of-the-art algorithms but also surpasses the two baseline optimization strategies in terms of convergence stability, search capability, and robustness.
4.2. Application on Six Practical Engineering Problems
To verify the effectiveness of the proposed AGG-GCRA in real-world engineering optimization problems, this paper selects four classic engineering design problems as benchmark test cases and compares the results with 11 mainstream metaheuristic algorithms. All comparison algorithms are executed under identical experimental conditions, with a maximum of 500 iterations and a population size of 30. To ensure the reliability and statistical significance of the results, each set of experiments is independently repeated 20 times.
To comprehensively evaluate the performance of each algorithm on engineering optimization problems, this paper employs several evaluation metrics, including the best value, mean value, standard deviation, median, and average computational time (ACT). The best value represents the minimum objective function value obtained from 20 independent runs, reflecting the algorithm’s maximum optimization capability in a single run. The mean value is calculated by averaging the objective function values across 20 experiments, reflecting the algorithm’s overall performance. The standard deviation measures the fluctuation range of the 20 results, reflecting the stability and robustness of the algorithm. The median is the middle value of the 20 results, further revealing the distribution characteristics and minimizing the impact of outliers. ACT indicate the average time (in seconds) the algorithm takes to finish each optimization task over several runs, serving as a measure of its computational efficiency.
4.2.1. Weight Minimization of a Speed Reducer
Figure 6 illustrates the schematic diagram of the weight minimization of a speed reducer problem [60]. This problem focuses on minimizing the weight of the speed reducer structure while satisfying engineering constraints related to gear meshing, bearing strength, bending stress, and dimensions. It involves complex nonlinear relationships and multiple constraints, making it a classic example of mechanical structural optimization, ideal for evaluating the performance of optimization algorithms when applied to real-world engineering problems.
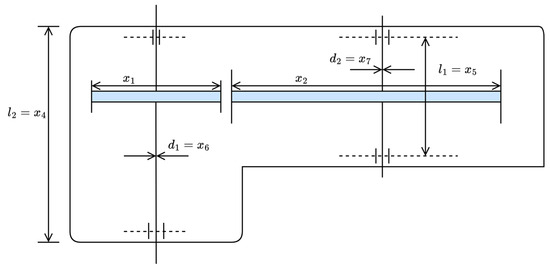
Figure 6.
Schematic diagram of weight minimization of a speed reducer problem.
The problem involves optimizing seven parameters: shaft 1 diameter , shaft 2 diameter , shaft 1 length between bearings , shaft 2 length between bearings , number of pinion teeth , teeth module , and face width . The formula for calculating the minimum weight is shown in Equation (21):
where , , , , , and , subject to:
In this problem, we present the optimal values and corresponding parameter configurations obtained by each algorithm during the runs (Table 6), along with statistical metrics such as best value, mean value, median, and standard deviation (Table 7). The algorithms are ranked based on the mean value. Based on the experimental results, it is clear that the AGG-GCRA achieved the optimal value of 2994.2343 and the ACTs remain reasonable. Overall, the AGG-GCRA significantly outperforms most of the comparison algorithms.

Table 6.
Optimal values, corresponding design variables, and ACTs of 12 algorithms on the weight minimization of a speed reducer problem.

Table 7.
Optimal values, mean, median, standard deviation, and ranking of 12 algorithms on the weight minimization of a speed reducer problem.
4.2.2. Tension/Compression Spring Design Problem
Figure 7 illustrates the schematic diagram of the tension/compression spring design problem [61]. The objective of this problem is to minimize the spring weight while meeting constraints related to shear stress, deflection, natural frequency, and geometric dimensions. With its solid engineering background and clear constraint system, this problem is widely used to evaluate the adaptability and convergence performance of optimization algorithms in structural optimization.
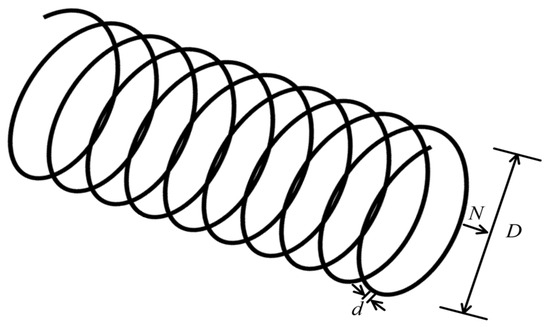
Figure 7.
Schematic diagram of the spring design problem.
The design problem includes three parameters to be optimized: the wire diameter (), the mean coil diameter (), and the number of active coils (). The formula for calculating the minimum weight is shown in Equation (22):
where , , and , subject to:
In this problem, we present the optimal values and corresponding parameter configurations obtained by each algorithm during the runs (Table 8), along with statistical metrics such as best value, mean value, median, and standard deviation (Table 9). The algorithms are ranked based on their mean values. Based on the experimental results, it is clear that the AGG-GCRA achieved the optimal value of 0.0127, with a success rate of 100% across 20 independent runs, and the ACTs remain reasonable. Moreover, its mean value ranks first, indicating the algorithm’s excellent optimization ability and stability. Overall, the AGG-GCRA significantly outperforms most of the comparison algorithms.

Table 8.
Optimal values, corresponding design variables, and ACTs of 12 algorithms on the spring design problem.

Table 9.
Optimal values, mean, median, standard deviation, and ranking of 12 algorithms on the spring design problem.
4.2.3. Welded Beam Design Problem
Figure 8 illustrates the schematic diagram of the welded beam design problem [62]. The goal is to minimize the manufacturing cost of the welded beam structure while considering engineering constraints related to strength, deflection, and stability. This problem involves balancing material costs and mechanical performance, with nonlinear and multi-constraint characteristics, making it ideal for evaluating the ability of optimization algorithms to handle multi-objective trade-offs and constraint management.
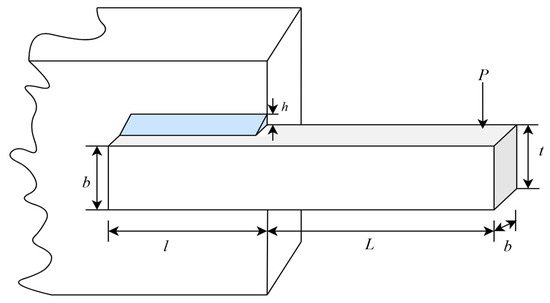
Figure 8.
Schematic diagram of the welded beam design problem.
The welded beam design problem involves four design parameters: weld thickness (), welding rod length (), rod height (), and rod thickness (). The formula for minimizing manufacturing costs is shown in Equation (23):
where , , , and , subject to:
where
In this problem, we present the optimal values and corresponding parameter configurations obtained by each algorithm during the runs (Table 10), along with statistical metrics such as best value, mean value, median, and standard deviation (Table 11). The algorithms are ranked according to their mean value. Based on the experimental results, it is clear that the AGG-GCRA achieved the optimal value of 1.6702, with a success rate of 90% across 20 independent runs, and the ACTs remain reasonable. Moreover, its mean value ranks first, indicating the algorithm’s excellent optimization ability and stability. Overall, the AGG-GCRA significantly outperforms most of the comparison algorithms.

Table 10.
Optimal values, corresponding design variables, and ACTs of 12 algorithms on the welded beam design problem.

Table 11.
Optimal values, mean, median, standard deviation, and ranking of 12 algorithms on the welded beam design problem.
4.2.4. Gas Transmission Compressor Design (GTCD) Problem
Figure 9 illustrates the schematic diagram of the GTCD problem [63]. This problem focuses on minimizing the cost of the natural gas compressor system, with constraints related to fluid dynamics principles and engineering safety requirements. This problem demonstrates notable nonlinear characteristics and practical engineering significance, making it a standard test case for assessing the performance of optimization algorithms in the design of energy and process systems.
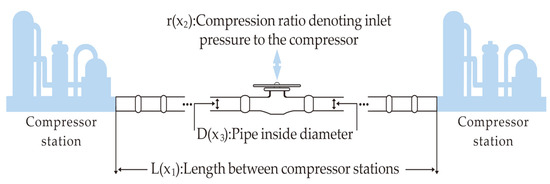
Figure 9.
Schematic diagram of the GTCD problem.
In this problem, the objective is to determine the optimal values of three parameters, , , and to minimize the value of C1. Specifically, represents the distance between two compressor stations; denotes the compression ratio at the compressor inlet, calculated as P1 divided by P2, where P1 is the outlet pressure and P2 is the inlet pressure (both measured in psi); and refers to the pipeline’s internal diameter (in inches). The formula for calculating the minimum weight is shown in Equation (24):
where , , and , subject to:
In this problem, we report the optimal values and corresponding parameter configurations achieved by each algorithm during the runs (Table 12), as well as statistical metrics such as best value, mean value, median, and standard deviation (Table 13). The algorithms are ranked based on the mean value. From the experimental results, it is evident that the AGG-GCRA achieved the optimal value of 1,677,759.276 and the ACTs remain reasonable. Moreover, its mean value ranks first, with a standard deviation of 0, indicating the algorithm’s excellent optimization ability and stability. Overall, the AGG-GCRA significantly outperforms most of the comparison algorithms.

Table 12.
Optimal values, corresponding design variables, and ACTs of 12 algorithms on the GTCD problem.

Table 13.
Optimal values, mean, median, standard deviation, and ranking of 12 algorithms on the GTCD problem.
4.2.5. Three-Bar Truss Design Problem
Figure 10 illustrates the schematic diagram of the three-bar truss design problem [64]. The goal is to minimize the total mass of the truss, with design variables generally consisting of the cross-sectional area or dimensions of each bar. These parameters must be properly adjusted within the stress and geometric constraints to optimize the structure. Although the problem is of modest size, its clear structure and well-defined constraints make it an ideal standard test case for evaluating and comparing the basic performance of optimization algorithms.
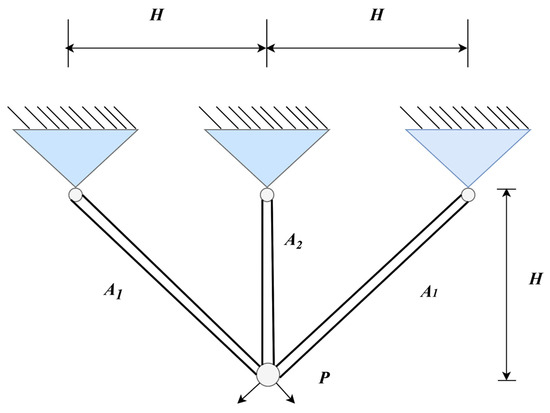
Figure 10.
Schematic diagram of the three-bar truss design.
The formula for calculating the minimum weight is shown in Equation (25):
where , :
where .
In this problem, we report the optimal values and corresponding parameter configurations achieved by each algorithm during the runs (Table 14), as well as statistical metrics such as best value, mean value, median, and standard deviation (Table 15). The algorithms are ranked based on the mean value. From the experimental results, it is evident that the AGG-GCRA achieved the optimal value of 263.8523 and the ACTs remain reasonable. Moreover, its mean value ranks first, with a standard deviation of 0, indicating the algorithm’s excellent optimization ability and stability. Overall, the AGG-GCRA significantly outperforms most of the comparison algorithms.

Table 14.
Optimal values, corresponding design variables, and ACTs of 12 algorithms on the three-bar truss design problem.

Table 15.
Optimal values, mean, median, standard deviation, and ranking of 12 algorithms on the three-bar truss design problem.
4.2.6. Multiple-Disk Clutch Brake Design Problem
Figure 11 presents the schematic diagram of the multiple-disk clutch brake design problem [65]. The objective of this problem is to reduce the weight of the clutch/brake system while adhering to constraints such as friction torque, contact pressure, and rotational speed limits. The problem features a practical engineering context and a complex system of physical constraints, making it an important reference case for evaluating the performance of optimization algorithms in high-complexity, multi-constraint environments.
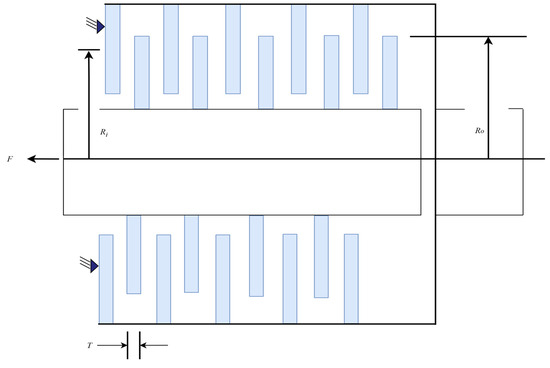
Figure 11.
Schematic diagram of the multiple-disk clutch brake design problem.
In this problem, five parameters are considered as decision variables: the number of friction surfaces and the driving force , as well as three dimensional parameters—the disk thickness , outer radius , and inner radius —all measured in millimeters. The formula for calculating the minimum weight is shown in Equation (26):
where , , , , , subject to:
where:
In this problem, we report the optimal values and corresponding parameter configurations achieved by each algorithm during the runs (Table 16), as well as statistical metrics such as best value, mean value, median, and standard deviation (Table 17). The algorithms are ranked based on the mean value. From the experimental results, it is evident that the AGG-GCRA achieved the optimal value of 0.2352 and the ACTs remain reasonable. Moreover, its mean value ranks first, with a standard deviation of 0, indicating the algorithm’s excellent optimization ability and stability. Overall, the AGG-GCRA significantly outperforms most of the comparison algorithms.

Table 16.
Optimal values, corresponding design variables, and ACTs of 12 algorithms on the multiple-disk clutch brake design problem.

Table 17.
Optimal values, mean, median, standard deviation, and ranking of 12 algorithms on the multiple-disk clutch brake design problem.
5. Discussion
The superiority of the proposed AGG-GCRA stems from several critical improvements. The introduction of a global optimum guidance term effectively steers search agents toward promising areas, reducing the risk of premature convergence. Meanwhile, adaptive parameter adjustment dynamically balances exploration and exploitation, enhancing both search efficiency and convergence speed. Moreover, the elite preservation mechanism retains high-quality solutions throughout the iterations, improving robustness. Coupled with a local perturbation strategy that blends Gaussian noise and Lévy flights, the algorithm maintains population diversity and performs both fine local searches and occasional large jumps to escape local optima, which boosts performance on complex multimodal problems.
From simulation results, the animal-inspired strategies in the GCRA and AGG-GCRA reveal valuable insights from real-world behavior. The greater cane rat’s alternating foraging strategy naturally balances exploration and exploitation. Our experiments show that mimicking this adaptive switching improves escaping local optima and convergence to global solutions. This dual-phase behavior, common in various species, may be evolutionarily advantageous for resource acquisition in uncertain environments, and their computational analogs are effective for optimization.
Compared to popular algorithms like PSO, WOA, and the original GCRA, the AGG-GCRA achieves better solution quality, stability, and consistency. The biological inspiration from the cane rat’s strategy offers a novel framework to switch intelligently between search phases, resulting in superior adaptive behavior. The key novelty lies in integrating adaptive global guidance, elite retention, and local perturbation, balancing exploration and exploitation to tackle a broad spectrum of challenging optimization problems.
6. Conclusions
This paper presents the AGG-GCRA that improves upon the original GCRA in convergence speed, solution accuracy, and stability by incorporating global optimum guidance, adaptive parameter tuning, elite preservation, and local perturbations. Extensive tests on 26 benchmark functions and six engineering problems show that the AGG-GCRA outperforms most competitors across multiple metrics, demonstrating excellent convergence and robustness.
Notably, the AGG-GCRA achieved zero standard deviation and top ranking in mean values, validating its strong global optimization ability and reproducibility. Furthermore, the AGG-GCRA maintains reasonable computational time, showing promise for practical applications. Overall, the AGG-GCRA is an efficient, stable, and broadly applicable intelligent optimization tool. However, the algorithm’s added mechanisms increase computational overhead, especially for high-dimensional or costly functions. The adaptive parameter tuning adds complexity to configurations, requiring experience or trial runs. Despite improved local perturbation, premature convergence may still occur in very complex landscapes. Also, the current design targets single-objective static problems and lacks extensions to dynamic or multi-objective cases, limiting applicability in some scenarios.
In summary, the AGG-GCRA strikes a balance between enhanced optimization and computational cost, and users should weigh solution quality against resource constraints. Future work will focus on extending the AGG-GCRA to multi-objective and dynamic optimization problems; exploring large-scale and real-world engineering applications; and integrating recent advances in deep learning and meta-learning to further enhance its performance, adaptability, and broader applicability.
Author Contributions
Conceptualization, Y.C. and F.Z.; methodology, Z.T. and K.Z.; software, Y.C. and K.Z.; validation, Z.T. and Y.C.; formal analysis, Z.T.; investigation, Y.C. and K.Z.; data curation, Z.T.; writing—original draft preparation, Y.C.; writing—review and editing, A.Z. and F.Z.; supervision, F.Z. and A.Z.; project administration, F.Z. and A.Z. All authors have read and agreed to the published version of the manuscript.
Funding
This work is supported by the subject of Human Resources and Social Security in Hebei Province JRSHZ-2025-01126.
Institutional Review Board Statement
Not applicable.
Informed Consent Statement
Not applicable.
Data Availability Statement
All data used and/or analyzed during this research are openly available and can be accessed freely. If needed, they can be requested from the corresponding author.
Acknowledgments
We sincerely thank the anonymous reviewers for their very comprehensive and constructive comments.
Conflicts of Interest
The authors declare that they have no known competing financial interests or personal relationships that could have appeared to influence the work reported in this paper.
Appendix A
Source and Implementation of the Compared Algorithms
References
- Rajwar, K.; Deep, K.; Das, S. An exhaustive review of the metaheuristic algorithms for search and optimization: Taxonomy, applications, and open challenges. Artif. Intell. Rev. 2023, 56, 13187–13257. [Google Scholar] [CrossRef]
- Ikram, R.M.A.; Dehrashid, A.A.; Zhang, B.; Chen, Z.; Le, B.N.; Moayedi, H. A novel swarm intelligence: Cuckoo optimization algorithm (COA) and SailFish optimizer (SFO) in landslide susceptibility assessment. Stoch. Environ. Res. Risk Assess. 2023, 37, 1717–1743. [Google Scholar] [CrossRef]
- Jia, H.; Rao, H.; Wen, C.; Mirjalili, S. Crayfish optimization algorithm. Artif. Intell. Rev. 2023, 56 (Suppl. S2), 1919–1979. [Google Scholar] [CrossRef]
- Jia, H.; Peng, X.; Lang, C. Remora optimization algorithm. Expert Syst. Appl. 2021, 185, 115665. [Google Scholar] [CrossRef]
- Jia, H.; Sun, K.; Zhang, W.; Leng, X. An enhanced chimp optimization algorithm for continuous optimization domains. Complex Intell. Syst. 2022, 8, 65–82. [Google Scholar] [CrossRef]
- Li, H.; Wang, D.; Zhou, M.C.; Fan, Y.; Xia, Y. Multi-swarm co-evolution based hybrid intelligent optimization for bi-objective multi-workflow scheduling in the cloud. IEEE Trans. Parallel Distrib. Syst. 2021, 33, 2183–2197. [Google Scholar] [CrossRef]
- Shen, B.; Khishe, M.; Mirjalili, S. Evolving Marine Predators Algorithm by dynamic foraging strategy for real-world engineering optimization problems. Eng. Appl. Artif. Intell. 2023, 123, 106207. [Google Scholar] [CrossRef]
- Tao, S.; Liu, S.; Zhou, H.; Mao, X. Research on inventory sustainable development strategy for maximizing cost-effectiveness in supply chain. Sustainability 2024, 16, 4442. [Google Scholar] [CrossRef]
- Hao, H.; Yao, E.; Pan, L.; Chen, R.; Wang, Y.; Xiao, H. Exploring heterogeneous drivers and barriers in MaaS bundle subscriptions based on the willingness to shift to MaaS in one-trip scenarios. Transp. Res. Part A Policy Pract. 2025, 199, 104525. [Google Scholar] [CrossRef]
- Trojovský, P.; Dehghani, M. A new bio-inspired metaheuristic algorithm for solving optimization problems based on walruses behavior. Sci. Rep. 2023, 13, 8775. [Google Scholar] [CrossRef] [PubMed]
- Liu, S.; Jin, Z.; Lin, H.; Lu, H. An improve crested porcupine algorithm for UAV delivery path planning in challenging environments. Sci. Rep. 2024, 14, 20445. [Google Scholar] [CrossRef]
- Mei, M.; Zhang, S.; Ye, Z.; Wang, M.; Zhou, W.; Yang, J.; Zhang, J.; Yan, L.; Shen, J. A cooperative hybrid breeding swarm intelligence algorithm for feature selection. Pattern Recognit. 2026, 169, 111901. [Google Scholar] [CrossRef]
- Wang, Z.; Feng, P.; Lin, Y.; Cai, S.; Bian, Z.; Yan, J.; Zhu, X. Crowdvlm-r1: Expanding r1 ability to vision language model for crowd counting using fuzzy group relative policy reward. arXiv 2025, arXiv:2504.03724. [Google Scholar]
- Zhou, Y.; Xia, H.; Yu, D.; Cheng, J.; Li, J. Outlier detection method based on high-density iteration. Inf. Sci. 2024, 662, 120286. [Google Scholar] [CrossRef]
- Lu, W.; Wang, J.; Wang, T.; Zhang, K.; Jiang, X.; Zhao, H. Visual style prompt learning using diffusion models for blind face restoration. Pattern Recognit. 2025, 161, 111312. [Google Scholar] [CrossRef]
- Feng, P.; Peng, X. A note on Monge–Kantorovich problem. Stat. Probab. Lett. 2014, 84, 204–211. [Google Scholar] [CrossRef]
- Cai, H.; Wu, W.; Chai, B.; Zhang, Y. Relation-Fused Attention in Knowledge Graphs for Recommendation. In Proceedings of the International Conference on Neural Information Processing, Auckland, New Zealand, 2–6 December 2024; Springer Nature: Singapore, 2024; pp. 285–299. [Google Scholar]
- Beşkirli, A. An efficient binary Harris hawks optimization based on logical operators for wind turbine layout according to various wind scenarios. Eng. Sci. Technol. Int. J. 2025, 66, 102057. [Google Scholar] [CrossRef]
- Sun, L.; Shi, W.; Tian, X.; Li, J.; Zhao, B.; Wang, S.; Tan, J. A plane stress measurement method for CFRP material based on array LCR waves. NDT E Int. 2025, 151, 103318. [Google Scholar] [CrossRef]
- Ismail, W.N.; PP, F.R.; Ali, M.A.S. A meta-heuristic multi-objective optimization method for Alzheimer’s disease detection based on multi-modal data. Mathematics 2023, 11, 957. [Google Scholar] [CrossRef]
- Yuan, F.; Zuo, Z.; Jiang, Y.; Shu, W.; Tian, Z.; Ye, C.; Yang, J.; Mao, Z.; Huang, X.; Gu, S.; et al. AI-Driven Optimization of Blockchain Scalability, Security, and Privacy Protection. Algorithms 2025, 18, 263. [Google Scholar] [CrossRef]
- Beşkirli, A. Improved Chef-Based Optimization Algorithm with Chaos-Based Fitness Distance Balance for Frequency-Constrained Truss Structures. Gazi Univ. J. Sci. Part A Eng. Innov. 2025, 12, 377–402. [Google Scholar] [CrossRef]
- Yuan, F.; Lin, Z.; Tian, Z.; Chen, B.; Zhou, Q.; Yuan, C.; Sun, H.; Huang, Z. Bio-inspired hybrid path planning for efficient and smooth robotic navigation: F. Yuan et al. Int. J. Intell. Robot. Appl. 2025, 1–31. [Google Scholar] [CrossRef]
- Beşkirli, A.; Dağ, İ.; Kiran, M.S. A tree seed algorithm with multi-strategy for parameter estimation of solar photovoltaic models. Appl. Soft Comput. 2024, 167, 112220. [Google Scholar] [CrossRef]
- Bolotbekova, A.; Hakli, H.; Beskirli, A. Trip route optimization based on bus transit using genetic algorithm with different crossover techniques: A case study in Konya/Türkiye. Sci. Rep. 2025, 15, 2491. [Google Scholar] [CrossRef]
- Wu, D.; Rao, H.; Wen, C.; Jia, H.; Liu, Q.; Abualigah, L. Modified sand cat swarm optimization algorithm for solving constrained engineering optimization problems. Mathematics 2022, 10, 4350. [Google Scholar] [CrossRef]
- Beşkirli, A.; Dağ, İ. Parameter extraction for photovoltaic models with tree seed algorithm. Energy Rep. 2023, 9, 174–185. [Google Scholar] [CrossRef]
- Yao, Z.; Zhu, Q.; Zhang, Y.; Huang, H.; Luo, M. Minimizing Long-Term Energy Consumption in RIS-Assisted UAV-Enabled MEC Network. IEEE Internet Things J. 2025, 12, 20942–20958. [Google Scholar] [CrossRef]
- Beşkirli, A.; Özdemir, D.; Temurtaş, H. A comparison of modified tree–seed algorithm for high-dimensional numerical functions. Neural Comput. Appl. 2020, 32, 6877–6911. [Google Scholar] [CrossRef]
- Kennedy, J.; Eberhart, R. Particle swarm optimization. In Proceedings of the ICNN’95—International Conference on Neural Networks, Perth, WA, Australia, 27 November–1 December 1995; IEEE: Piscataway, NJ, USA, 1995; Volume 4, pp. 1942–1948. [Google Scholar]
- Dorigo, M.; Birattari, M.; Stutzle, T. Ant colony optimization. IEEE Comput. Intell. Mag. 2007, 1, 28–39. [Google Scholar] [CrossRef]
- Arora, S.; Singh, S. Butterfly optimization algorithm: A novel approach for global optimization. Soft Comput. 2019, 23, 715–734. [Google Scholar] [CrossRef]
- Mirjalili, S.; Lewis, A. The whale optimization algorithm. Adv. Eng. Softw. 2016, 95, 51–67. [Google Scholar] [CrossRef]
- Hamad, R.K.; Rashid, T.A. GOOSE algorithm: A powerful optimization tool for real-world engineering challenges and beyond. Evol. Syst. 2024, 15, 1249–1274. [Google Scholar] [CrossRef]
- Cao, Z.; Wang, L.; Hei, X. A global-best guided phase based optimization algorithm for scalable optimization problems and its application. J. Comput. Sci. 2018, 25, 38–49. [Google Scholar] [CrossRef]
- Yang, H.; Tao, S.; Zhang, Z.; Cai, Z.; Gao, S. Spatial information sampling: Another feedback mechanism of realising adaptive parameter control in meta-heuristic algorithms. Int. J. Bio-Inspired Comput. 2022, 19, 48–58. [Google Scholar] [CrossRef]
- Wu, M.; Yang, D.; Liu, T. An improved particle swarm algorithm with the elite retain strategy for solving flexible jobshop scheduling problem. J. Phys. Conf. Ser. 2022, 2173, 012082. [Google Scholar] [CrossRef]
- Öztaş, T.; Tuş, A. A hybrid metaheuristic algorithm based on iterated local search for vehicle routing problem with simultaneous pickup and delivery. Expert Syst. Appl. 2022, 202, 117401. [Google Scholar] [CrossRef]
- Agushaka, J.O.; Ezugwu, A.E.; Saha, A.K.; Pal, J.; Abualigah, L.; Mirjalili, S. Greater cane rat algorithm (GCRA): A nature-inspired metaheuristic for optimization problems. Heliyon 2024, 10, e31629. [Google Scholar] [CrossRef]
- Vediramana Krishnan, H.G.; Chen, Y.T.; Shoham, S.; Gurfinkel, A. Global guidance for local generalization in model checking. Form. Methods Syst. Des. 2024, 63, 81–109. [Google Scholar] [CrossRef]
- Zhou, X.; Ma, H.; Gu, J.; Chen, H.; Deng, W. Parameter adaptation-based ant colony optimization with dynamic hybrid mechanism. Eng. Appl. Artif. Intell. 2022, 114, 105139. [Google Scholar] [CrossRef]
- Xie, L.; Han, T.; Zhou, H.; Zhang, Z.-R.; Han, B.; Tang, A. Tuna swarm optimization: A novel swarm-based metaheuristic algorithm for global optimization. Comput. Intell. Neurosci. 2021, 2021, 9210050. [Google Scholar] [CrossRef] [PubMed]
- Liu, J.; Xu, Y. T-Friedman test: A new statistical test for multiple comparison with an adjustable conservativeness measure. Int. J. Comput. Intell. Syst. 2022, 15, 29. [Google Scholar] [CrossRef]
- Kitani, M.; Murakami, H. One-sample location test based on the sign and Wilcoxon signed-rank tests. J. Stat. Comput. Simul. 2022, 92, 610–622. [Google Scholar] [CrossRef]
- Li, X.; Wu, Y.; Wei, M.; Guo, Y.; Yu, Z.; Wang, H.; Li, Z.; Fan, H. A novel index of functional connectivity: Phase lag based on Wilcoxon signed rank test. Cogn. Neurodynamics 2021, 15, 621–636. [Google Scholar] [CrossRef] [PubMed]
- Abualigah, L.; Diabat, A.; Mirjalili, S.; Elaziz, M.A.; Gandomi, A.H. The arithmetic optimization algorithm. Comput. Methods Appl. Mech. Eng. 2021, 376, 113609. [Google Scholar] [CrossRef]
- Karaboğa, D.; Ökdem, S. A simple and global optimization algorithm for engineering problems: Differential evolution algorithm. Turk. J. Electr. Eng. Comput. Sci. 2004, 12, 53–60. [Google Scholar]
- Öztürk, H.T.; Kahraman, H.T. Metaheuristic search algorithms in frequency constrained truss problems: Four improved evolutionary algorithms, optimal solutions and stability analysis. Appl. Soft Comput. 2025, 171, 112854. [Google Scholar] [CrossRef]
- Khosla, T.; Verma, O.P. An adaptive hybrid particle swarm optimizer for constrained optimization problem. In Proceedings of the 2021 International Conference in Advances in Power, Signal, and Information Technology (APSIT), Bhubaneswar, India, 8–10 October 2021; IEEE: Piscataway, NJ, USA, 2021; pp. 1–7. [Google Scholar]
- Bakır, H.; Duman, S.; Guvenc, U.; Kahraman, H.T. Improved adaptive gaining-sharing knowledge algorithm with FDB-based guiding mechanism for optimization of optimal reactive power flow problem. Electr. Eng. 2023, 105, 3121–3160. [Google Scholar] [CrossRef]
- Jamil, M.; Yang, X.S. A literature survey of benchmark functions for global optimisation problems. Int. J. Math. Model. Numer. Optim. 2013, 4, 150–194. [Google Scholar] [CrossRef]
- Zhang, K.; Yuan, F.; Jiang, Y.; Mao, Z.; Zuo, Z.; Peng, Y. A Particle Swarm Optimization-Guided Ivy Algorithm for Global Optimization Problems. Biomimetics 2025, 10, 342. [Google Scholar] [CrossRef]
- Cai, T.; Zhang, S.; Ye, Z.; Zhou, W.; Wang, M.; He, Q.; Chen, Z.; Bai, W. Cooperative metaheuristic algorithm for global optimization and engineering problems inspired by heterosis theory. Sci. Rep. 2024, 14, 28876. [Google Scholar] [CrossRef]
- Zhan, Z.H.; Shi, L.; Tan, K.C.; Zhang, J. A survey on evolutionary computation for complex continuous optimization. Artif. Intell. Rev. 2022, 55, 59–110. [Google Scholar] [CrossRef]
- Zhang, K.; Li, X.; Zhang, S.; Zhang, S. A Bio-Inspired Adaptive Probability IVYPSO Algorithm with Adaptive Strategy for Backpropagation Neural Network Optimization in Predicting High-Performance Concrete Strength. Biomimetics 2025, 10, 515. [Google Scholar] [CrossRef]
- Kwakye, B.D.; Li, Y.; Mohamed, H.H.; Baidoo, E.; Asenso, T.Q. Particle guided metaheuristic algorithm for global optimization and feature selection problems. Expert Syst. Appl. 2024, 248, 123362. [Google Scholar] [CrossRef]
- Beiranvand, V.; Hare, W.; Lucet, Y. Best practices for comparing optimization algorithms. Optim. Eng. 2017, 18, 815–848. [Google Scholar] [CrossRef]
- Piotrowski, A.P.; Napiorkowski, J.J.; Piotrowska, A.E. Metaheuristics should be tested on large benchmark set with various numbers of function evaluations. Swarm Evol. Comput. 2025, 92, 101807. [Google Scholar] [CrossRef]
- Piotrowski, A.P.; Napiorkowski, J.J.; Piotrowska, A.E. Choice of benchmark optimization problems does matter. Swarm Evol. Comput. 2023, 83, 101378. [Google Scholar] [CrossRef]
- Tilahun, S.L.; Matadi, M.B. Weight minimization of a speed reducer using prey predator algorithm. Int. J. Manuf. Mater. Mech. Eng. 2018, 8, 19–32. [Google Scholar] [CrossRef]
- Tzanetos, A.; Blondin, M. A qualitative systematic review of metaheuristics applied to tension/compression spring design problem: Current situation, recommendations, and research direction. Eng. Appl. Artif. Intell. 2023, 118, 105521. [Google Scholar] [CrossRef]
- Kamil, A.T.; Saleh, H.M.; Abd-Alla, I.H. A multi-swarm structure for particle swarm optimization: Solving the welded beam design problem. J. Phys. Conf. Ser. 2021, 1804, 012012. [Google Scholar] [CrossRef]
- Dai, L.; Zhang, L.; Chen, Z. GrS Algorithm for Solving Gas Transmission Compressor Design Problem. In Proceedings of the 2022 IEEE/WIC/ACM International Joint Conference on Web Intelligence and Intelligent Agent Technology (WI-IAT), Niagara Falls, ON, Canada, 17–20 November 2022; IEEE: Piscataway, NJ, USA, 2022; pp. 842–846. [Google Scholar]
- Yildirim, A.E.; Karci, A. Application of three bar truss problem among engineering design optimization problems using artificial atom algorithm. In Proceedings of the 2018 International Conference on Artificial Intelligence and Data Processing (IDAP), Malatya, Turkey, 28–30 September 2018; IEEE: Piscataway, NJ, USA, 2018; pp. 1–5. [Google Scholar]
- Multiple-Disk Clutch Brake Design Problem. Available online: https://desdeo-problem.readthedocs.io/en/latest/problems/multiple_clutch_brakes.html (accessed on 12 July 2025).
Disclaimer/Publisher’s Note: The statements, opinions and data contained in all publications are solely those of the individual author(s) and contributor(s) and not of MDPI and/or the editor(s). MDPI and/or the editor(s) disclaim responsibility for any injury to people or property resulting from any ideas, methods, instructions or products referred to in the content. |
© 2025 by the authors. Licensee MDPI, Basel, Switzerland. This article is an open access article distributed under the terms and conditions of the Creative Commons Attribution (CC BY) license (https://creativecommons.org/licenses/by/4.0/).