
Impact of Biomimetic Fin on Pitching Characteristics of a Hydrofoil

 , , , and
Abstract

1. Introduction
2. Experimental Setup
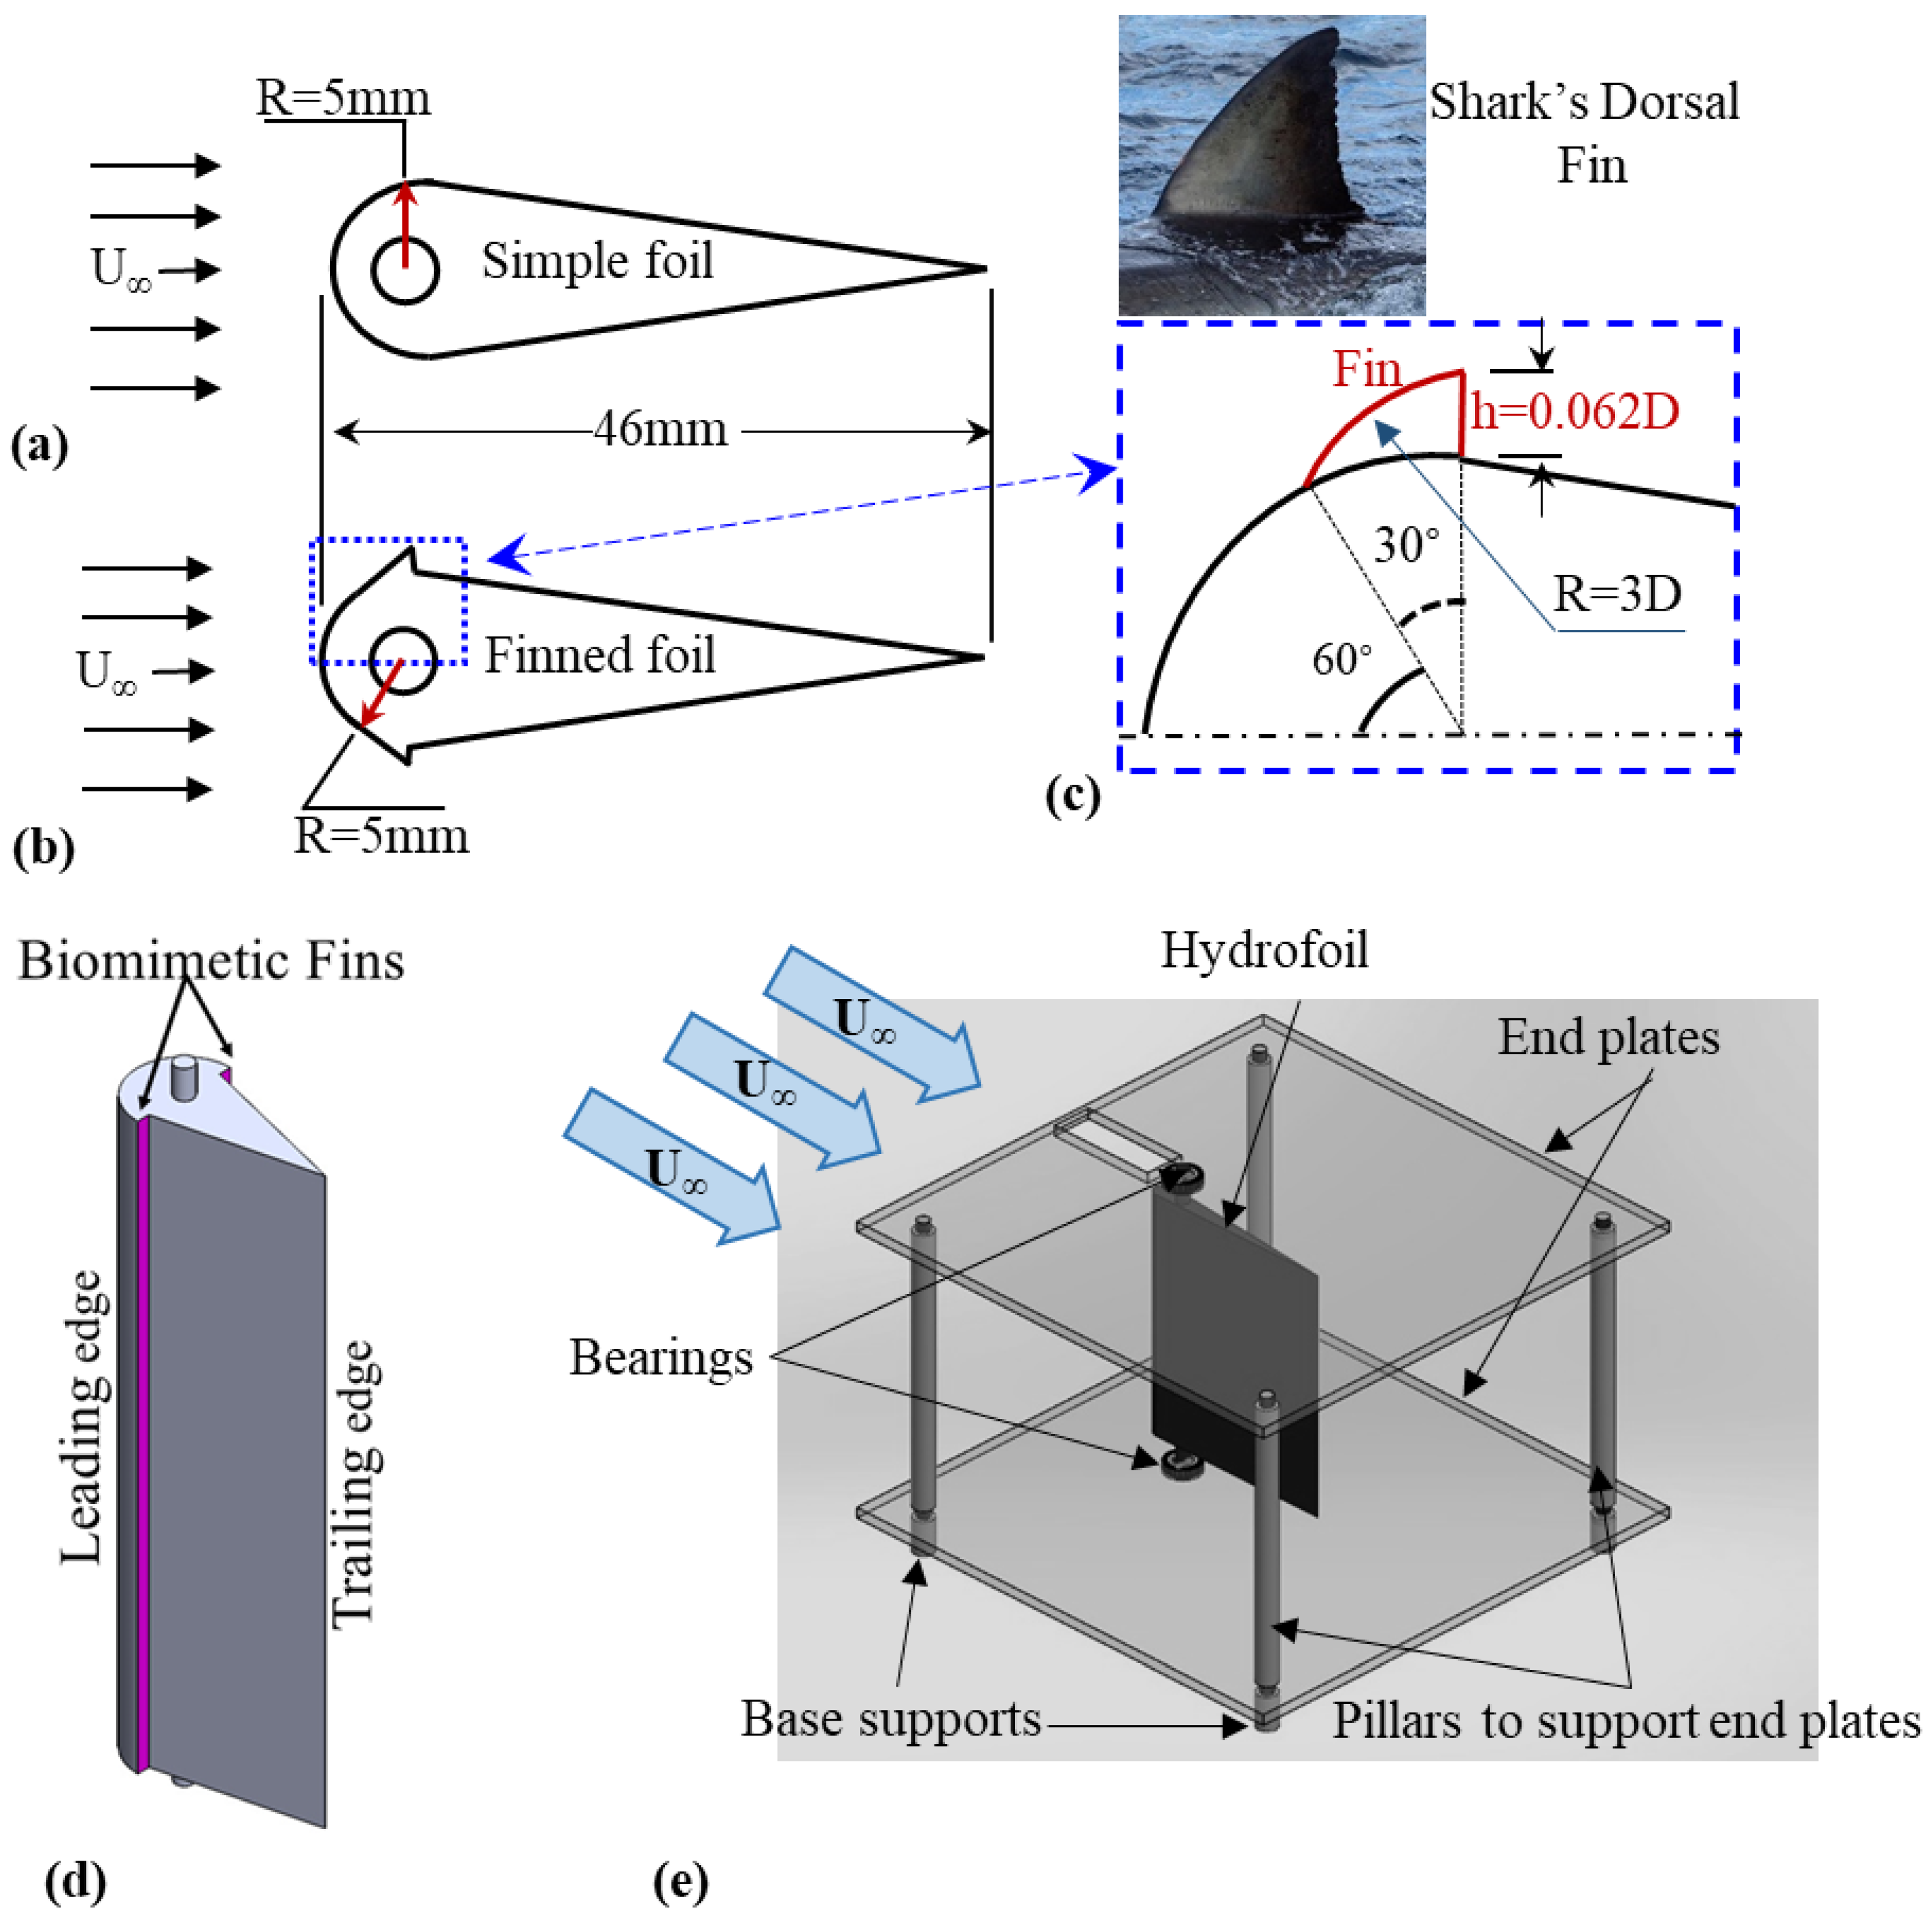
2.1. Experimental Model
- Measured Friction Torque (Tₓ) = 2.3 × 10⁻⁵ Nm.
- Characteristic Torque (T0) = 6.0 × 10⁻³ Nm.
- Non-dimensional Friction Coefficient (Cₓ) = 0.0038 (at maximum Reynolds number).
2.2. Water Channel
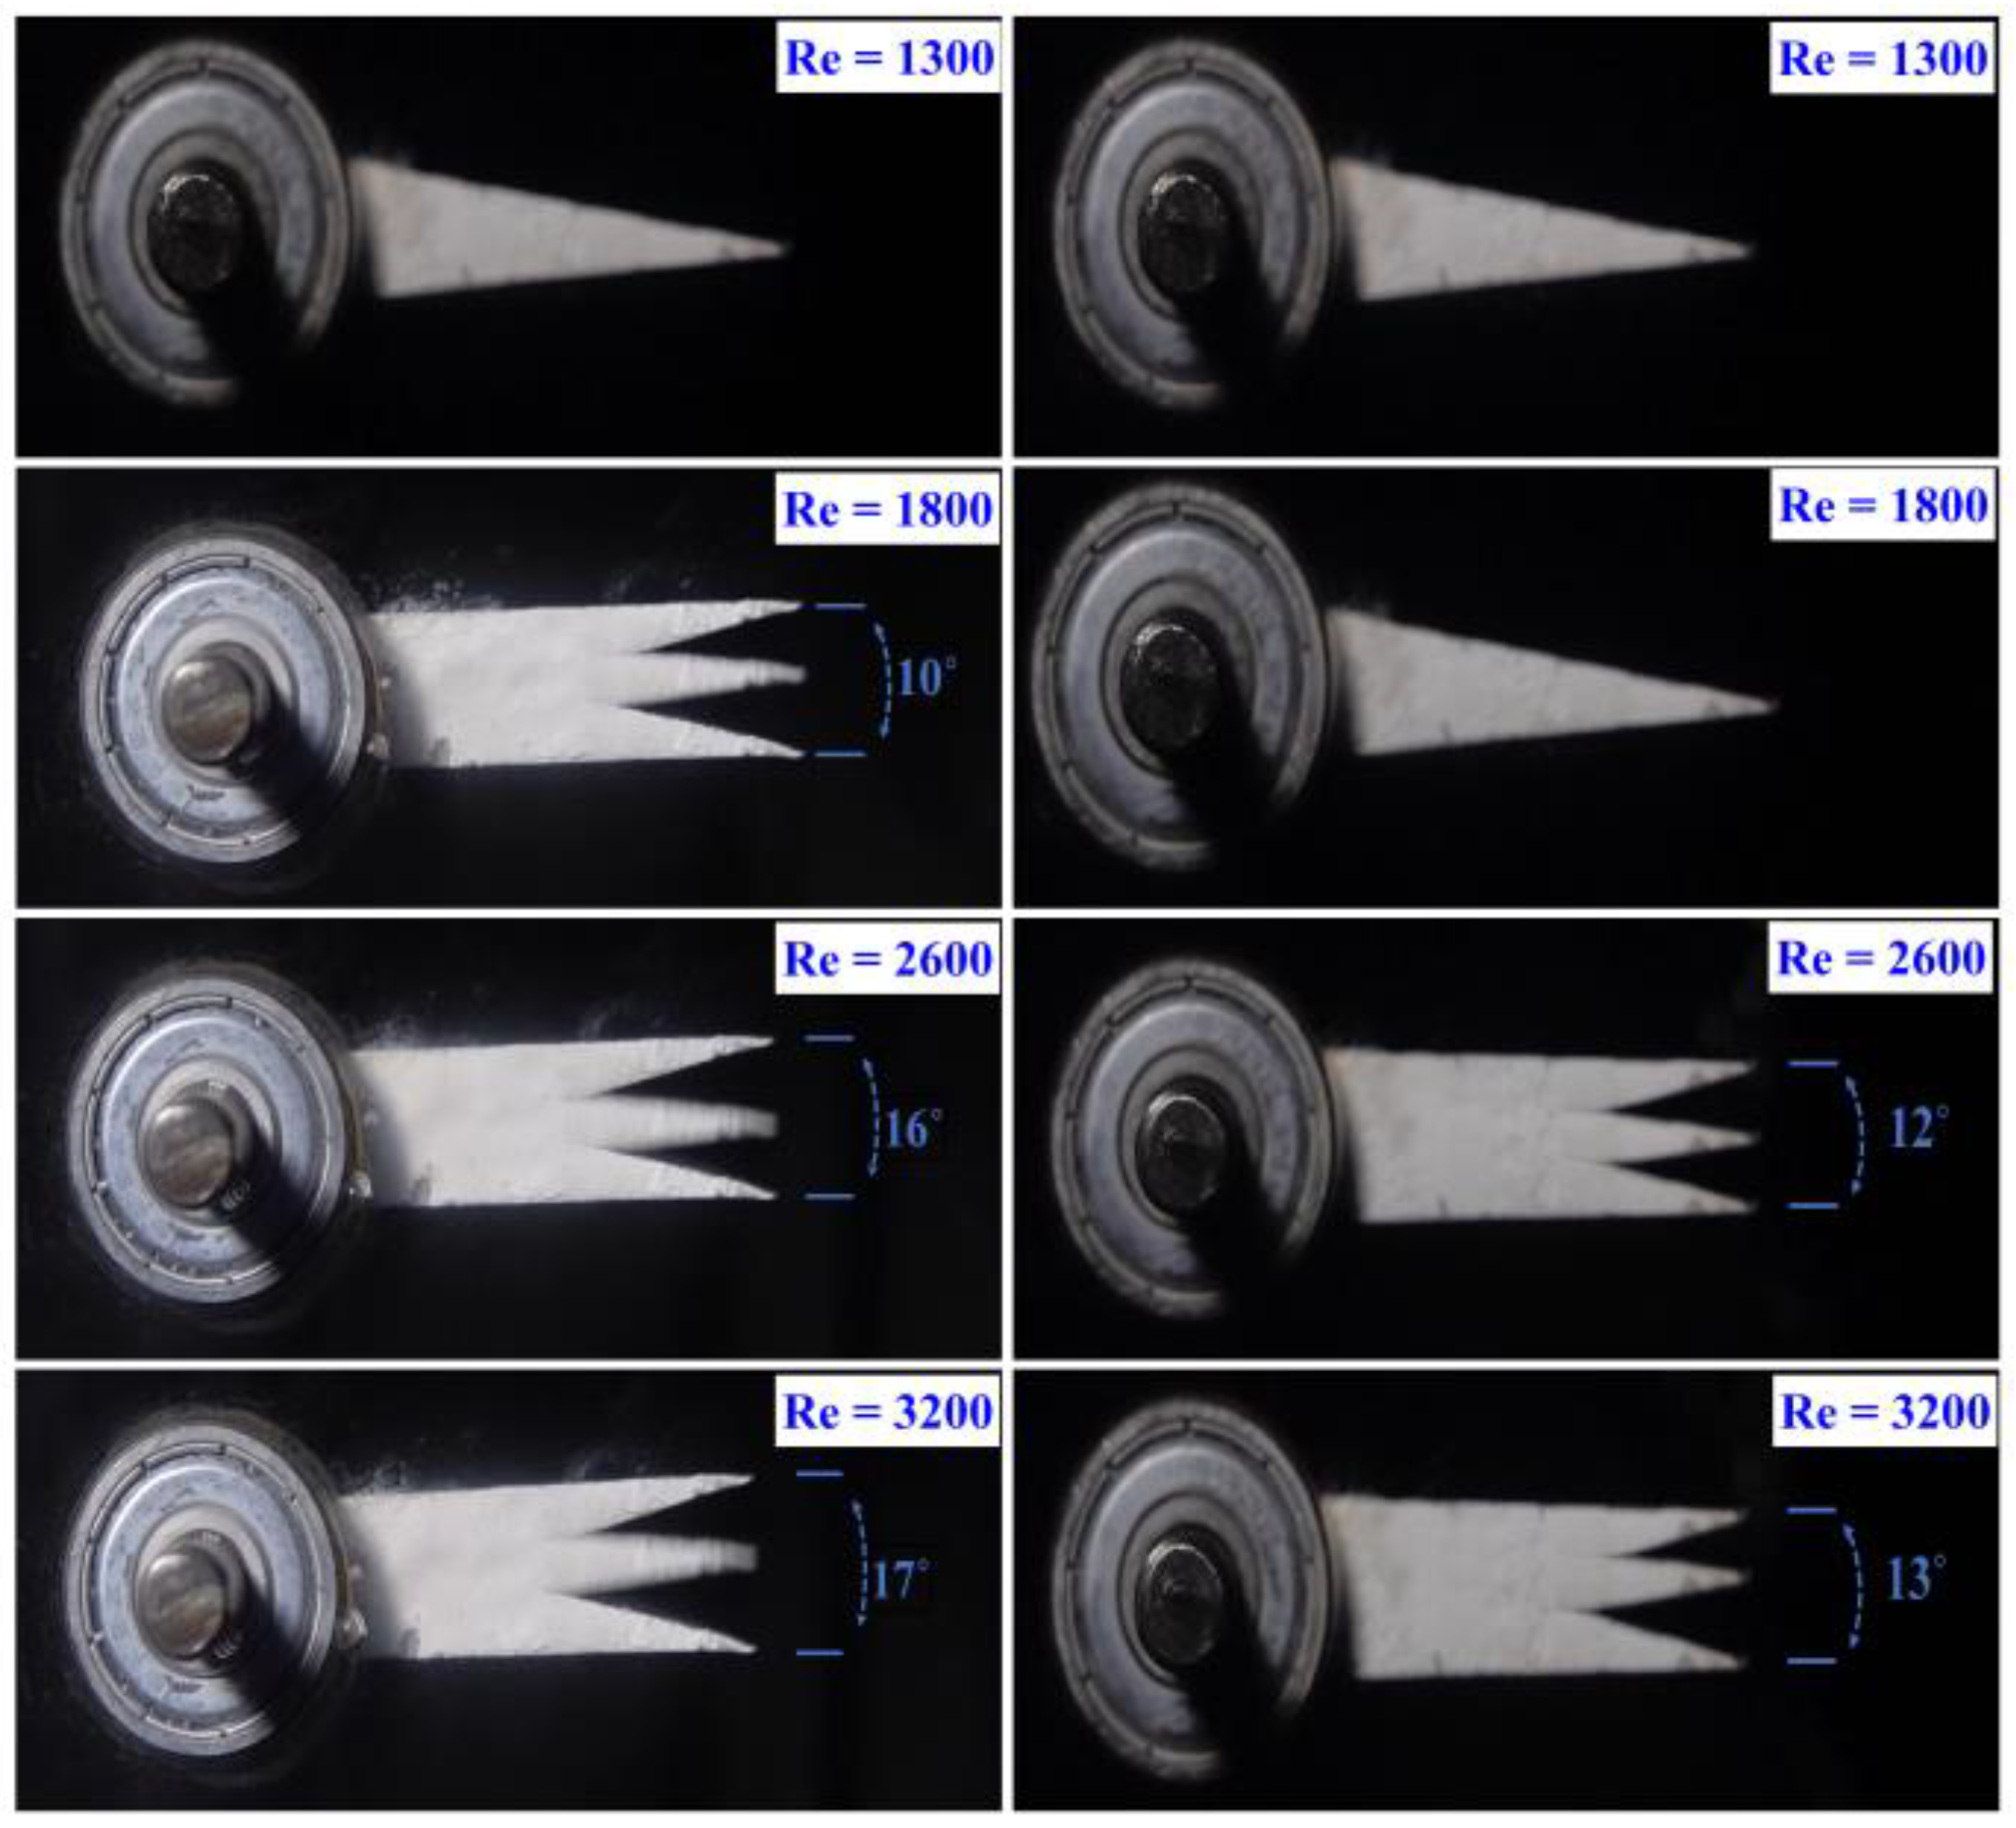
2.3. Videography
2.4. Particle Image Velocimetry
2.5. Validation of Experimental Setup
3. Results and Discussions
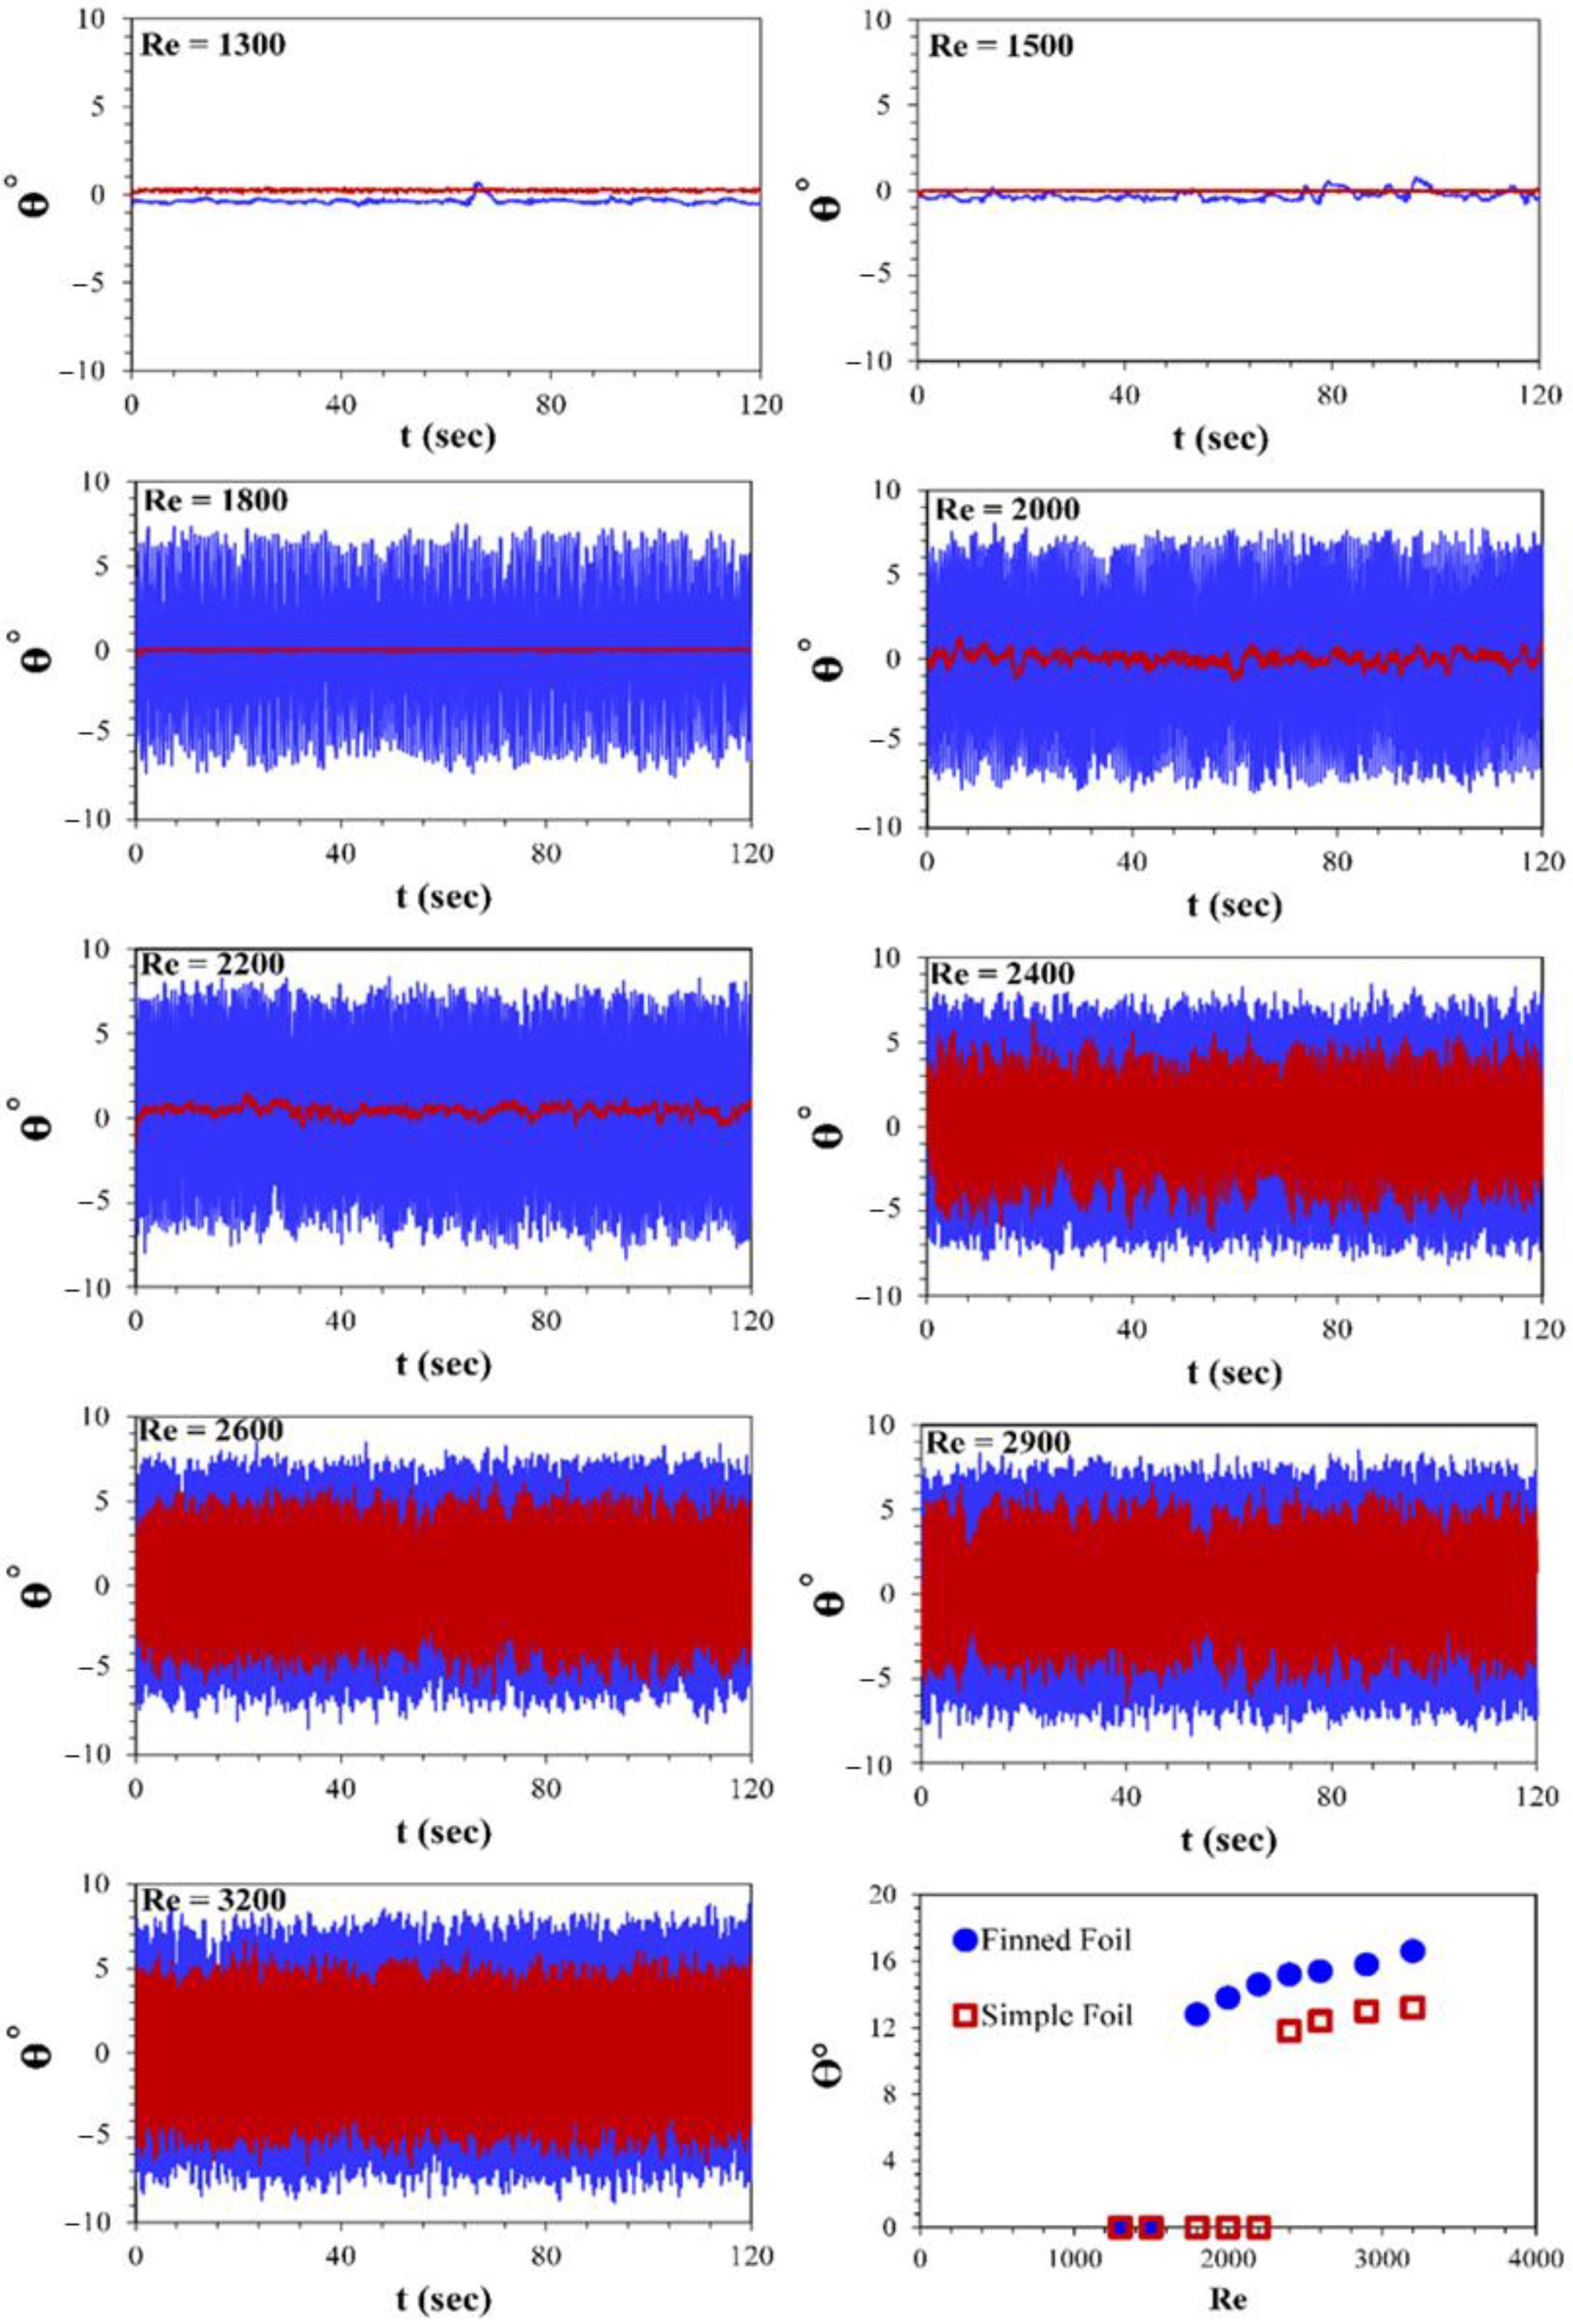
3.1. Pitching Amplitude
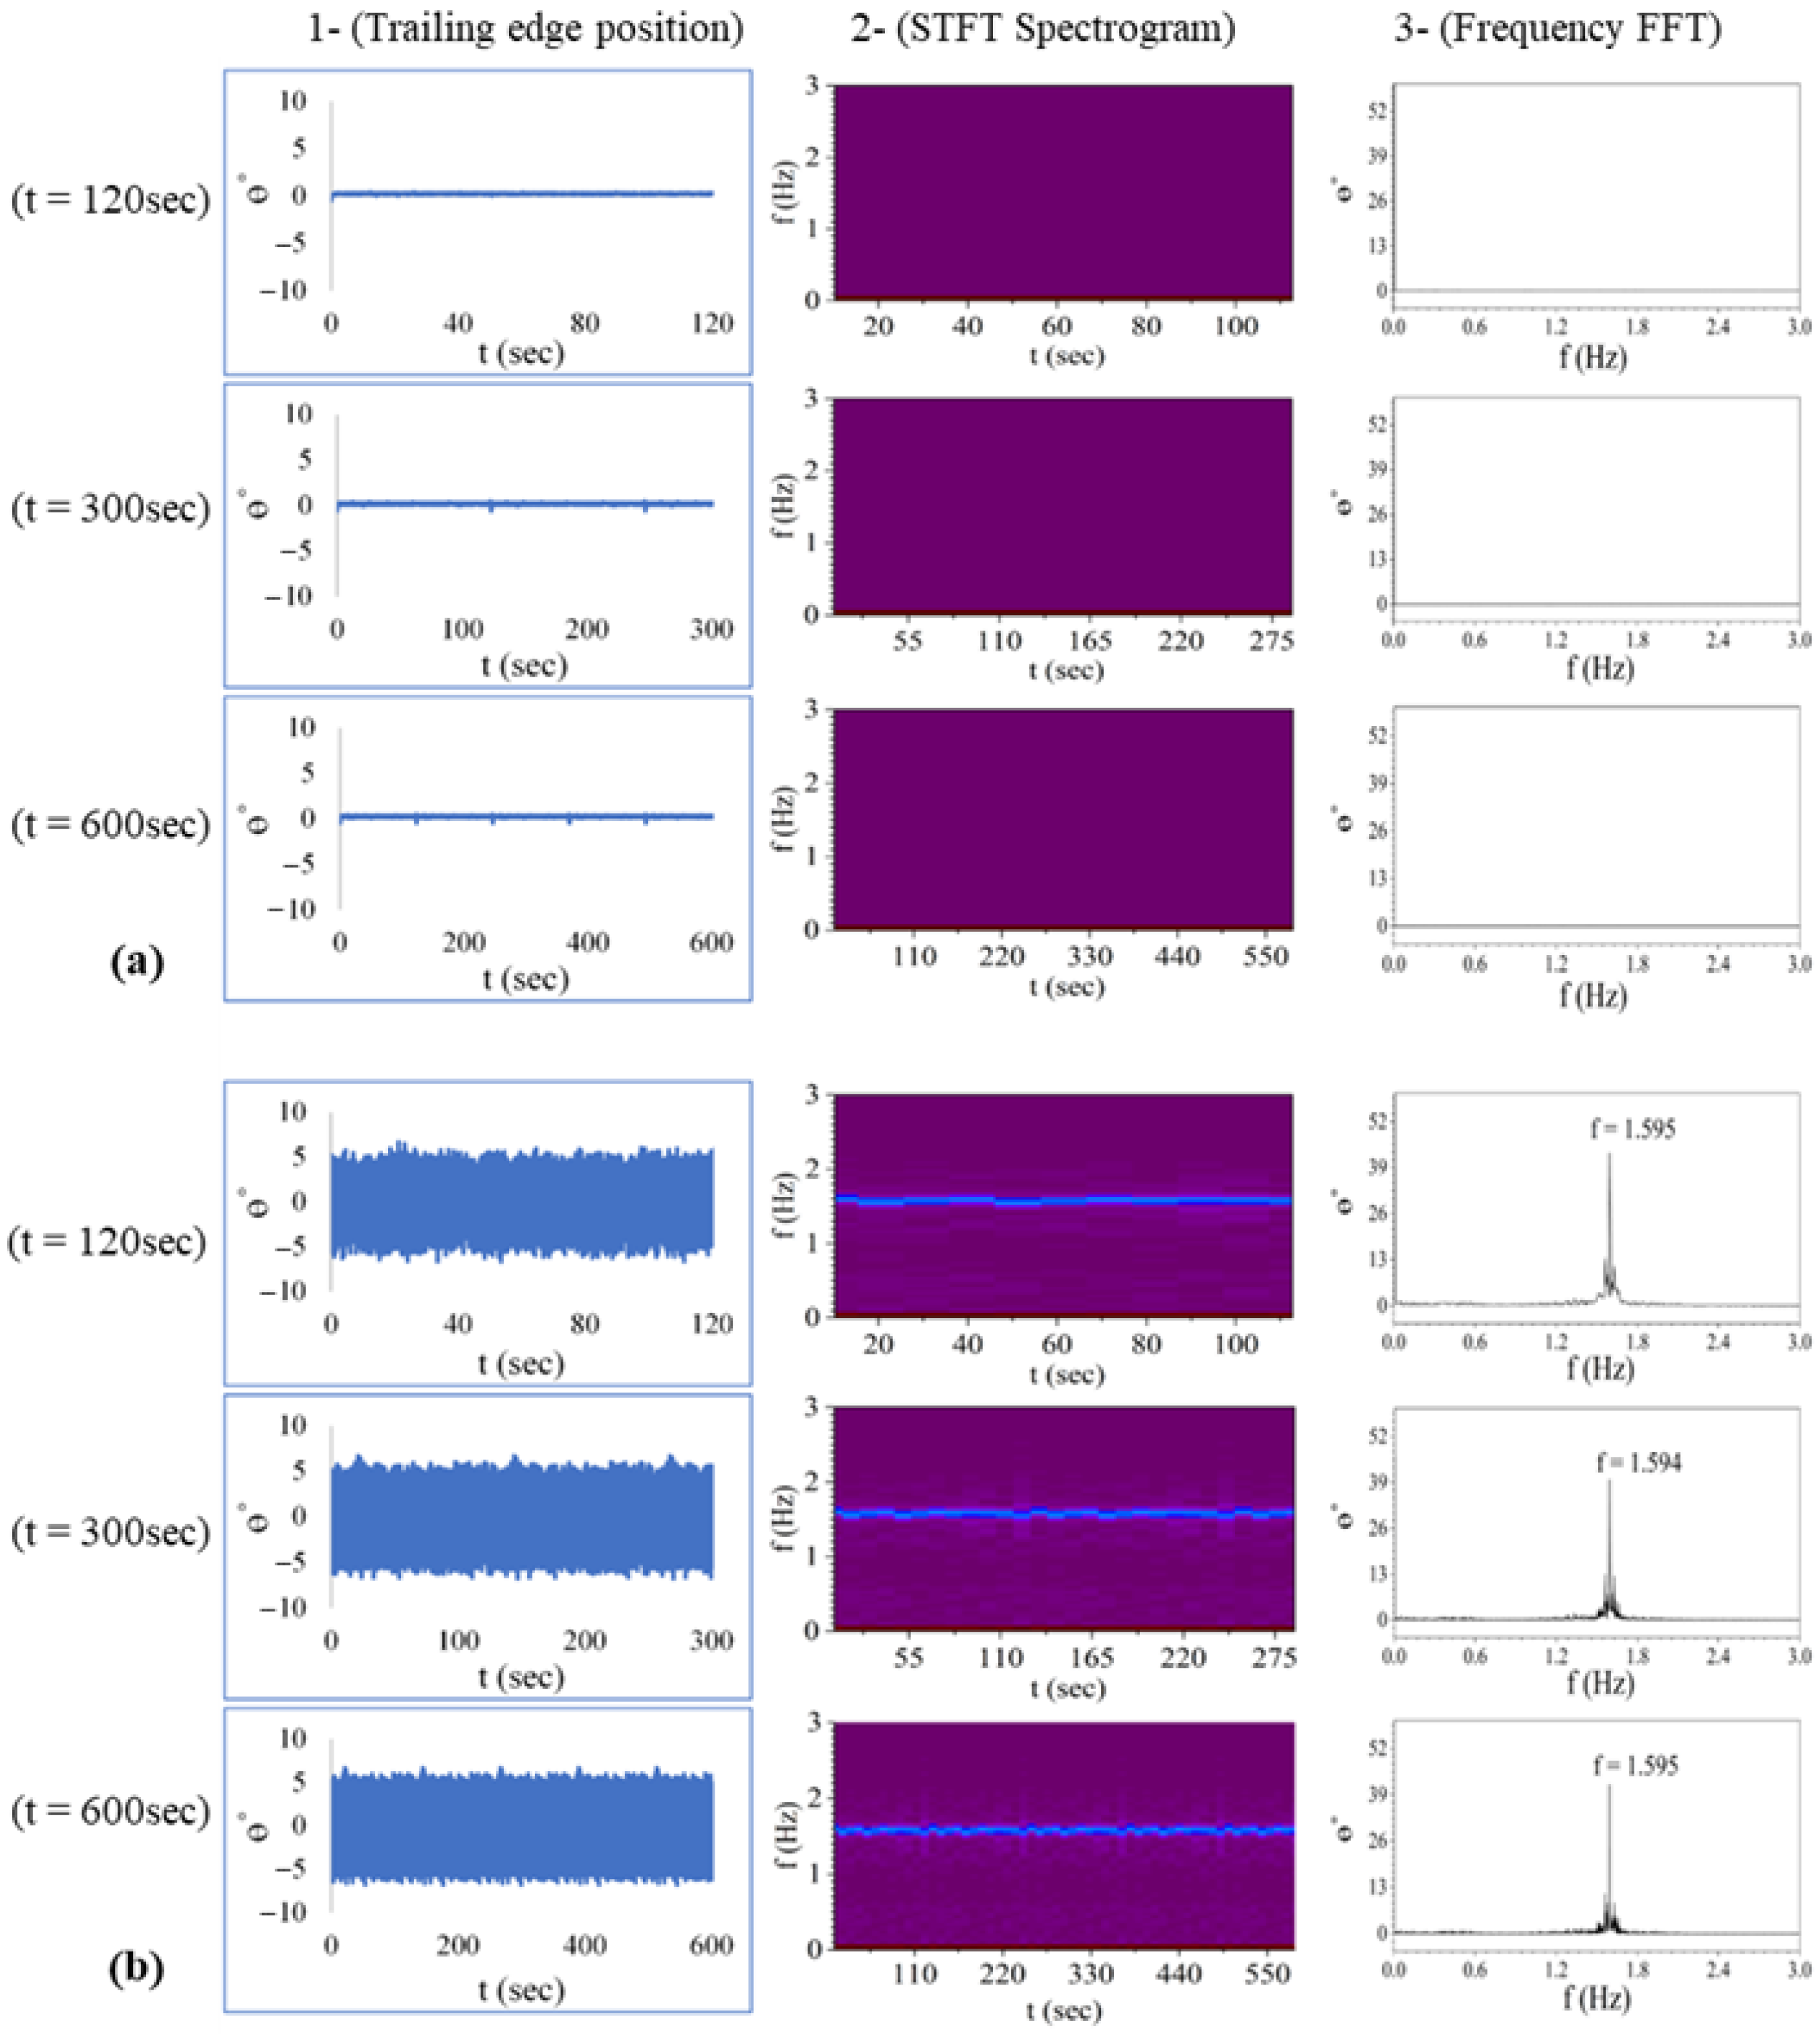
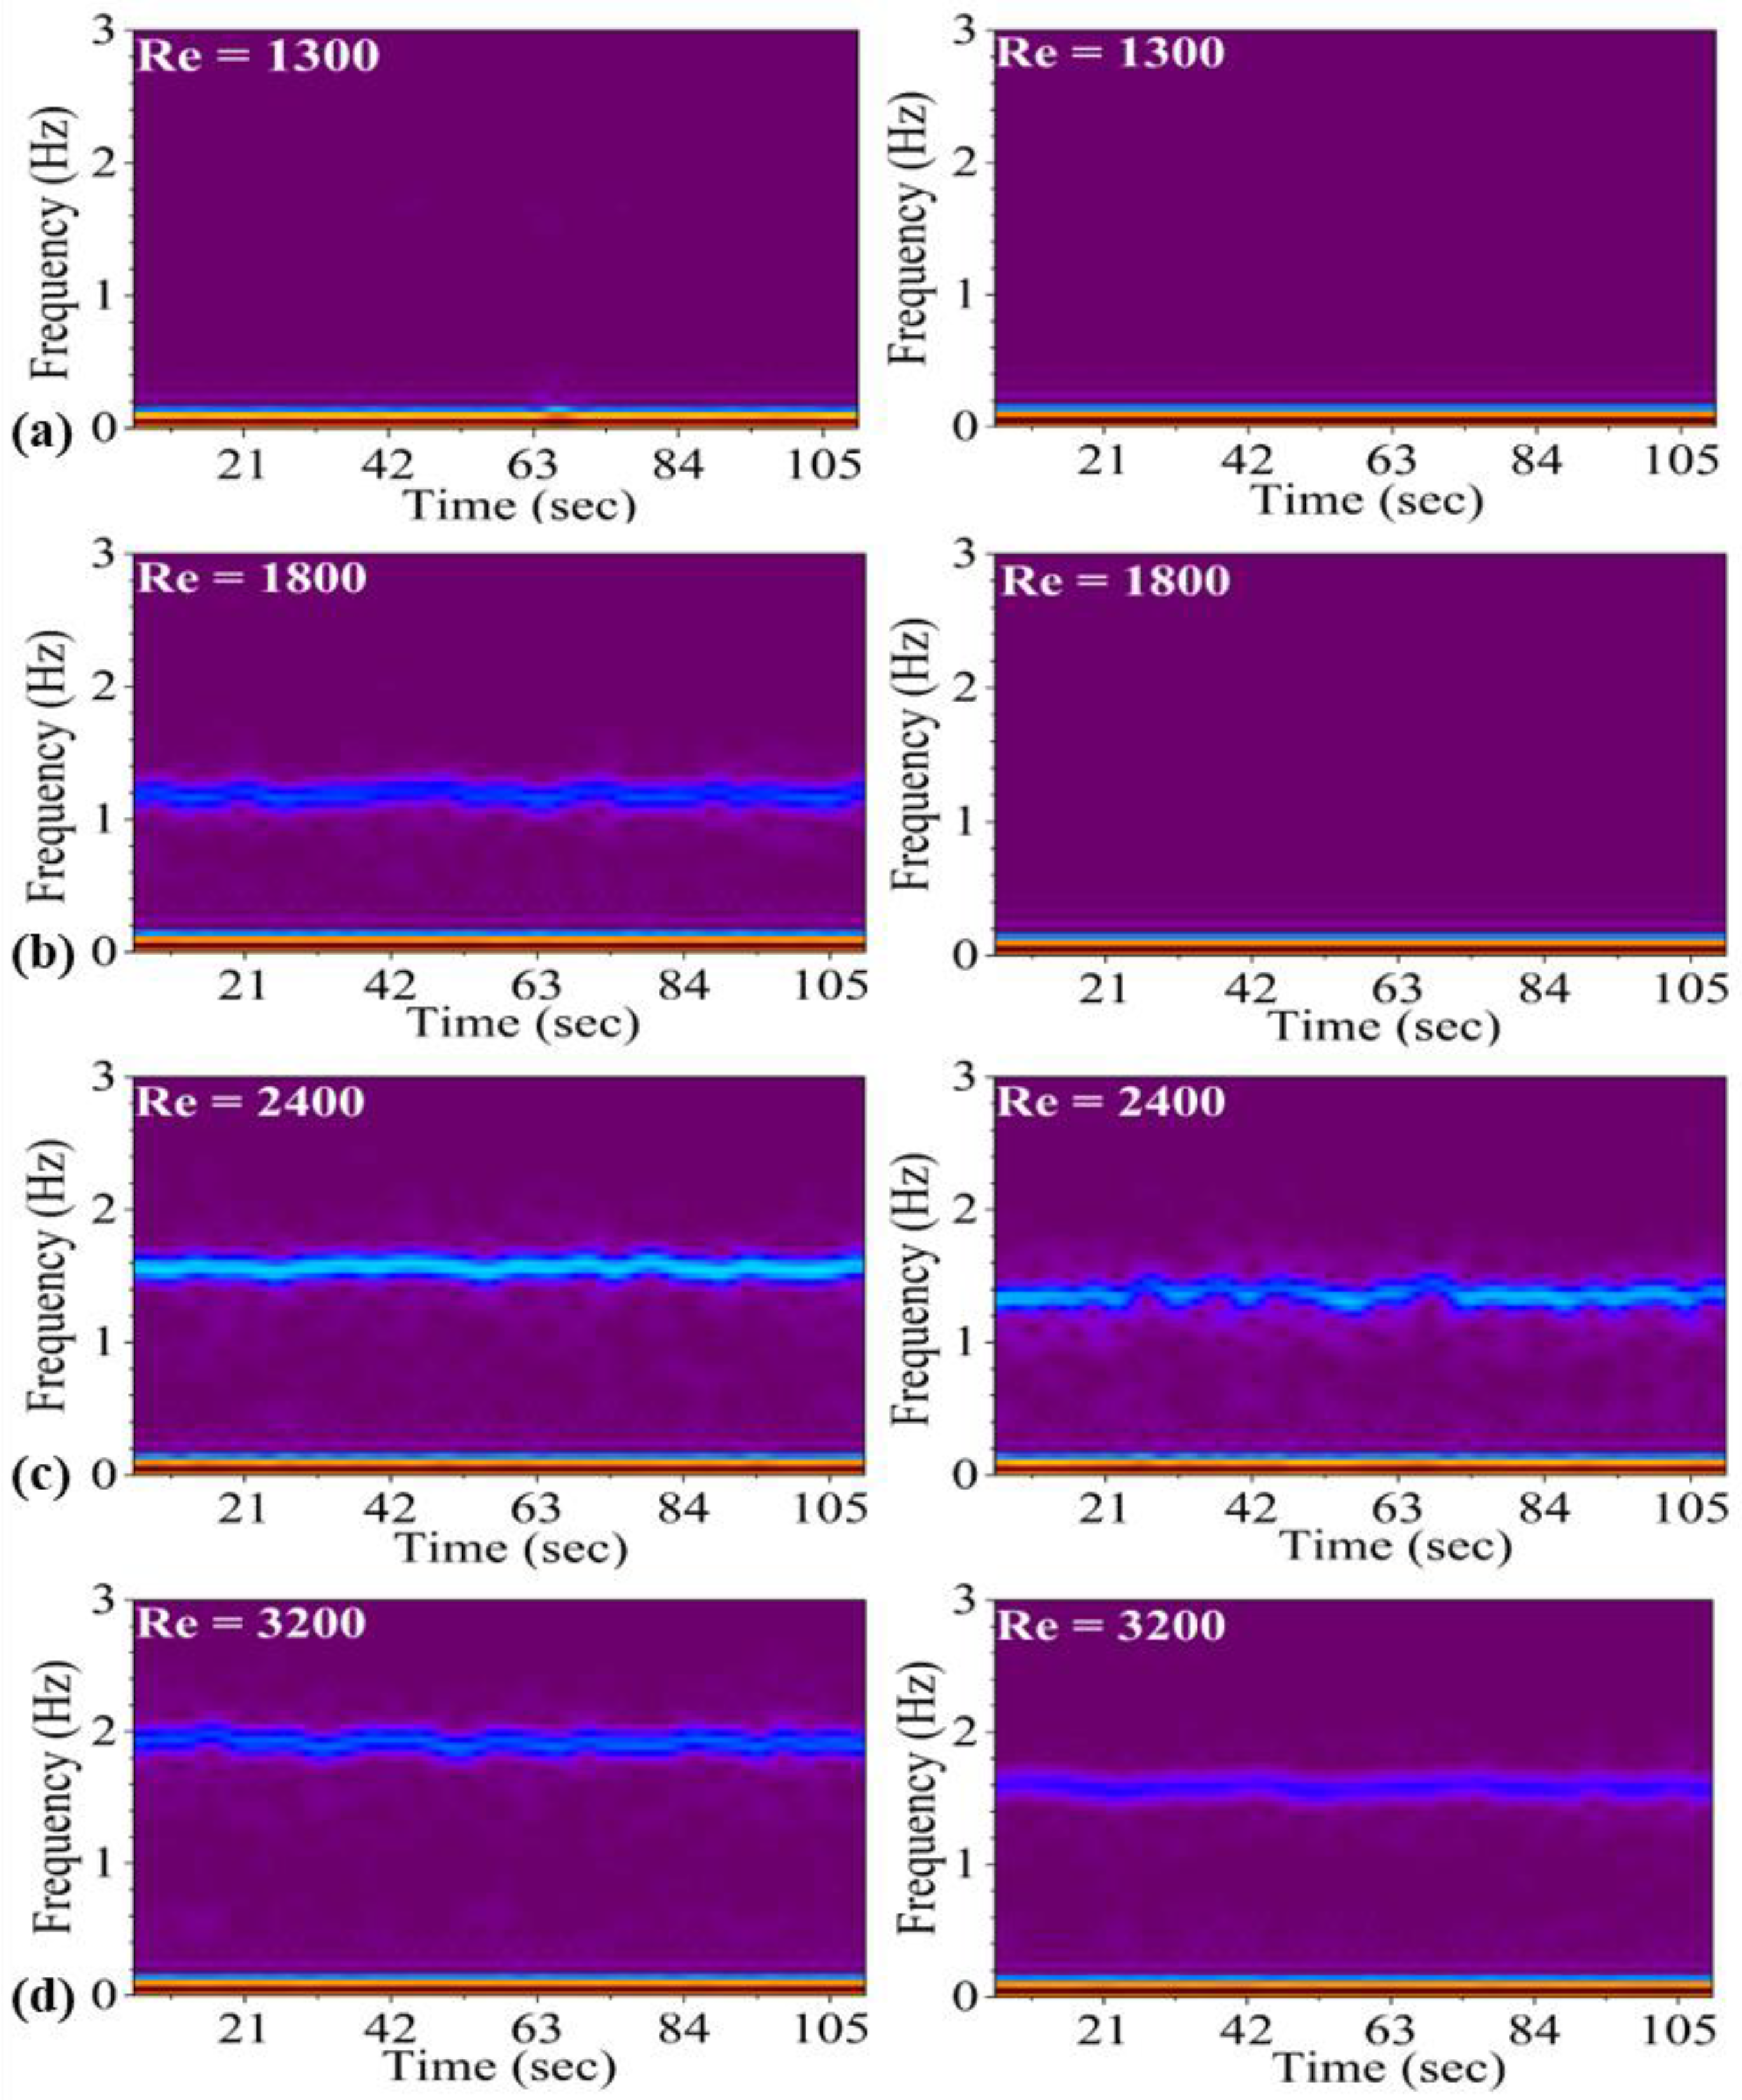
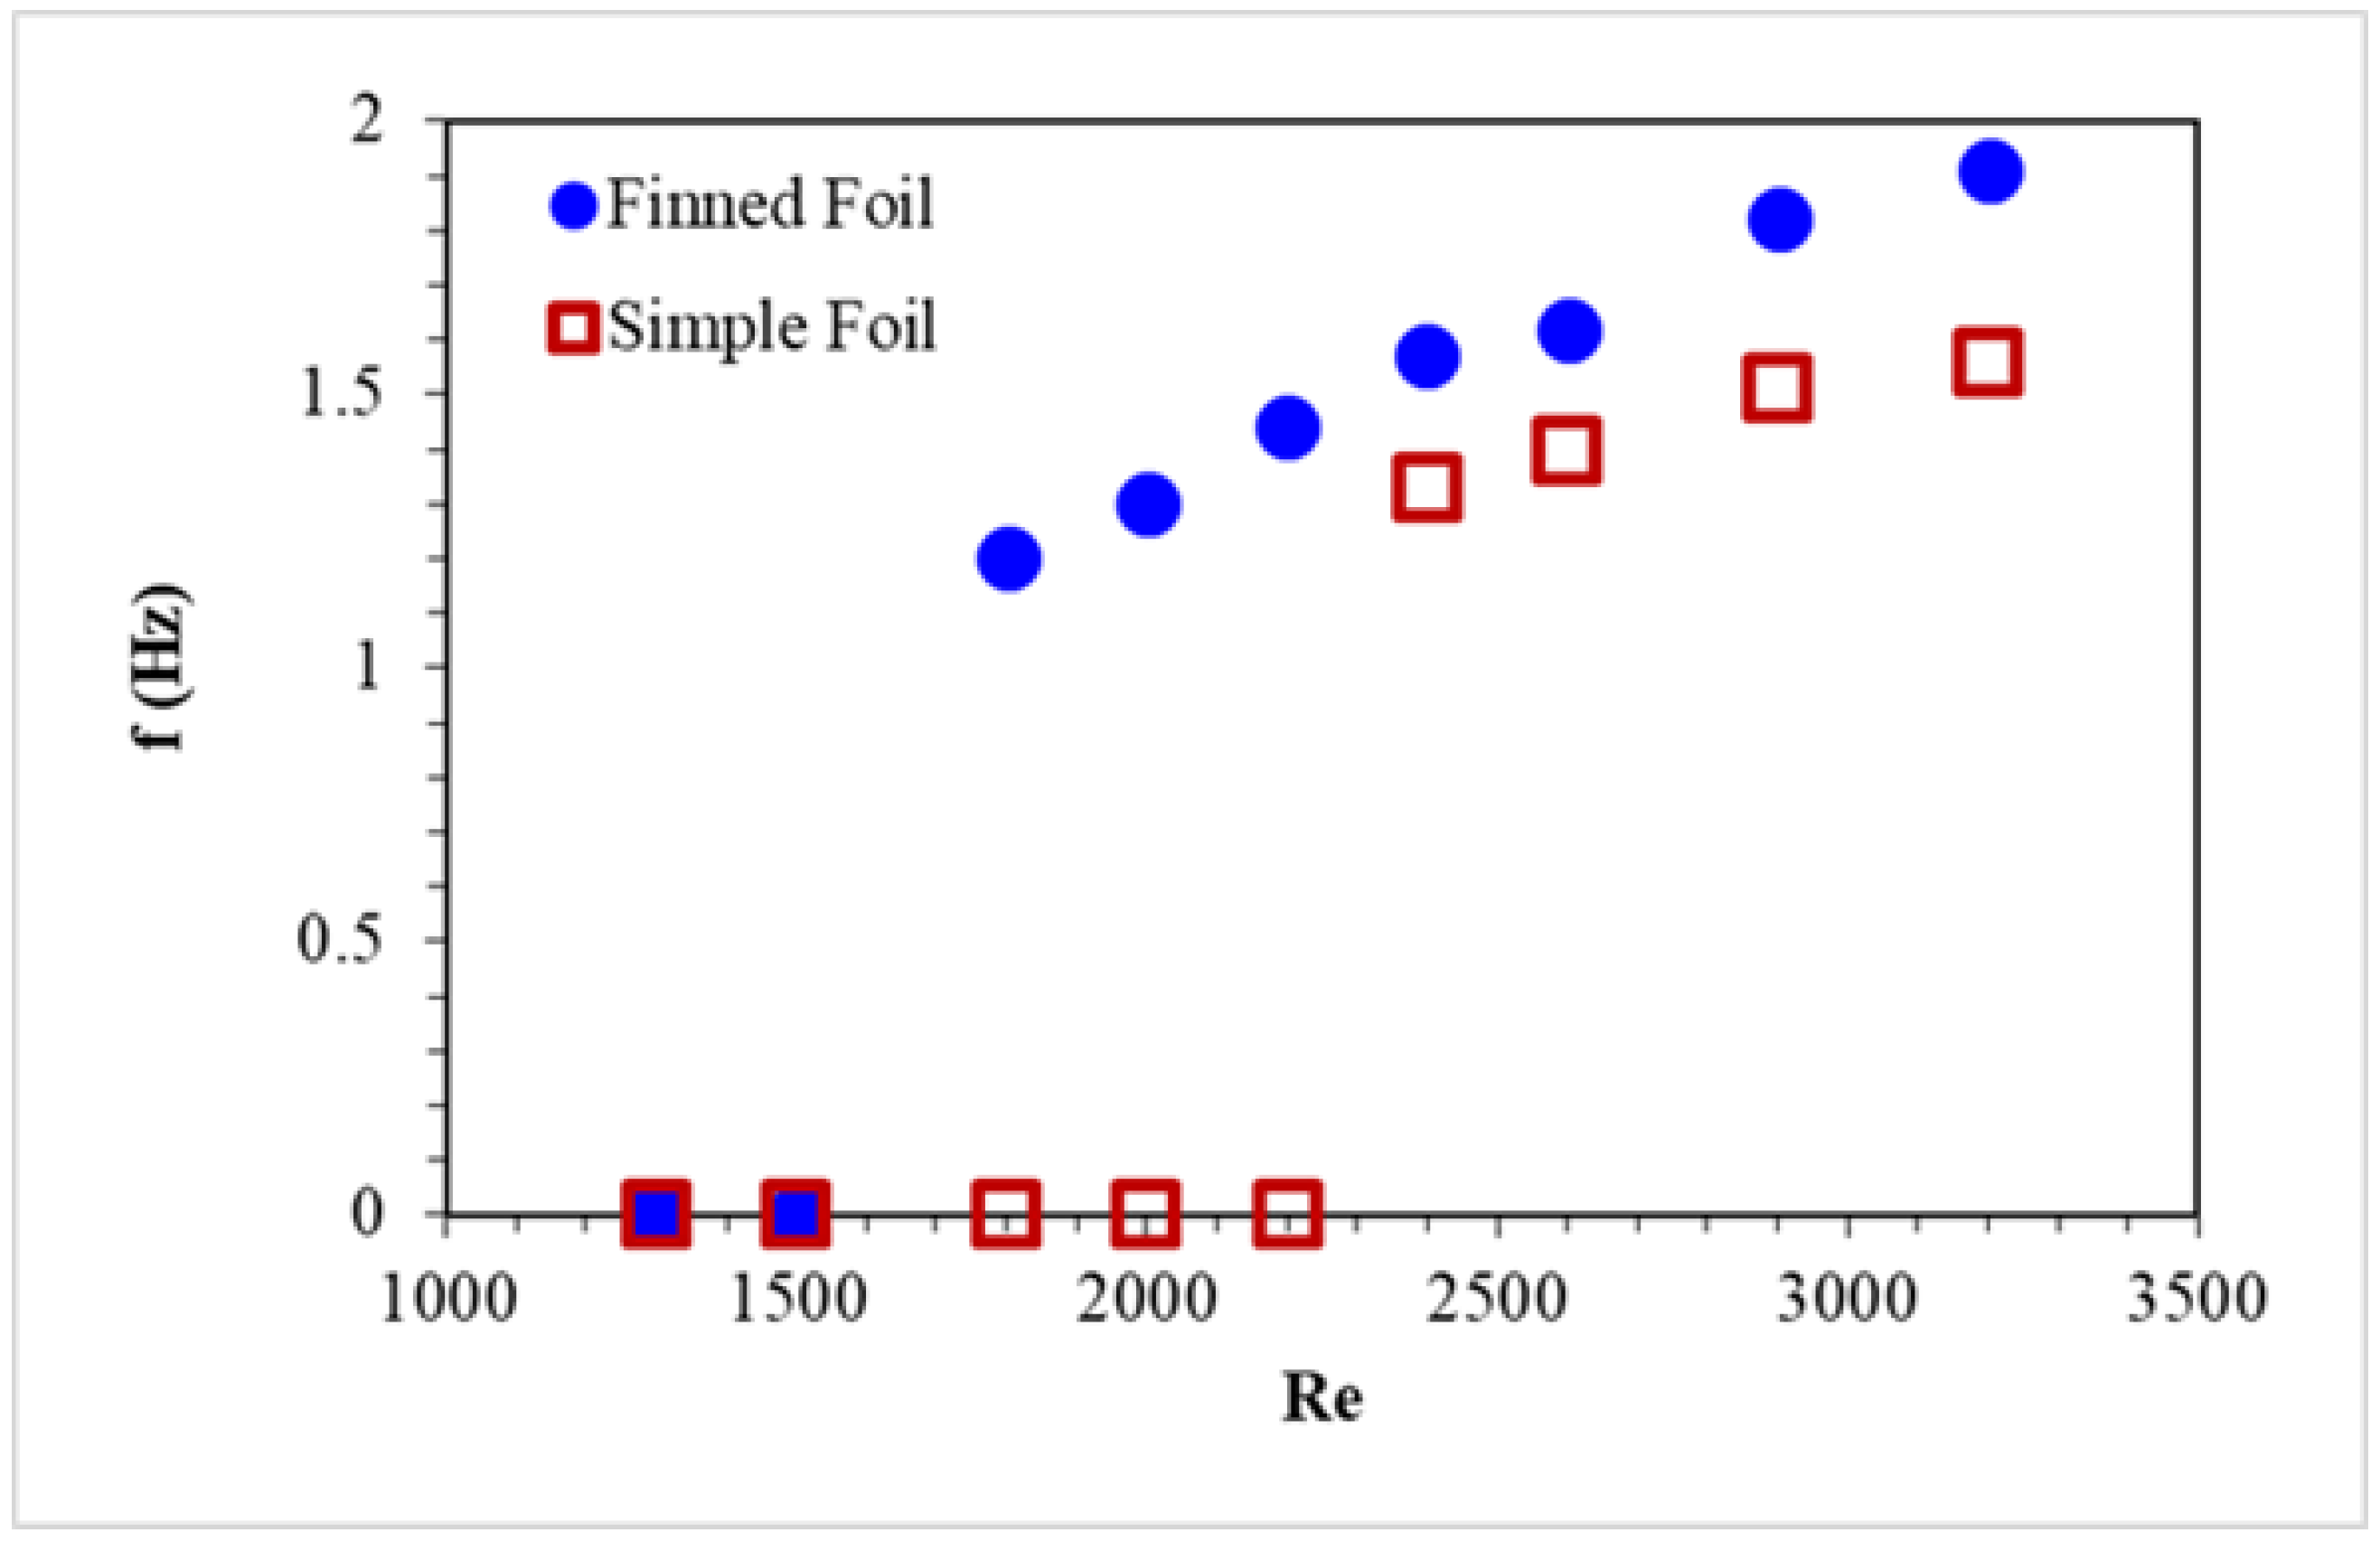
3.2. Pitching Frequency
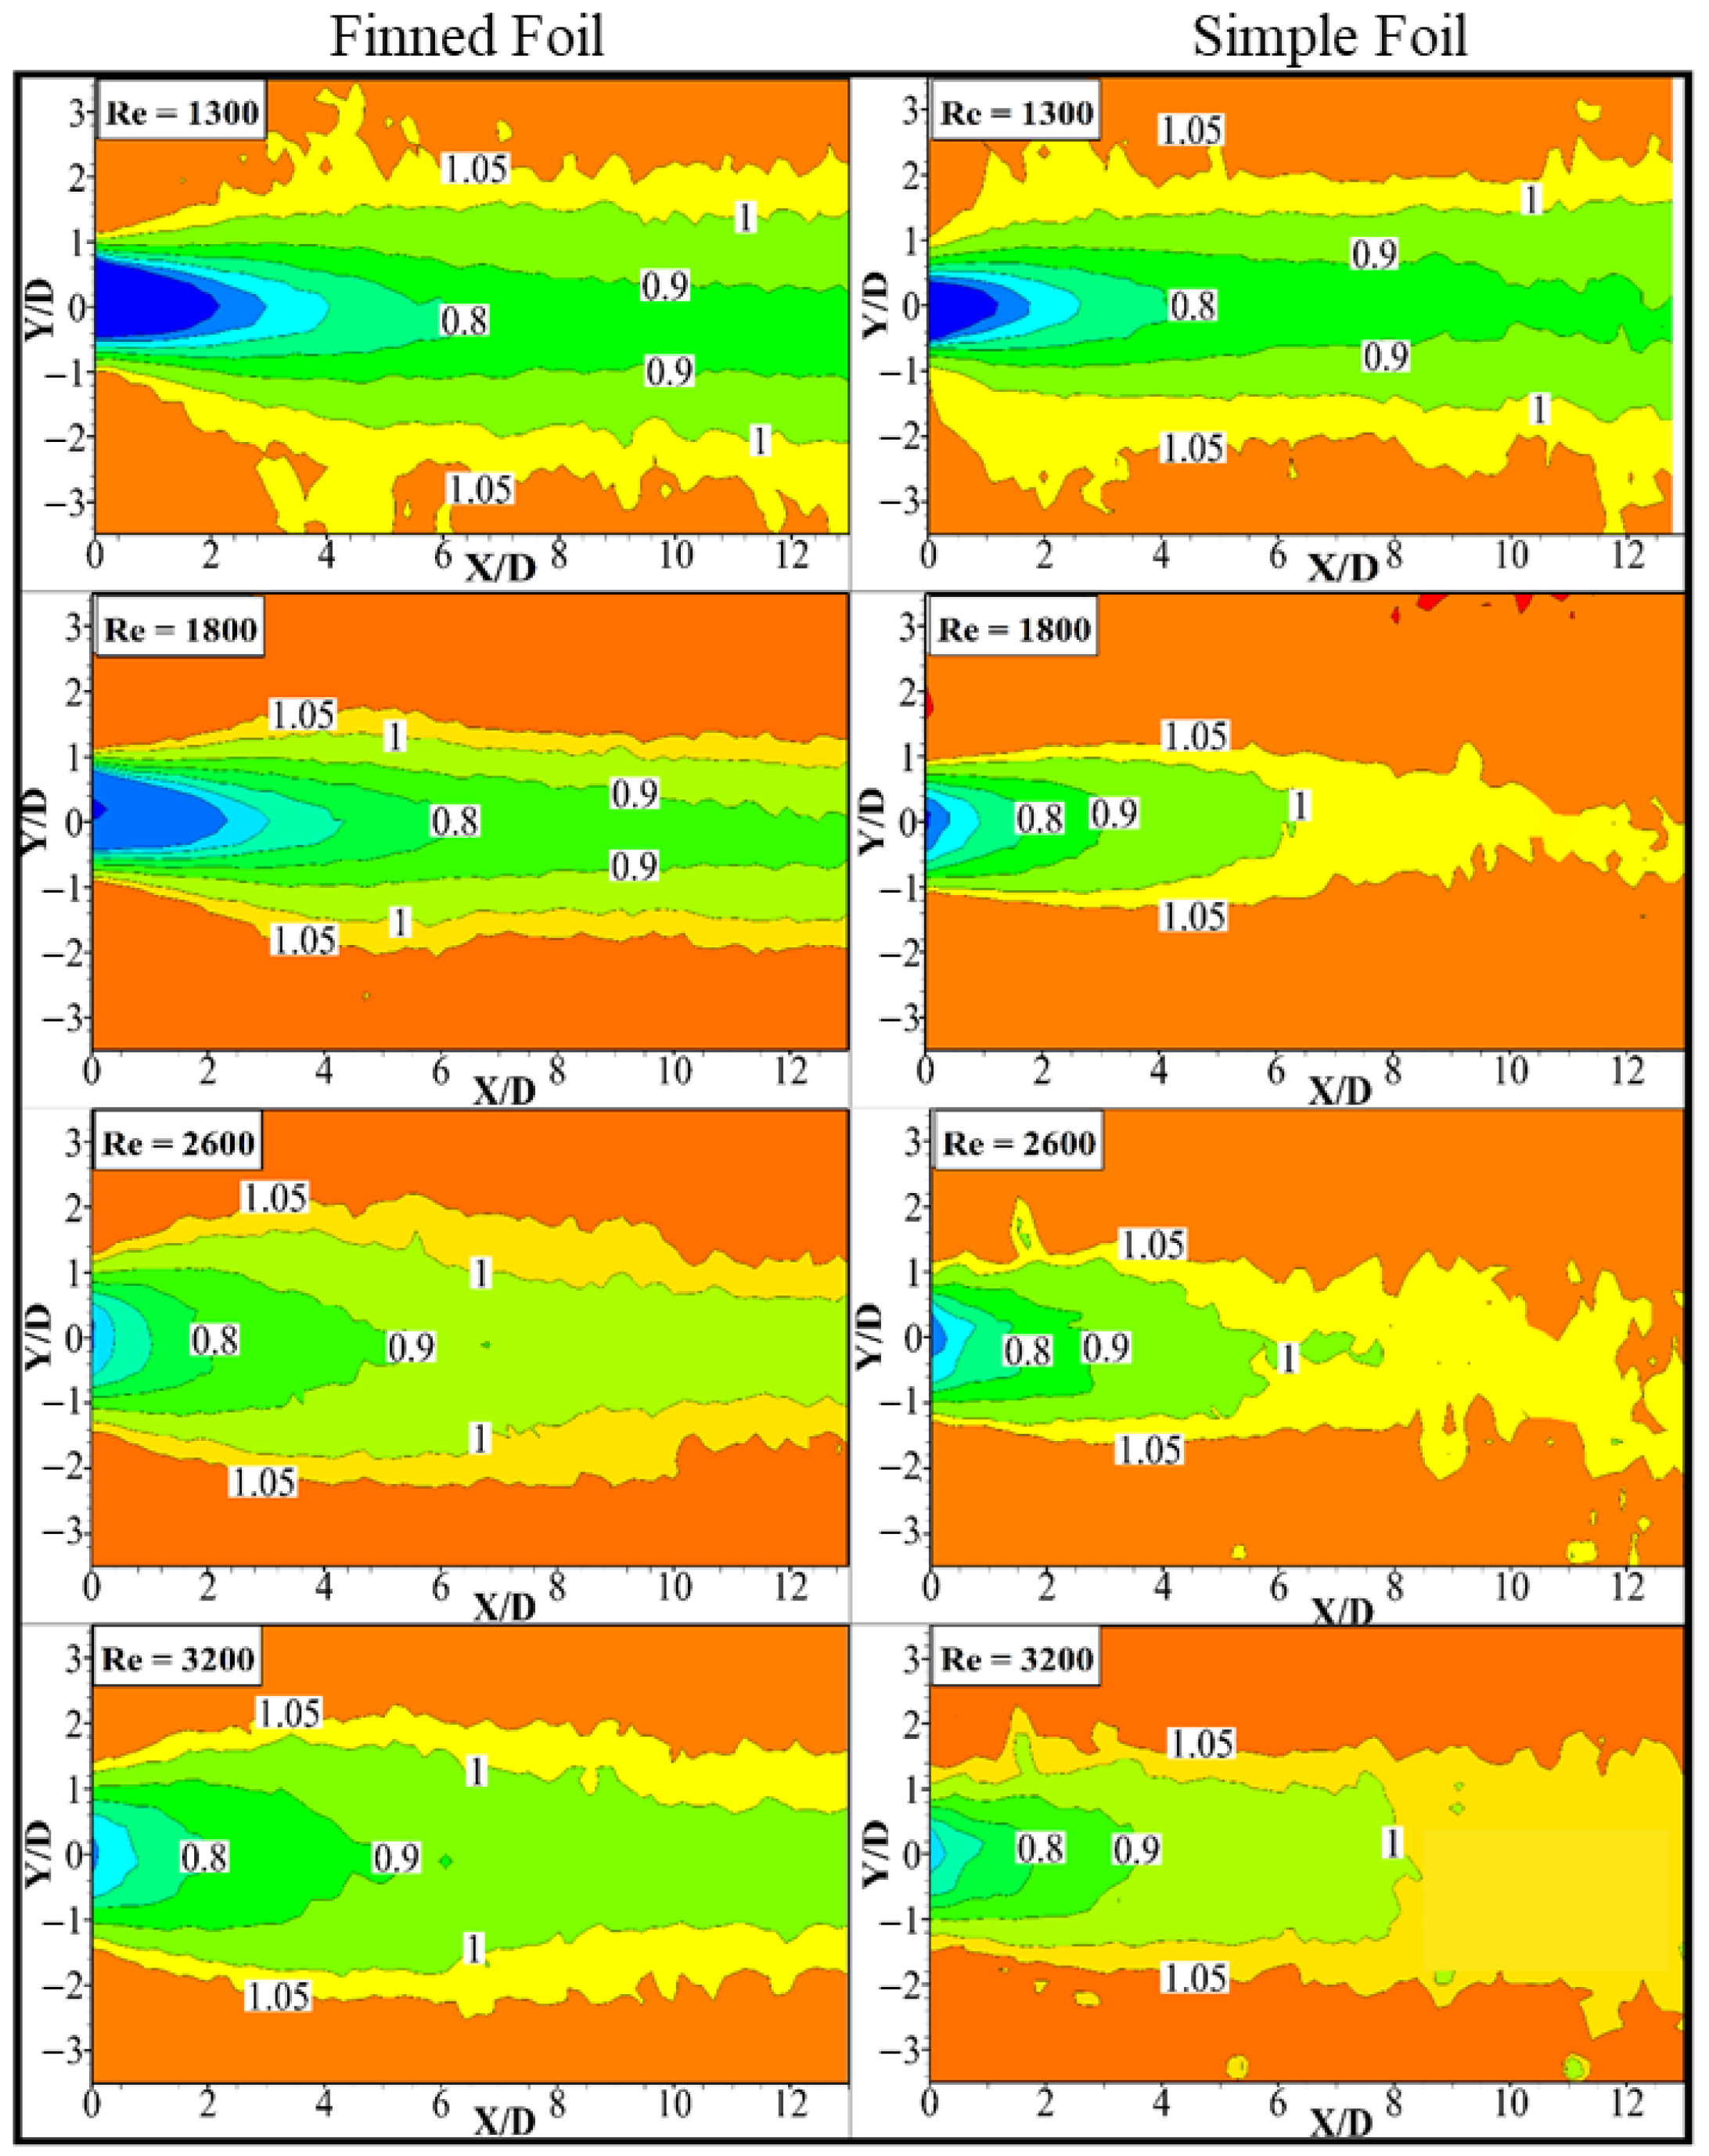
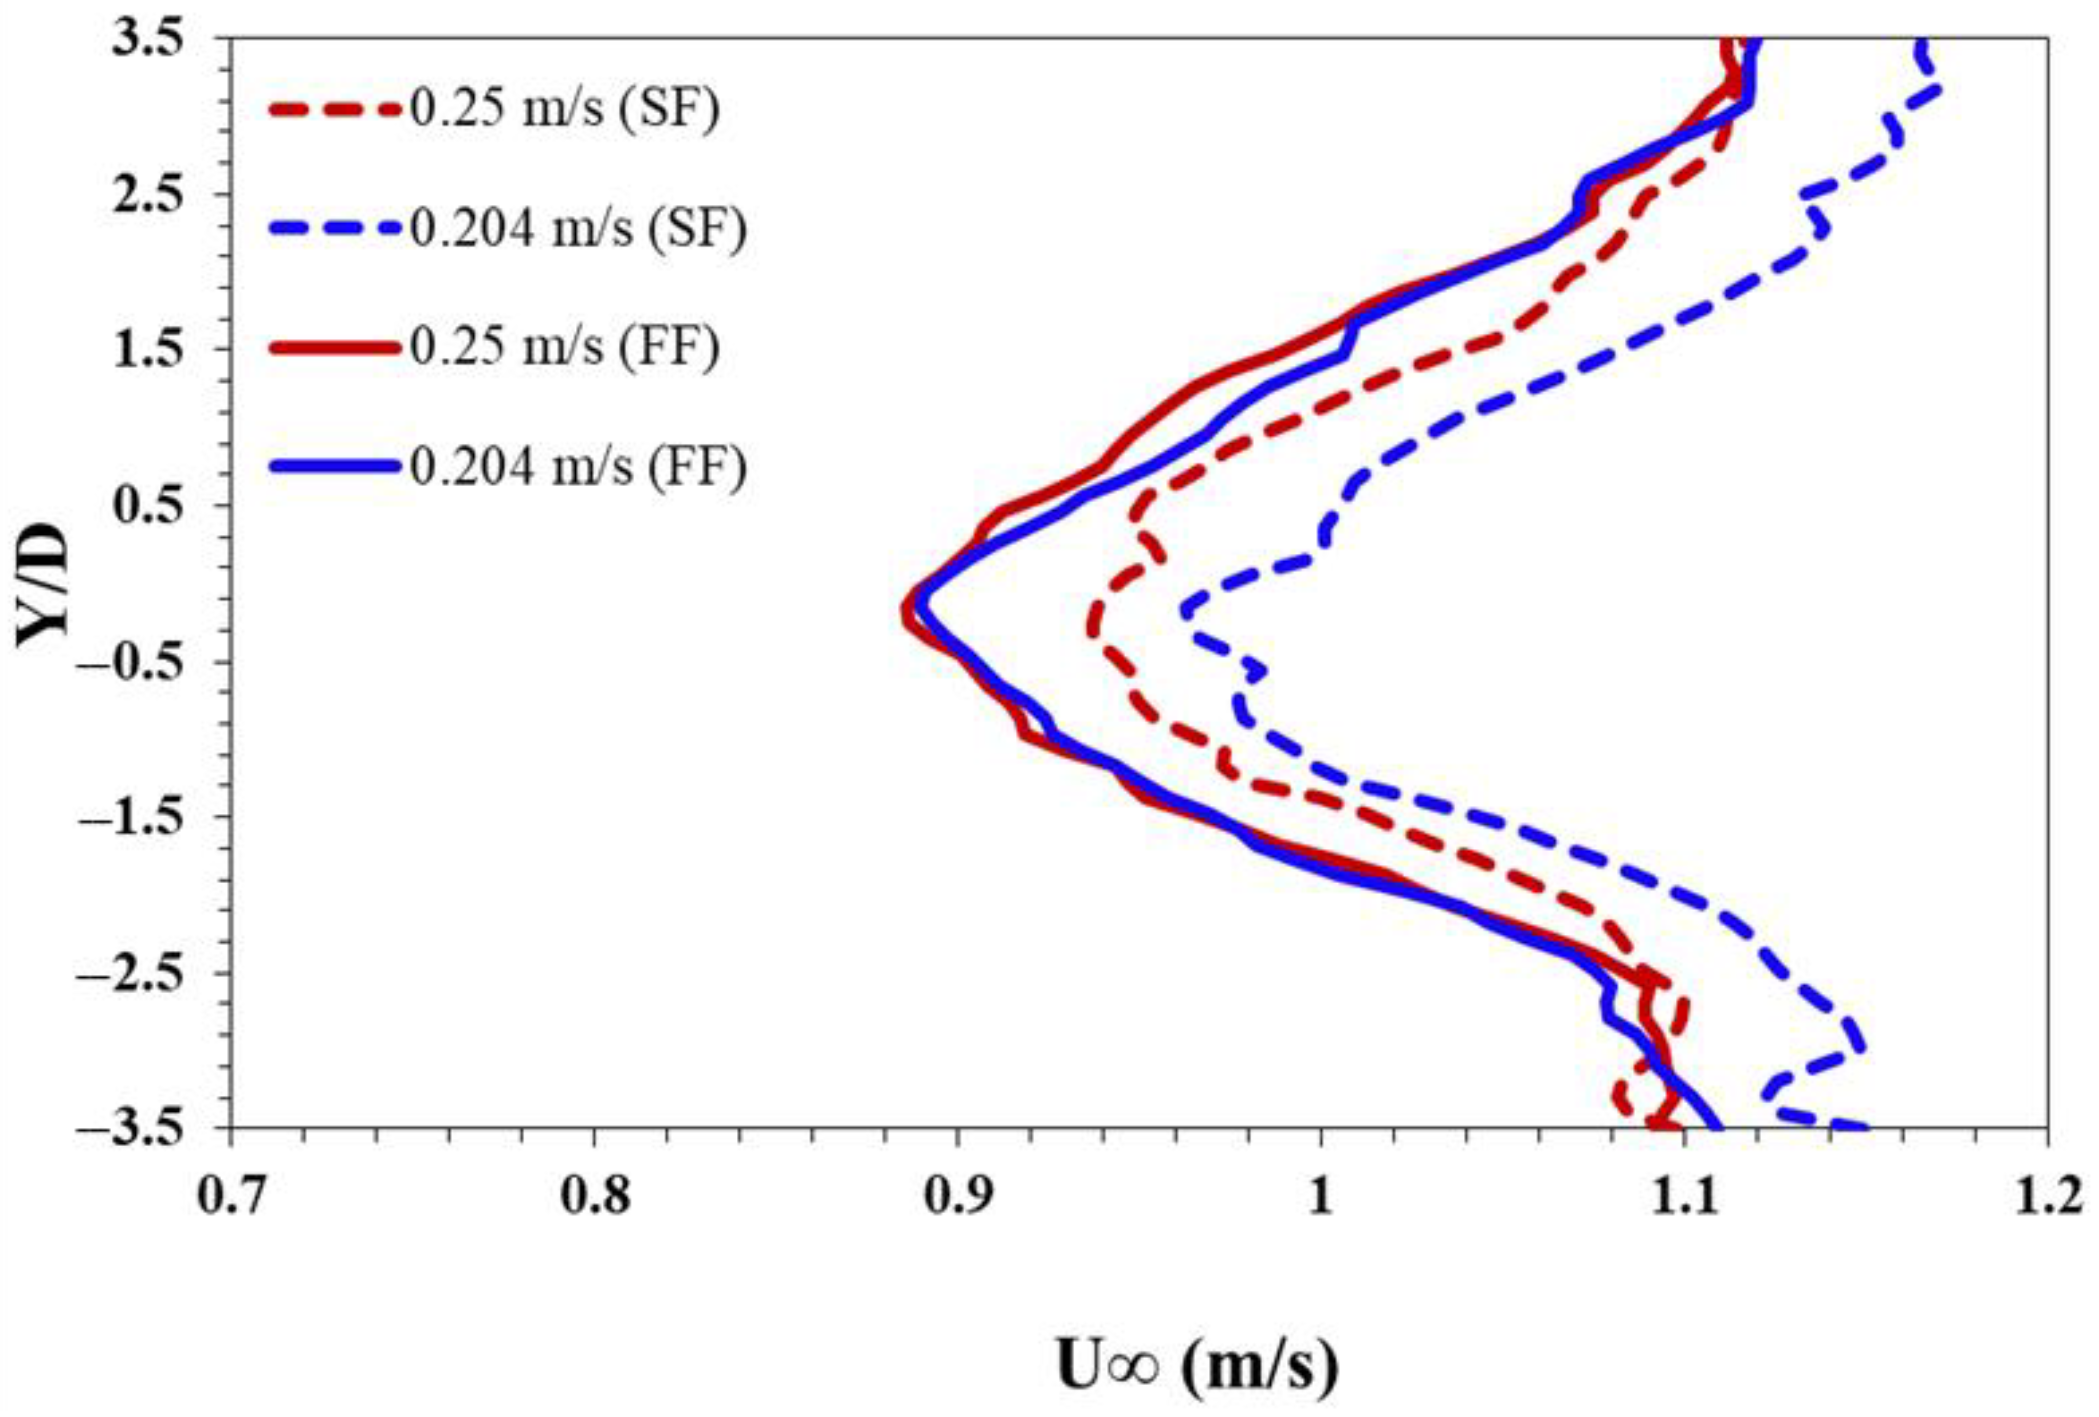
3.3. Mean Streamwise Velocity
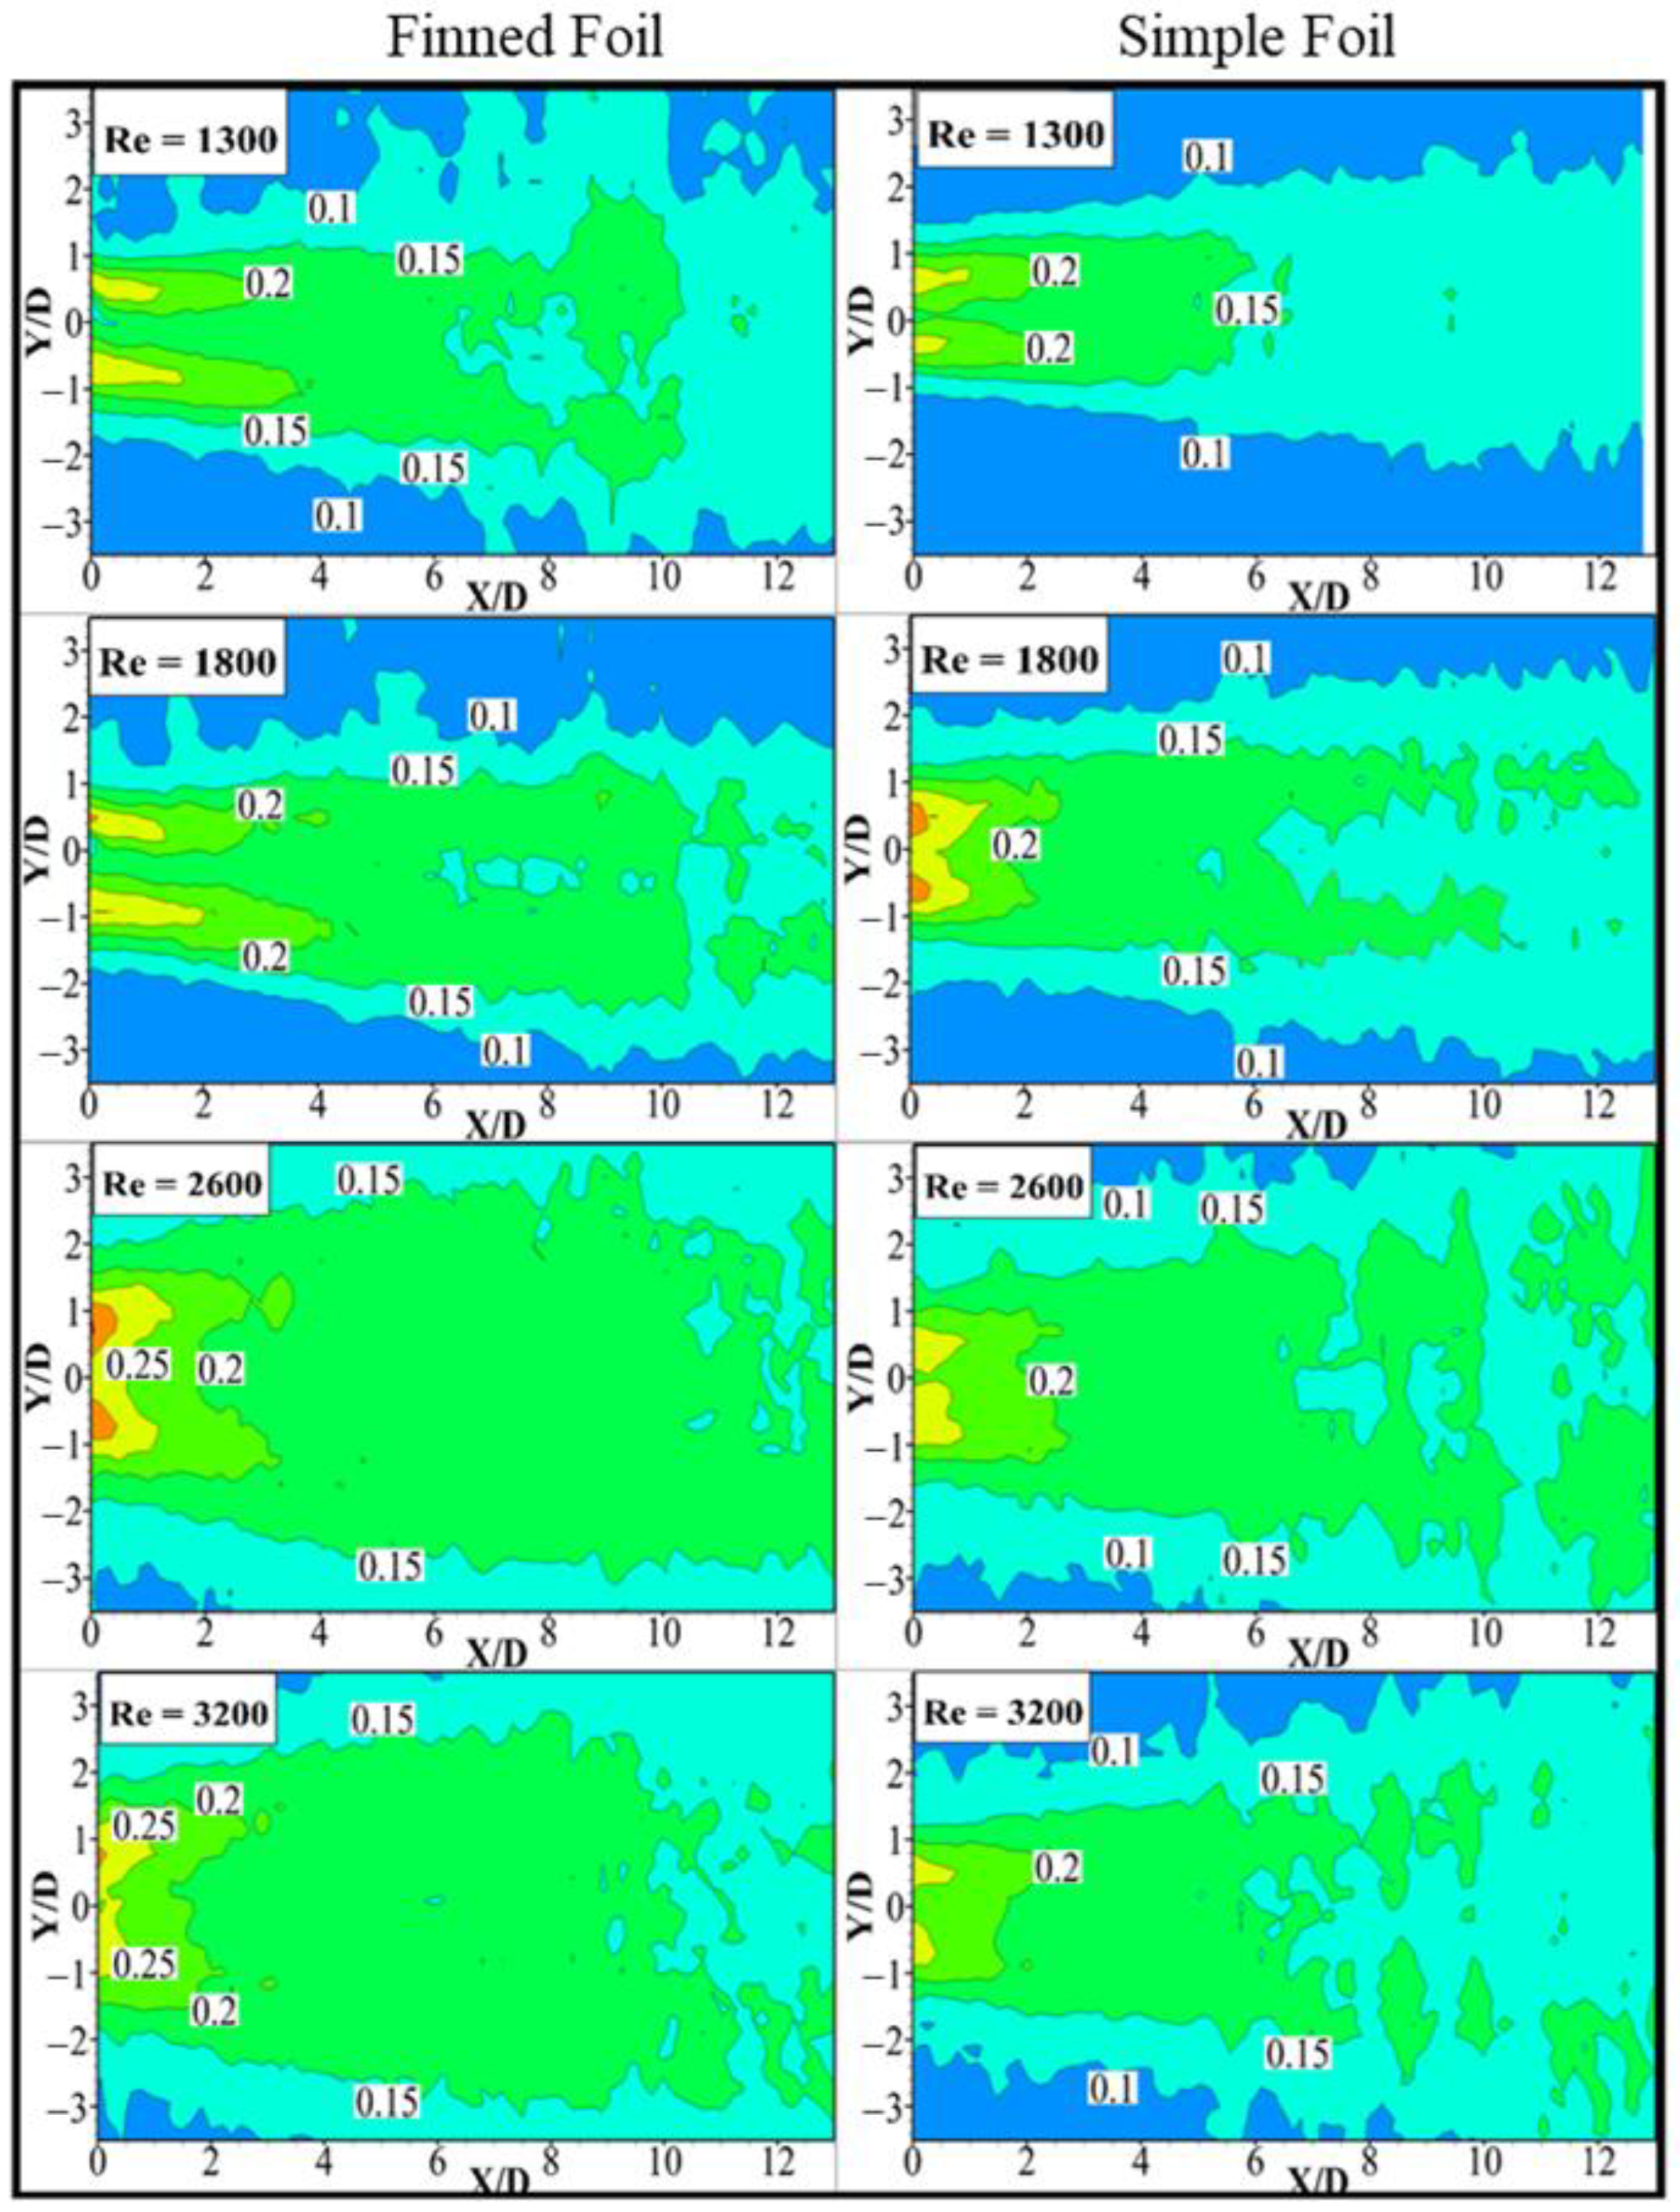
3.4. Root Mean Square (RMS) Streamwise Velocity
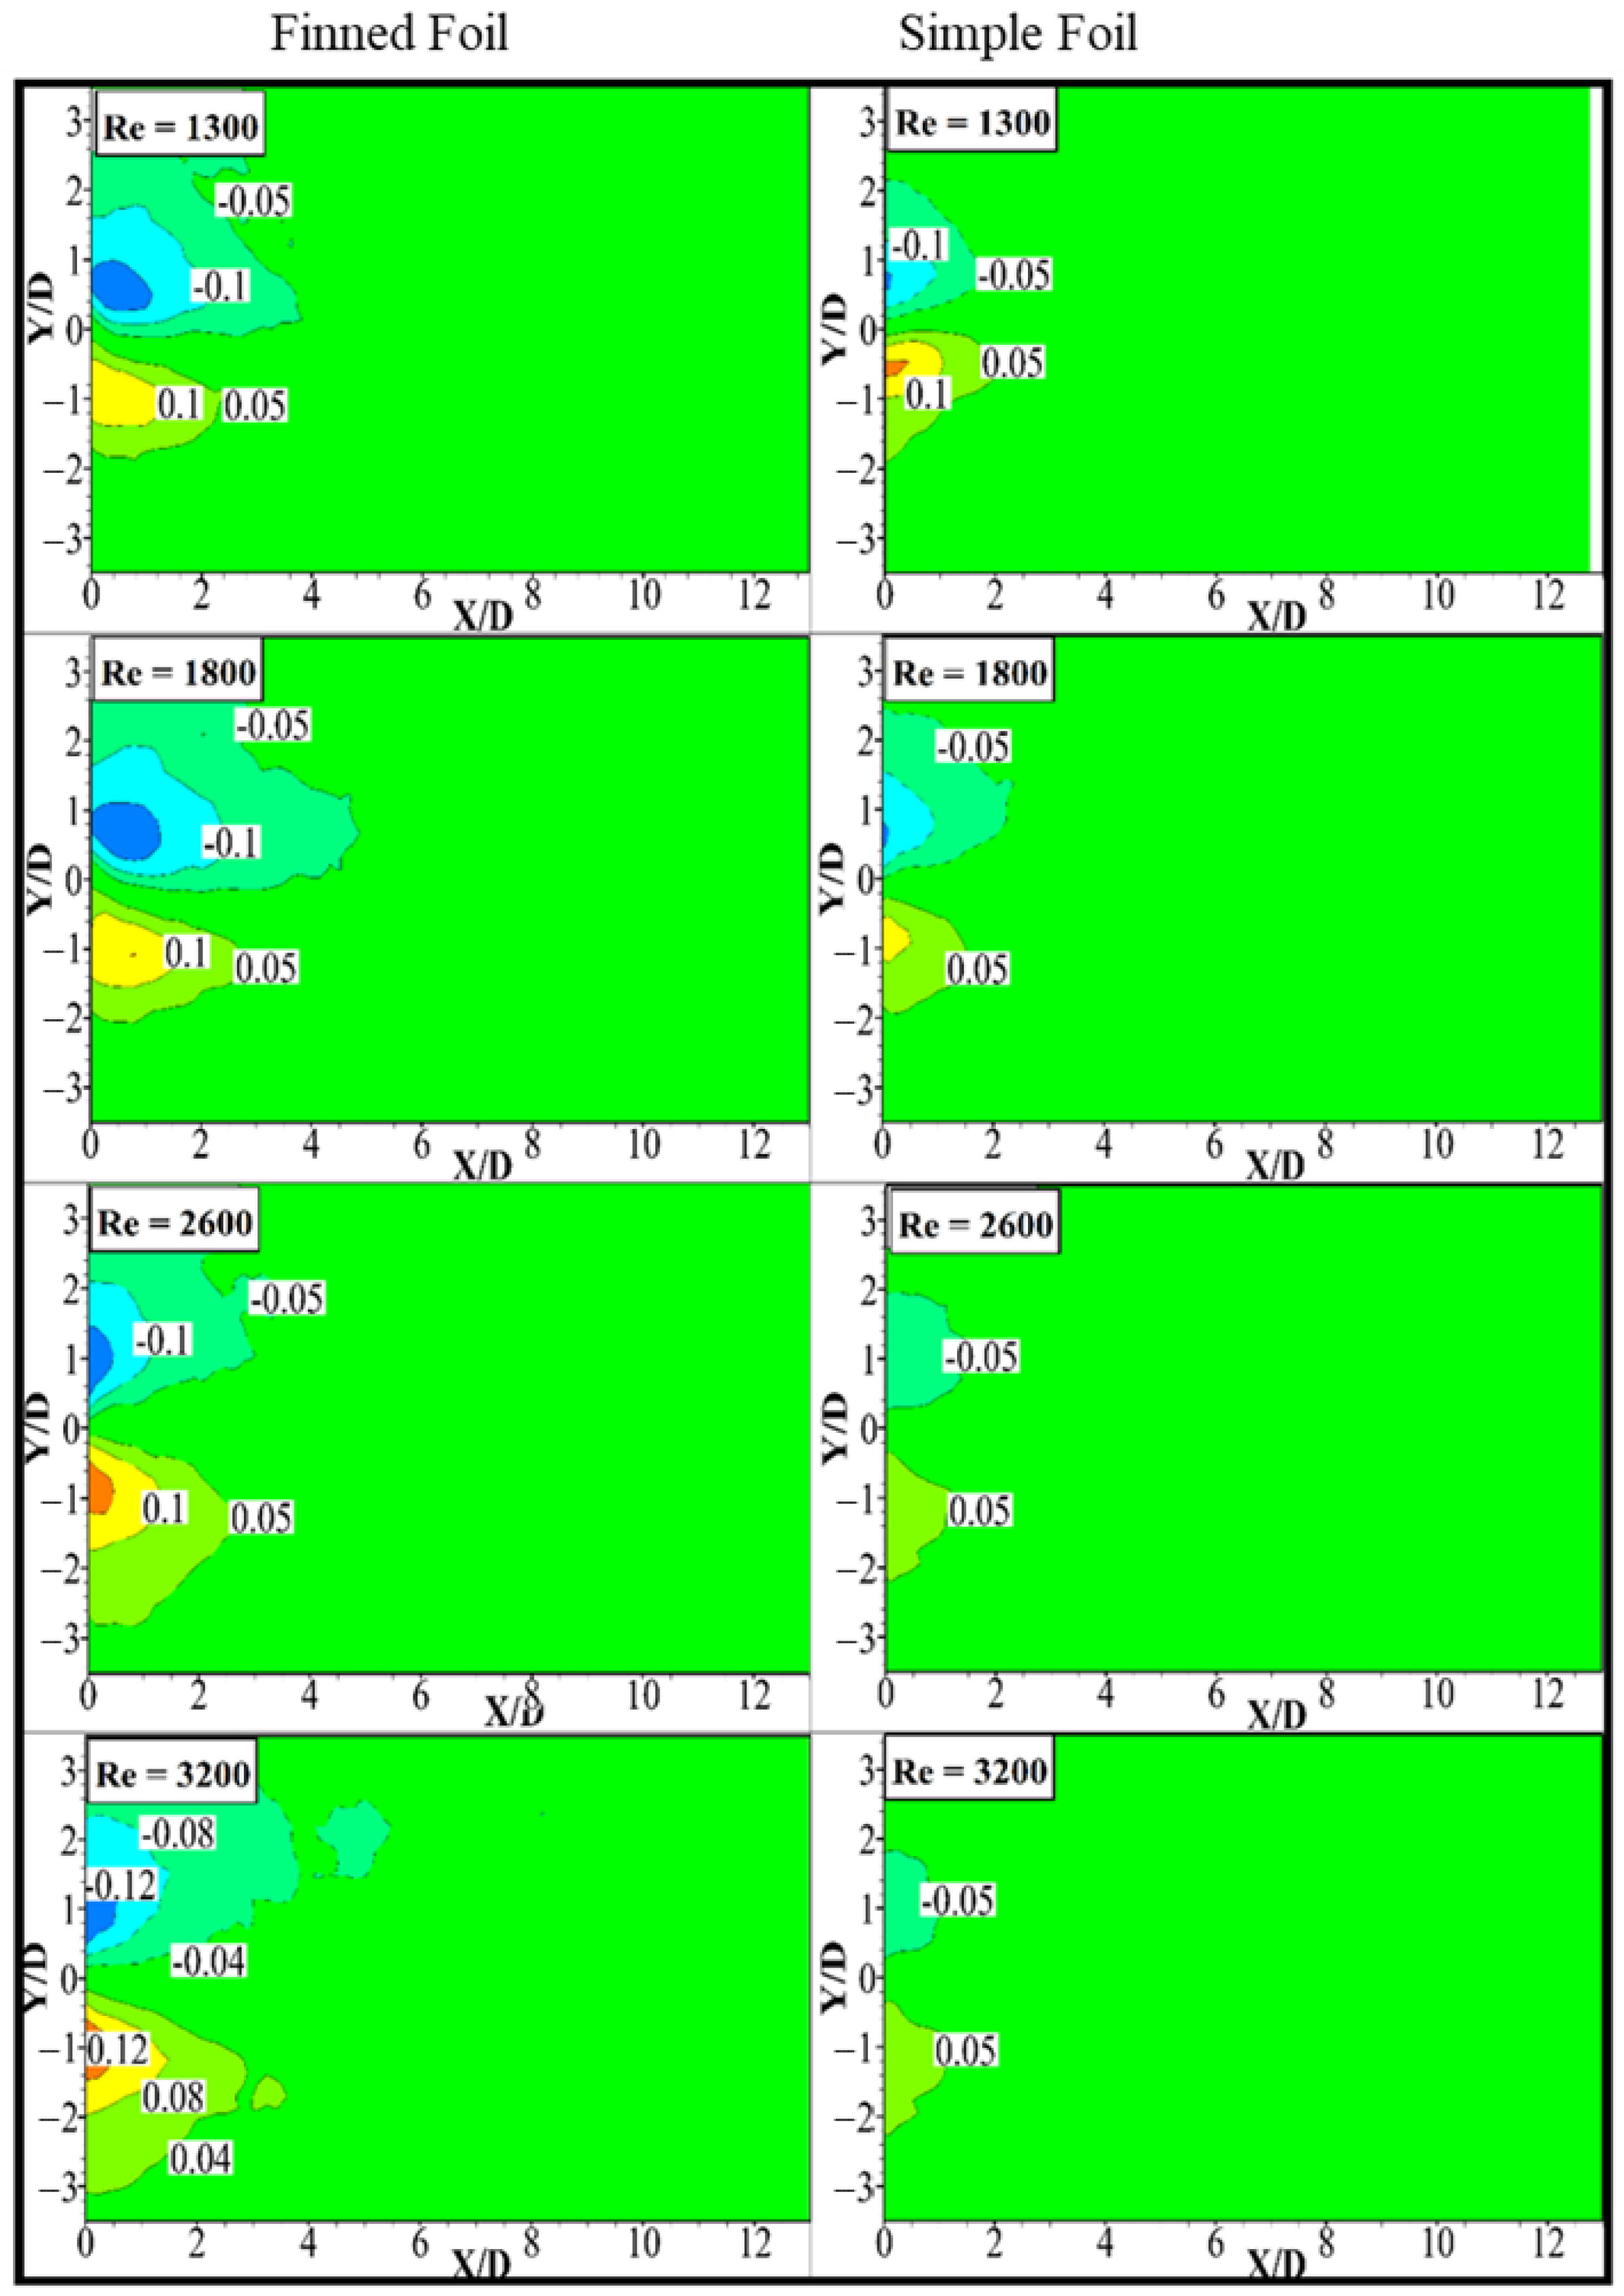
3.5. Mean Transverse Velocity
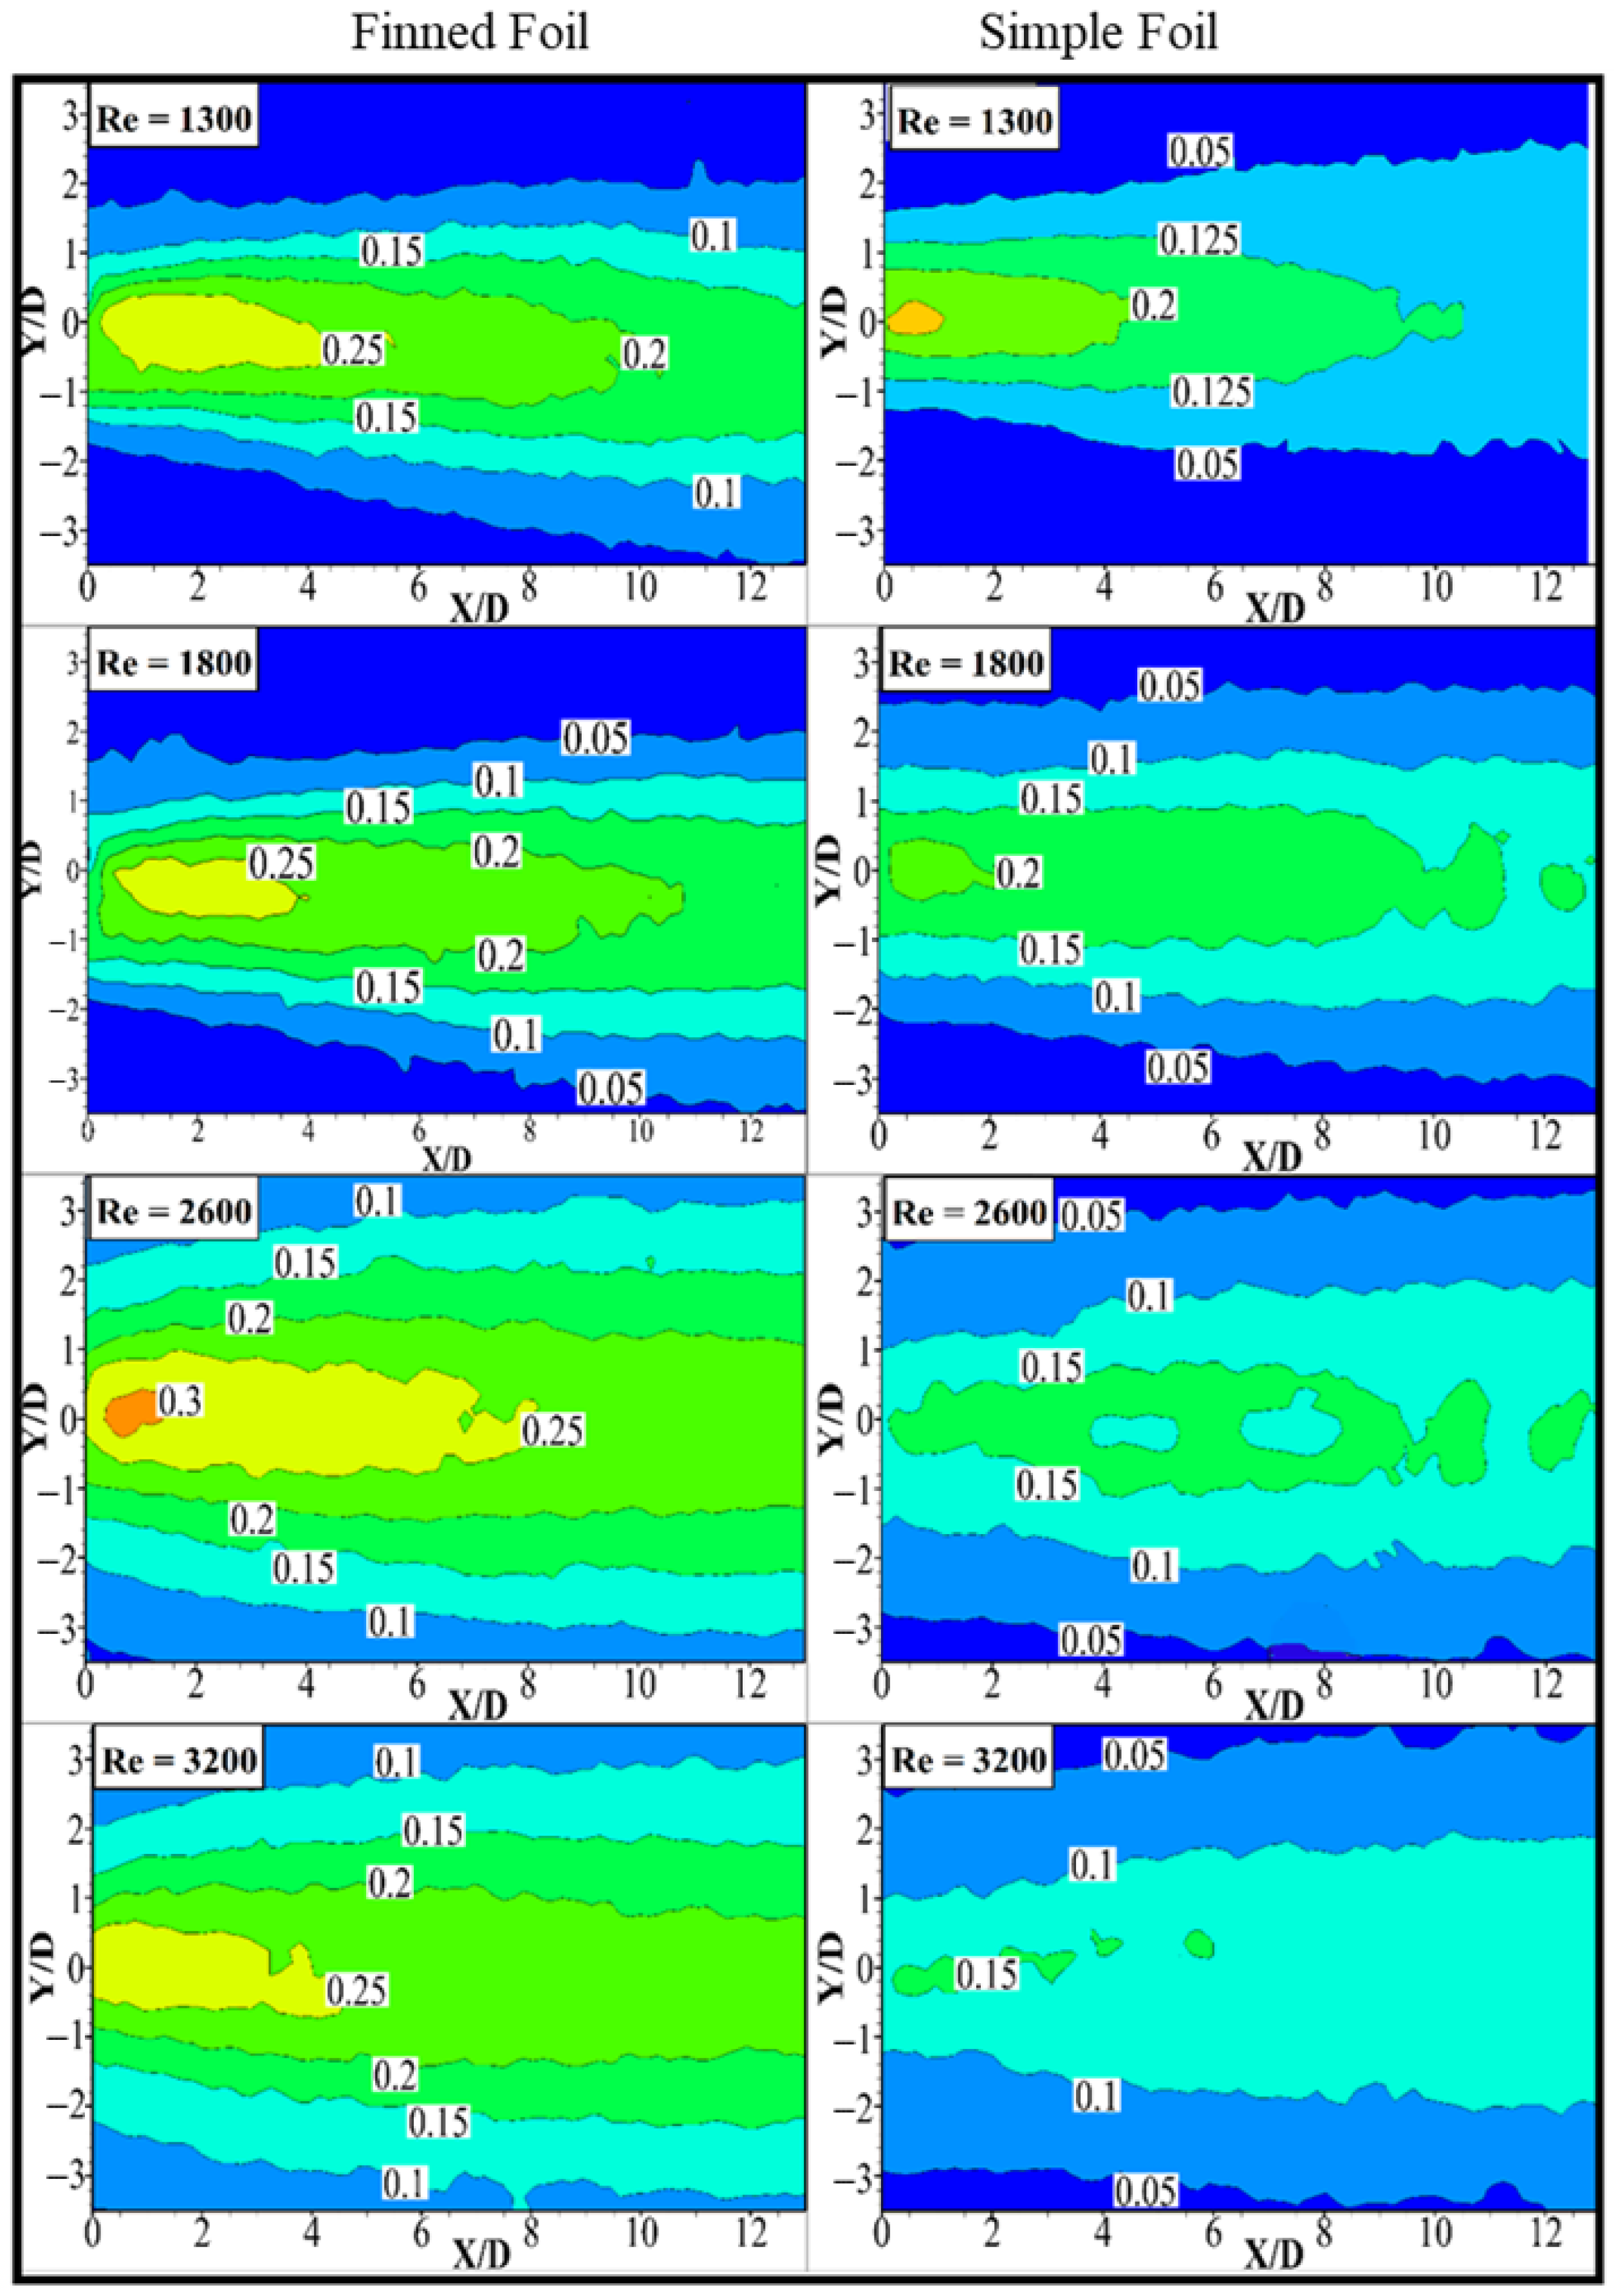
3.6. Root Mean Square (RMS) Transverse Velocity
4. Conclusions
- (a)
- Finned foil demonstrates an initiation of pitching at comparatively low Reynolds numbers than that of the simple foil. For Reynolds numbers where both foils are pitching, the finned foil exhibited a significant increase of 25% in θ compared to the simple foil. The addition of fins may result in strong flow separation; thus, pitching motion occurs at a lower Reynolds number, with a monotonic increase in pitching motion, θ, as the Reynolds number increases. The large θ of the finned foil results in a broader wake-affected region observed behind the finned foil using PIV.
- (b)
- The “f” of the finned foil shows a 21% increase compared to the simple foil for Reynolds number where both foils undergo pitching. This enhanced pitching behavior of the finned foil thus improves the energy harvesting potential of foil due to the addition of fins.
- (c)
- Mean and RMS streamwise velocity variations were analyzed, which shows that the presence of fins led to slower wake recovery and a wider w′ region, which scaled with increased pitching amplitudes. However, at higher velocities, the w′ of finned foil exhibited slight reductions due to a thinner shear region as the flow accelerates for high velocity and the entrainment of high-velocity fluid towards the wake center line by strong vortices.
- (d)
- Transverse RMS velocity contours revealed that pitching foil adds strong transverse velocity components, which reverse their direction after passing the foil. The stronger lateral velocity components induced by the fins, facilitated by enhanced vortex formation, accelerated flow entrainment. This augmented entrainment promoted mixing and wake recovery, thereby increasing energy harvesting potential [2].
- (e)
Author Contributions
Funding
Institutional Review Board Statement
Informed Consent Statement
Data Availability Statement
Acknowledgments
Conflicts of Interest
References
- Paidoussis, M.; Price, S.; de Langre, E. Fluid-Structure Interactions: Cross-Flow-Induced Instabilities; Cambridge University Press: Cambridge, UK, 2010; pp. 1–14. [Google Scholar]
- Mehdipour, I.; Madaro, F.; Rizzi, F.; De Vittorio, M. Comprehensive Experimental Study on Bluff Body Shapes for Vortex-Induced Vibration Piezoelectric Energy Harvesting Mechanisms. Energy Convers. Manag. X 2022, 100174. [Google Scholar] [CrossRef]
- Triantafyllou, M.; Techet, A.; Hover, F. Review of experimental work in biomimetic foils. IEEE J. Ocean. Eng. 2004, 29, 585–594. [Google Scholar] [CrossRef]
- Wang, Z.J. Dissecting Insect Flight. Annu. Rev. Fluid Mech. 2005, 37, 183–210. [Google Scholar] [CrossRef]
- Van Buren, T.; Floryan, D.; Smits, A. Bio-inspired underwater propulsors. arXiv 2018. [Google Scholar] [CrossRef]
- Mannam, N.P.B.; Alam, M.; Krishnankutty, P. Review of biomimetic flexible flapping foil propulsion systems on different planetary bodies. Results Eng. 2020, 8, 100183. [Google Scholar] [CrossRef]
- Anh, P.H.N.; Choi, H.-S.; Huang, J.; Zhang, R.; Kim, J. Study on Oscillatory and Undulatory Motion of Robotic Fish. Appl. Sci. 2024, 14, 3239. [Google Scholar] [CrossRef]
- Liu, J.; Fu, Y.; Liu, X.; Ruan, H. Theoretical Perspectives on Natural and Artificial Micro-swimmers. Acta Mech. Solida Sin. 2021, 34, 783–809. [Google Scholar] [CrossRef]
- Young, J.; Lai, J.C.; Platzer, M.F. A review of progress and challenges in flapping foil power generation. Prog. Aerosp. Sci. 2014, 67, 2–28. [Google Scholar] [CrossRef]
- Sfakiotakis, M.; Lane, D.; Davies, J. Review of fish swimming modes for aquatic locomotion. IEEE J. Ocean. Eng. 1999, 24, 237–252. [Google Scholar] [CrossRef]
- Wen, L.; Lauder, G. Understanding undulatory locomotion in fishes using an inertia-compensated flapping foil robotic device. Bioinspiration Biomim. 2013, 8, 046013. [Google Scholar] [CrossRef]
- Li, G.; Liu, G.; Leng, D.; Fang, X.; Li, G.; Wang, W. Underwater Undulating Propulsion Biomimetic Robots: A Review. Biomimetics 2023, 8, 318. [Google Scholar] [CrossRef] [PubMed]
- Shi, L.; Zhang, D.; Bayeul-Lainé, A.-C.; Coutier-Delgosha, O. Effect of pitching angle, pitch-pivot-point, blade camber and de-flected sharp leading edge on performance and vortical flows of reversed pitching airfoils. Ocean Eng. 2023, 280, 114637. [Google Scholar] [CrossRef]
- Shah, M.M.; Mahmood, R.; Latif, U.; Uddin, E.; Munir, A.; Zhao, M.; Riaz, H.H. Experimental investigation of the wake of tandem cylinders using pivoted flapping mechanism for piezoelectric flag. Ocean Eng. 2024, 310, 118587. [Google Scholar] [CrossRef]
- Veilleux, J.-C.; Dumas, G. Numerical optimization of a fully-passive flapping-airfoil turbine. J. Fluids Struct. 2017, 70, 102–130. [Google Scholar] [CrossRef]
- McKinney, W.; DeLaurier, J. Wingmill: An Oscillating-Wing Windmill. J. Energy 1981, 5, 109–115. [Google Scholar] [CrossRef]
- Wu, X.; Zhang, X.; Tian, X.; Li, X.; Lu, W. A review on fluid dynamics of flapping foils. Ocean Eng. 2020, 195, 106712. [Google Scholar] [CrossRef]
- Kinsey, T.; Dumas, G. Parametric Study of an Oscillating Airfoil in a Power-Extraction Regime. AIAA J. 2008, 46, 1318–1330. [Google Scholar] [CrossRef]
- Li, X.; Feng, L.-H.; Li, Z.-Y. Flow mechanism for the effect of pivot point on the aerodynamic characteristics of a pitching airfoil and its manipulation. Phys. Fluids 2019, 31, 087108. [Google Scholar] [CrossRef]
- Ashraf, M.A.; Young, J.; Lai, J.C.S. Oscillation frequency and amplitude effects on plunging airfoil propulsion and flow periodicity. AIAA J. 2012, 50, 2308–2324. [Google Scholar] [CrossRef]
- Choi, J.; Colonius, T.; Williams, D.R. Surging and plunging oscillations of an airfoil at low Reynolds number. J. Fluid. Mech. 2015, 763, 237–253. [Google Scholar] [CrossRef]
- Elarbi, E. Plunging Frequency-Amplitude Effects on Propulsion Performance of Flapping NACA 0012 Wing. In Proceedings of the 51st AIAA Aerospace Sciences Meeting Including the New Horizons Forum and Aerospace Exposition, Grapevine, TX, USA, 7–10 January 2013; p. 796. [Google Scholar]
- Lu, K.; Xie, Y.; Zhang, D. Numerical study of large amplitude, nonsinusoidal motion and camber effects on pitching airfoil propulsion. J. Fluids Struct. 2013, 36, 184–194. [Google Scholar] [CrossRef]
- Rahromostaqim, M.; Posa, A.; Balaras, E. Numerical Investigation of the Performance of Pitching Airfoils at High Amplitudes. AIAA J. 2016, 54, 2221–2232. [Google Scholar] [CrossRef]
- Guillaud, N.; Balarac, G.; Goncalvès, E. Large Eddy Simulations on a pitching airfoil: Analysis of the reduced frequency influence. Comput. Fluids 2017, 161, 1–13. [Google Scholar] [CrossRef]
- Hover, F.; Haugsdal, Ø.; Triantafyllou, M. Effect of angle of attack profiles in flapping foil propulsion. J. Fluids Struct. 2004, 19, 37–47. [Google Scholar] [CrossRef]
- Thaweewat, N.; Phoemsapthawee, S.; Juntasaro, V. Semi-active flapping foil for marine propulsion. Ocean Eng. 2018, 147, 556–564. [Google Scholar] [CrossRef]
- Bøckmann, E.; Steen, S. Experiments with actively pitch-controlled and spring-loaded oscillating foils. Appl. Ocean Res. 2014, 48, 227–235. [Google Scholar] [CrossRef]
- Patel, A.; Bhardwaj, R. Propulsive performance of a two-dimensional elliptic foil undergoing interlinked pitching and heaving. Phys. Fluids 2022, 34, 111904. [Google Scholar] [CrossRef]
- Mei, L.; Zhou, J.; Yu, D.; Shi, W.; Pan, X.; Li, M. Parametric Analysis for Underwater Flapping Foil Propulsor. Water 2021, 13, 2103. [Google Scholar] [CrossRef]
- Kant, R.; Bhattacharyya, A.; Siddiqui, M.A. Hydrodynamic performance of pitching foils with two leading-edge protuberances. Ocean Eng. 2024, 309, 118470. [Google Scholar] [CrossRef]
- Ma, X.; Zhou, S. A review of flow-induced vibration energy harvesters. Energy Convers. Manag. 2022, 254, 115223. [Google Scholar] [CrossRef]
- Wang, Z.; Du, L.; Zhao, J.; Sun, X. Structural response and energy extraction of a fully passive flapping foil. J. Fluids Struct. 2017, 72, 96–113. [Google Scholar] [CrossRef]
- Peng, Z.; Zhu, Q. Energy harvesting through flow-induced oscillations of a foil. Phys. Fluids 2009, 21, 123602. [Google Scholar] [CrossRef]
- Qadri, M.M.; Zhao, F.; Tang, H. Fluid-structure interaction of a fully passive flapping foil for flow energy extraction. Int. J. Mech. Sci. 2020, 177, 105587. [Google Scholar] [CrossRef]
- Boudreau, M.; Dumas, G.; Rahimpour, M.; Oshkai, P. Experimental investigation of the energy extraction by a fully-passive flapping-foil hydrokinetic turbine prototype. J. Fluids Struct. 2018, 82, 446–472. [Google Scholar] [CrossRef]
- Boudreau, M.; Picard-Deland, M.; Dumas, G. A parametric study and optimization of the fully-passive flapping-foil turbine at high Reynolds number. Renew. Energy 2020, 146, 1958–1975. [Google Scholar] [CrossRef]
- Duarte, L.; Dellinger, N.; Dellinger, G.; Ghenaim, A.; Terfous, A. Experimental investigation of the dynamic behaviour of a fully passive flapping foil hydrokinetic turbine. J. Fluids Struct. 2019, 88, 1–12. [Google Scholar] [CrossRef]
- Das, A.; Shukla, R.K.; Govardhan, R.N. Existence of a sharp transition in the peak propulsive efficiency of a low- pitching foil. J. Fluid Mech. 2016, 800, 307–326. [Google Scholar] [CrossRef]
- Koochesfahani, M.M. Vortical patterns in the wake of an oscillating airfoil. AIAA J. 1989, 27, 1200–1205. [Google Scholar] [CrossRef]
- Godoy-Diana, R.; Aider, J.-L.; Wesfreid, J.E. Transitions in the wake of a flapping foil. Phys. Rev. E 2008, 77, 016308. [Google Scholar] [CrossRef]
- Sarkar, S.; Venkatraman, K. Numerical simulation of thrust generating flow past a pitching airfoil. Comput. Fluids 2006, 35, 16–42. [Google Scholar] [CrossRef]
- Deng, J.; Sun, L.; Shao, X. Dynamical features of the wake behind a pitching foil. Phys. Rev. E 2015, 92, 063013. [Google Scholar] [CrossRef] [PubMed]
- Ijaz, A.; Manzoor, S.; Ebrahem, M.; Uddin, E.; Sheikh, N. VIV and forced convection response of a freely oscillating cylinder to a single impulse perturbation of varying intensity. Ocean Eng. 2023, 280, 114515. [Google Scholar] [CrossRef]
- Bratt, J. Flow Patterns in the Wake of an Oscillating Aerofoil; Aerenauticl Research Council: Teddington, UK, 1950. [Google Scholar]
- Kármán, T.; Burgers, J. General Aerodynamic Theory: Perfect Fluids; Springer: Berlin, Germany, 1935. [Google Scholar]
- Schnipper, T.; Andersen, A.; Bohr, T. Vortex wakes of a flapping foil. J. Fluid Mech. 2009, 633, 411–423. [Google Scholar] [CrossRef]
- Ashraf, I.; Agrawal, A.; Khan, M.H.; Sooraj, P.; Srivastava, A.; Sharma, A. Thrust generation and wake structure for flow across a pitching airfoil at low Reynolds number. Sadhana 2015, 40, 2367–2379. [Google Scholar] [CrossRef]
- Alam, M.; Muhammad, Z. Dynamics of flow around a pitching hydrofoil. J. Fluids Struct. 2020, 99, 103151. [Google Scholar] [CrossRef]
- Muhammad, Z.; Alam, M.; Noack, B.R. Efficient thrust enhancement by modified pitching motion. J. Fluid. Mech. 2022, 933, A13. [Google Scholar] [CrossRef]
- Liu, Z.; Qu, H.; Shi, H. Numerical study on hydrodynamic performance of a fully passive flow-driven pitching hydrofoil. Ocean Eng. 2019, 177, 70–84. [Google Scholar] [CrossRef]
- Mackowski, A.W.; Williamson, C.H.K. Direct measurement of thrust and efficiency of an airfoil undergoing pure pitching. J. Fluid Mech. 2015, 765, 524–543. [Google Scholar] [CrossRef]
- Lindsey, C.C. 1—Form, Function, and Locomotory Habits in Fish. In Fish Physiology; Hoar, W.S., Randall, D.J., Eds.; Academic Press: New York, NY, USA, 1978; pp. 1–100. [Google Scholar]
- Chao, L.-M.; Cao, Y.-H.; Pan, G. A review of underwater bio-mimetic propulsion: Cruise and fast-start. Fluid Dyn. Res. 2017, 49, 044501. [Google Scholar] [CrossRef]
- Fish, F.; Lauder, G. PASSIVE AND ACTIVE FLOW CONTROL BY SWIMMING FISHES AND MAMMALS. Annu. Rev. Fluid Mech. 2006, 38, 193–224. [Google Scholar] [CrossRef]
- Lauder, G.V.; Flammang, B.; Alben, S. Passive Robotic Models of Propulsion by the Bodies and Caudal Fins of Fish. Integr. Comp. Biol. 2012, 52, 576–587. [Google Scholar] [CrossRef] [PubMed]
- Yeh, P.D.; Li, Y.; Alexeev, A. Efficient swimming using flexible fins with tapered thickness. Phys. Rev. Fluids 2017, 2, 102101. [Google Scholar] [CrossRef]
- Zhu, H.; Liu, W. Wake structure and evolution of flow over a finned circular cylinder. Phys. Fluids 2021, 33, 073613. [Google Scholar] [CrossRef]
- Srinivasa, R.N.; Sen, S.; Har, C. Effect of flexural stiffness distribution of a fin on propulsion performance. Mech. Mach. Theory 2018, 129, 218–231. [Google Scholar] [CrossRef]
- Liu, G.; Ren, Y.; Dong, H.; Akanyeti, O.; Liao, J.C.; Lauder, G.V. Computational analysis of vortex dynamics and performance enhancement due to body–fin and fin–fin interactions in fish-like locomotion. J. Fluid Mech. 2017, 829, 65–88. [Google Scholar] [CrossRef]
- Zhu, H.; Gao, Y. Hydrokinetic energy harvesting from flow-induced vibration of a circular cylinder with two symmetrical fin-shaped strips. Energy 2018, 165, 1259–1281. [Google Scholar] [CrossRef]
- Zhu, H.; Zhou, T. Flow around a circular cylinder attached with a pair of fin-shaped strips. Ocean Eng. 2019, 190, 106484. [Google Scholar] [CrossRef]
- Maia, A.; Lauder, G.V.; Wilga, C.D. Hydrodynamic function of dorsal fins in spiny dogfish and bamboo sharks during steady swimming. J. Exp. Biol. 2017, 220, 3967–3975. [Google Scholar] [CrossRef]
- White, F.M. Fluid Mechanics; McGraw Hill: New York, NY, USA, 2011. [Google Scholar]
- Latif, U.; Dowell, E.H.; Uddin, E.; Younis, M.; Frisch, H. Comparative analysis of flag based energy harvester undergoing extraneous induced excitation. Energy 2024, 295, 130995. [Google Scholar] [CrossRef]
- Latif, U.; Uddin, E.; Younis, M.; Aslam, J.; Ali, Z.; Sajid, M.; Abdelkefi, A. Experimental electro-hydrodynamic investigation of flag-based energy harvesting in the wake of inverted C-shape cylinder. Energy 2021, 215, 119195. [Google Scholar] [CrossRef]
- Hu, S.-L.J.; Yang, W.; Li, H. A robust high-resolution method for the time–frequency analysis of vortex-induced-vibration signals. J. Fluids Struct. 2014, 51, 255–280. [Google Scholar] [CrossRef]
- Ijaz, A.; Manzoor, S.; Younis, Y.; Ebrahem, M.; Ali, M. Effect of frequency lock-in on the dynamic response and heat transfer from a circular cylinder at low Reynolds number. Ocean Eng. 2021, 238, 109708. [Google Scholar] [CrossRef]
- Younis, M.Y.; Alam, M.M.; Zhou, Y. Flow around two non-parallel tandem cylinders. Phys. Fluids 2016, 28, 125106. [Google Scholar] [CrossRef]
- Anderson, J.M.; Streitlien, K.; Barrett, D.S.; Triantafyllou, M.S. Oscillating foils of high propulsive efficiency. J. Fluid Mech. 1998, 360, 41–72. [Google Scholar] [CrossRef]
- Uddin, E.; Huang, W.-X.; Sung, H.J. Actively flapping tandem flexible flags in a viscous flow. J. Fluid Mech. 2015, 780, 120–142. [Google Scholar] [CrossRef]
- Latif, U.; Younis, M.; Uddin, E.; Ali, Z.; Mubashar, A.; Abdelkefi, A. Impact of solid and hollow bluff bodies on the performance and dynamics of flag-based energy harvester. Sustain. Energy Technol. Assess. 2023, 55, 102882. [Google Scholar] [CrossRef]


| Re | Pitching Amplitude | Percentage Increase | ||
|---|---|---|---|---|
| Finned Foil | Simple Foil | |||
| 1 | 1300 | 0 | 0 | 0 |
| 2 | 1500 | 0 | 0 | 0 |
| 3 | 1800 | 12.8 | 0 | 100 |
| 4 | 2000 | 13.8 | 0 | 100 |
| 5 | 2200 | 14.6 | 0 | 100 |
| 6 | 2400 | 15.2 | 11.8 | 28.8 |
| 7 | 2600 | 15.4 | 12.4 | 24.2 |
| 8 | 2900 | 15.8 | 13 | 21.5 |
| 9 | 3200 | 16.6 | 13.2 | 25.8 |
| Sr. No. | Re | Pitching Amplitude | Percentage Increase | |
|---|---|---|---|---|
| Finned Foil | Simple Foil | |||
| 1 | 1300 | 0 | 0 | 0 |
| 2 | 1500 | 0 | 0 | 0 |
| 3 | 1800 | 1.22 | 0 | 100 |
| 4 | 2000 | 1.31 | 0 | 100 |
| 5 | 2200 | 1.47 | 0 | 100 |
| 6 | 2400 | 1.62 | 1.36 | 19.1 |
| 7 | 2600 | 1.69 | 1.37 | 23.4 |
| 8 | 2900 | 1.84 | 1.5 | 22.7 |
| 9 | 3200 | 1.93 | 1.6 | 20.6 |
Disclaimer/Publisher’s Note: The statements, opinions and data contained in all publications are solely those of the individual author(s) and contributor(s) and not of MDPI and/or the editor(s). MDPI and/or the editor(s) disclaim responsibility for any injury to people or property resulting from any ideas, methods, instructions or products referred to in the content. |
© 2025 by the authors. Licensee MDPI, Basel, Switzerland. This article is an open access article distributed under the terms and conditions of the Creative Commons Attribution (CC BY) license (https://creativecommons.org/licenses/by/4.0/).
Share and Cite
Ikram, F.; Younis, M.Y.; Chuddher, B.A.; Latif, U.; Mushtaq, H.; Afzal, K.; Awan, M.A.; Ijaz, A.; Bashir, N. Impact of Biomimetic Fin on Pitching Characteristics of a Hydrofoil. Biomimetics 2025, 10, 462. https://doi.org/10.3390/biomimetics10070462
Ikram F, Younis MY, Chuddher BA, Latif U, Mushtaq H, Afzal K, Awan MA, Ijaz A, Bashir N. Impact of Biomimetic Fin on Pitching Characteristics of a Hydrofoil. Biomimetics. 2025; 10(7):462. https://doi.org/10.3390/biomimetics10070462
Chicago/Turabian StyleIkram, Faraz, Muhammad Yamin Younis, Bilal Akbar Chuddher, Usman Latif, Haroon Mushtaq, Kamran Afzal, Muhammad Asif Awan, Asad Ijaz, and Noman Bashir. 2025. "Impact of Biomimetic Fin on Pitching Characteristics of a Hydrofoil" Biomimetics 10, no. 7: 462. https://doi.org/10.3390/biomimetics10070462
APA StyleIkram, F., Younis, M. Y., Chuddher, B. A., Latif, U., Mushtaq, H., Afzal, K., Awan, M. A., Ijaz, A., & Bashir, N. (2025). Impact of Biomimetic Fin on Pitching Characteristics of a Hydrofoil. Biomimetics, 10(7), 462. https://doi.org/10.3390/biomimetics10070462