
Transition Processes in Technological Systems: Inspiration from Processes in Biological Evolution


Abstract
1. Introduction
1.1. Challenges of Transition Processes
1.2. Sustainability and Sustainability Assessment
“Yet in the end, sustainable development is not a fixed state of harmony, but rather a process of change in which the exploitation of resources, the direction of investments, the orientation of technological development, and institutional change are made consistent with future as well as present needs”. [5](the source)
1.3. Background Information About Biological Evolution
1.4. Aim of the Project and Key Results
- Specifically, our aim is to provide answers to the following key questions:
- 1.
- What can we learn from biological evolution in order to better understand and manage the sustainability transition processes in technology?
- 2.
- How can biological evolution inspire the generation of metrics and indicators to assess the sustainability of materials systems and technologies in the context of ongoing transition processes?
- We summarize our main contributions to the comparison between biological evolution and technological transition as follows:
- We adopt a multilevel perspective on biological evolution, drawing an analogy to the multilevel perspective on socio-technical transitions.
- We apply the model of path dependency from technological transitions to biological evolution.
- We identify key lessons from biological evolution for sustainability transitions, including concepts such as “give random changes a try” and “keep older versions in reserve”.
- We derive several metrics and indicators for assessing and managing sustainability transitions, inspired by principles of biological evolution.
2. Inspiration from the Overall Process and Key Principles of Biological Evolution
2.1. Biological Evolution
- Biological evolution is a continuous process based on heredity.Even when new traits arise through variation in genetic material during evolution, these adaptations are built on preexisting traits, as the inheritance process provides long-term memory across the evolutionary timescale [32]. In their lectures, German zoologist Professor G. Osche vividly described the difference between biological evolution and technical developments that we translated as follows “Nature cannot display a sign saying: closed for reconstruction” [33]. This quote highlights that biological organisms must remain “functional” throughout every stage of evolution, carrying with them an “evolutionary burden” inherited from their ancestors. In contrast, technological progress can involve disruptive shifts, where entirely new technologies may emerge without relying on existing ones. A well-known example is the rise of digital technologies, which did not evolve directly from analog predecessors.
- Biological evolution is neither anthropocentric nor teleological.In technology, the purpose of an application is defined by engineers from the onset and is optimized throughout the development process. In contrast, biological evolution operates through a process of “trial and error”. The random increase or decrease in genetic variability can be considered as an experiment or “trial”, and the decrease in individual reproductive success (=fitness) can be interpreted as an “error”. In an interview, Professor J. Gadau of the University of Münster, Germany, aptly summarized this concept that we translated as follows: “Evolution is blind, but not random”. [34].
- Phenotypic convergence is commonly associated with adaptive evolution.Regardless of the respective body plan, species from independent lineages can produce the same or a very similar phenotype when they form a similar ecological niche and adapt in comparable ways to similar selective environmental constraints. Prime examples of such a convergent evolution, which have evolved in various unrelated plant lineages, are the growth forms of climbing lianas and succulents. Climbing lianas show convergent adaption in stem mechanics, water conduction, and attachment systems [35,36]. Succulents that have evolved in various arid environments on Earth [37] exhibit adaptations for maximized water uptake, minimized water loss, and optimized water storage [13].
- Adaptive radiation is commonly associated with biodiversity.A classic example of adaptive radiation is Darwin’s finches (cf. Section 2.1.4), which are not true finches but belong to the subfamily Geospizinae. The great diversity of these “finch” species arose from a single species that accidentally reached the Galapagos Islands. In general, islands open up new ecological niches for founder populations, resulting in the evolution of phenotypic adaptation and speciation. Another example of adaptive radiation can be found in the succulent plant genus Aeonium on the Canary Islands [38,39,40,41].
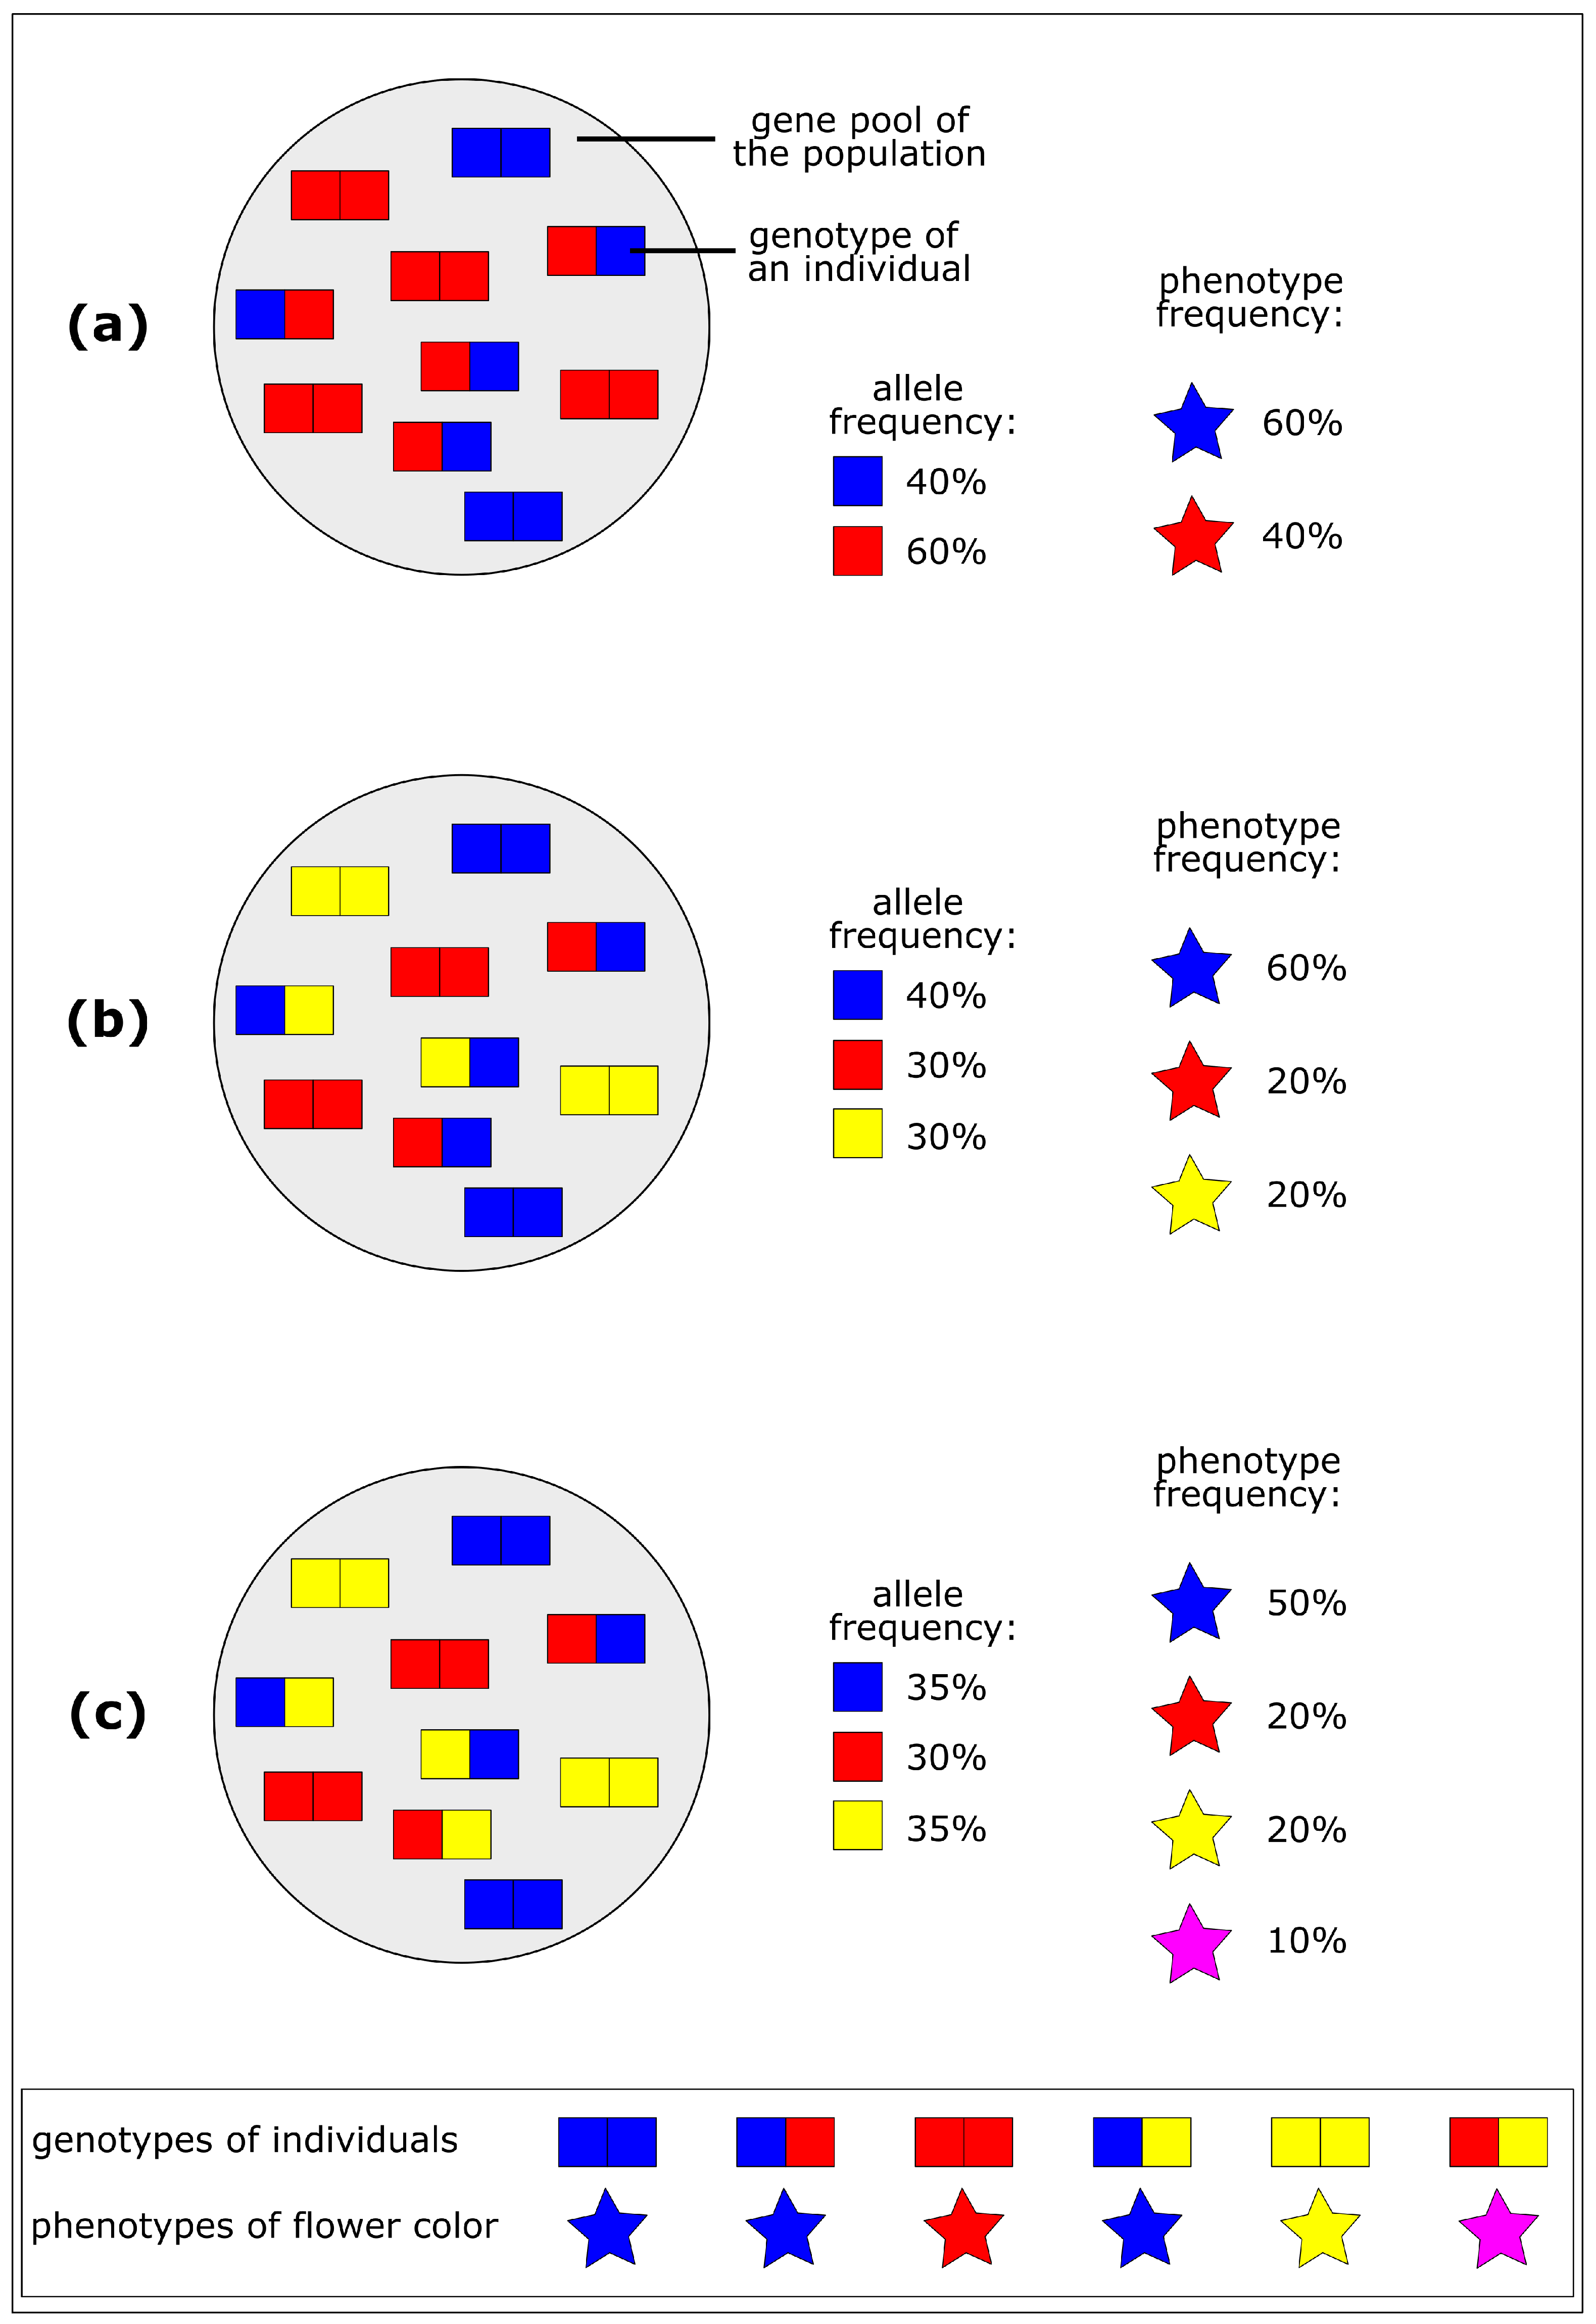
2.1.1. Gene Pool of a Population
2.1.2. Increase of Genetic Variability
2.1.3. Decrease of Genetic Variability

2.1.4. Adaptive Radiation and Ecological Niches
2.1.5. Natural Selection and Biological Fitness
2.2. Evolution Strategy—A Biomimetic Optimization Method
3. Transition Processes in Technological Systems
3.1. Multi-Level Perspective in Socio-Technical Transitions
- 1.
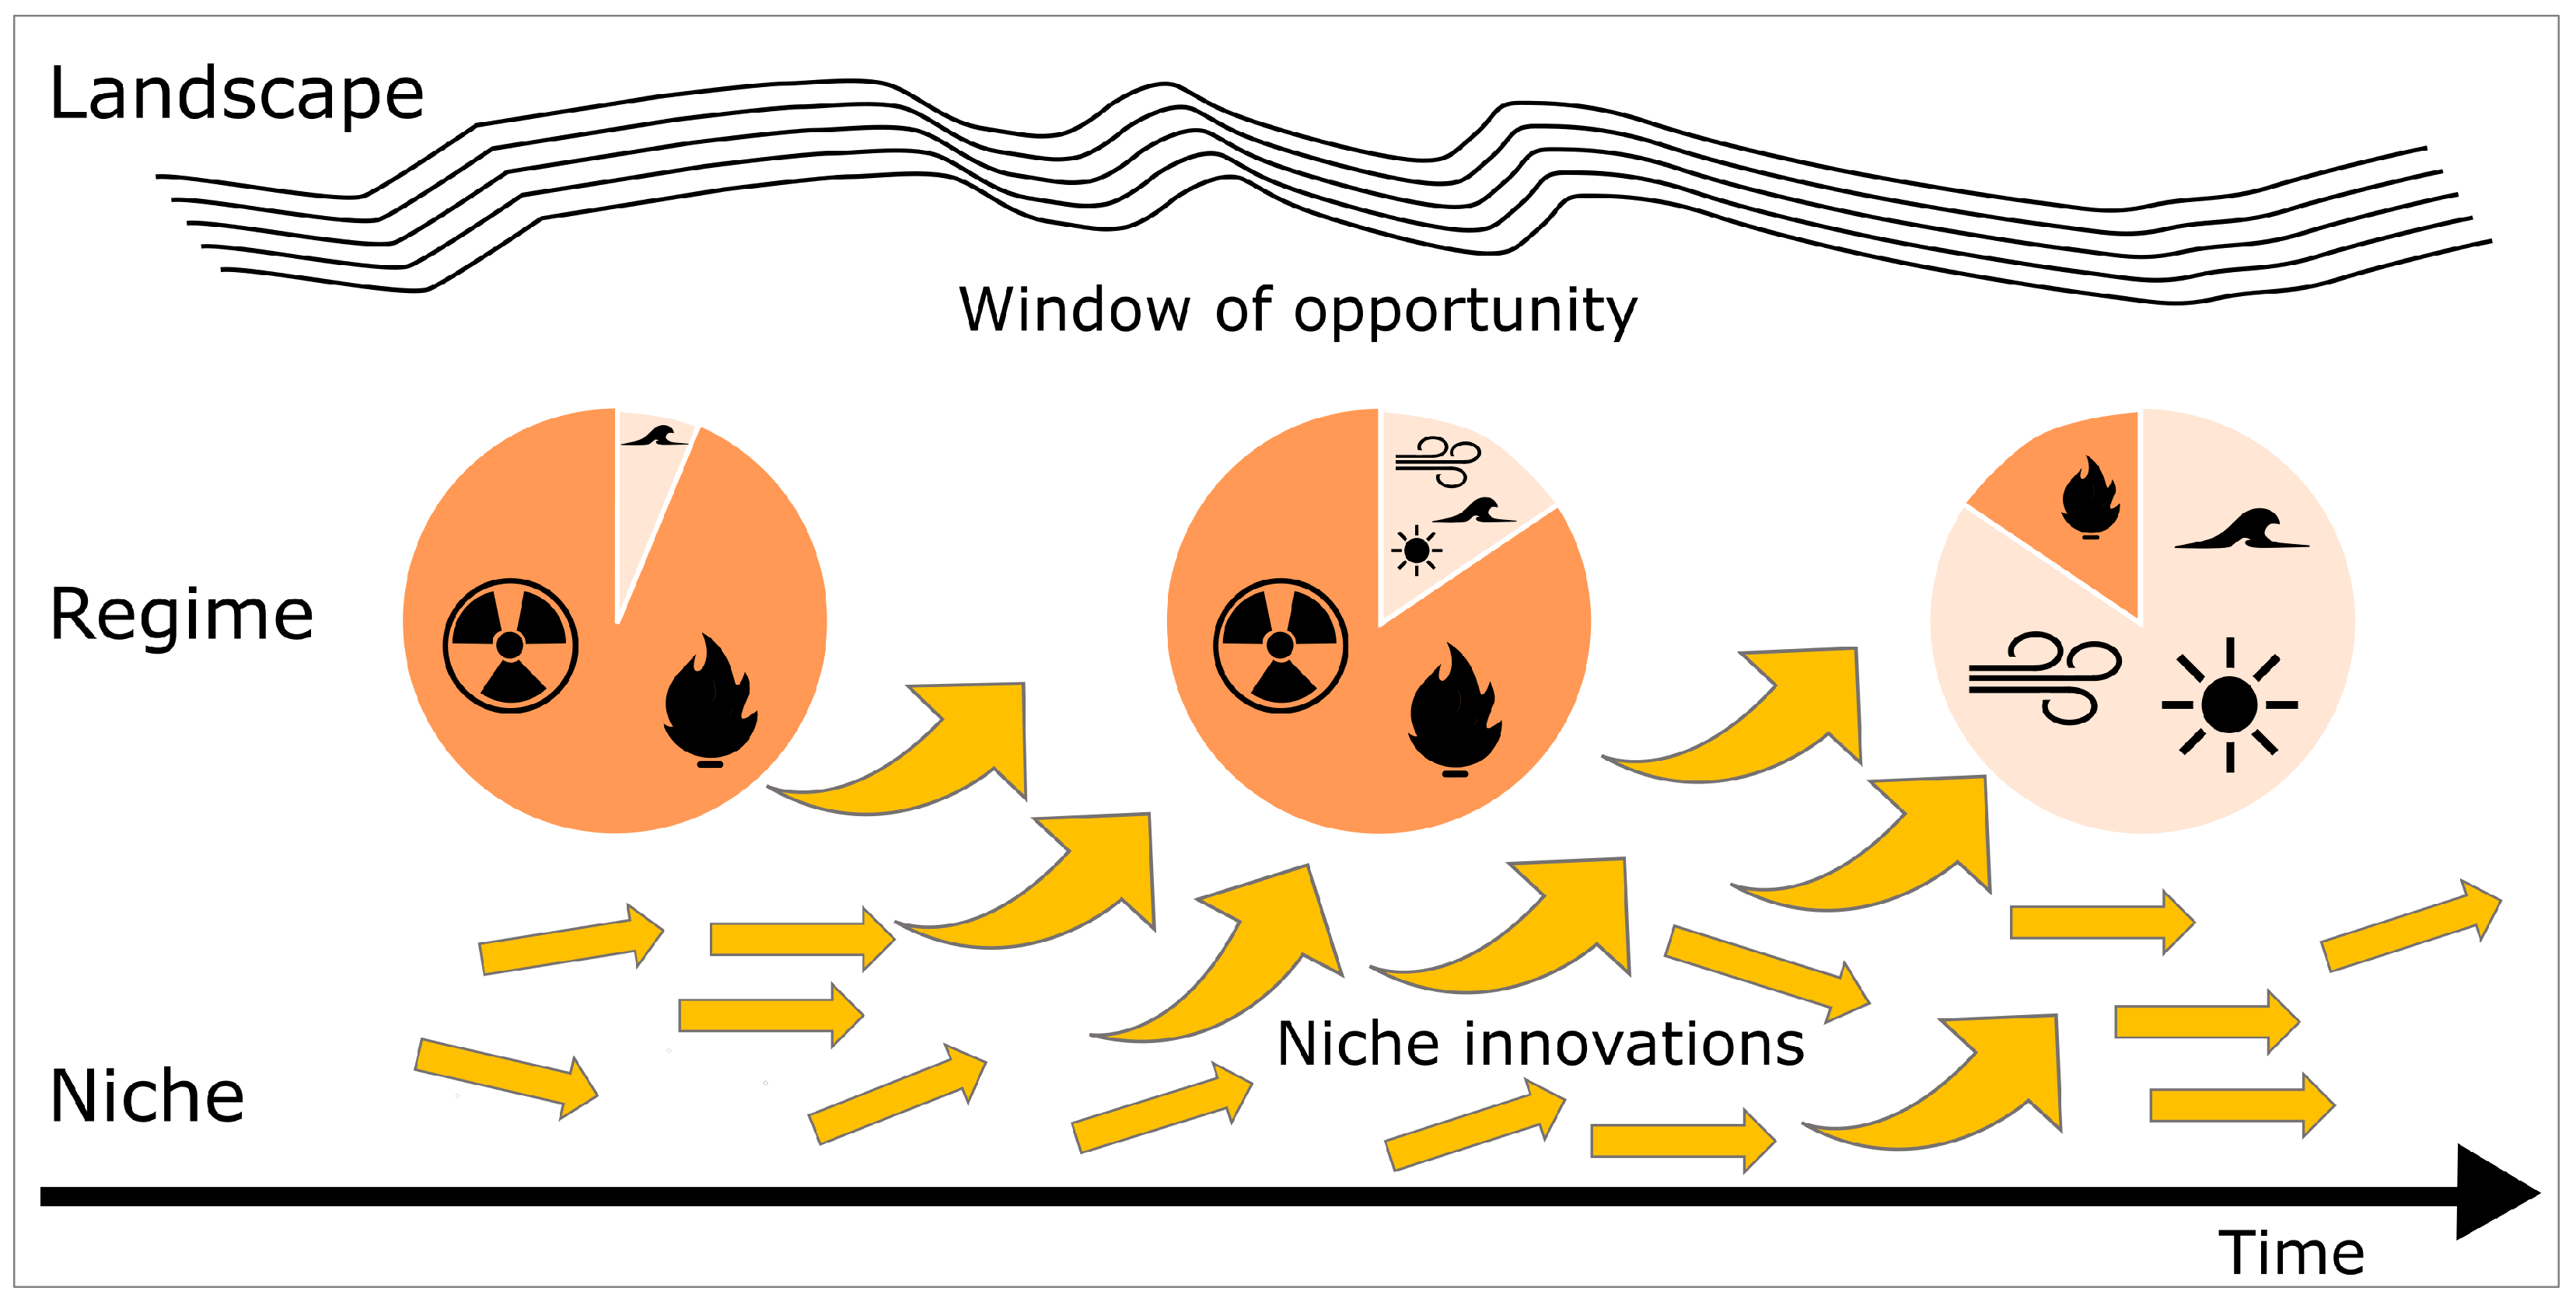
- Landscape in the MLP framework represents an environment in the socio-technical system [52]. It includes global events, developments, and trends such as climate change since the 1990s, energy crises in the 1970s and 2020s, the 2008 banking crisis, and technological changes (e.g., digitization and artificial intelligence). The landscape puts pressure on the existing regime for changes [59]. For example, climate change concerns are pushing for decarbonization and the energy crisis has accelerated investment in renewable energy projects.
- 2.
- Regime in the MLP framework represents the dominant configuration of actors, structures, rules, and norms that stabilize the existing socio-technical systems. This includes existing technologies and user practices that reinforce the status quo. The regime is usually resistant to change because it is supported by incumbent actors who benefit from the current system [52,59]. For example, in the energy regime, the dominance of fossil fuel-based energy production is reinforced by policies, infrastructure, and market preferences.
- 3.
- Niches in the MLP framework represent spaces for innovation, where new technologies, business models, and practices emerge. Niches refer to specialized market segments or application areas in which a particular technology is uniquely suited to meet specific needs or solve distinct problems. Over time, when niche innovations align with landscape pressures and gain momentum, they challenge and eventually disrupt the existing regime [52,59]. For example, renewable electricity generation was once a niche innovation supported by government incentives and research funding.
3.2. Interaction Between Landscape, Regime, and Niche
3.3. Path Dependency and Lock-Ins
- Path creation: In phase I, path creation starts in a complete open space of possibilities. However, based on history and context, the options against the gray background are more likely to be pursued than others. In addition, the time component of path creation is also a challenge. On the one hand, generating sufficient momentum and identifying a critical event that catalyzes path creation is vital; on the other, maintaining persistence is necessary until stabilizing mechanisms take effect [64].
- Path shaping: In phase II, a specific path begins to emerge as certain options are selected while others are abandoned. This process is shaped by critical junctures, where each new decision is made from a constrained set of available options, all of which are influenced by previous choices [64]. Whether, when, and to what extent such an event will occur cannot be determined ex ante, but is random [66].
- Path dependency: In phase III, the so-called lock-in occurs [64]. Lock-ins refer to stages in systems where certain technologies, practices, or policies become deeply entrenched. At this point, established organizations and regulatory frameworks may resist change due to vested interests [67]. Understanding the reasons for lock-ins and how to avoid them is crucial because it enables actors to identify barriers to systemic change to establish more sustainable systemic practices [68].
- Path breaking and restart: In phase IV, a lock-in-break, also known as un-locking, occurs. However, such a disruption can only be triggered by external impulses, as internal processes tend to be self-reinforcing and resistant to change. When considering a path shift, the potential benefits must be weighed against the switching costs, which may include financial investments, time, and the effort required for learning and adaptation. If a path is successfully broken, the cycle begins anew with the creation of a new path [64].
3.4. Technological Transition in the Energy Sector
3.4.1. Case Study: Energy Transition in Germany
- The role of niche innovations: The niche technologies of the energy transition in Germany are comprised of renewable energy systems and energy storage solutions. Solar and wind energy technologies, initially developed in niche markets over recent decades, were initially supported by policies like the feed-in tariff system, which offered remuneration to renewable energy producers. The continued scaling and efficiency improvements of renewable energy technologies have been reinforced by policies [73]. In recent years, green hydrogen has emerged as a key niche innovation, particularly important for decarbonizing hard-to-electrify sectors such as heavy industry and transportation. Germany is currently investing heavily in the development of green hydrogen and considers it a key component of its energy transition program [75]. Decentralized energy production represents another growing and increasingly popular area of innovation. Initiatives like balcony power plants allow consumers to generate their own electricity at home, with excess electricity contributing to local energy supplies. By promoting such solutions, Germany is developing a robust energy system with less dependency on centralized power generation [73].
- Destabilizing the energy regime: Historically, Germany’s energy regime was dominated by coal, gas, and nuclear power. However, more recent niche innovations such as solar, wind, and green hydrogen technologies have played pivotal roles in destabilizing the existing energy regime, supported by external landscape pressures such as global climate commitments. Coordinated political, technological, and societal efforts have accelerated this shift, leading to renewables (solar, wind, biomass, and hydropower) accounting for 59.4% of gross electricity generation in 2024 [76]. Germany’s phase-out of nuclear power in 2023 was a major milestone in the country’s energy transition, marking an end to the reliance on nuclear energy and reinforcing the commitment to expanding renewable capacity. The nuclear phase-out was largely driven by landscape pressures [73]. Nevertheless, resistance from incumbent fossil fuel industries remains a significant barrier. These industries, benefiting from decades of infrastructure and market dominance, resist transitions that could threaten their economic viability [77]. However, public pressure, global climate agreements, and technological advancements in renewable energy are gradually eroding their influence.
- Pressures from the landscape: The energy crisis triggered by the 2022 war in Ukraine has intensified pressures on the energy regime to reduce dependency on Russian gas and accelerate the adoption of renewable and alternative energy sources [78,79]. Earlier, the 2011 Fukushima nuclear accident significantly heightened global concerns about nuclear safety, prompting Germany to accelerate its nuclear phase-out [80]. These events acted as powerful landscape pressures, disrupting the stability of the existing energy regime and creating a window of opportunity for niche innovations, such as wind and solar energy, to gain momentum in driving the broader energy transition.
- Building a new regime and landscape: The future of Germany’s energy transition lies in constructing a new technological regime centered on digitization, expanded renewable energy capacity, and improved energy efficiency. Investments in smart grids and energy-efficient urban planning are changing how energy is both generated and consumed [73]. Here, consumers are becoming “prosumers”. Namely, they participate in the energy generation by generating their own electricity through systems like rooftop solar panels and feeding surplus power back into the grid [81]. This shift from consumer to prosumer marks a transition from centralized to decentralized energy systems, a distinctive characteristic of the new energy regime. Digitization plays a key role in enabling decentralized energy production and management, as well as in integrating variable renewable sources into the grid efficiently. Looking ahead, the continued development of a regime based on decentralization, digitization, and renewables will continue to fundamentally reshape Germany’s energy landscape.
- Influence on social, economic, and regulatory structures: Technological transitions, as illustrated in Germany’s energy sector, are not only about technological advancement, but also involve comprehensive changes in various other structures. For example, the transition to renewable energy sources is fostering greater community engagement and awareness of sustainability, reshaping public attitudes towards energy consumption and conservation. Economically, the transition is creating new job opportunities in novel energy sectors, while potentially displacing jobs in traditional ones. At the regulatory level, existing governance frameworks must adapt to support renewable integration, requiring updated policies that facilitate infrastructure development, regulate emissions, and incentivize the adoption of environmentally friendly technologies. The complexity of these interrelated social, economic, and regulatory structures highlights that energy transitions aimed at achieving sustainability goals are multi-dimensional processes [82].
3.4.2. Gap Analysis of Technological Transition in the Energy Sector
3.5. Assessments of Transitions
3.5.1. Current Indicators for Assessing Sustainability in Technological Transitions
- Environmental indicators: Technological transitions often drive advancements in reducing emissions, promoting cleaner production processes, and improving waste management. Progress in these areas can be quantified through indicators such as greenhouse gas emissions, overall energy consumption, and the impact on natural resources, including emissions to land, water, and air. Environmental indicators also assess how efficiently land and resources are used and managed. For example, metrics such as use of renewable resources, reduction in raw material extraction, and recycling rates provide valuable insights into the sustainability performance of a given technology [84,85].
- Economic indicators: Economic indicators are essential for assessing the financial feasibility of sustainability transitions. Profitability indicators, such as Return on Investment (ROI), Net Present Value (NPV), and Economic Value Added (EVA), help evaluate the financial returns generated by ongoing transition processes. Productivity indicators focus on elements such as labor and capital productivity, as well as resource efficiency. Additionally, stability indicators, such as financial leverage and economic resilience, aid our understanding of risk management in the context of sustainability transitions [86,87,88,89].
- Social indicators: Social indicators focus on the well-being of individuals and society as a whole. Recently, increasing pressure from stakeholders has forced the integration of social aspects into sustainability assessments. These revised indicators encompass aspects such as acceptance, accessibility, public health, and environmental justice [87,88,90,91,92].
3.5.2. Gaps in Existing Sustainability Assessment Indicators
- Lack of procedural indicators: Procedural indicators are useful for understanding the long-term impacts of technologies. They help track significant turning points in technology use, align sustainability transitions with cultural norms, and give direction for developing proactive approaches. By offering continuity and clarity, procedural indicators encourage stakeholder alignment around long-term objectives. Moreover, procedural indicators encourage proactive approaches to difficult transitions by integrating future possibilities, enabling stakeholders to better identify opportunities and mitigate potential risks. Importantly, procedural indicators also foster collaboration and increase accountability, which is vital for achieving inclusive and long-lasting results [93,94].
- Overlooked role of windows of opportunity: Sustainability assessments often overlook the importance of windows of opportunity that can markedly accelerate transition processes. Sustainability assessments typically concentrate on long-term objectives and static indicators, but tend to neglect time-dependent elements such as political upheavals, scientific discoveries, or environmental emergencies. By ignoring these elements, sustainability plans run the risk of stagnating, encountering opposition, and losing opportunities for widespread social alignment. Furthermore, without mechanisms to detect and respond to these opportunities, sustainability plans are less flexible and less reactive to changing problems and new solutions [93,95].
- Assessing long-term interactions: The role of long-term interactions is crucial for ensuring the directionality of transitions. When stakeholders from different domains collaborate towards a shared goal, they develop stronger connectivity and alignment towards common objectives. Although the long-term benefits of transitions are mostly uncertain, with proper assessments and studies, we can capture the persistence and stability of long-term interactions [96,97].
- Global supply chains and critical materials: The transition to renewable energy technologies, particularly in the areas of batteries, solar panels, and wind turbines, relies heavily on critical raw materials such as lithium, cobalt, and rare Earth metals. Current sustainability frameworks often do not assess the supply chain risks associated with the sourcing of these materials, especially concerning their geopolitical implications and environmental impacts [98]. A more comprehensive assessment would consider the environmental and social impacts of material extraction, including the potential for disruptions in global supply chains [99].
- Social and distributional impacts: Many sustainability assessment frameworks focus on environmental and economic outcomes but overlook social dimensions. A number of issues, such as the distribution of costs and benefits across different demographic groups, are not adequately captured by indicators. For example, while metropolitan areas benefit from a steady supply of renewable electricity, rural communities may be subject to the environmental effects of wind farms, without equivalent benefits. Inequality breeds conflict and resistance. Taking these factors into consideration can strengthen sustainability assessments [100].
- Isolated use of economic indicators: Relying on economic indicators to assess sustainability is problematic, as such indicators prioritize financial outcomes over more pressing environmental and social impacts. Economic indicators also tend to focus on short-term gains while overlooking the long-term issues of resource depletion, pollution, and injustice. Furthermore, economic success often undermines environmental damage ignoring negative externalities such as emissions. A broader approach is needed to balance economic, environmental, and social factors for further sustainability transitions [101]. Since sustainability transitions involve numerous emerging technologies, more comprehensive methods are also needed to effectively compare these with mature technologies and provide deeper insight into their economic implications [102].
- Lack of useful metrics: To address the shortcomings of conventional economic indicators in sustainability assessments, it is essential to incorporate useful metrics that account for environmental and social dimensions. Indicators can also include genuine progress indicators, i.e., adjusting Gross Domestic Production (GDP) by considering factors like income inequality, environmental impacts, and the value of unpaid work. Furthermore, integrating the concepts of absolute sustainability assessment into evaluation of technological transitions can provide insights into resource consumption relative to the carrying capacity of the planet [103,104]. To further capture the balance between economic growth, environmental stewardship and social equity, indicators like Social Return on Investment (SROI) can also be utilized [105].
4. Analogies Between Biological Evolution and Technological Transitions
4.1. Multi-Level Perspective Attributed to Biological Evolution
4.2. Path Dependency Attributed to Biological Evolution
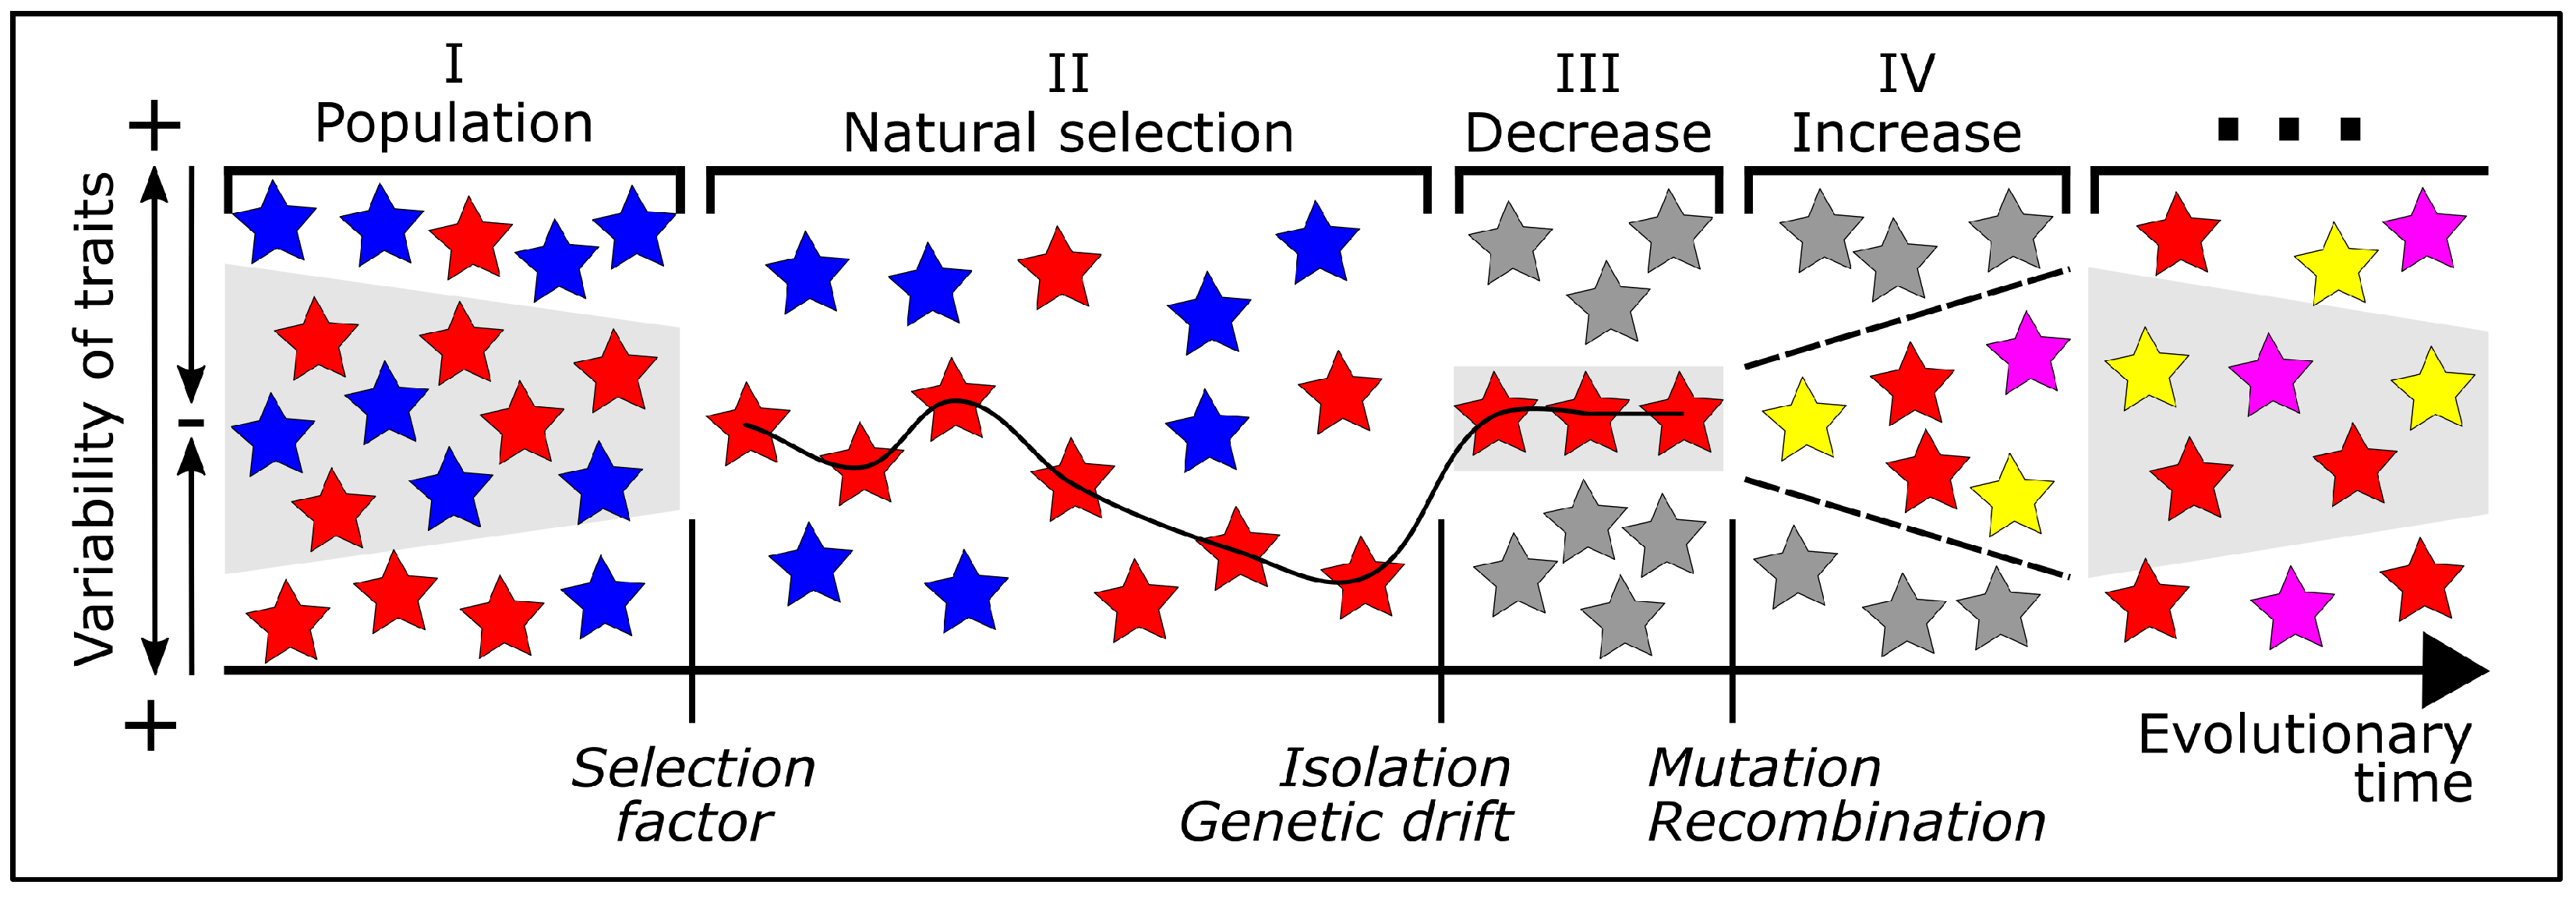
- Population: Phase I begins with the gene pool of a population containing individuals with different phenotypic traits, such as blue and red flowers (see Figure 1a). Because of small changes in environmental conditions, some individuals are slightly better adapted than others (shown in the gray shaded area).
- Natural selection: In phase II, the environmental conditions change markedly, triggered by either an abiotic selection factor (e.g., temperature, light, water, humidity) or a biotic selection factor (e.g., predators, competitors, pollinators), affecting organisms in the ecosystem. The selection factor is analogue to the critical juncture shown in Figure 4. As stated in Section 2.1.5, natural selection does not act on a single trait, but always on the whole individual and its totality of phenotypic traits. In our example, we can assume that red flower coloration provides an advantage in attracting pollinators.
- Decrease of genetic variability: In phase III, a decrease in genetic variability occurs, caused by either reproductive isolation (cf. Figure 2) or genetic drift (cf. Figure 3). In analogy to the lock-in shown in Figure 4, these random events can lead to a maximum restriction of the gene pool as described in Section 2.1.3. In our example, only plants with red flowers remain. Devezas [106] states that early decisions in technology can create a path that limits future options, similar to how certain traits in organisms can restrict their evolutionary direction [110].
- Increase of genetic variability and restart of further generations: Phase IV depicts an increase in genetic variability, analogous to the un-locking event shown in Figure 4. As introduced in Section 2.1.2, mutation and recombination are random changes in genetic information and, in our example, result in the additional flower colors—yellow and magenta (cf. Figure 1). Since biological evolution never stops, the plant population exhibiting red, yellow, and magenta flowers will go through further evolutionary cycles.Figure 7. Model of path dependency applied to biological evolution. Colored stars represent existing phenotypes of flower colors with their respective genotypes, while gray stars represent non-existing phenotypes. Phase I is a completely open space representing the gene pool of the population, where the flower colors in the gray shaded area are more likely to occur. In phase II, the red phenotype gains an evolutionary advantage with respect to a biotic or abiotic selection factor (shown as a line). In phase III, due to isolation or genetic drift, the variability decreases to red phenotypes only. In phase IV, genetic changes lead to the appearance of yellow and magenta flowers. The model then restarts from the beginning with this population.Figure 7. Model of path dependency applied to biological evolution. Colored stars represent existing phenotypes of flower colors with their respective genotypes, while gray stars represent non-existing phenotypes. Phase I is a completely open space representing the gene pool of the population, where the flower colors in the gray shaded area are more likely to occur. In phase II, the red phenotype gains an evolutionary advantage with respect to a biotic or abiotic selection factor (shown as a line). In phase III, due to isolation or genetic drift, the variability decreases to red phenotypes only. In phase IV, genetic changes lead to the appearance of yellow and magenta flowers. The model then restarts from the beginning with this population.
![Biomimetics 10 00406 g007]()
4.3. Differences, Similarities, and Commonalities
- Theory versus mission statement: In contrast to a theory, which is defined as a system of scientifically based statements suitable for explaining regularities and making predictions about the future, a mission statement is a written declaration that describes strategies and actions to achieve a formulated target state. The classical theory of evolution refers to the changes in the genetic material of all organisms over time [16,30]. This theory is continuously expanding through ongoing scientific findings and is therefore now referred to as the “modern synthesis” [31]. In contrast, sustainable development is guided by the teleological and anthropocentric mission statements, such as the SDGs formulated in the 2030 Agenda [6], and the policy-driven goals of technological transitions set by governments (cf. Section 3.4.1).
- Evolutionary time versus time: While biological evolution and technological transition are both processual, they differ tremendously in terms of time scale. Biological evolution takes place over evolutionary timescales spanning millions of years, while technological development occurs over much shorter periods, ranging from months to years.
- “Trial and error” versus targeted development and market acceptance: A key difference between biological evolution and technological transition lies in change and selection. In biology, this corresponds to the random change in genetic variability together with natural selection. In contrast, technological change is typically intentional and purpose-driven by engineers [27], with selection occurring through market dynamics [111]. For example, just as natural selection favors organisms best suited to their environments, technologies that meet market demands and societal needs are more likely to succeed [106]. The “trial and error” approach has been highly effective in the context of Evolution Strategies: a powerful tool for solving minimization and maximization problems by generating a larger set of optimized solutions. The lesson learned for technological transitions is “Give it a try”. A suitable indicator in this respect should cover the proportion of successful niche innovations relative to the total number of niche innovations.
- Continuous versus disruptive process: The evolutionary perspective emphasizes both steady progress and sudden, disruptive changes [26,106], two types of progress that we also find in technological developments. Despite the difference in time scales, generation-based biological evolution and version-based technological development are comparable. In biology, continuous progress is maintained because characteristics must be inherited from one generation to the next and generations cannot be skipped. However, detrimental mutations or disruptive environmental conditions can lead to the extinction of entire taxa. In contrast, technological development allows for versions to be skipped, for example due to teething problems or disruptive events, such as the transition from analog to digital devices. Thus, lessons learned from biology are “Do not close for reconstruction” and “Keep older versions in the innovation process”. Indicators for the sustainability assessment of transitions should therefore include the permanent supply of key functionalities by the regime, as well as the diversity and accessibility of older technological versions of a technology.
- Increase of variety: In biology, an increase in genetic variability refers to random changes in genetic information through mutation and recombination, which can result in new phenotypes of a trait. In technology, the concepts of mutation and recombination translate into the encouragement to create niche innovations by thinking beyond existing constraints or limitations of market or consumer segments. A suitable qualitative indicator in this context should reflect the degree of novelty of the niche innovation, particularly in cases where no established standards exist and the new functional unit cannot be fulfilled by any existing application. However, a limitation of this approach is the risk of creating innovations that offer limited value or relevance to consumers, and this trade-off should be kept in mind.
- Decrease of variety: In biology, a decrease in genetic variability refers to the random changes in genetic information due to isolation and genetic drift. This occurs when phenotypes of a trait disappear completely or when initially rare phenotypes become much more frequent. In technology, a reduction in variety can result from exnovation, which is an effective approach to overcoming path dependencies. Exnovation can be described as a deliberate process of phasing out or terminating outdated technologies. It can also include products, practices, or systems within the technosphere or society that are incompatible with the goals of the transition process. As the opposite of innovation, exnovation involves the removal of unsustainable elements within the regime in order to open the field for more efficient, consistent, or sufficient solutions, e.g., in the form of niche innovations [93]. Successful exnovations can be measured by the adoption rate of new technologies, a metric that determines how quickly new, more sustainable technologies are implemented as a result of an innovation.
- Phenotypic and technological convergence: In biology, convergent evolution describes the development of similar phenotypic traits in unrelated taxa, arising from different initial structures under similar environmental selection pressures. In technology, convergence refers to the process of integrating previously separate or unrelated technologies into unified, more advanced products, services, or systems that offer combined functionalities in a more efficient platform. The similarity between phenotypic convergence in evolutionary processes and technological convergence led us to hypothesize that pressures during the innovation process, e.g., user needs, market demands, and regulatory environments, can act as catalysts, driving technological convergence and promoting adaptive optimization of emerging technologies. A particularly striking current example is the rapid convergence of previously unrelated technologies such as the internet, cameras, and navigation systems, into multifunctional smartphones. Technological convergence can be assessed through indicators measuring the co-occurrence of technologies in scientific publications and patents, revealing how often a technology is referenced across different scientific disciplines. Additionally, a strong conversion potential may be indicated by the interdisciplinarity of patents, measured by the range of different technology areas citing a given patent.
- Fitness and consistency: According to Darwin’s original framing, fitness refers to individuals being better adapted to their immediate and local environment than other organisms. Fitness can be measured by the reproductive contribution of an organism relative to the contribution of other organisms in its population (see Section 2.1.5). Similarities to this concept can be found in technologies under path dependencies, when the defining components of a regime continually and dominantly reproduce themselves, limiting opportunities for upcoming niche innovations. Fitness can also be compared to the major sustainability strategy of consistency. In this context, consistency refers to the integration of a technology and its associated material and energy flows into natural cycles, reflecting the principles of circularity and waste minimization [9]. From this perspective, we conclude that any innovation that contributes to an ongoing transition process must be compatible with the natural limitation of the ecosphere and should ideally integrate into natural cycles. Ultimately, consistency requires innovation to operate within the natural limits as defined by the Planetary Boundaries. Therefore, a suitable indicator for evaluating such innovations should measure the degree of alignment with the Planetary Boundaries.
4.4. Outline of a Concrete Indicator for Assessing and Monitoring Sustainability Transition Processes
5. Discussion
6. Conclusions and Outlook
7. Glossary
- Adaptive radiation: In biology, adaptive radiation is the rapid diversification of a single lineage into organisms forming different niches [39].
- Allele: In biology, allele are Variants of a gene (=variants of the sequence of nucleotides on a DNA molecule) at a specific gene locus of a chromosome [17].
- Anthropocentric: From a philosophical perspective, anthropocentric considers human beings as the most significant entity in the universe, prioritizing human interests and values above those of other species and the environment [125].
- Biological evolution: Biological evolution is the genetic change in a population from generation to generation [17].
- Bottleneck effect: In biology, the bottleneck effect is the drastic reduction of a once large population to a few individuals, usually caused by a natural disaster [17].
- Co-evolution: In biology, co-evolution describes the evolution of traits of interacting unrelated taxa [127]. In technological transition, co-evolution refers to shared work of generating innovative and exceptional design conducted by various actors from firms, customers, and collaborating partners [93].
- Consistency: Consistency is a major sustainability strategy that pertains to the integration of a technology and related material and energy flows into natural cycles, reflecting the principles of circularity and waste minimization [9].
- Demand Response System: In technology, demand response refers to balancing the demand on power grids by encouraging customers to shift electricity demand to times when electricity is more plentiful or other demand is lower, typically through prices or monetary incentives [128].
- Ecosphere: A comprehensive system that encompasses all living organisms and their environmental interactions on Earth [133].
- Ecosystem: In biology, an ecosystem includes all the organisms in a given area and the physical and chemical environment in which they live [17].
- Efficiency: A measure of the ability to achieve maximum output with the least amount of input, particularity in terms of resource use such as energy and materials [9].
- Environment: In biology, environment is the sum of extrinsic potential selective factors encountered by a population or species, including habitat, climate, and sympatric species, among many others [134].
- Evolution Strategy: Optimization method based on the key principles of biological evolution [25].
- Exnovation: Process in which a given technology is currently no longer used because its physical infrastructure has been deliberately removed [135].
- Fitness: In biology, fitness describes the capacity of an organism to survive and transmit its genotype to reproductive offspring as compared to competing organisms. Fitness can be quantified by the contribution of an allele or genotype to the gene pool of subsequent generations as compared to that of other alleles or genotypes [136].
- Founder effect: In biology, the founder effect describes the random changes in allele frequency as a result of the founding of a new population by very few individuals [17].
- Functional unit: In sustainability assessments, the functional unit is defined as the quantity of a product or product system on the basis of the performance it delivers in its end-use application [112].
- Genetic drift: In biology, genetic drift describes the changes in allele frequencies in a small population from one generation to the next as a result of random events [17].
- Genetic variability: In biology, genetic variability represents the genetic differences within or between populations [137].
- Genotype: In biology, the genotype is a precise description of the genetic material of an individual, either for a specific trait or for a range of traits [17].
- Gene pool: In biology, a gene pool is the total number of alleles of all genes from all individuals in a population at a given time [17].
- Goal: A goal is a general statements of what is to be achieved, but without giving precise figures or setting deadlines for completion [9].
- Landscapes: In biology, a landscape is a part of the Earth’s surface that forms a spatial unit through its inorganic (e.g., surface form, rock, soil), organic (e.g., animals, plants, fungi) and anthropogenic (e.g., agriculture, industry, housing) components [140]. In a maximization or minimization problem, a three-dimensional quality landscape consisting of mountains of different heights and valleys of different depths is created by plotting two parameters horizontally and the corresponding value of the variable to be optimized, the quality, vertically [25]. In MLP, a landscape is an external structure or a setting for interactions of various actors in a technological system [52].
- Lock-in effect: In the context of path dependency, the lock-in effect is a stage in systems where certain technologies, practices or policies have come to stay making it difficult to shift to more sustainable alternatives [62].
- Material and energy flows: In industrial systems, material and energy flows refer to material- or energy-related inputs or outputs from a process or product system [112].
- Metric: In the context of sustainability, metrics are the building blocks for measuring the environmental, economic, and social aspects of a system, while certain aspects, like greenhouse gas emissions, can be measured uniformly, many sustainability issues (e.g., related to social aspects) are complex phenomena that require proxies to simplify and quantify them [138,141].
- Mutation: In biology, mutations are stable and heritable random changes in genetic material. One allele can mutate and become another allele [17].
- Natural selection: Darwin understood natural selection as differential reproductive and survival success of offspring that fit best to the natural environment [17].
- Niche: In biology, the ecological niche describes the set of relationships between a species and its environment [142]. In technology, a niche is a specialized market segment or application area where a particular technology is uniquely suited to meet specific needs or solve distinct problems. Niches often serve as early adoption environments for emerging technologies, allowing them to improve at a small scale, and, under the right conditions, challenging and eventually replacing the dominant regime [59].
- Paradigm shift: A process that intensifies over time and causes fundamental and irreversible changes in the regime [61].
- Path dependency: A phenomenon that describes how historical decisions and established practices shape the trajectory of future developments, often leading to a reliance on specific technologies or systems that can hinder innovation and ongoing transitions [62].
- Phenotype: In biology, a phenotype is an observable characteristic of an individual resulting from the influence of both genetic and environmental factors [17].
- Phenotypic convergence: In biology, convergent evolution is the independent evolution of similar phenotypic traits in unrelated taxa from different initial structures under similar selection pressures [17].
- Planetary Boundaries: The nine biophysical systems and processes that govern the operation of Earth’s life support systems and, ultimately, the stability and resilience of the Earth system [103].
- Population: In biology, a population is a group of individuals of the same species living in the same habitat at the same time and capable of reproduction [17].
- Prosumer: An individual who both consumes and produces [143].
- Recombination: In biology, recombination is a random rearrangement of parental genetic material during sexual reproduction [17].
- Regime: Established practices, rules, and institutions supporting dominant technologies and systems. The established alignment of technologies, policies, user patterns, and cultural discourses is also called a socio-technical regime that stabilizes systems like energy and mobility shaped by shared rules and institutions influencing the actions of various social groups, while generally stable, regimes can be disrupted by external pressures or niche innovations [52,144].
- Reproductive isolation: In biology, reproductive isolation is the interruption of gene flow between populations of the same species, preventing the production of offspring under natural conditions [145].
- Robustness: The capability of a system to prevent damage and to maintain its functionality even if unforeseen faults (e.g., in hardware) or errors (e.g., in software) occur or a mistake is made by a human being [147].
- Smart grid: A modernized electrical grid that uses digital technology, communication networks, and advanced sensors to enhance the efficiency, reliability, and sustainability of electricity distribution. It enables two-way communication between utilities and consumers, allowing for real-time monitoring and management of energy resources [81].
- Socio-technical system: A Socio-technical system pertains to the interdisciplinary scientific perspective that examines technological progress by taking into account the relationships between different components, such as technology, laws, customs. In addition to the creation and application of technology, these systems also encompass the processes of production, dissemination, and social integration [144,148].
- Sufficiency: A major sustainability strategy that emphasizes on change in consumption pattern and respects ecological limits by reducing the surplus use of resources [9].
- Sustainable Development Goals: A set of 17 global objectives established under the United Nations’ 2030 Agenda for Sustainable Development. SDGs call for urgent, collective action through global partnerships to address critical challenges, including, climate change, environmental degradation, poverty, inequality and access to justice [6].
- TAPAS: Tiered Approach for Prospective Assessment of Benefits and Challenges is a sustainability assessment methodology designed to be used during the development process of novel technologies and materials systems. TAPAS uses a systematic approach to guide inquiry, provide instructions and recommendations to evaluate and enhance the sustainability performance of the objects examined [7].
- Target: A specific and measurable result to be achieved within a given time period [9].
- Technological convergence: The process of integrating previously separate or unrelated technologies to create new, more advanced products, services, or systems that combine the functionalities of multiple technologies into a single, more efficient platform [149].
- Technological transition: Systemic changes that reshape socio-technical systems like energy, transportation, or communication. The changes arise from innovations that disrupt established systems and shift social, economic, and regulatory structures [52].
- Technosphere: A system composed of human-made technological and infrastructural elements that interact with the Earth’s environment, biosphere, and society. It includes all human-made systems, devices, procedures, and networks developed and operated by humans to support contemporary society [150].
- Teething problem: Temporary problem connected with a new product or at the beginning of a process/activity that occurs when a new technology is being fine-tuned and adapted for optimal performance [151].
- Teleological: Teleological means starting from the end and reasoning back, explaining things based on their goal or end purpose [152].
- Version-based development: A systematic approach to creating and managing sequential iterations of a product, software, or technology. Each version represents a distinct stage in the product’s development process, incorporating new features, improvements, bug fixes, or performance enhancements [153].
Author Contributions
Funding
Institutional Review Board Statement
Informed Consent Statement
Data Availability Statement
Acknowledgments
Conflicts of Interest
Abbreviations
| AI | Artificial Intelligence |
| ASCR | Absolute Sustainability Compliance Rate |
| EVA | Economic Value Added |
| GDP | Gross domestic product |
| LCA | Life Cycle Assessment |
| NPV | Net Present Value |
| ROI | Return on Investment |
| SDGs | Sustainable Development Goals |
| SROI | Social Return on Investment |
| MLP | Multi-Level Perspective |
| TAPAS | Tiered Approach for Prospective Assessment of Benefits and Challenges |
References
- Olbrich, S.; Bauknecht, D. The system building perspective for building sustainable system configurations using the German energy transition as an example. Oxford Open Energy 2024, 3, oiae010. [Google Scholar] [CrossRef]
- European Environment Agency. Europe’s Sustainability Transitions Outlook: Short-Term Action, Long-Term Thinking. 2024. Available online: https://www.eea.europa.eu/en/analysis/publications/europes-sustainability-transitions-outlook (accessed on 20 March 2025).
- Luu, R.K.; Arevalo, S.; Lu, W.; Ni, B.; Yang, Z.; Shen, S.C.; Berkovich, J.; Hsu, Y.C.; Zan, S.; Buehler, M.J. Learning from nature to achieve material sustainability: Generative AI for rigorous bio-inspired materials design. MIT Explor. Gener. AI 2024. [Google Scholar] [CrossRef]
- Möller, M.; Höfele, P.; Kiesel, A.; Speck, O. Reactions of sciences to the Anthropocene: Highlighting inter- and transdisciplinary practices in biomimetics and sustainability research. Elem. Sci. Anthr. 2021, 9, 035. [Google Scholar] [CrossRef]
- Brundtland Commission. Our Common Future: Report of the World Commission on Environment and Development; Oxford University Press: Oxford, UK, 1987; Volume 10. [Google Scholar]
- United Nations. Transforming Our World: The 2030 Agenda for Sustainable Development. 2015. Available online: https://unstats.un.org/unsd/statcom/48th-session/documents/2017-2-IAEG-SDGs-E.pdf (accessed on 24 March 2025).
- Möller, M. Entwicklung eines mehrstufigen Methodenrahmens für eine prospektive Nachhaltigkeitsbewertung von neuartigen Technologien und Materialsystemen (TAPAS). Ph.D. Thesis, University of Freiburg, Freiburg, Germany, 2022. Available online: https://freidok.uni-freiburg.de/data/235292 (accessed on 24 March 2025).
- Möller, M.; Speck, T.; Speck, O. Sustainability assessments inspired by biological concepts. Technol. Soc. 2024, 78, 102630. [Google Scholar] [CrossRef]
- Speck, O.; Möller, M.; Grießhammer, R.; Speck, T. Biological concepts as a source of inspiration for efficiency, consistency, and sufficiency. Sustainability 2022, 14, 8892. [Google Scholar] [CrossRef]
- Lambers, H.; Chapin, F.S., III; Pons, T.L. Plant Physiological Ecology; Springer: Cham, Switzerland, 2008; Volume 2, pp. 4–6. [Google Scholar]
- Pausas, J.G.; Schwilk, D. Fire and plant evolution. New Phytol. 2012, 193, 301–303. [Google Scholar] [CrossRef]
- Speck, O.; Speck, T. Is a forest fire a natural disaster? Investigating the fire tolerance of various tree species—An educational module. Biomimetics 2024, 9, 114. [Google Scholar] [CrossRef]
- Hashem, H.A.; Mohamed, A.H. Strategies for drought tolerance in xerophytes. In Plant Ecophysiology and Adaptation Under Climate Change: Mechanisms and Perspectives I: General Consequences and Plant Responses; Springer: Singapore, 2020; pp. 269–293. [Google Scholar] [CrossRef]
- Nei, M. The new mutation theory of phenotypic evolution. Proc. Natl. Acad. Sci. USA 2007, 104, 12235–12242. [Google Scholar] [CrossRef]
- Masel, J. Genetic drift. Curr. Biol. 2011, 21, R837–R838. [Google Scholar] [CrossRef]
- Darwin, C. On the Origin of Species by Means of Natural Selection; Murray: London, UK, 1859. [Google Scholar]
- Sadava, D.; Hillis, D.M.; Heller, H.C.; Hacker, S.D. Purves Biologie; Elsevier: München, Germany, 2019. [Google Scholar]
- Drost, H.G.; Janitza, P.; Grosse, I.; Quint, M. Cross-kingdom comparison of the developmental hourglass. Curr. Opin. Genet. Dev. 2017, 45, 69–75. [Google Scholar] [CrossRef]
- von Gleich, A.; Pade, C.; Petschow, U.; Pissarskoi, E. Trends in biomimetics. In Potentials and Trends in Biomimetics; Springer: Berlin/Heidelberg, Germany, 2010; pp. 13–32. [Google Scholar] [CrossRef]
- Gorb, E.; Popov, V.; Gorb, S. Natural hook-and-loop fasteners: Anatomy, mechanical properties, and attachment force of the jointed hooks of the Galium aparine fruit. WIT Trans. Ecol. Environ. 2002, 57, 151–160. [Google Scholar]
- Rechenberg, I. Evolutionsstrategie’94; Frommann-Holzboog: Stuttgart, Germany, 1994. [Google Scholar]
- Schwefel, H.P. Evolution and Optimum Seeking: The Sixth Generation; John Wiley & Sons, Inc.: Hoboken, NJ, USA, 1993. [Google Scholar]
- VDI:6224; Biomimetic Optimization–Application of Evolutionary Algorithms. Standard VDI 6224: Part 1; Verein Deutscher Ingenieure, Beuth: Berlin, Germany, 2012.
- Hollstein, R. Evolutionäre Algorithmen. In Optimierungsmethoden: Einführung in die klassischen, naturanalogen und neuronalen Optimierungen; Springer: Berlin/Heidelberg, Germany, 2023; pp. 147–184. [Google Scholar]
- Speck, O.; Speck, T.; Baur, S.; Herdy, M. The basics of Evolution Strategies: The implementation of the biomimetic optimization method in educational modules. Biomimetics 2024, 9, 439. [Google Scholar] [CrossRef]
- Arthur, W.B. The Nature of Technology: What It Is and How It Evolves; Simon and Schuster: New York, NY, USA, 2009. [Google Scholar]
- Arthur, W.B. Where Darwin does not fit…. New Sci. 2009, 203, 26–27. Available online: https://sites.santafe.edu/~wbarthur/Papers/NewSci%20Essay.pdf (accessed on 12 September 2024). [CrossRef]
- Barham, L. From Hand to Handle: The First Industrial Revolution; Oxford University Press: Oxford, UK, 2013. [Google Scholar]
- Solée, R.V.; Valverde, S.; Casals, M.R.; Kauffman, S.A.; Farmer, D.; Eldredge, N. The evolutionary ecology of technological innovations. Complexity 2013, 18, 15–27. [Google Scholar] [CrossRef]
- Hortal, J.; Diniz-Filho, J.A.F.; Low, M.E.; Stigall, A.L.; Yeo, D.C. Alfred Russel Wallace’s legacy: An interdisciplinary conception of evolution in space and time. npj Biodivers 2023, 2, 3. [Google Scholar] [CrossRef] [PubMed]
- Huxley, J. Evolution. The Modern Synthesis; George Alien & Unwin Ltd.: London, UK, 1942. [Google Scholar]
- Félix, M.A. Phenotypic evolution with and beyond genome evolution. Curr. Top. Dev. Biol. 2016, 119, 291–347. [Google Scholar] [CrossRef]
- Horn, R.; Gantner, J.; Widmer, L.; Sedlbauer, K.P.; Speck, O. Bio-inspired sustainability assessment–A conceptual framework. In Biomimetic Research for Architecture and Building Construction: Biological Design and Integrative Structures; Springer: Cham, Switzerland, 2016; pp. 361–377. [Google Scholar] [CrossRef]
- Poppen, A. Evolution Ist Blind, aber Nicht Zufällig. 2024. Available online: https://www.uni-muenster.de/news/view.php?cmdid=13873 (accessed on 12 September 2024).
- Rowe, N.; Isnard, S.; Speck, T. Diversity of mechanical architectures in climbing plants: An evolutionary perspective. J. Plant Growth Regul. 2004, 23, 108–128. [Google Scholar] [CrossRef]
- Rowe, N.; Speck, T. Plant growth forms: An ecological and evolutionary perspective. New Phytol. 2005, 166, 61–72. [Google Scholar] [CrossRef]
- Grace, O.M. Succulent plant diversity as natural capital. Plants People Planet 2019, 1, 336–345. [Google Scholar] [CrossRef]
- Dos Santos, P.; Brilhante, M.Â.; Messerschmid, T.F.; Serrano, H.C.; Kadereit, G.; Branquinho, C.; De Vos, J.M. Plant growth forms dictate adaptations to the local climate. Front. Plant Sci. 2022, 13, 1023595. [Google Scholar] [CrossRef]
- Flohr, R.C.; Blom, C.J.; Rainey, P.B.; Beaumont, H.J. Founder niche constrains evolutionary adaptive radiation. Proc. Natl. Acad. Sci. 2013, 110, 20663–20668. [Google Scholar] [CrossRef] [PubMed]
- Jorgensen, T.H.; Olesen, J.M. Adaptive radiation of island plants: Evidence from Aeonium (Crassulaceae) Canary Isl. Perspect. Plant Ecol. Evol. Syst. 2001, 4, 29–42. [Google Scholar] [CrossRef]
- Messerschmid, T.F.; Abrahamczyk, S.; Bañares-Baudet, Á.; Brilhante, M.A.; Eggli, U.; Hühn, P.; Kadereit, J.W.; Dos Santos, P.; De Vos, J.M.; Kadereit, G. Inter-and intra-island speciation and their morphological and ecological correlates in Aeonium (Crassulaceae), a species-rich Macaronesian radiation. Ann. Bot. 2023, 131, 697–721. [Google Scholar] [CrossRef]
- Spencer, H. The Principles of Biology; Williams and Norgate: London, UK, 1864; Volume I. [Google Scholar]
- Kimura, M. Genetic variability maintained in a finite population due to mutational production of neutral and nearly neutral isoalleles. Genet. Res. 1968, 11, 247–270. [Google Scholar] [CrossRef]
- Medina, M.; Baker, D.M.; Baltrus, D.A.; Bennett, G.M.; Cardini, U.; Correa, A.M.; Degnan, S.M.; Christa, G.; Kim, E.; Li, J.; et al. Grand challenges in coevolution. Front. Ecol. Evol. 2022, 9, 618251. [Google Scholar] [CrossRef]
- Rechenberg, I. Optimierung Technischer Systeme nach Prinzipien der Biologischen Evolution; Frommann-Holzboog Verlag: Stuttgart, Germany, 1973. [Google Scholar]
- Schwefel, H.P. Evolutionsstrategien für die numerische Optimierung. In Numerische Optimierung von Computer-Modellen mittels der Evolutionsstrategie; Birkhäuser: Basel, Switzerland, 1977; pp. 123–176. [Google Scholar] [CrossRef]
- Mylo, M.D.; Speck, O. Longevity of system functions in biology and biomimetics: A matter of robustness and resilience. Biomimetics 2023, 8, 173. [Google Scholar] [CrossRef]
- Herdy, M. Beiträge zur Theorie und Anwendung der Evolutionsstrategie; Mensch-und-Buch-Verlag: Berlin, Germany, 2000. [Google Scholar]
- Gerdes, I.; Klawonn, F.; Kruse, R. Evolutionäre Algorithmen: Genetische Algorithmen–Strategien und Optimierungsverfahren–Beispielanwendungen; Friedr. Vieweg & Sohn: Wiesbaden, Germany, 2004. [Google Scholar]
- Dujardin, J.; Kahl, A.; Lehning, M. Synergistic optimization of renewable energy installations through evolution strategy. Environ. Res. Lett. 2021, 16, 064016. [Google Scholar] [CrossRef]
- Smil, V. Halfway Between Kyoto and 2050: Zero Carbon Is a Highly Unlikely Outcome; Fraser Institute: Vancouver, BC, Canada, 2024; Available online: https://www.jstor.org/stable/resrep60358.6?seq=1 (accessed on 24 March 2025).
- Geels, F.W. Technological transitions as evolutionary reconfiguration processes: A multi-level perspective and a case-study. Res. Policy 2002, 31, 1257–1274. [Google Scholar] [CrossRef]
- Geels, F. Processes and patterns in transitions and system innovations: Refining the co-evolutionary multi-level perspective. Technol. Forecast. Soc. Chang. 2005, 72, 681–696. [Google Scholar] [CrossRef]
- Hölscher, K.; Wittmayer, J.M.; Loorbach, D. Transition versus transformation: What is the difference? Environ. Innov. Soc. Transitions 2017, 27, 1–3. [Google Scholar] [CrossRef]
- Geels, F.W. Technological Transitions and System Innovations; Edward Elgar: Cheltenham, UK, 2005. [Google Scholar]
- Papachristos, G.; Sofianos, A.; Adamides, E. System interactions in socio-technical transitions: Extending the multi-level perspective. Environ. Innov. Soc. Transitions 2013, 7, 53–69. [Google Scholar] [CrossRef]
- Geels, F.W. The multi-level perspective on sustainability transitions: Responses to seven criticisms. Environ. Innov. Soc. Transitions 2011, 1, 24–40. [Google Scholar] [CrossRef]
- Loorbach, D.; Frantzeskaki, N.; Avelino, F. Sustainability transitions research: Transforming science and practice for societal change. Annu. Rev. Environ. Resour. 2017, 42, 599–626. [Google Scholar] [CrossRef]
- Bilali, H.E. The multi-level perspective in research on sustainability transitions in agriculture and food systems: A systematic review. Agriculture 2019, 9, 74. [Google Scholar] [CrossRef]
- Berkhout, F.; Smith, A.; Stirling, A. Socio-technological regimes and transition contexts. In System Innovation and the Transition to Sustainability: Theory, Evidence and Policy; Edward Elgar: Cheltenham, UK, 2004; Volume 44, pp. 48–75. Available online: https://www.elgaronline.com/edcollbook/1843766833.xml#page=68 (accessed on 24 March 2025).
- Grießhammer, R.; Brohmann, B. Understanding the transformation. In How Transformations and Social Innovations Can Succeed; Nomos: Baden-Baden, Germany, 2015; pp. 13–18. [Google Scholar] [CrossRef]
- Eitan, A.; Hekkert, M.P. Locked in transition? Towards a conceptualization of path-dependence lock-ins in the renewable energy landscape. Energy Res. Soc. Sci. 2023, 106, 103316. [Google Scholar] [CrossRef]
- Barnes, W.; Gartland, M.; Stack, M. Old habits die hard: Path dependency and behavioral lock-in. J. Econ. Issues 2004, 38, 371–377. [Google Scholar] [CrossRef]
- Korn, J. Pfad ist nicht gleich Pfad! Eine kritische Aufarbeitung der Pfadabhängigkeitstheorie als Grundlage und Appell der differenzierenden Betrachtung von Pfaden und Pfadzusammenhängen. Schriftenreihe: Sozialwissenschaftliche Zukunftsforschung. 2020. Available online: https://refubium.fu-berlin.de/bitstream/handle/fub188/28329/iF-Schriftenreihe_Korn_0120.pdf?sequence=5&isAllowed=y (accessed on 14 March 2025).
- Fouquet, R. Path dependence in energy systems and economic development. Nat. Energy 2016, 1, 16098. [Google Scholar] [CrossRef]
- Schreyögg, G.; Sydow, J.; Koch, J. Organisatorische Pfade–Von der Pfadabhängigkeit zur Pfadkreation. Managementforschung 2003, 13, 257–294. [Google Scholar]
- Seto, K.C.; Davis, S.J.; Mitchell, R.B.; Stokes, E.C.; Unruh, G.; Ürge Vorsatz, D. Carbon lock-in: Types, causes, and policy implications. Annu. Rev. Environ. Resour. 2016, 41, 425–452. [Google Scholar] [CrossRef]
- Unruh, G.C. Escaping carbon lock-in. Energy Policy 2002, 30, 317–325. [Google Scholar] [CrossRef]
- Wiatros-Motyka, M.; Fulghum, N.; Jones, D. Global Electricity Review. 2024. Available online: https://ember-energy.org/app/uploads/2024/05/Report-Global-Electricity-Review-2024.pdf (accessed on 17 March 2025).
- International Energy Agency. China Forciert Erneuerbaren-Energie-Ausbau 2023. Statista Research Department. 2023. Available online: https://de.statista.com/infografik/30417/prognose-anteil-weltweiter-gesamtkapazitaet-und-zubau-erneuerbare-energien/ (accessed on 17 March 2025).
- Gielen, D.; Boshell, F.; Saygin, D.; Bazilian, M.D.; Wagner, N.; Gorini, R. The role of renewable energy in the global energy transformation. Energy Strategy Rev. 2019, 24, 38–50. [Google Scholar] [CrossRef]
- Walz, A.; Braendle, J.; Lang, D.; Brand, F.; Briner, S.; Elkin, C.; Hirschi, C.; Huber, R.; Lischke, H.; Schmatz. Experience from downscaling IPCC-SRES scenarios to specific national-level focus scenarios for ecosystem service management. Technol. Forecast. Soc. Chang. 2013, 86, 21–32. [Google Scholar] [CrossRef]
- Agora Energiewende. Die Energiewende in Deutschland: Stand der Dinge 2023. 2023. Available online: https://www.agora-energiewende.de/publikationen/die-energiewende-in-deutschland-stand-der-dinge-2023 (accessed on 23 September 2024).
- Xie, Y.; Wu, X.; Hou, Z.; Li, Z.; Luo, J.; Lüddeke, C.T.; Huang, L.; Wu, L.; Liao, J. Gleaning insights from German energy transition and large-scale underground energy storage for China’s carbon neutrality. Int. J. Min. Sci. Technol. 2023, 33, 529–553. [Google Scholar] [CrossRef]
- Wilsdorf, K. Bad Lauchstädt Energy Park Now in Implementation Phase. 2023. Available online: https://energiepark-bad-lauchstaedt.de/en/news-downloads/latest-news/bad-lauchstaedt-energy-park-now-in-implementation-phase/ (accessed on 21 October 2024).
- Enerdata. Renewables Accounted for Nearly 60% of Germany’s Power Generation in 2024. 2025. Available online: https://www.enerdata.net/publications/daily-energy-news/renewables-accounted-nearly-60-germanys-power-generation-2024.html (accessed on 19 March 2025).
- Liebreich, M. Net Zero Will Be Harder Than You Think—Furthermore, Easier. Part I: Harder. 2023. Available online: https://about.bnef.com/blog/liebreich-net-zero-will-be-harder-than-you-think-and-easier-part-i-harder/ (accessed on 23 September 2024).
- Schramm, L. Some differences, many similarities: Comparing Europe’s responses to the 1973 oil crisis and the 2022 gas crisis. Eur. Political Sci. Rev. 2023, 16, 56–71. [Google Scholar] [CrossRef]
- Maneejuk, P.; Kaewtathip, N.; Yamaka, W. The influence of the Ukraine-Russia conflict on renewable and fossil energy price cycles. Energy Econ. 2023, 129, 107218. [Google Scholar] [CrossRef]
- Bundesministerium für Umwelt, Naturschutz, nukleare Sicherheit und Verbraucherschutz. Developments in Germany Following the Nuclear Disaster in Japan. 2012. Available online: https://www.bmuv.de/en/topics/nuclear-safety/overview-nuclear-safety/response-to-fukushima/overview (accessed on 4 December 2024).
- Bellekom, S.; Arentsen, M.; van Gorkum, K. Prosumption and the distribution and supply of electricity. Energ. Sustain. Soc. 2016, 6, 22. [Google Scholar] [CrossRef]
- Yang, Y.; Xia, S.; Huang, P.; Qian, J. Energy transition: Connotations, mechanisms and effects. Energy Strategy Rev. 2024, 52, 101320. [Google Scholar] [CrossRef]
- Raymond, A.J.; Tipton, J.R.; Kendall, A.; DeJong, J.T. Review of impact categories and environmental indicators for life cycle assessment of geotechnical systems. J. Ind. Ecol. 2019, 24, 485–499. [Google Scholar] [CrossRef]
- Rigamonti, L.; Mancini, E. Life cycle assessment and circularity indicators. Int. J. Life Cycle Assess. 2021, 26, 1937–1942. [Google Scholar] [CrossRef]
- Haberl, H.; Wackernagel, M.; Wrbka, T. Land use and sustainability indicators. An introduction. Land Use Policy 2003, 21, 193–198. [Google Scholar] [CrossRef]
- Arulnathan, V.; Heidari, M.D.; Doyon, M.; Li, E.P.H.; Pelletier, N. Economic indicators for life cycle sustainability assessment: Going beyond life cycle costing. Sustainability 2022, 15, 13. [Google Scholar] [CrossRef]
- Diaz-Chavez, R. Indicators for socio-economic sustainability assessment. In Socio-Economic Impacts of Bioenergy Production; Springer: Cham, Switzerland, 2014; pp. 17–37. Available online: https://link.springer.com/chapter/10.1007/978-3-319-03829-2_2 (accessed on 24 March 2025).
- Custodio, H.M.; Hadjikakou, M.; Bryan, B.A. A review of socioeconomic indicators of sustainability and wellbeing building on the social foundations framework. Ecol. Econ. 2022, 203, 107608. [Google Scholar] [CrossRef]
- Tisdell, C. Economic indicators to assess the sustainability of conservation farming projects: An evaluation. Agric. Ecosyst. Environ. 1996, 57, 117–131. [Google Scholar] [CrossRef]
- Afshari, H.; Agnihotri, S.; Searcy, C.; Jaber, M. Social sustainability indicators: A comprehensive review with application in the energy sector. Sustain. Prod. Consum. 2022, 31, 263–286. [Google Scholar] [CrossRef]
- Hale, J.; Legun, K.; Campbell, H.; Carolan, M. Social sustainability indicators as performance. Geoforum 2019, 103, 47–55. [Google Scholar] [CrossRef]
- Baffoe, G.; Mutisya, E. Social sustainability: A review of indicators and empirical application. Environ. Manag. Sustain. Dev. 2015, 4, 242–262. [Google Scholar] [CrossRef]
- Wolff, F.; Arne Heyen, D.; Brohmann, D.B.; Grießhammer, D.R.G. Transformative Environmental Policy: Consistently Promote and Shape Sustainable Development; German Environment Agency: Dessau-Roßlau, Germany, 2018; Available online: https://www.umweltbundesamt.de/sites/default/files/medien/1410/publikationen/transformative_environmental_policy_web.pdf (accessed on 21 March 2025).
- Binder, C.R.; Feola, G.; Steinberger, J.K. Considering the normative, systemic and procedural dimensions in indicator-based sustainability assessments in agriculture. Environ. Impact Assess. Rev. 2009, 30, 71–81. [Google Scholar] [CrossRef]
- Aszklar, H., Jr. The Window of Opportunity in Sustainability Transitions: An Empirical Investigation. Ph.D. Thesis, University of Cambridge, Cambridge, UK, 2024. [Google Scholar] [CrossRef]
- Geels, F.W.; Sovacool, B.K.; Schwanen, T.; Sorrell, S. The socio-technical dynamics of low-carbon transitions. Joule 2017, 1, 463–479. [Google Scholar] [CrossRef]
- Penna, C.C.R.; Goyeneche, O.Y.R.; Matti, C. Exploring indicators for monitoring sociotechnical system transitions through portfolio networks. Sci. Public Policy 2023, 50, 719–741. [Google Scholar] [CrossRef]
- Huber, S.T.; Steininger, K.W. Critical sustainability issues in the production of wind and solar electricity generation as well as storage facilities and possible solutions. J. Clean. Prod. 2022, 339, 130720. [Google Scholar] [CrossRef]
- Berthet, E.; Lavalley, J.; Anquetil-Deck, C.; Ballesteros, F.; Stadler, K.; Soytas, U.; Hauschild, M.; Laurent, A. Assessing the social and environmental impacts of critical mineral supply chains for the energy transition in Europe. Glob. Environ. Chang. 2024, 86, 102841. [Google Scholar] [CrossRef]
- Wüstenhagen, R.; Wolsink, M.; Bürer, M.J. Social acceptance of renewable energy innovation: An introduction to the concept. Energy Policy 2007, 35, 2683–2691. [Google Scholar] [CrossRef]
- Villers, M.; Pigosso, D.C.A.; Howard, T.J.; McAloone, T.C. Towards a unified absolute environmental sustainability decoupling indicator. Proc. Des. Soc. 2024, 4, 1507–1516. [Google Scholar] [CrossRef]
- Padilla-Rivera, A.; Hannouf, M.; Assefa, G.; Gates, I. A systematic literature review on current application of life cycle sustainability assessment: A focus on economic dimension and emerging technologies. Environ. Impact Assess. Rev. 2023, 103, 107268. [Google Scholar] [CrossRef]
- Steffen, W.; Richardson, K.; Rockström, J.; Cornell, S.E.; Fetzer, I.; Bennett, E.M.; Biggs, R.; Carpenter, S.R.; De Vries, W.; De Wit, C.A.; et al. Planetary boundaries: Guiding human development on a changing planet. Science 2015, 347, 1259855. [Google Scholar] [CrossRef] [PubMed]
- Richardson, K.; Steffen, W.; Lucht, W.; Bendtsen, J.; Cornell, S.E.; Donges, J.F.; Drüke, M.; Fetzer, I.; Bala, G.; Von Bloh, W.; et al. Earth beyond six of nine planetary boundaries. Sci. Adv. 2023, 9, eadh2458. [Google Scholar] [CrossRef]
- Salathé-Beaulieu, G. Sustainable Development Impact Indicators for Social and Solidarity Economy: State of the Art. 2019. Available online: https://www.econstor.eu/handle/10419/246230 (accessed on 24 March 2025).
- Devezas, T.C. Evolutionary theory of technological change: State-of-the-art and new approaches. Technol. Forecast. Soc. Chang. 2005, 72, 1137–1152. [Google Scholar] [CrossRef]
- Condamine, F.L.; Guinot, G.; Benton, M.J.; Currie, P.J. Dinosaur biodiversity declined well before the asteroid impact, influenced by ecological and environmental pressures. Nat. Commun. 2021, 12, 3833. [Google Scholar] [CrossRef]
- Chiarenza, A.A.; Brusatte, S.L. Dinosaurs, extinction theories for. In Encyclopedia of Biodiversity; Elsevier: Amsterdam, The Netherlands, 2024. [Google Scholar] [CrossRef]
- Upchurch, P.; Chiarenza, A.A. A brief review of non-avian dinosaur biogeography: State-of-the-art and prospectus. Biol. Lett. 2024, 20, 20240429. [Google Scholar] [CrossRef]
- Wortel, M.T.; Agashe, D.; Bailey, S.F.; Bank, C.; Bisschop, K.; Blankers, T.; Cairns, J.; Colizzi, E.S.; Cusseddu, D.; Desai, M.M.; et al. Towards evolutionary predictions: Current promises and challenges. Evol. Appl. 2022, 16, 3–21. [Google Scholar] [CrossRef]
- Yan, K.K.; Wang, D.; Xiong, K.; Gerstein, M. Comparing technological development and biological evolution from a network perspective. Cell Syst. 2020, 10, 219–222. [Google Scholar] [CrossRef]
- ISO:14040; Environmental Management—Life Cycle Assessment—Principles and Framework. Standard ISO 14040:2006; International Organization for Standardization: Geneva, Switzerland, 2006.
- Paulillo, A.; Sanyé-Mengual, E. Approaches to incorporate planetary boundaries in life cycle assessment: A critical review. Resour. Environ. Sustain. 2024, 17, 100169. [Google Scholar] [CrossRef]
- Bjørn, A.; Chandrakumar, C.; Boulay, A.M.; Doka, G.; Fang, K.; Gondran, N.; Hauschild, M.Z.; Kerkhof, A.; King, H.; Margni, M.; et al. Review of life-cycle based methods for absolute environmental sustainability assessment and their applications. Environ. Res. Lett. 2020, 15, 083001. [Google Scholar] [CrossRef]
- Hauschild, M.Z.; Kara, S.; Røpke, I. Absolute sustainability: Challenges to life cycle engineering. CIRP Ann. 2020, 69, 533–553. [Google Scholar] [CrossRef]
- ISO:18458; Biomimetics—Terminology, Concepts and Methodology. Standard ISO 18458:2015-05; International Organization for Standardization: Geneva, Switzerland, 2015.
- Barthlott, W.; Neinhuis, C. Purity of the sacred lotus, or escape from contamination in biological surfaces. Planta 1997, 202, 1–8. [Google Scholar] [CrossRef]
- Barthlott, W.; Mail, M.; Neinhuis, C. Superhydrophobic hierarchically structured surfaces in biology: Evolution, structural principles and biomimetic applications. Philos. Trans. R. Soc. A Math. Phys. Eng. Sci. 2016, 374, 20160191. [Google Scholar] [CrossRef] [PubMed]
- VDI:6221; Biomimetics—Biomimetic Surfaces. Standard VDI 6221 2013-09; Verein Deutscher Ingenieure, Beuth: Berlin, Germany, 2013.
- Antony, F.; Grießhammer, R.; Speck, T.; Speck, O. The cleaner, the greener? Product sustainability assessment of the biomimetic façade paint Lotusan® in comparison to the conventional façade paint Jumbosil®. Beilstein J. Nanotechnol. 2016, 7, 2100–2115. [Google Scholar] [CrossRef]
- Bauknecht, D.; Brohmann, B.; Grießhammer, R.; Bach, M.; Funke, S. Gesellschaftlicher Wandel als Mehrebenenansatz; Umweltbundesamt: Dessau-Roßlau, Germany, 2015; Available online: https://www.umweltbundesamt.de/sites/default/files/medien/378/publikationen/texte_66_2015_gesellschaftlicher_wandel_als_mehrebenenansatz_3.pdf (accessed on 2 June 2025).
- Otto, K.S.; Speck, T. Darwin Meets Business; Gabler: Wiesbaden, Germany, 2011. [Google Scholar]
- Day, T.; Kennedy, D.A.; Read, A.F.; McAdams, D. The economics of managing evolution. PLoS Biol. 2021, 19, e3001409. [Google Scholar] [CrossRef]
- Bundesregierung. Solarstrom vom Balkon. 2024. Available online: https://www.bundesregierung.de/breg-de/aktuelles/solarpaket-photovoltaik-balkonkraftwerke-2213726 (accessed on 30 March 2025).
- Merriam-Webster.com, Dictionary. “Anthropocentric”. Available online: https://www.merriam-webster.com/dictionary/anthropocentric (accessed on 28 November 2024).
- Speck, O.; Speck, D.; Horn, R.; Gantner, J.; Sedlbauer, K.P. Biomimetic bio-inspired biomorph sustainable? An attempt to classify and clarify biology-derived technical developments. Bioinspiration & Biomimetics 2017, 12, 011004. [Google Scholar] [CrossRef]
- Lexikon der Biologie, Redaktion. “Koevolution”. 2001. Available online: https://www.spektrum.de/lexikon/biologie-kompakt/koevolution/6493 (accessed on 23 October 2024).
- International Energy Agency. What Is Demand Response? Available online: https://www.iea.org/energy-system/energy-efficiency-and-demand/demand-response (accessed on 31 March 2025).
- Faith, D.P. Conservation evaluation and phylogenetic diversity. Biol. Conserv. 1992, 61, 1–10. [Google Scholar] [CrossRef]
- Pickering, B.; Lombardi, F.; Pfenninger, S. Diversity of options to eliminate fossil fuels and reach carbon neutrality across the entire European energy system. Joule 2022, 6, 1253–1276. [Google Scholar] [CrossRef] [PubMed]
- Lexikon der Biologie, Redaktion. “Diversifizierung”. 1999. Available online: https://www.spektrum.de/lexikon/biologie/diversifizierung/18797 (accessed on 28 March 2025).
- Ceipek, R.; Hautz, J.; Mayer, M.C.; Matzler, K. Technological diversification: A systematic review of antecedents, outcomes and moderating effects. Int. J. Manag. Rev. 2019, 21, 466–497. [Google Scholar] [CrossRef]
- Merriam-Webster.com, Dictionary. “Ecosphere”. Available online: https://www.merriam-webster.com/dictionary/ecosphere (accessed on 18 December 2024).
- Losos, J.B. Convergence, adaptation, and constraint. Evolution 2011, 65, 1827–1840. [Google Scholar] [CrossRef] [PubMed]
- David, M. Moving beyond the heuristic of creative destruction: Targeting exnovation with policy mixes for energy transitions. Energy Res. Soc. Sci. 2017, 33, 138–146. [Google Scholar] [CrossRef]
- Merriam-Webster.com, Dictionary. “Fitness”. Available online: https://www.merriam-webster.com/dictionary/fitness (accessed on 12 September 2024).
- Beedanagari, S.; Vulimiri, S.; Bhatia, S.; Mahadevan, B. Genotoxicity biomarkers: Molecular basis of genetic variability and susceptibility. In Biomarkers in Toxicology; Elsevier: Amsterdam, The Netherlands, 2014; pp. 729–742. [Google Scholar] [CrossRef]
- Hardyment, R. Measuring Good Business: Making Sense of Environmental, Social and Governance (ESG) Data; Taylor & Francis: London, UK, 2024. [Google Scholar]
- Azzone, G.; Noci, G.; Manzini, R.; Welford, R.; Young, C.W. Defining environmental performance indicators: An integrated framework. Bus. Strategy Environ. 1996, 5, 69–80. [Google Scholar] [CrossRef]
- Lexikon der Biologie, Redaktion. “Landschaft”. 1999. Available online: https://www.spektrum.de/lexikon/biologie-kompakt/landschaft/6823 (accessed on 22 September 2024).
- Sikdar, S.K. Sustainable development and sustainability metrics. AIChE J. 2003, 49, 1928–1932. [Google Scholar] [CrossRef]
- Lexikon der Biologie, Redaktion. “Ökologische Nische”. 1999. Available online: https://www.spektrum.de/lexikon/biologie/oekologische-nische/47465 (accessed on 22 September 2024).
- Kotilainen, K. Energy prosumers’ role in the sustainable energy system. In Affordable and Clean Energy; Springer: Cham, Switzerland, 2019; pp. 1–14. [Google Scholar] [CrossRef]
- Geels, F.W. Socio-technical transitions to sustainability: A review of criticisms and elaborations of the multi-level perspective. Curr. Opin. Environ. Sustain. 2019, 39, 187–201. [Google Scholar] [CrossRef]
- Lexikon der Biologie, Redaktion. “Isolation”. 1999. Available online: https://www.spektrum.de/lexikon/biologie/isolation/34657 (accessed on 13 September 2024).
- Folke, C. Resilience (republished). Ecol. Soc. 2016, 21, 44. [Google Scholar] [CrossRef]
- Khammash, M. An engineering viewpoint on biological robustness. BMC Biol. 2016, 14, 22. [Google Scholar] [CrossRef]
- Geels, F.W. From sectoral systems of innovation to socio-technical systems: Insights about dynamics and change from sociology and institutional theory. Res. Policy 2004, 33, 897–920. [Google Scholar] [CrossRef]
- Bainbridge, W.S.; Roco, M.C. Science and technology convergence: With emphasis for nanotechnology-inspired convergence. J. Nanoparticle Res. 2016, 18, 211. [Google Scholar] [CrossRef]
- Girardet, H. Biosphere and Technosphere. 2022. Available online: https://theecologist.org/2022/nov/28/biosphere-and-technosphere (accessed on 24 March 2025).
- Cambridge Dictionary. “Teething problems”. Available online: https://dictionary.cambridge.org/dictionary/english/teething-problems (accessed on 28 November 2024).
- Duignan, B. “Teleology”. Available online: https://www.britannica.com/topic/teleology (accessed on 28 November 2024).
- Klump, J.; Wyborn, L.; Wu, M.; Martin, J.; Downs, R.R.; Asmi, A. Versioning data is about more than revisions: A conceptual framework and proposed principles. Data Sci. J. 2021, 20, 12. [Google Scholar] [CrossRef]


| Biological Evolution | Evolution Strategy | |
|---|---|---|
| Subject | Living being | Object to be optimized |
| Mutation | Random change of genetic information | Random change of input variables (i.e., object parameters) |
| Recombination | Reshuffling of parental genetic material (e.g., meiosis) | New combination of parental object parameters |
| Selection | Selection of those individuals with the best fit to the natural environment | Selection of those individuals that best meet the optimization criterion |
| Result | Adapted organism | Optimized object |
Disclaimer/Publisher’s Note: The statements, opinions and data contained in all publications are solely those of the individual author(s) and contributor(s) and not of MDPI and/or the editor(s). MDPI and/or the editor(s) disclaim responsibility for any injury to people or property resulting from any ideas, methods, instructions or products referred to in the content. |
© 2025 by the authors. Licensee MDPI, Basel, Switzerland. This article is an open access article distributed under the terms and conditions of the Creative Commons Attribution (CC BY) license (https://creativecommons.org/licenses/by/4.0/).
Share and Cite
Möller, M.; Speck, O.; Thekkepat, H.; Speck, T. Transition Processes in Technological Systems: Inspiration from Processes in Biological Evolution. Biomimetics 2025, 10, 406. https://doi.org/10.3390/biomimetics10060406
Möller M, Speck O, Thekkepat H, Speck T. Transition Processes in Technological Systems: Inspiration from Processes in Biological Evolution. Biomimetics. 2025; 10(6):406. https://doi.org/10.3390/biomimetics10060406
Chicago/Turabian StyleMöller, Martin, Olga Speck, Harishankar Thekkepat, and Thomas Speck. 2025. "Transition Processes in Technological Systems: Inspiration from Processes in Biological Evolution" Biomimetics 10, no. 6: 406. https://doi.org/10.3390/biomimetics10060406
APA StyleMöller, M., Speck, O., Thekkepat, H., & Speck, T. (2025). Transition Processes in Technological Systems: Inspiration from Processes in Biological Evolution. Biomimetics, 10(6), 406. https://doi.org/10.3390/biomimetics10060406