1. Introduction
The airfoil is a fundamental element that constitutes the blades of a wind turbine. Considering the public acceptance of wind turbines and environmental viability, developing efficient and low-noise airfoils is crucial for effectively improving the performance and reducing the noise of wind turbines. As we know, the airfoil noise can be divided into two types: self-noise and inflow-turbulence noise [
1,
2]. Airfoil self-noise is generally the result of interactions between the airfoil and its boundary layer, and it arises from flow instability in the boundary layer. Inflow-turbulence noise is caused by the interaction between the airfoil and the incoming unsteady wind gusts. In general, the leading-edge noise generated by the free-flow turbulence is the same as the trailing-edge noise, but the free-flow scale of the leading-edge boundary layer is larger than that of the trailing-edge turbulence. Therefore, the lower the leading-edge noise frequency, the larger its coherence scale and the stronger the noise radiation. Because of the interaction between complex atmospheric inflow and wind turbine blades [
3], low-frequency broadband noise is generated.
Interest in developing methods and strategies to suppress the aerodynamic noise generation of airfoils is still growing. The noise-reducing effectiveness of the bionic leading-edge serrations has been scientifically confirmed by several researchers. However, most of these studies have focused on traditional triangular serrations [
4,
5,
6,
7]. On the other hand, although considerable achievements have been made in previous studies on the serrations, the experimental measurements and numerical simulations of the noise reduction mechanisms of bionic serrations for the airfoils still require significant time and material costs.
It is worth noting that the proposed analytical solution has important practical significance for highlighting the more essential noise reduction mechanism of leading-edge serrations for the flat plate. The most common approach to examining these noise reduction mechanisms is the study of the acoustic response between convective gusts and semi-infinite plates with serrations [
8]. Sears carried out such experiments to establish the aerodynamic response of a two-dimensional flat plate subjected to sinusoidal gusts [
9]. The theories of Kirchhoff and Curle are employed in Amiet’s approach [
10] to obtain the far-field acoustic power spectrum of a single sinusoidal incoming gust in a subsonic flow. In principle, if the wavenumber spectrum of the vertical velocity fluctuations is accurately modeled, the far-field acoustic response can be robustly predicted. The analysis can be simplified by considering a particular wavenumber component of the turbulence received by the observer, and the results of the simplification show good agreement with experiments.
Amiet’s theoretical model is extended by Lyu et al. [
11] and applied to the airfoils with leading-edge serrations. Fourier-series expansion and the Schwarzschild technique are employed to solve this model. The far-field acoustic power density is also established according to the incident turbulent velocity statistics. An analytical solution of the theoretical model proposed by Huang et al. [
12] is closed by Fourier-series expansion and the Wiener–Hopf method. However, these theoretical analyses usually depend on standard Fourier-series expansions in the extended coordinates of the leading-edge serrations. Therefore, revealing the noise reduction mechanisms is rather more difficult. Envia [
13] used the Fourier transform and the Wiener–Hopf method to calculate an approximate solution. This is conducive to obtaining expressions for the far-field acoustics and conducting a parametric study. Enlighted by this processing method, Ayton and Kim [
14] proposed a more concise form of the analytical solution. Their method avoids the numerical step of solving the far-field acoustic response by converting the control equations and boundary conditions based on the variable transformation. This method provides theoretical support for rapidly evaluating the noise-reducing effectiveness of serrations.
Chaitanya et al. [
15] proposed a double-wavelength serrated structure formed by the superposition of serrations of two different frequencies, amplitudes, and phases, and they evaluated its aerodynamic performance. They revealed the noise reduction mechanism in relation to source control and radiation control, and they concluded that double-wavelength serrations are more effective at reducing broadband noise than single-wavelength serrations. After applying the conclusions that they obtained using a flat plate to a 3D airfoil, they found that the overall sound suppression is almost equally effective, although the effect is weakened at the roots of the serrations. Recently, a new serration type with a parameterized profile was proposed by Lyu et al. [
16], and it was evaluated using an analytical model based on the dimensionless streamwise hydrodynamic wavenumber. Compared with traditional serrations, the acoustic performance was improved within a specific frequency range, while the undesired deterioration was found to occur at low frequencies. Additionally, the correctness of the trend predicted by the analytical model was also verified by experiments. In another study, leading-edge serrations possessing multiple bionic elements were embedded into an airfoil [
17]. In comparison with traditional serrations, an additional noise attenuation level of 3.4 dB was achieved by the inclusion of iron-shaped serrations. In conclusion, serrations have potential for suppressing the aerodynamic noise of airfoils [
18], and greater noise reduction levels can be achieved by optimizing the serrated structures.
For the wings of natural birds, the wavelengths of the non-smooth-edge serrations are non-uniformly distributed. Therefore, the noise reduction effect of serrations comprised of two frequency components of different amplitudes and phases is worth exploring. The phase interference principle and noise reduction mechanisms involved are critical for further sound suppression. The slits are also considered at the root of serrations for further noise reduction. Moreover, the aerodynamic performance of airfoils is inevitably affected by the serrated structures. Based on relevant experimental results [
19], leading-edge serrations have a relatively small impact on the aerodynamic performance of symmetric airfoils. At a small angle of attack, the aerodynamic performance of an airfoil is even improved by leading-edge serrations. However, the negative impact of serrations on the aerodynamic performance of asymmetric airfoils still exists. Therefore, the laws of the influence of serrations on aerodynamic performance are complex. Generally, simple estimations are conducted using previous experimental experience or computational fluid dynamics. Combining a study [
18] and relative engineering experience, amplitudes have a higher sensitivity to aerodynamic performance. Therefore, the amplitude of the serrations is determined through empirical coefficients at first, and then the shape of serrations is selected.
Specific serrations exhibit different acoustic performances with varying tip-to-root ratios. For this reason, it is difficult to establish a serrated structure that will be the most appropriate for a given application from a single experiment or numerical simulation. The advantage of an analytical solution is that if the scattered sound fields from any leading-edge serrations could be determined, the acoustic responses under the particular flow parameters would be rapidly predicted. As a result, many repeated experimental designs and a large amount of time-consuming numerical simulations are avoided. In our previous work [
20], the noise-reducing abilities of leading-edge serrations of different shapes with different tip-to-root ratios for a flat plate were examined, based on the theory of Ayton and Chaitanya [
8]. However, the orthogonal experimental method was used in the previous work, and the optimal design of the leading-edge serrations was limited by the selected range of the parameters. In this study, a meta-heuristic optimization algorithm is introduced into the analytical solution to seek and assess optimal double-wavelength serration profiles at specific tip-to-root ratios. The weights of the salient influences are further analyzed for different amplitudes, which is important for obtaining performance gains. Through a numerical analysis, the understanding of the essential noise-mitigating mechanisms is deepened. To improve the accuracy of the predictive model in the high-frequency range, a trailing-edge self-noise model is also considered. This study will provide a valuable theoretical reference for the noise reduction design of airfoils.
2. Analytical Formulation
The noise reduction mechanism of double-wavelength structures is investigated by combining the analytical model proposed by Ayton and Chaitanya [
8] and a trailing-edge self-noise model. The corresponding theory provides the fast-response approach to acoustic prediction, and its effectiveness has been verified by corresponding experimental and numerical results [
16,
21]. A low-noise leading-edge shape can be quickly obtained after determining the flow parameters of the leading-edge geometry.
The model of these serrations is simplified, as shown in
Figure 1. Here, a zero-thickness semi-infinite plate at a 0° attack angle placed in a mean incoming component of an incident gust is supposed to represent a serrated airfoil;
x,
y, and
z denote the streamwise direction, the spanwise direction, and the wall-normal direction, respectively [
22]. Furthermore, Taylor’s frozen hypothesis is applied in the gusts that are assumed to be a two-dimensional spectrum. Significantly, the airfoil and serrations are periodic in the spanwise direction. The span length is much more than the spanwise correlation length of the boundary-layer turbulence [
23].
In the model, all boundaries are away from any discontinuities of the leading edge. The settings are adopted to ensure that the influence of a discontinuous function can be avoided. The shape function is restricted to a single-value piecewise linear function, and quasi-periodic boundary conditions are imposed at 0 and 1. Therefore, the spanwise region of the unit length is limited in the range of . The tip-to-root length, which is related to the sharpness of the serrations, is defined as , and the geometric functions of the serrations are modeled as . Additionally, represents the dimensionless tip-to-root length that is normalized by the wavelength .
An analytical solution for the acoustic results at a given frequency is obtained using Wiener–Hopf equation method and Fourier transform to separate variables from the convection Helmholtz equation. A more detailed process can be derived from reference [
22]. The power spectral density is obtained by the following equation:
where
is far-field monitoring point.
, where
M is defined as
and
is the speed of sound.
;
;
,
,
. The radiation integral function
is defined by
where
.
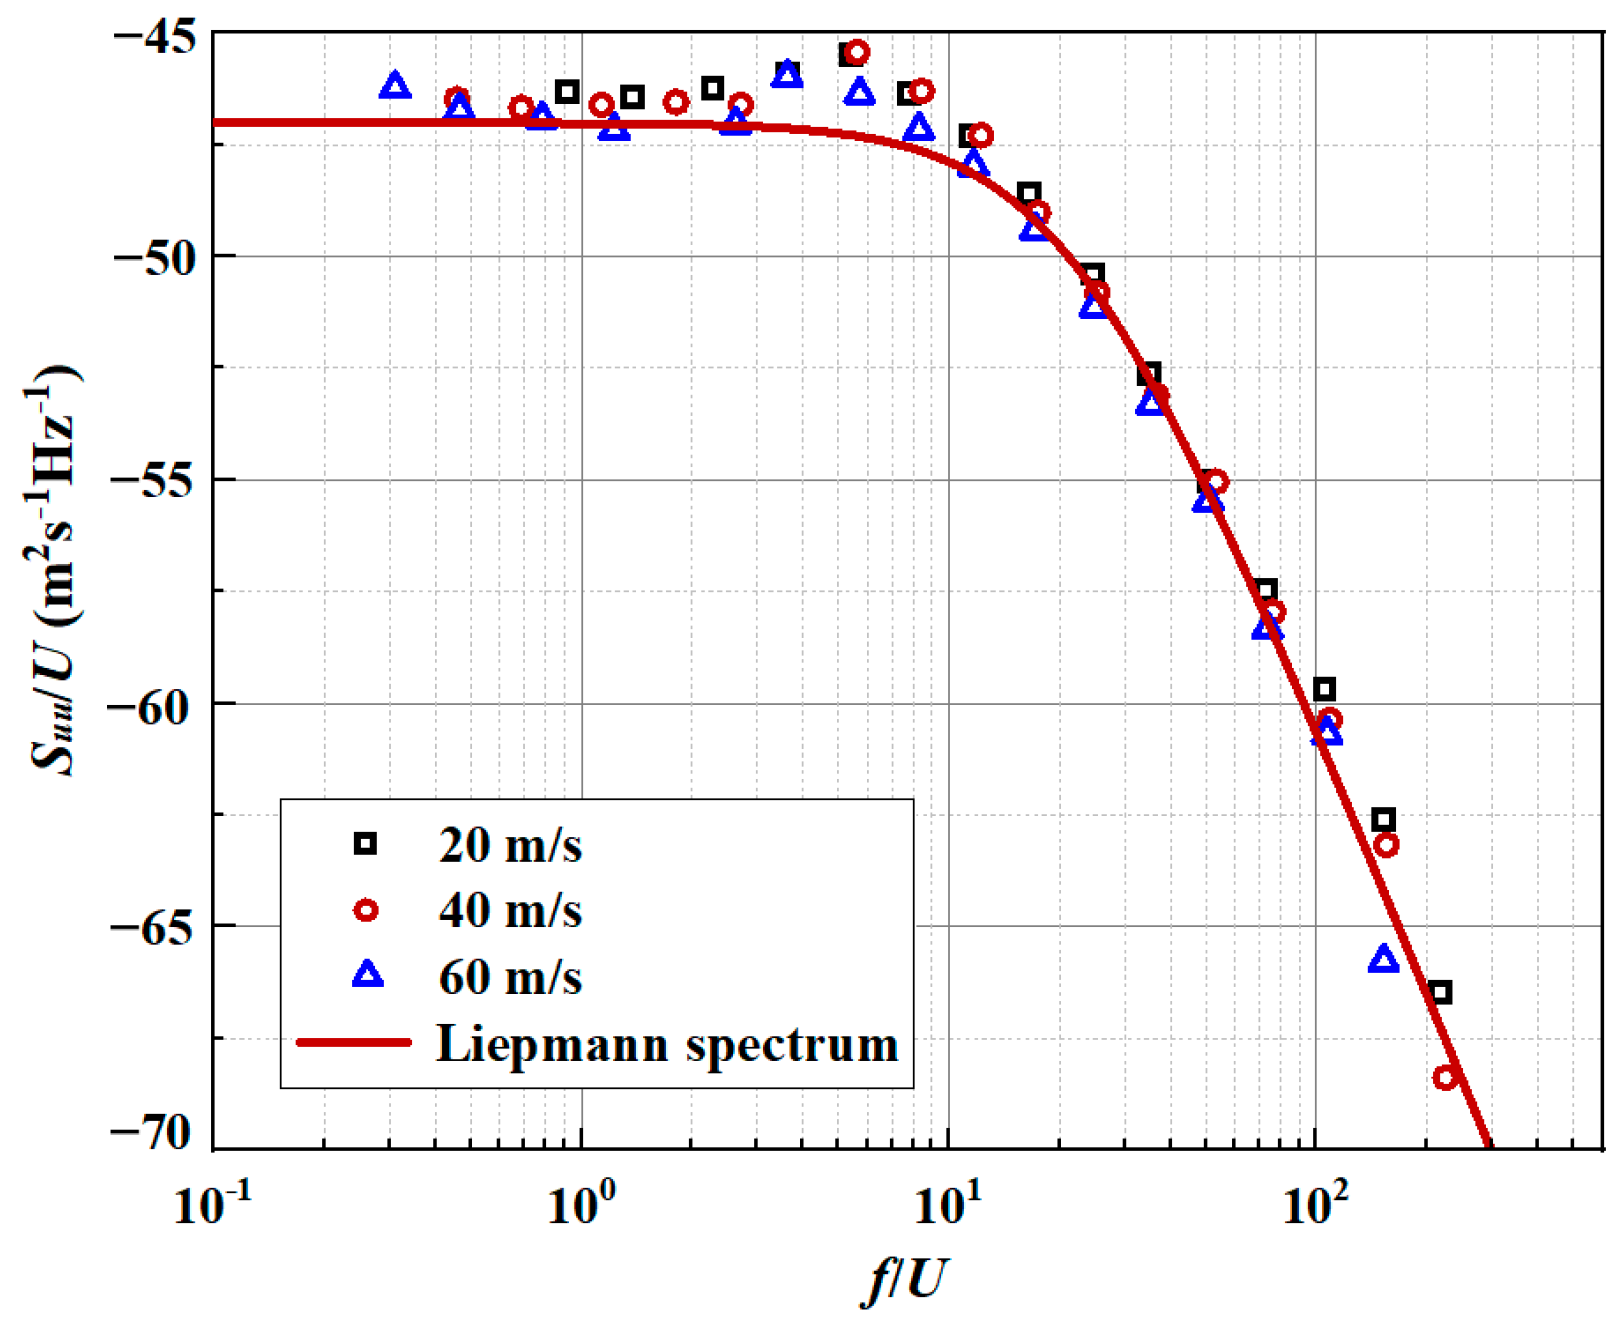
The energy spectrum (Liepmann spectrum) of the upstream vertical fluctuation is defined by
where
is the integral length scale of turbulence. The integral scale estimated by the turbulence spectrum measured by hot wire anemometry is set as 7.5 mm.
represents the turbulent intensity, which is defined as 2.5% of the free-stream velocity. The free-stream velocity is set as 60 m/s.
Consistent with our previous work [
20], the experimental data of the mean velocity fluctuation spectrum for the incoming airflow velocities of 20 m/s, 40 m/s, and 60 m/s are also extracted in this paper. A sampling frequency of 50 KHz and a window size with 1024 data points are used in this analytical model solution. More details on the implementation of the experiment can be found reference [
24]. As depicted in
Figure 2, the energy spectra of different velocity fluctuations can be well reflected above both analytical energy spectra. It can be shown that the distribution of the theoretical Liepmann spectra is in good agreement with the experimental data over the overall frequency range. The homogeneous turbulence spectrum is estimated by Taylor’s hypothesis [
25]. Notably, division by the mean velocity is necessary to ensure that the energy spectrum integrates with the mean square velocity fluctuation.
3. Experimental Verification
A flat plate is established to complete the fundamental parameter settings in this study. The plate is set with a mean chord of 150 mm, and its span is set to three times the chord. The emission angle range of the microphone receiving the sound source is set to 40–140°. The receiving points are located on the arc with a radius of 1.2 m from the leading edge of the flat plate. The serrations with tip-to-root ratios
of 0.5, 1.0, and 2.0 are implemented on the plate to analyze the acoustic sensitivity of the sound source. As the tip-to-root ratio increases, the analytical results of Lyu’s model [
22] are found to differ greatly from the experimental results over the high-frequency band without considering the trailing-edge self-noise. Generally, the chord length of the investigated airfoil is finite, and so trailing-edge self-noise will inevitably be generated by the experimental device. That is to say, the effectiveness of the noise reduction resulting from the leading-edge serrations will be limited by the emission of trailing-edge self-noise, as noted in Narayanan’s 2018 work [
24]. Therefore, trailing-edge self-noise is taken into account during the acoustic evaluation conducted in this study.
The generation of trailing-edge self-noise originates from the interaction between solids and flow turbulence. This interaction generates pressure fluctuations, leading to energy scattering and converting the turbulent kinetic energy into sound energy [
26]. It is essentially broadband noise [
27]. Brooks et al. [
28] elucidate five self-noise mechanisms under subsonic flow conditions. Based on the edge scattering formula proposed by Ffowcs Williams and Hall, the trailing-edge noise of the turbulent boundary layer can be solved with the average turbulent boundary layer thickness as the required length scale. Brooks and Marcolini [
29] conducted experimental research to quantitatively separate the tip noise. A quantitative prediction method has been proposed from the perspective of data scaling. Grosveld’s study [
30] found that scaling models can explain the spectral behavior of the broadband noise at high frequency in wind turbines. Chou and George [
31] constructed corresponding noise-solving models for previous noisy data by replacing scaling. But, they did not consider the variations in the boundary layer thickness and specific shape details. Therefore, a more universal and accurate model becomes particularly important.
The BPM method for predicting trailing-edge self-noise was proposed by Brooks, Pope, and Marcolini in 1989 [
27], which established the self-noise mechanisms caused by five particular boundary layers. In their work, a series of aeroacoustic results based on airfoil sections were verified in an anechoic wind tunnel, along with the broadband noise from a large helicopter rotor model. Since the BPM method has the advantage of combining a large number of empirical parameters related to experiments, it has become an important method for some complex noise prediction schemes.
The overall sound pressure level generated by the turbulent boundary layer trailing edge is given by
where
Here,
and
denote the sound pressure levels and the boundary-layer displacement thicknesses caused by the pressure side, respectively;
and
denote the sound pressure levels and the boundary-layer displacement thicknesses caused by the suction side, respectively;
and
denote the angle-dependent sound pressure level and the boundary-layer displacement thicknesses caused by the angle of attack, respectively;
L is the span length;
is the directivity function; and
is the angle from the source streamwise axis
x to the observer.
is the angle from the source lateral axis
y to the observer. The subscript
e indicates the retarded coordinate. The overbar of
denotes that it is normalized by the trailing-edge noise radiated in the direction of
and
. Therefore,
= 1. More details with respect to definitions can be obtained from Appendix B in reference [
27]. The coefficient
A is the spectral shape function for the trailing-edge noise caused by the turbulent boundary layer, and
B is the separation noise.
K1 and
are constants;
is the Reynolds number based on pressure-side displacement thickness.
,
,
, and
denote the different Strouhal numbers associated with the turbulent boundary layer trailing edge and separation noise scaling, respectively.
represents the distance between the receiving point of the sound source and the trailing edge (
).
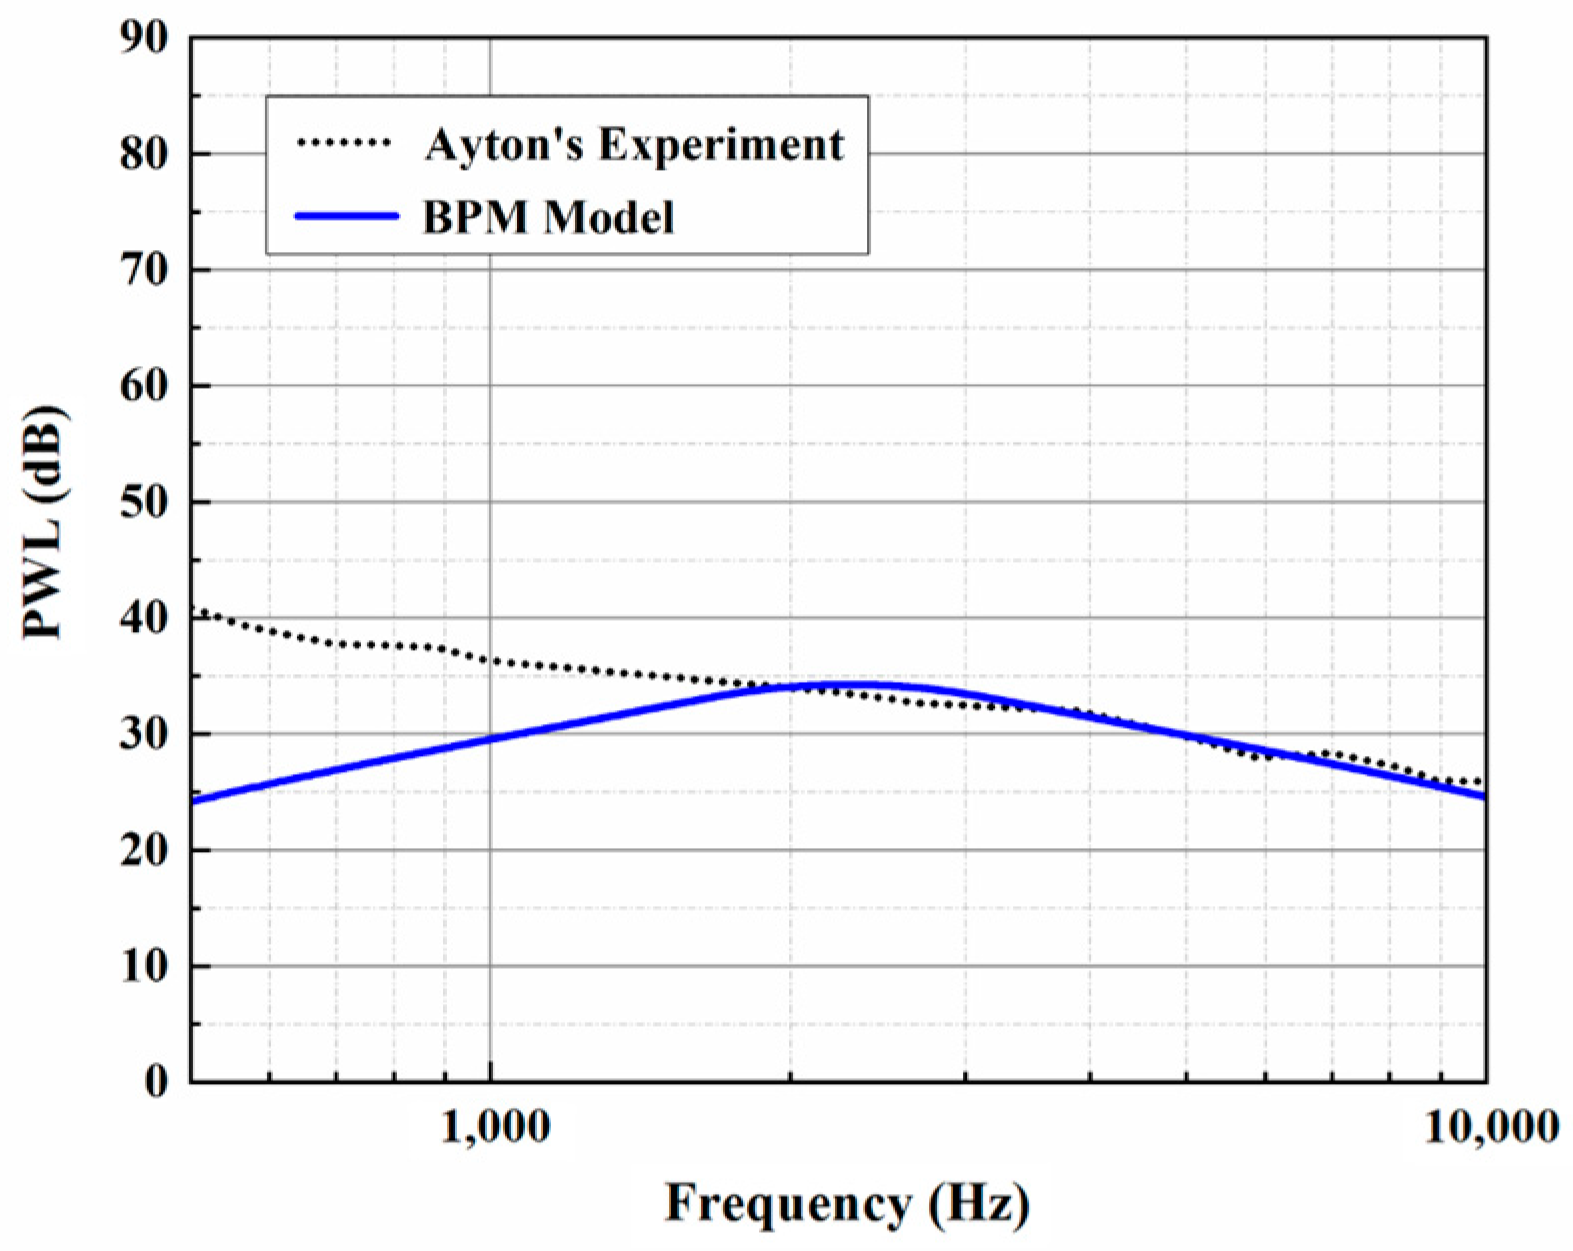
The trailing-edge parameters in this study are selected and used for the analytical sound prediction, which coincide with the corresponding experimental data for
Hz, as shown in
Figure 3. Based on that, the effectiveness of the BPM method is considered to have been verified. It is worth noting that trailing-edge self-noise plays an important role in an acoustic evaluation at larger
values. A larger
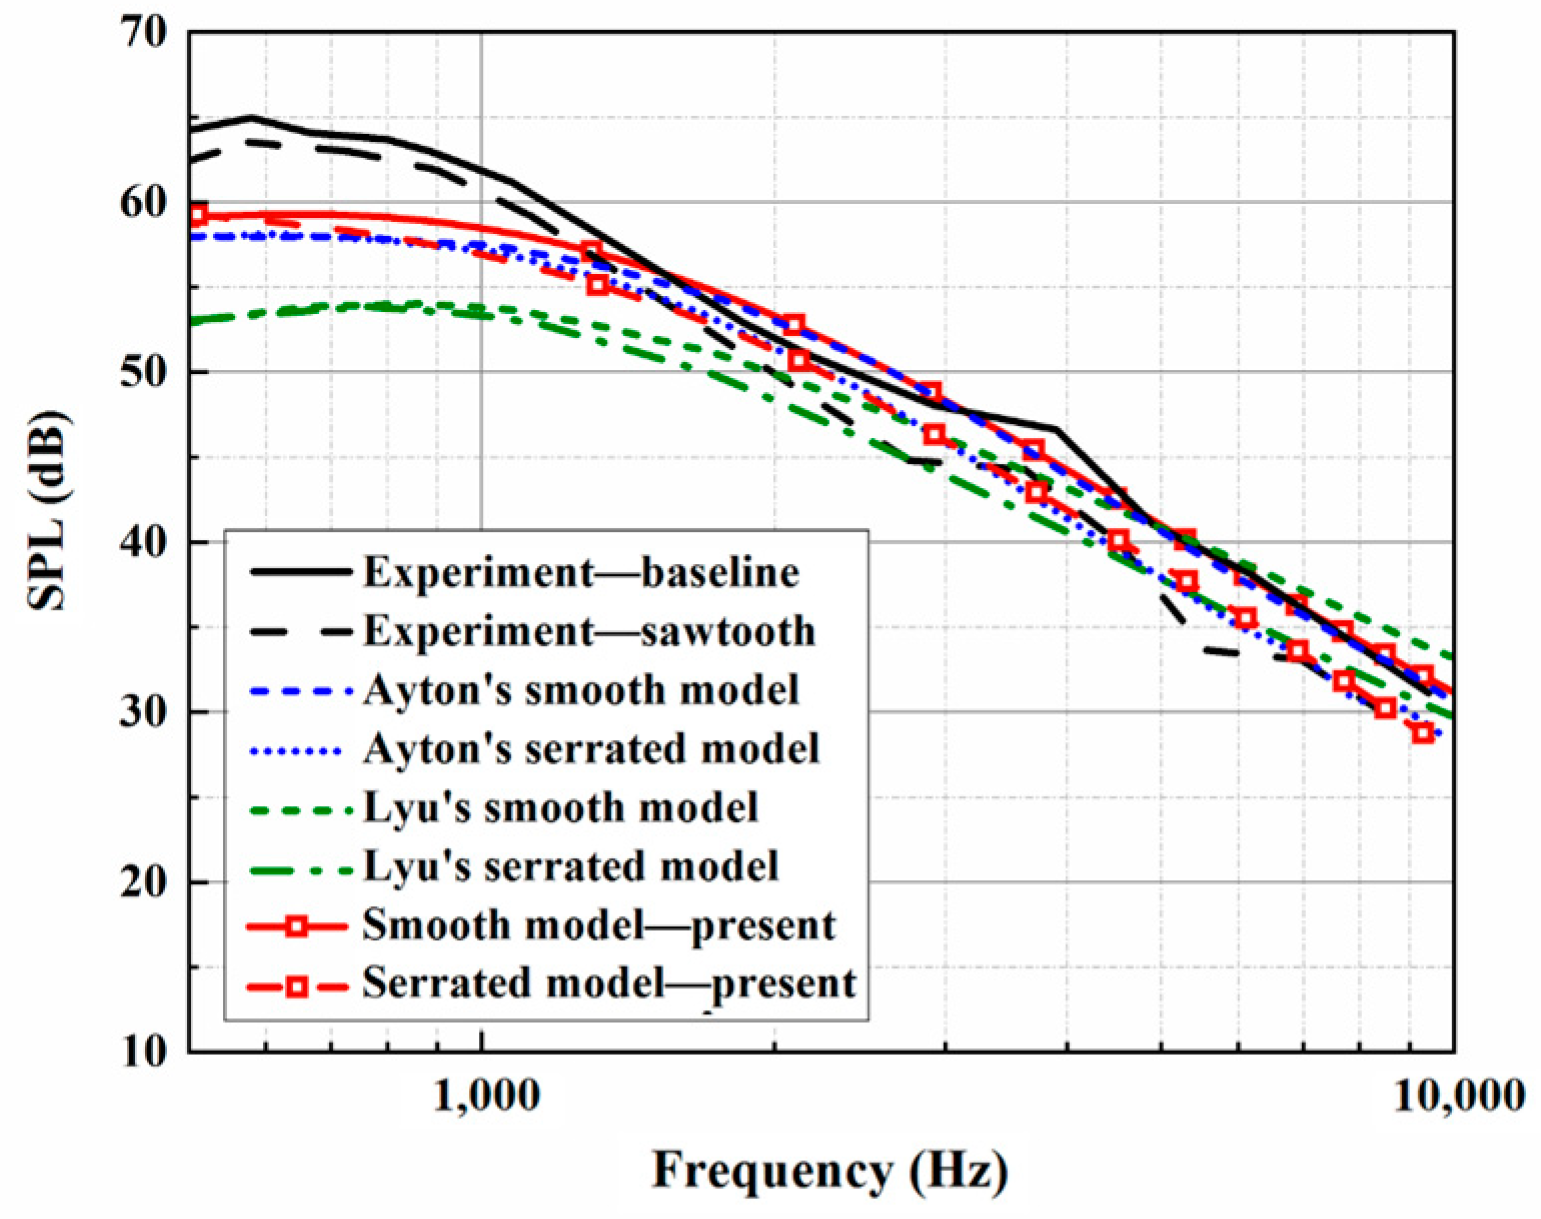
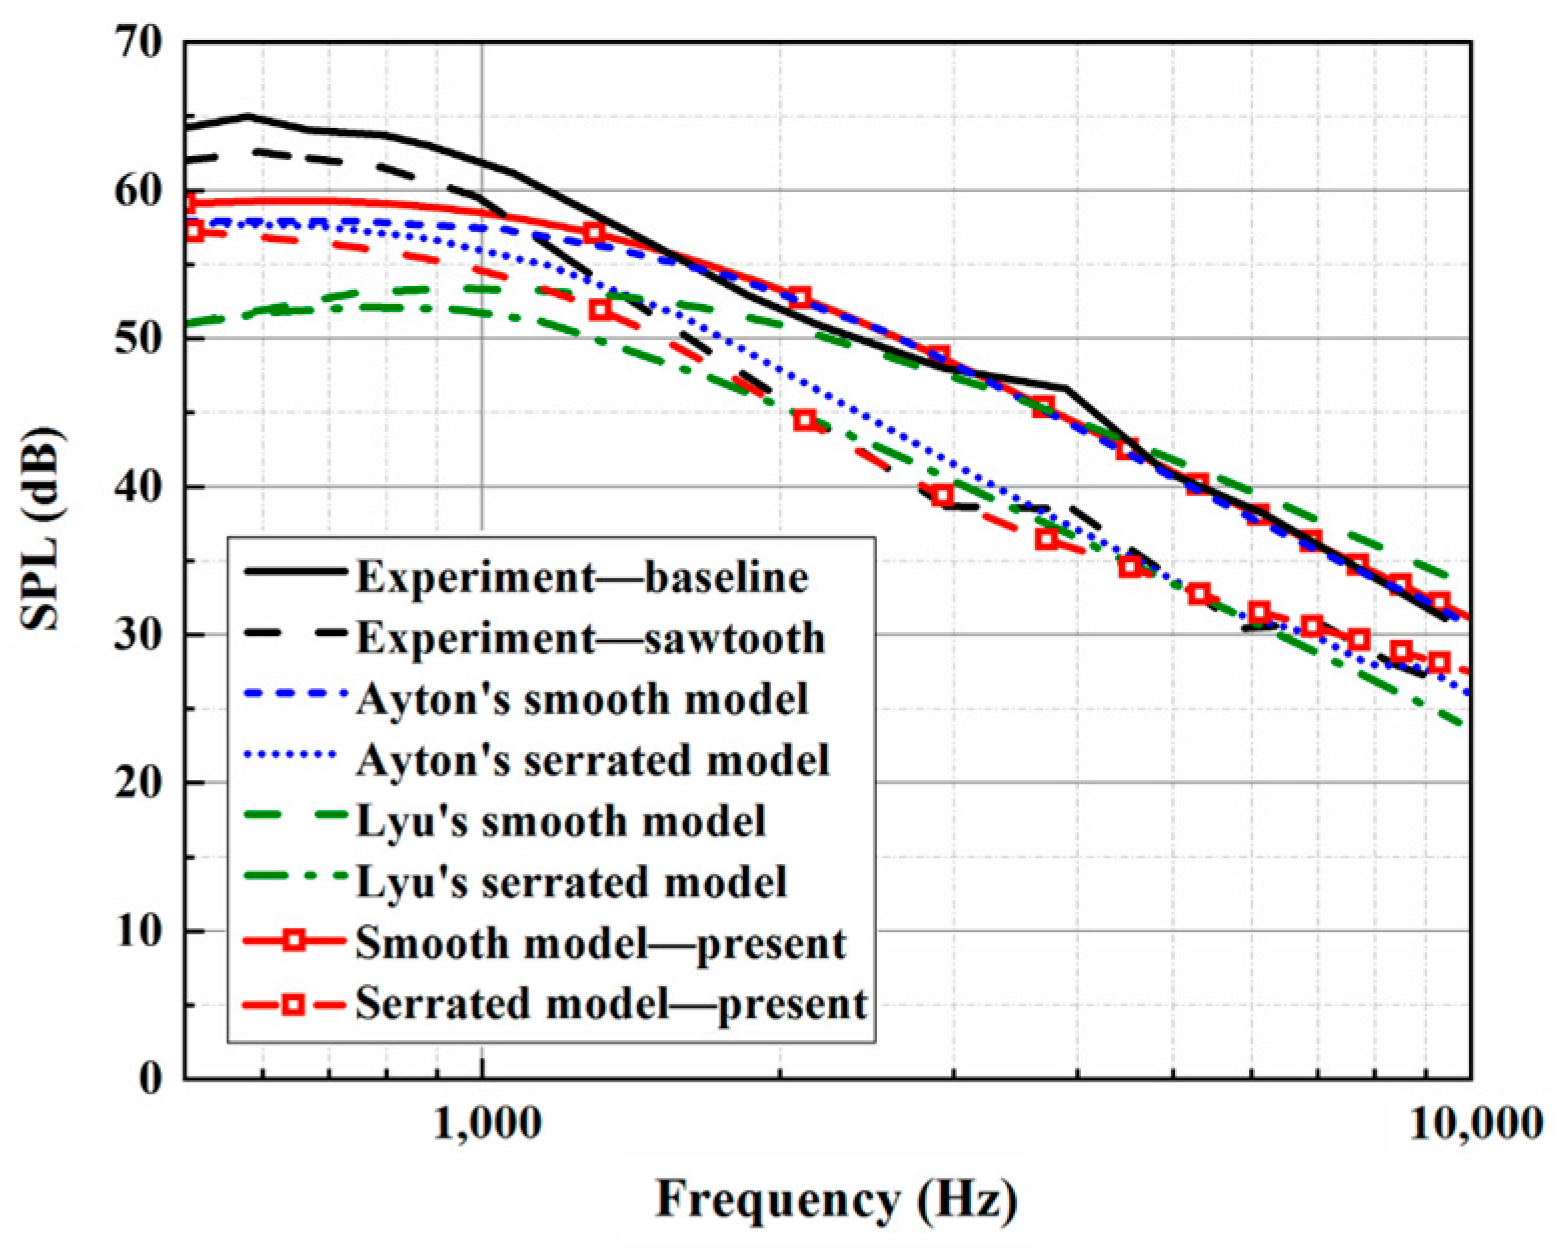
h promotes a reduction in LE noise, making self-noise function over a wider frequency range. When considering trailing-edge self-noise, the sound pressure level distributions show good agreement between Ayton’s model and the experimental data in the high-frequency region, as shown in
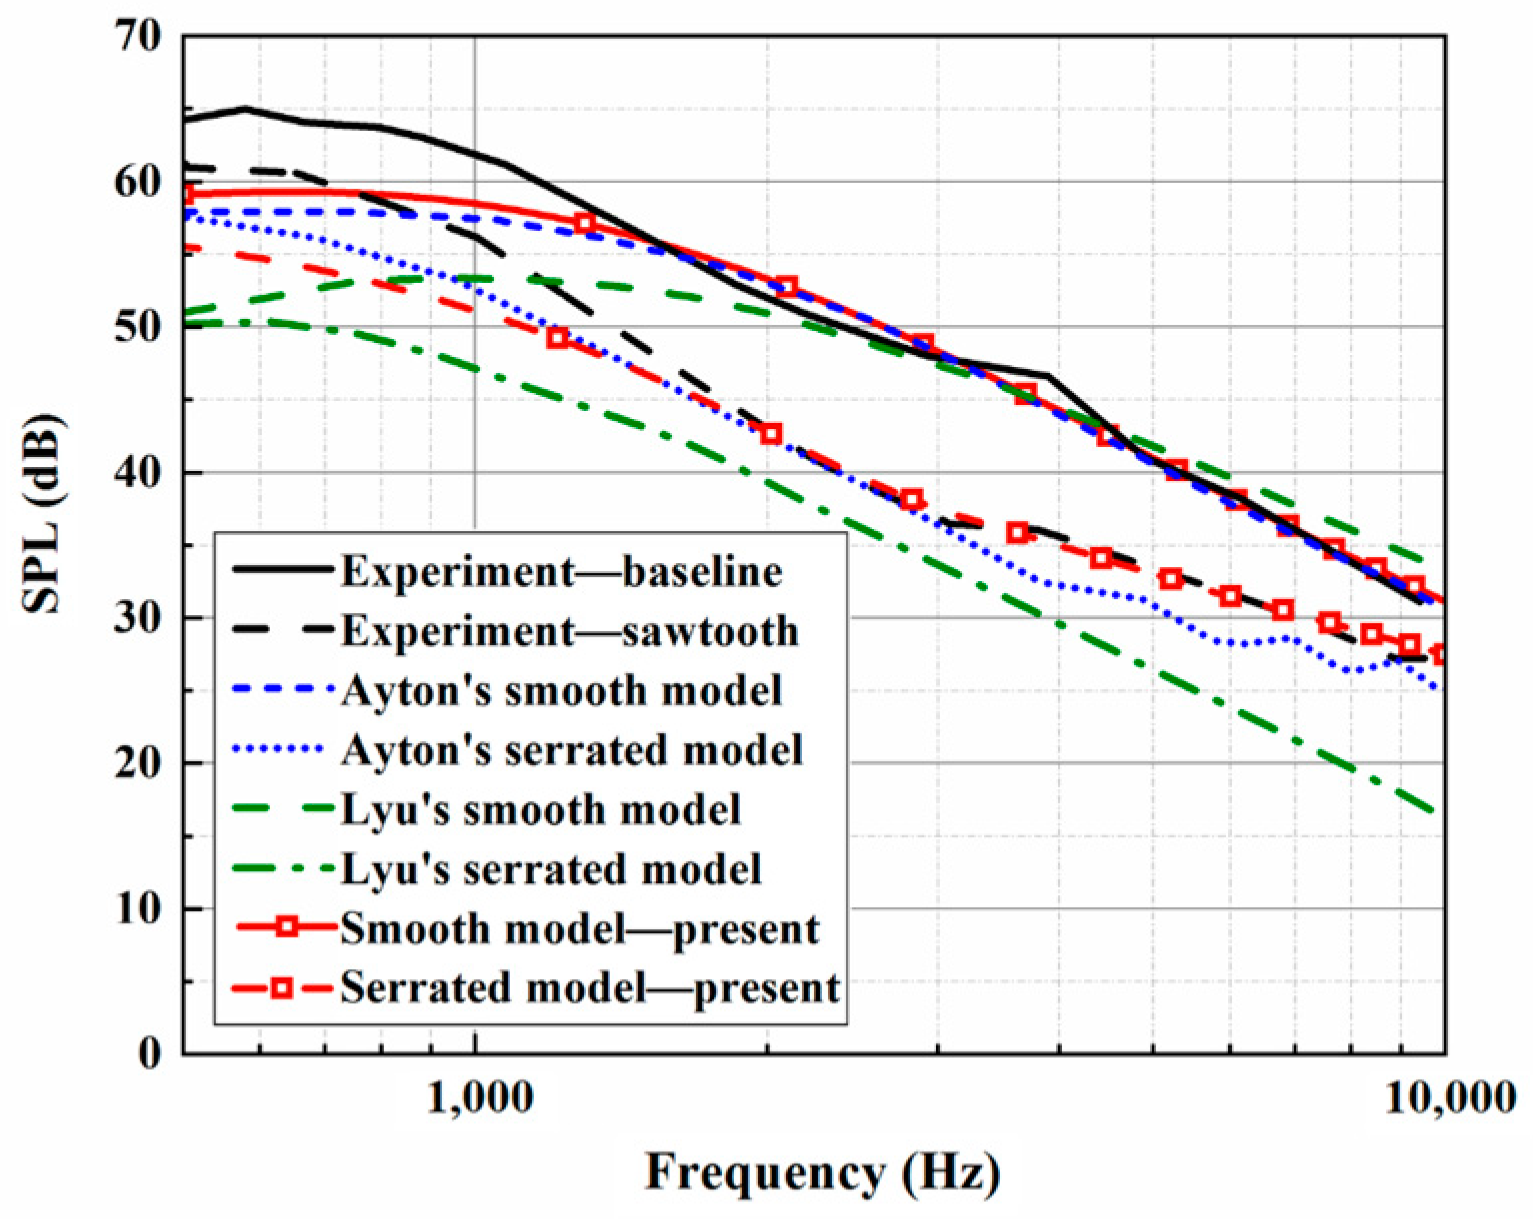
Figure 4,
Figure 5 and
Figure 6. Moreover, it is observed that the BPM method is highly accurate at predicting the self-noise acoustic spectra.
However, some deviation between the analytical sound prediction and the experimental data can also be observed at lower frequencies. Based on a previous study [
8], when at low frequencies, jet noise from the nozzle dominates the experimental measurements, and typical jet shear-layer noise is also present in the self-noise spectra. The offset between the analytical models and the experiment at low frequencies is mainly dominated by jet noise. On the other hand, the model used for the experiments is of finite size, but that used for the noise predictions is assumed to have a semi-infinite chord length. Therefore, the Kutta condition cannot be applied at the trailing edge in the noise predictions. The Kutta condition is an important reason for the generation of velocity circulation, thus affecting the trailing-edge noise by affecting the pressure distribution at the trailing edge. According to the study carried out by Amiet [
10], the condition of
is important. It means that the Kutta condition in the low-frequency range will also have a certain impact. The analytical model does not apply the Kutta conditions, which can also lead to a discrepancy with the experimental results at lower frequencies.
4. Mathematical Modeling and Optimization of Double-Wavelength Serrations
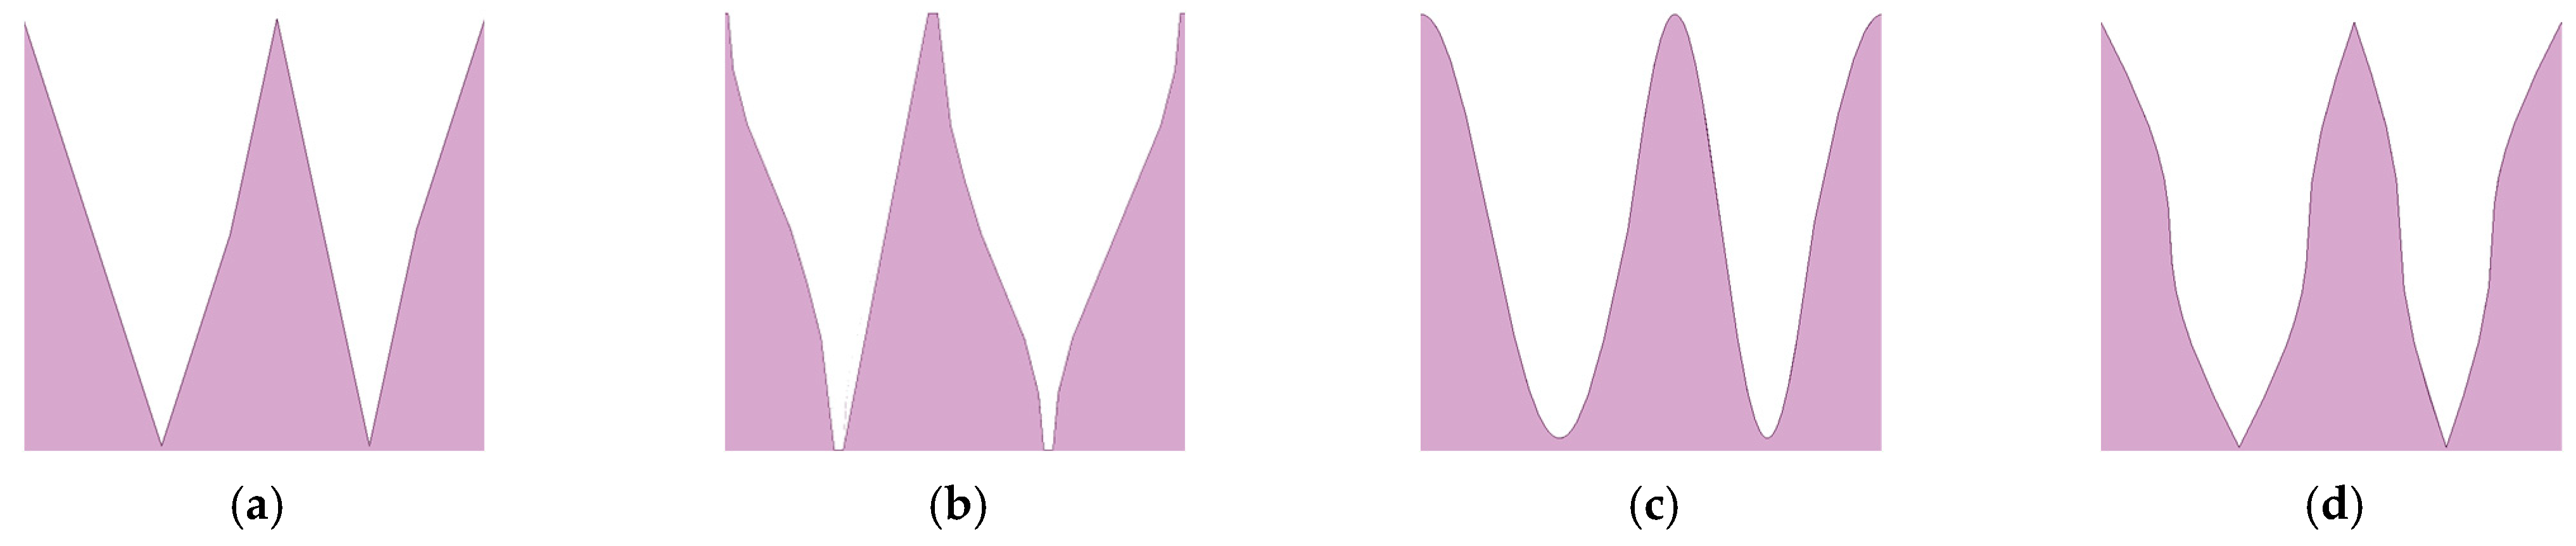
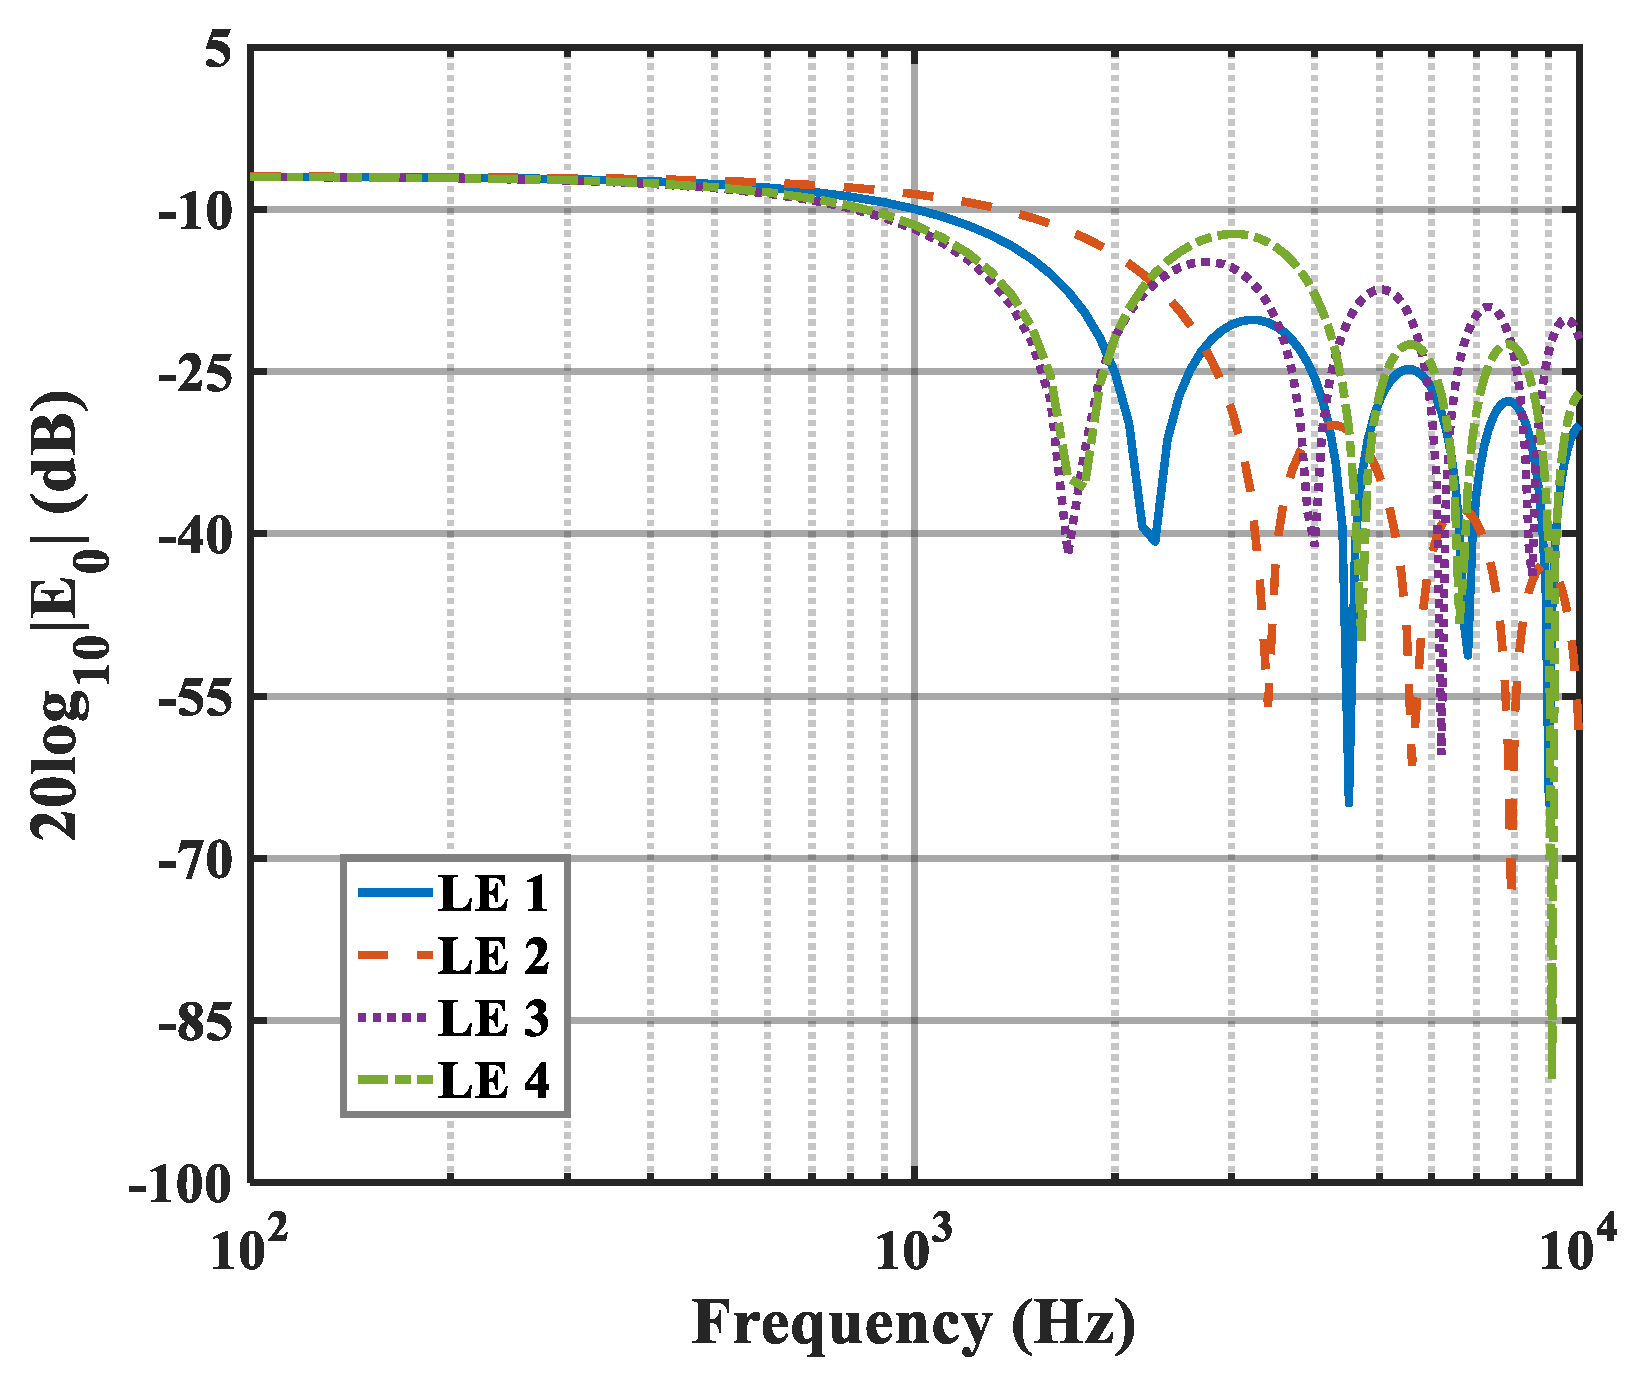
Double-wavelength serrations based on phase interference provide a new concept for the noise reduction design of the airfoil. In our previous work [
20], four different kinds of double-wavelength serrations were examined to systematically study the influence of their relevant parameters on reducing noise, as shown in
Figure 7.
The parameter settings regarding double-wavelength serrations are described in
Figure 8. It is seen that the coefficients of the wavelength and amplitude for the main serrations are
and one, respectively. The coefficients of the wavelength and amplitude for the assisted serrations are 1 −
x1 and
x2, respectively. LE 1–LE 4 denote the traditional serrations, ogee-shaped serrations, sinusoidal serrations, and iron-shaped leading-edge serrations, respectively.
The multi-factor sensitivity analysis of double-wavelength serrations was also investigated in our previous work [
20], including shape factors, wavelengths, and amplitudes. This informs the general optimization direction for the serrations. However, because of the orthogonal experimental method used in our previous work, the discovery of serrations with good noise reduction depends entirely on the number of selected test samples; so, the proposal of the optimal serrations still needs to rely on the optimization algorithm for a solution. In this study, a meta-heuristic optimization algorithm is employed to obtain the best noise-reducing effect of double-wavelength serrations with a particular tip-to-root ratio. The whale optimization algorithm is sufficiently competitive when compared to state-of-art meta-heuristic algorithms and other conventional methods [
32,
33]. Due to its adaptive spiral-updating mechanism, which balances exploration and exploitation more efficiently than the mutation/crossover operators of genetic algorithms or the velocity-based updates of particle swarm optimization, the whale optimization algorithm achieves faster convergence in high-dimensional optimization problems [
32].
Based on this, in a specific operation condition, the minimization of the overall sound pressure level (OASPL) is regarded as the objective to achieve the purpose of reducing noise emissions. The aeroacoustic problem of a flat plate at a zero angle of attack can be described as follows:
Consider .
Minimize .
with variable ranges
,
Here,
represents the vector of variables, and
is the objective function. The constraints yield the aeroacoustic conditions. Equations (15)–(17) represent the different leading-edge shape functions.
The parameterized mathematical expressions for the standard serrations and the ogee serrations are modeled using Equation (15), which can be intuitively reflected in LE 1 and LE 2 in
Figure 8, respectively. The sinusoidal and iron-shaped serrations are parameterized using the above Equations (16) and (17), which manifests in LE 3 and LE 4 in
Figure 8, respectively. Here,
m is the shape coefficient, which quantifies the sharpness of serrations and controls the curvature between every two inflection points of the shape curves. For standard serrations,
m → 0. Additionally,
m is set to four for the ogee serrations and the mentioned iron-shaped serrations. The length dimensions in the parameterized expressions below are normalized by the wavelength λ, and the wavelengths of the double wavelength serrations are set as
x1 and 1 −
x1.
In the data setup of the double-wavelength serrations, the amplitude coefficient
x1 is always one, which is controlled by the dominant serrations, and the amplitude of the embedded serrations is represented by the amplitude coefficient
x1. In limiting the parameters associated with the dominant wavelength, the dimensions of the optimized design space are reduced. The value ranges of
and
are defined as
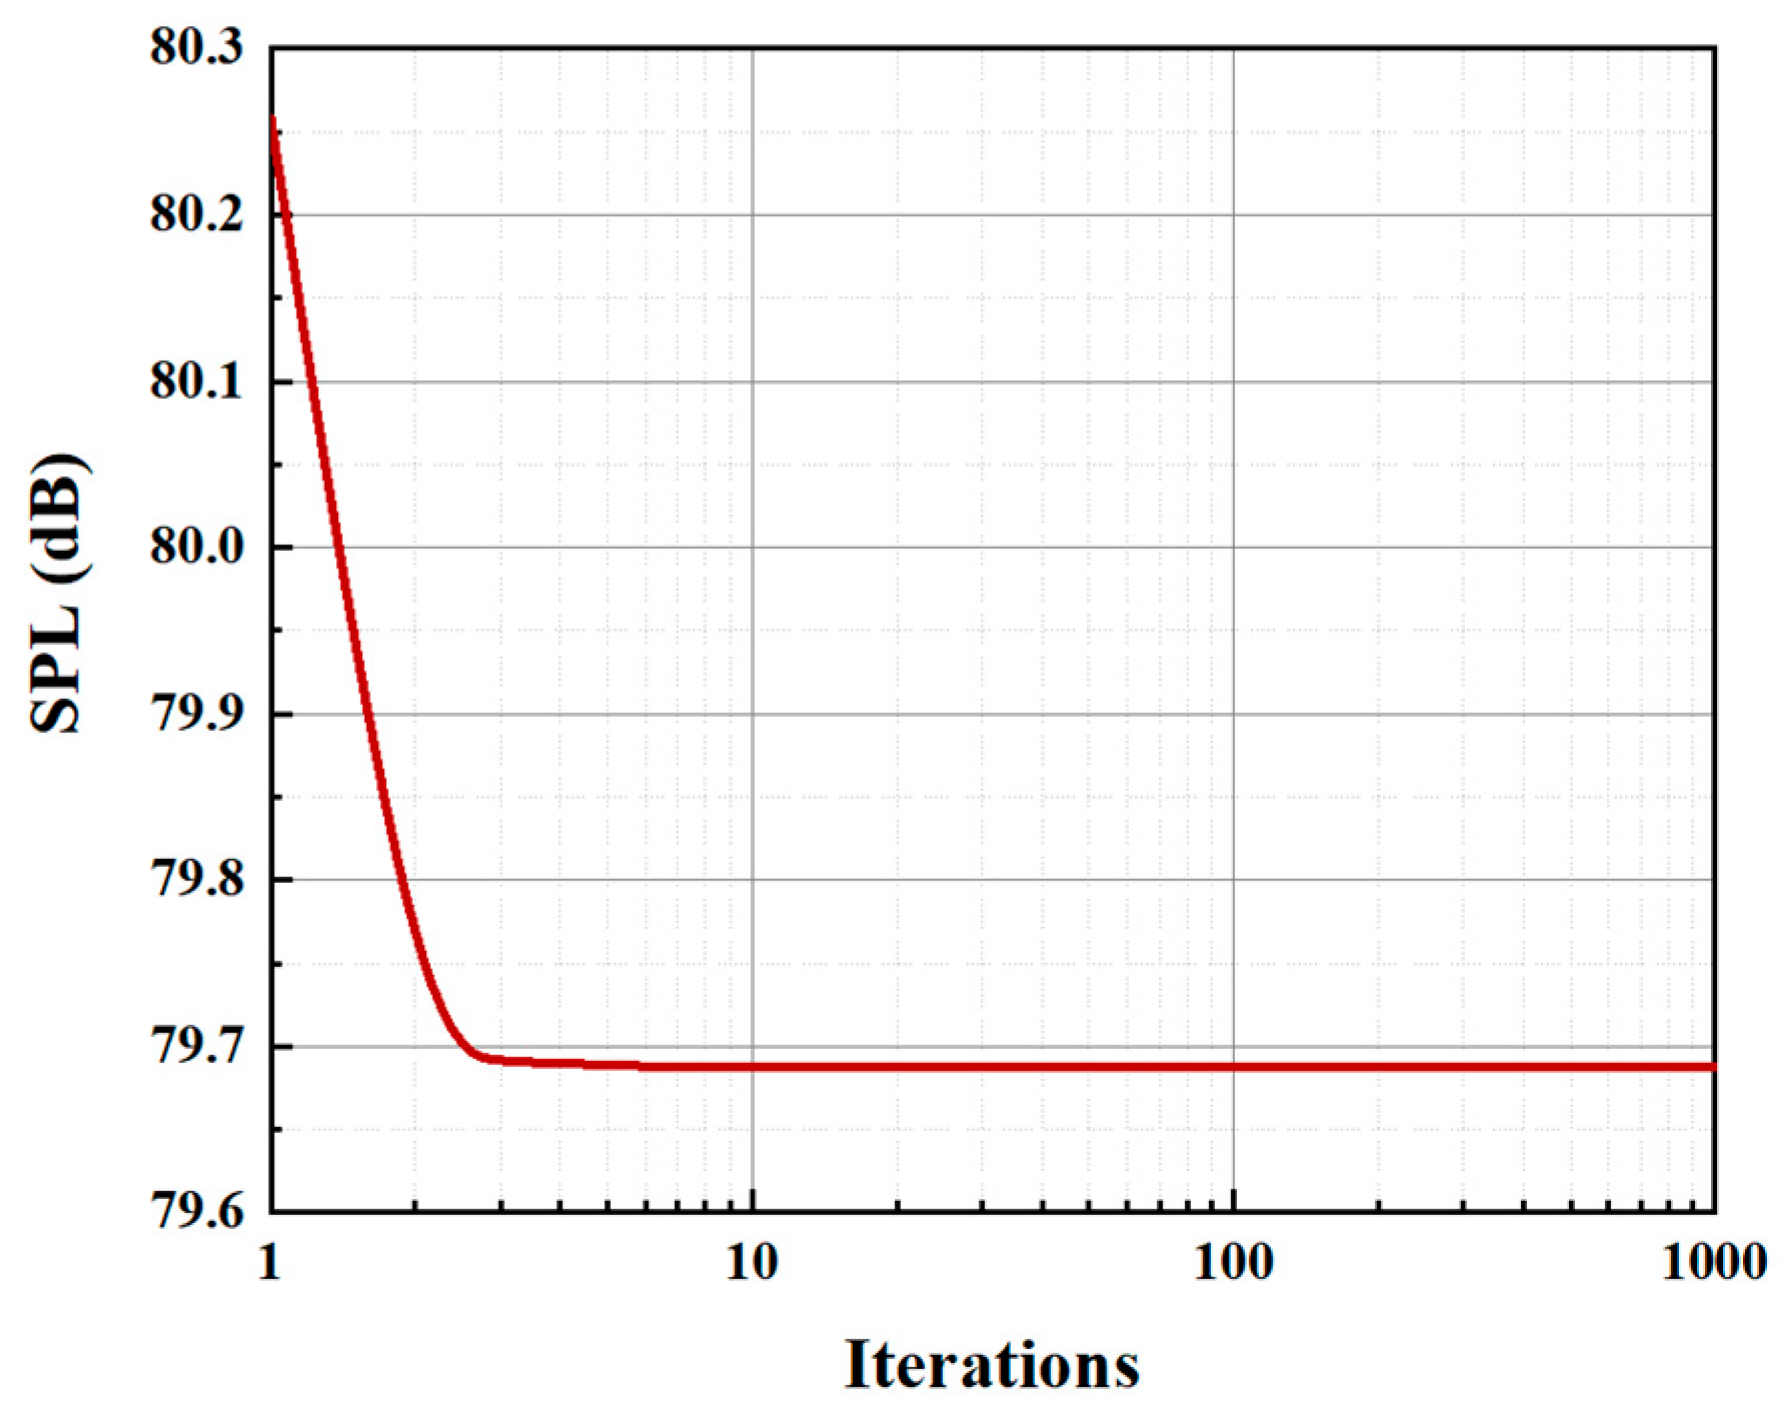
. During the optimization process, the number of agent models is selected as 20, and the number of iteration steps is set to 1000. It can be seen from the representative convergence curve illustrated in
Figure 9 that the optimal sound pressure level is stable.
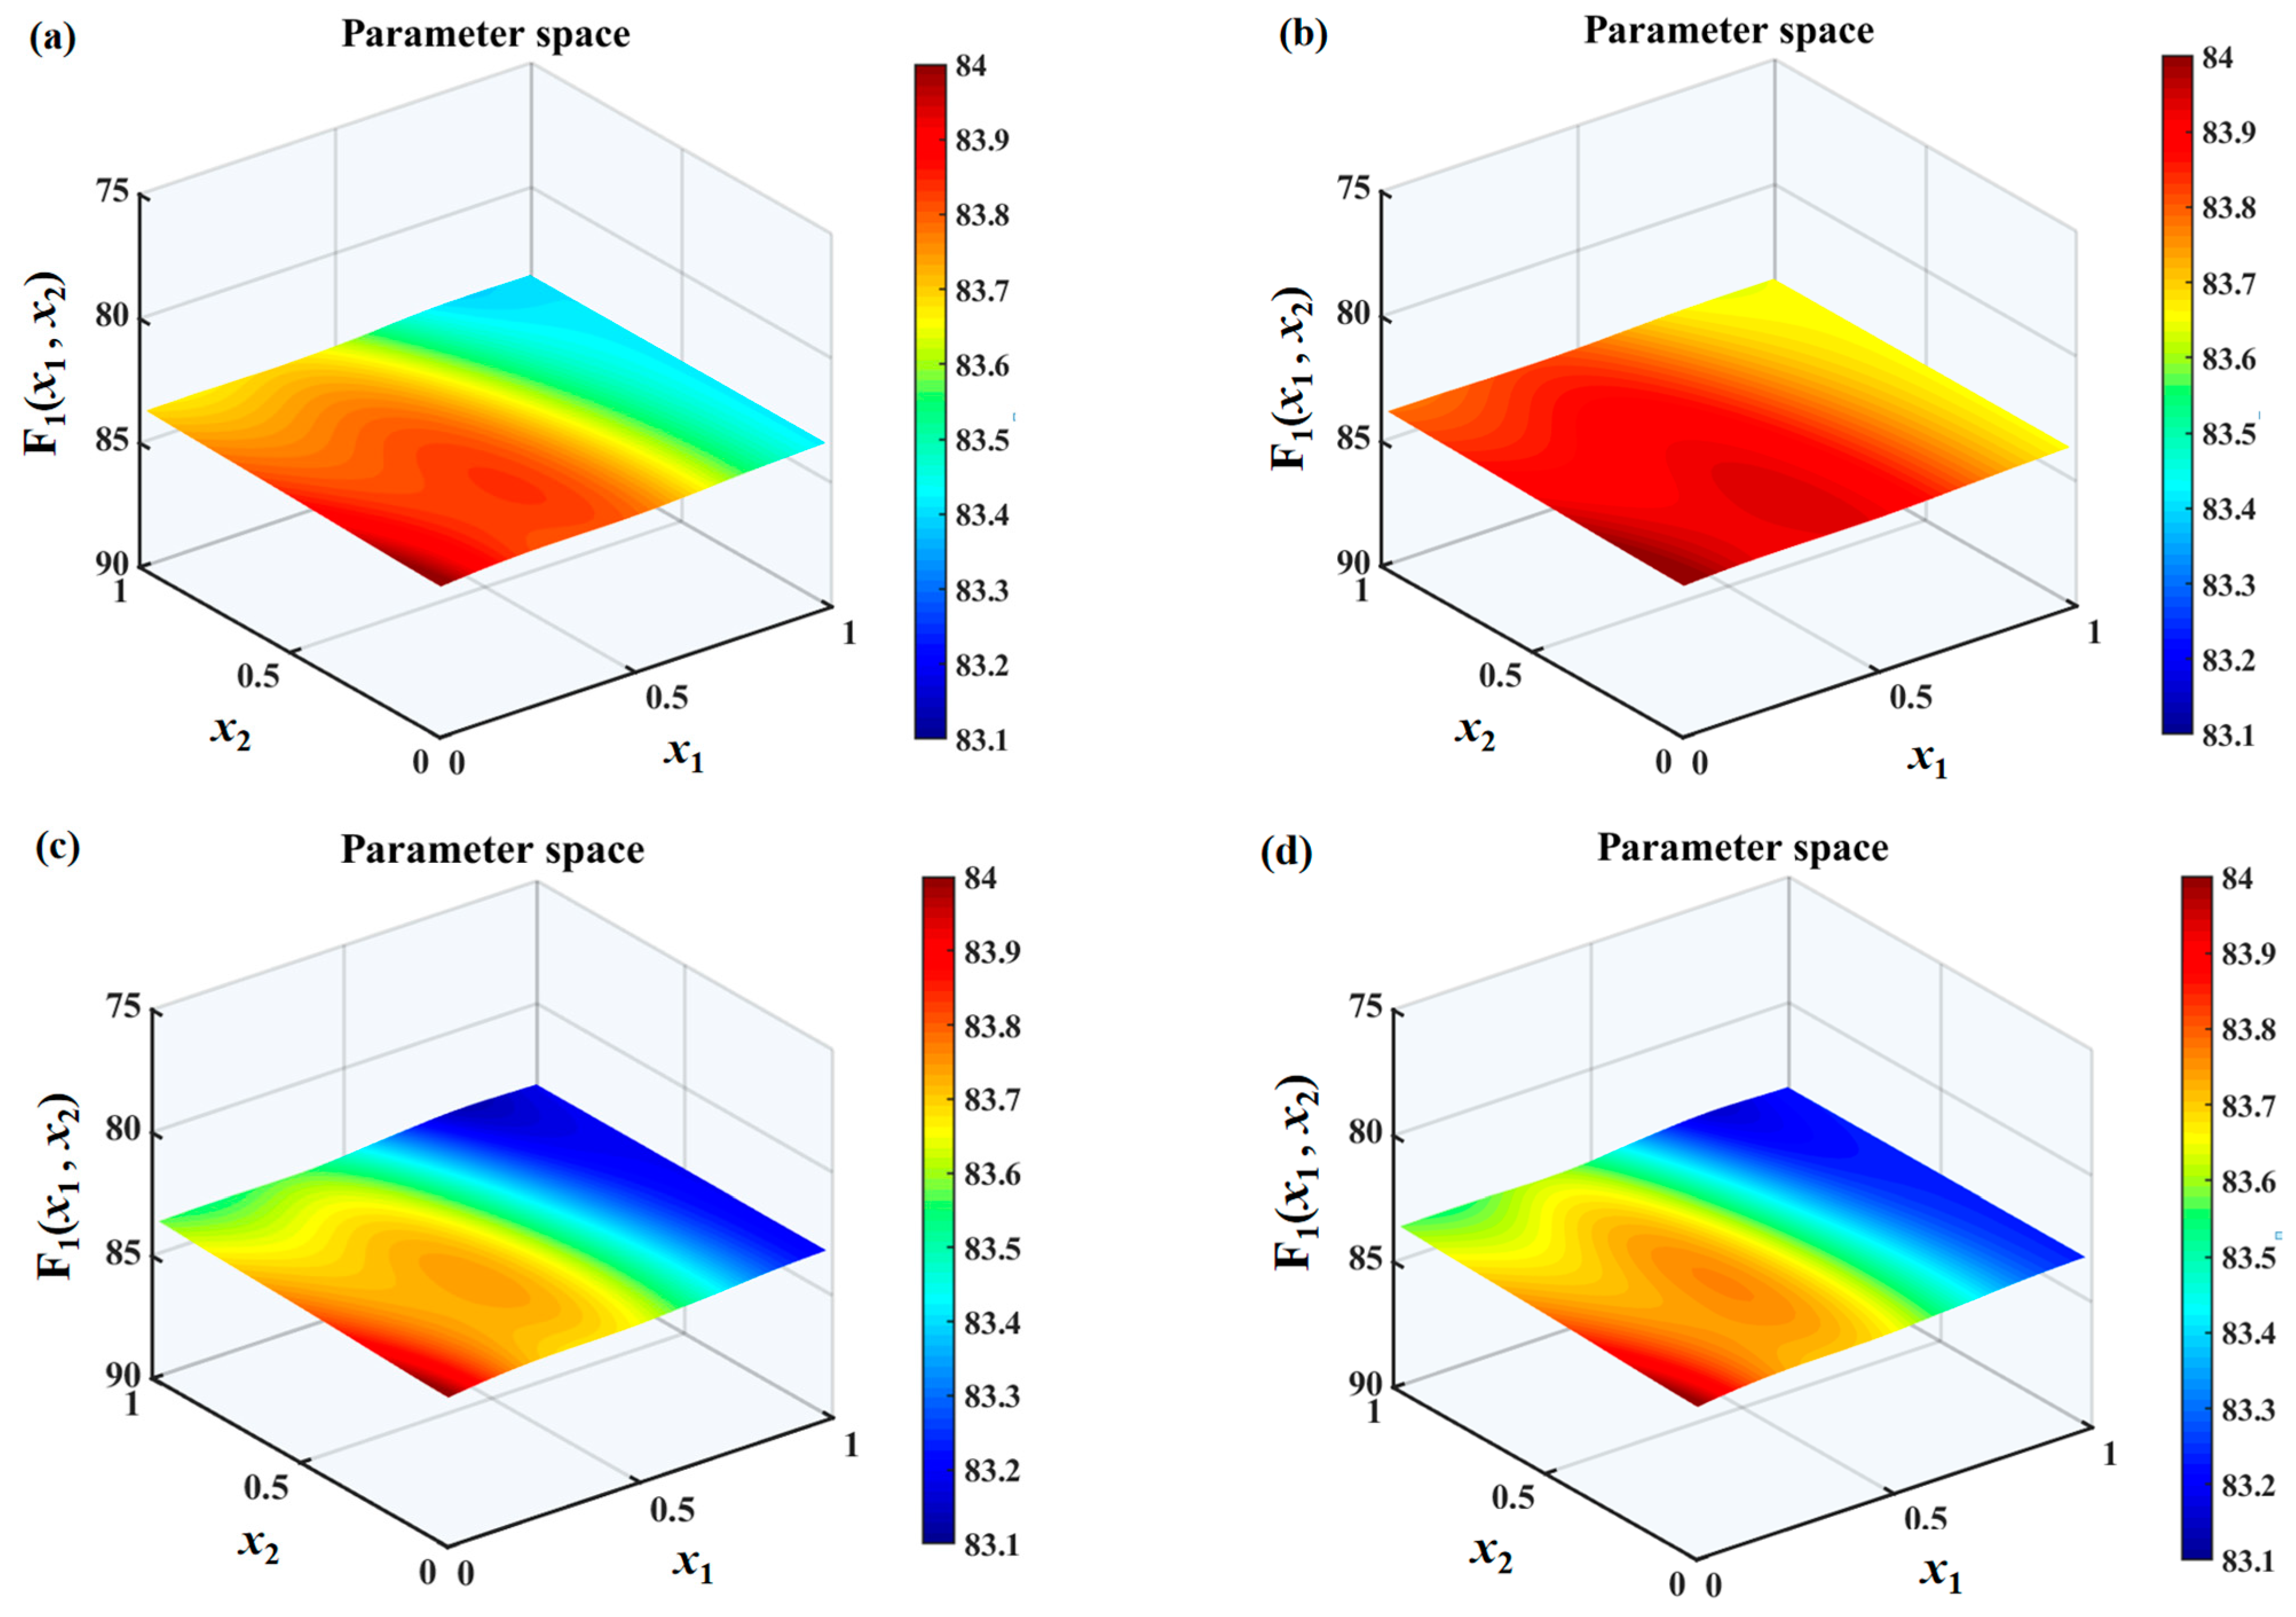
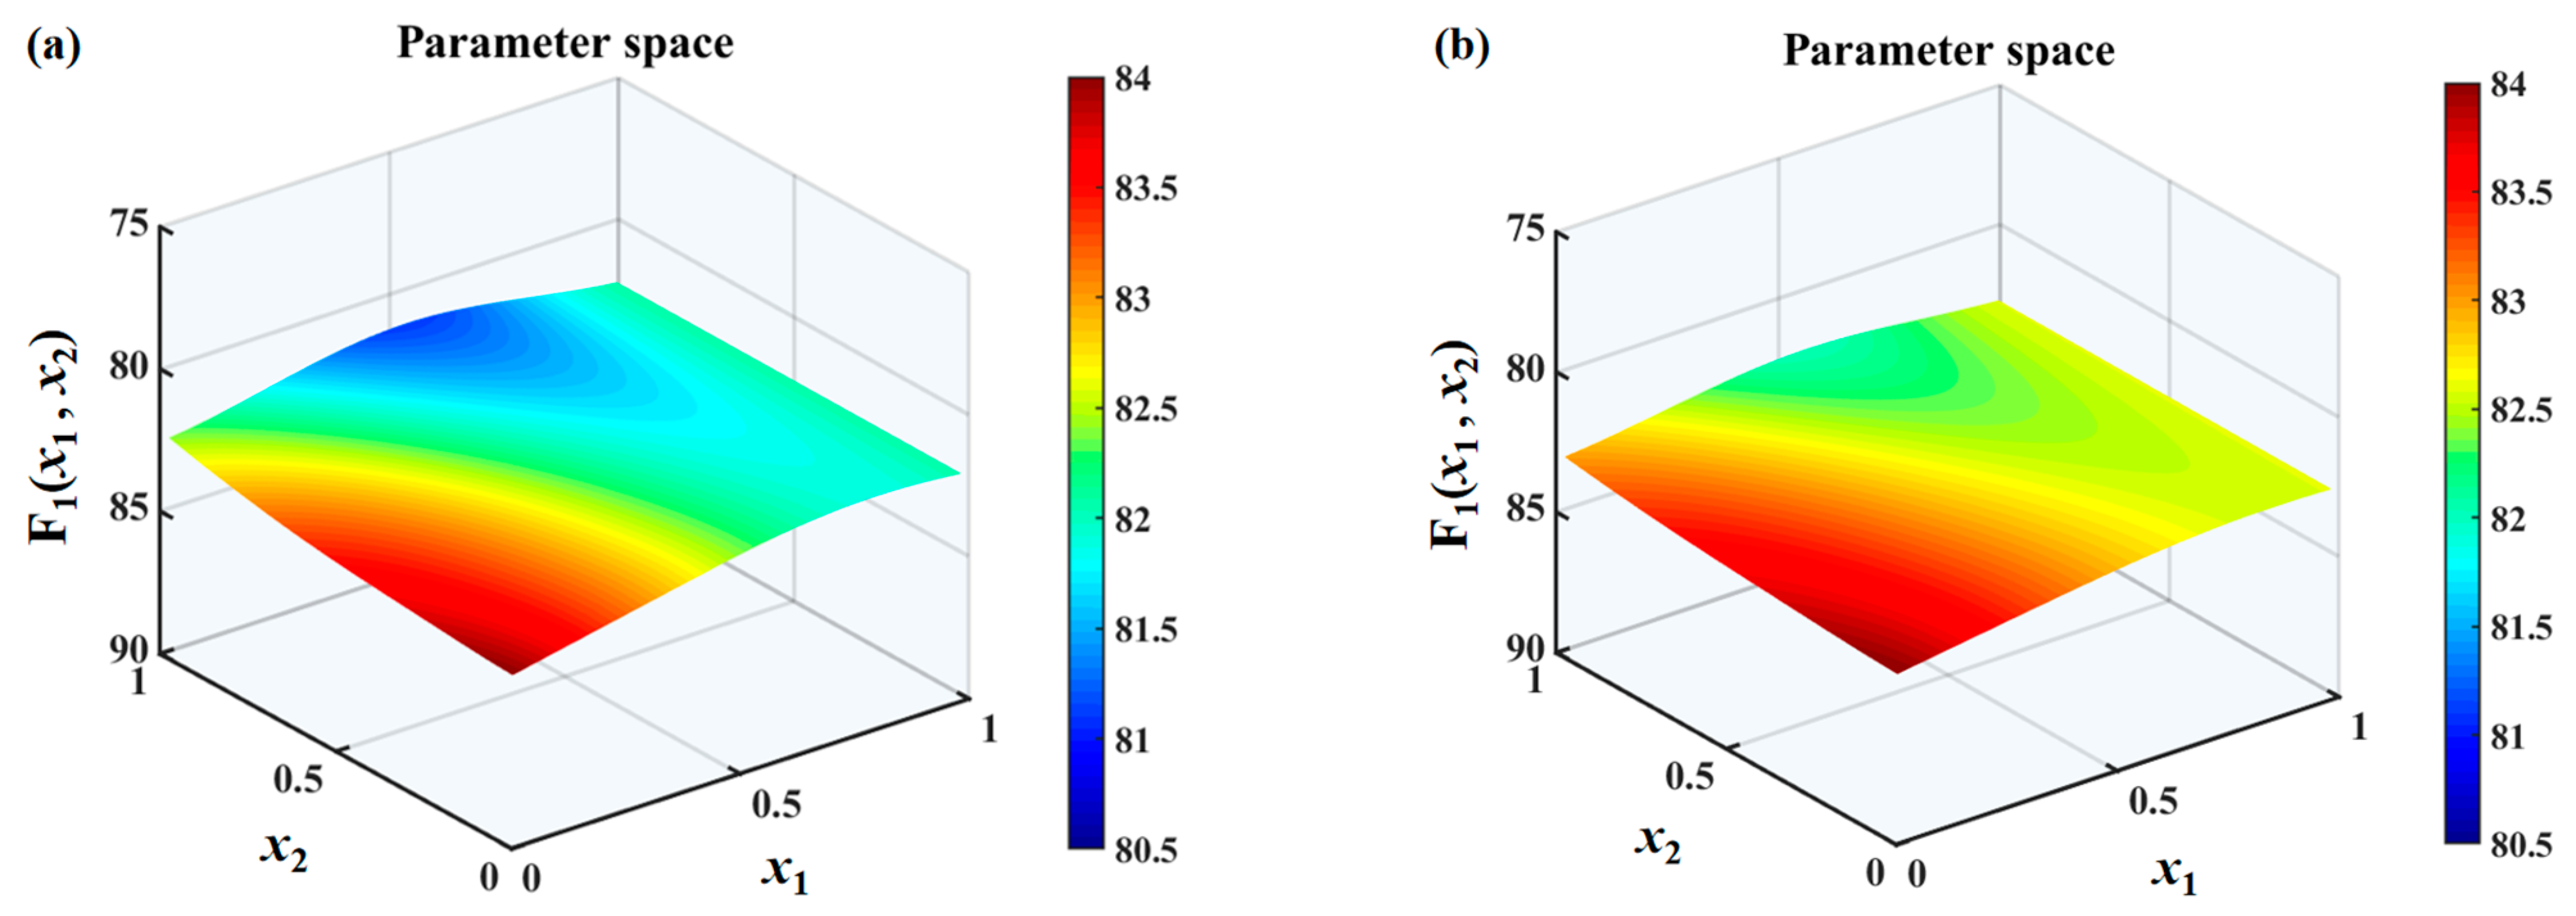
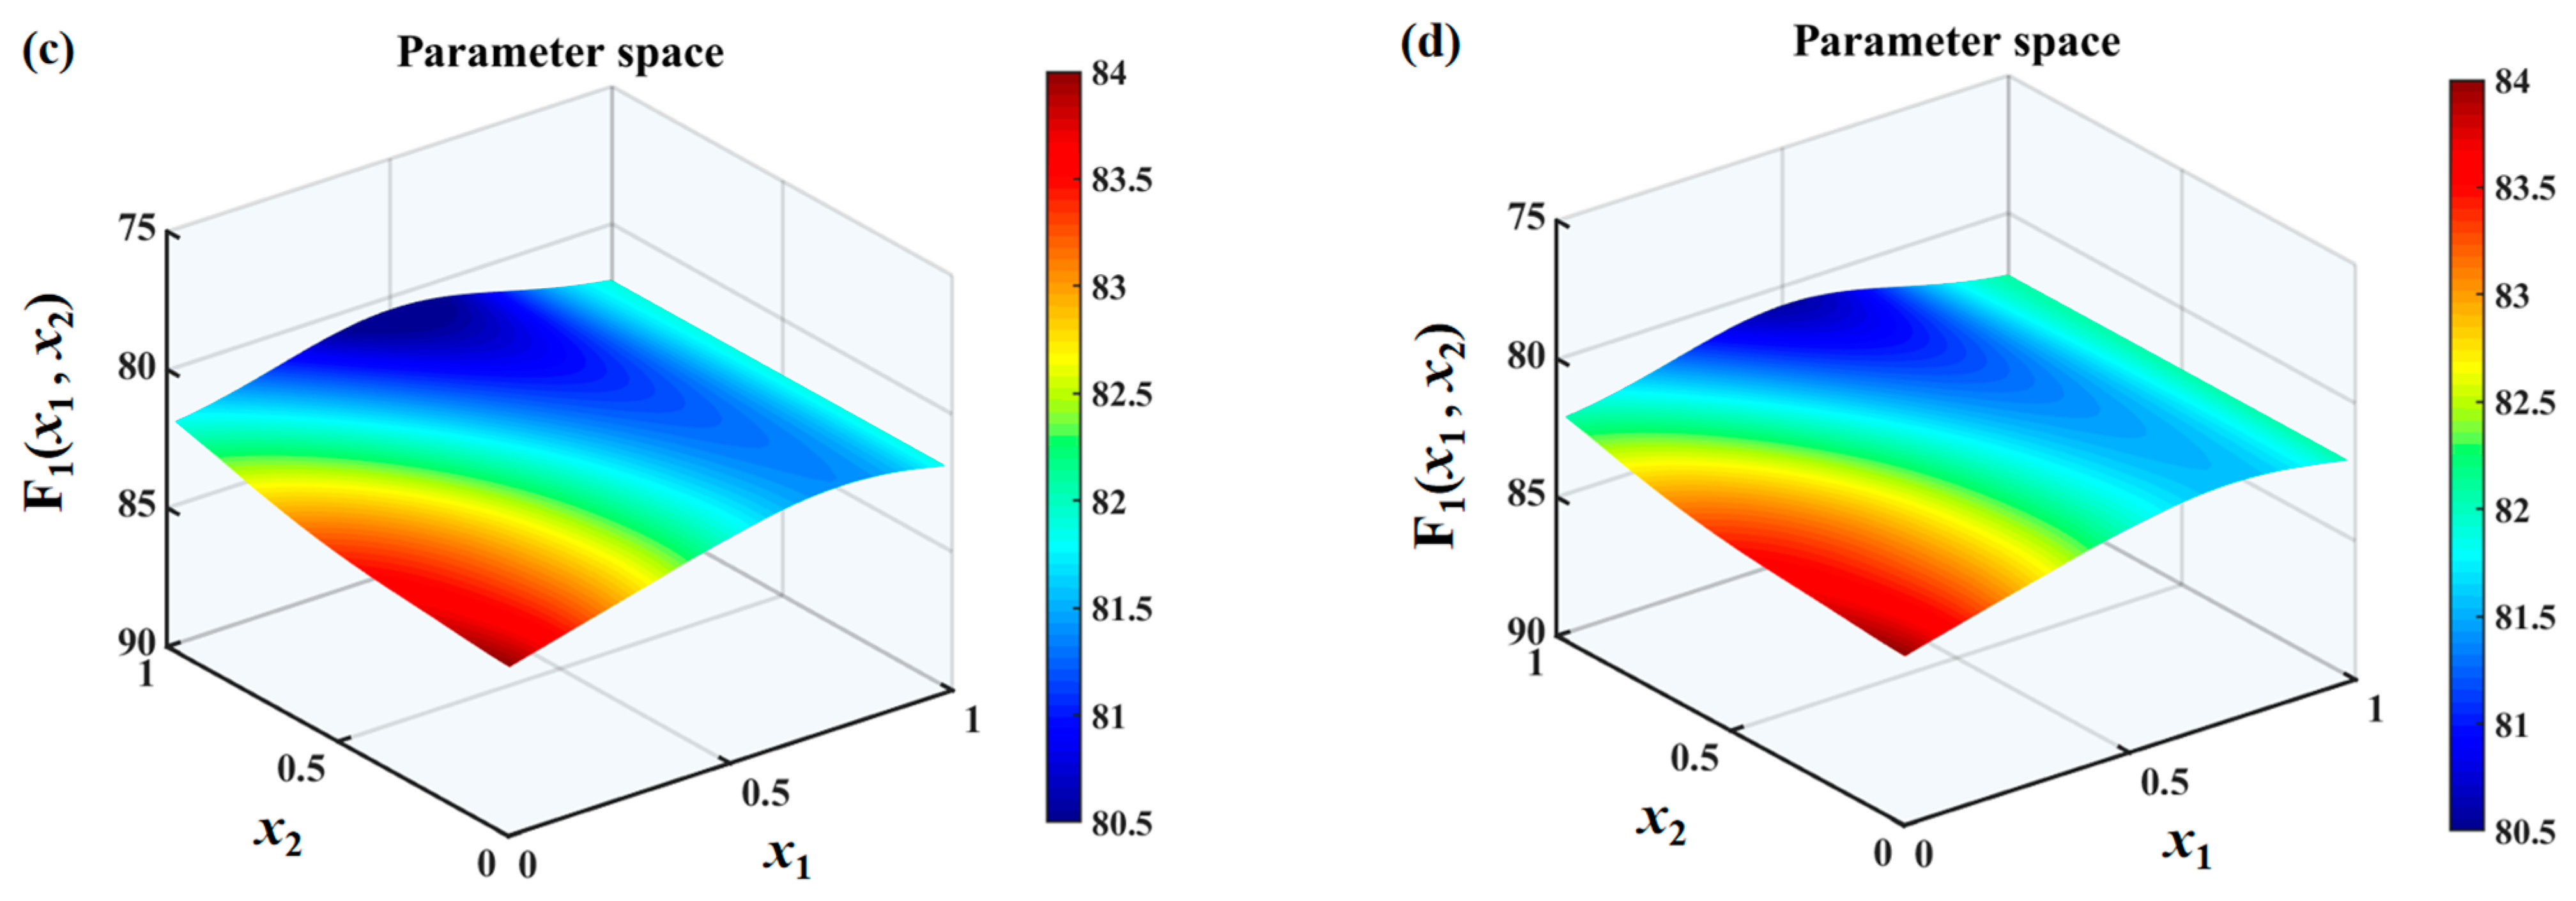
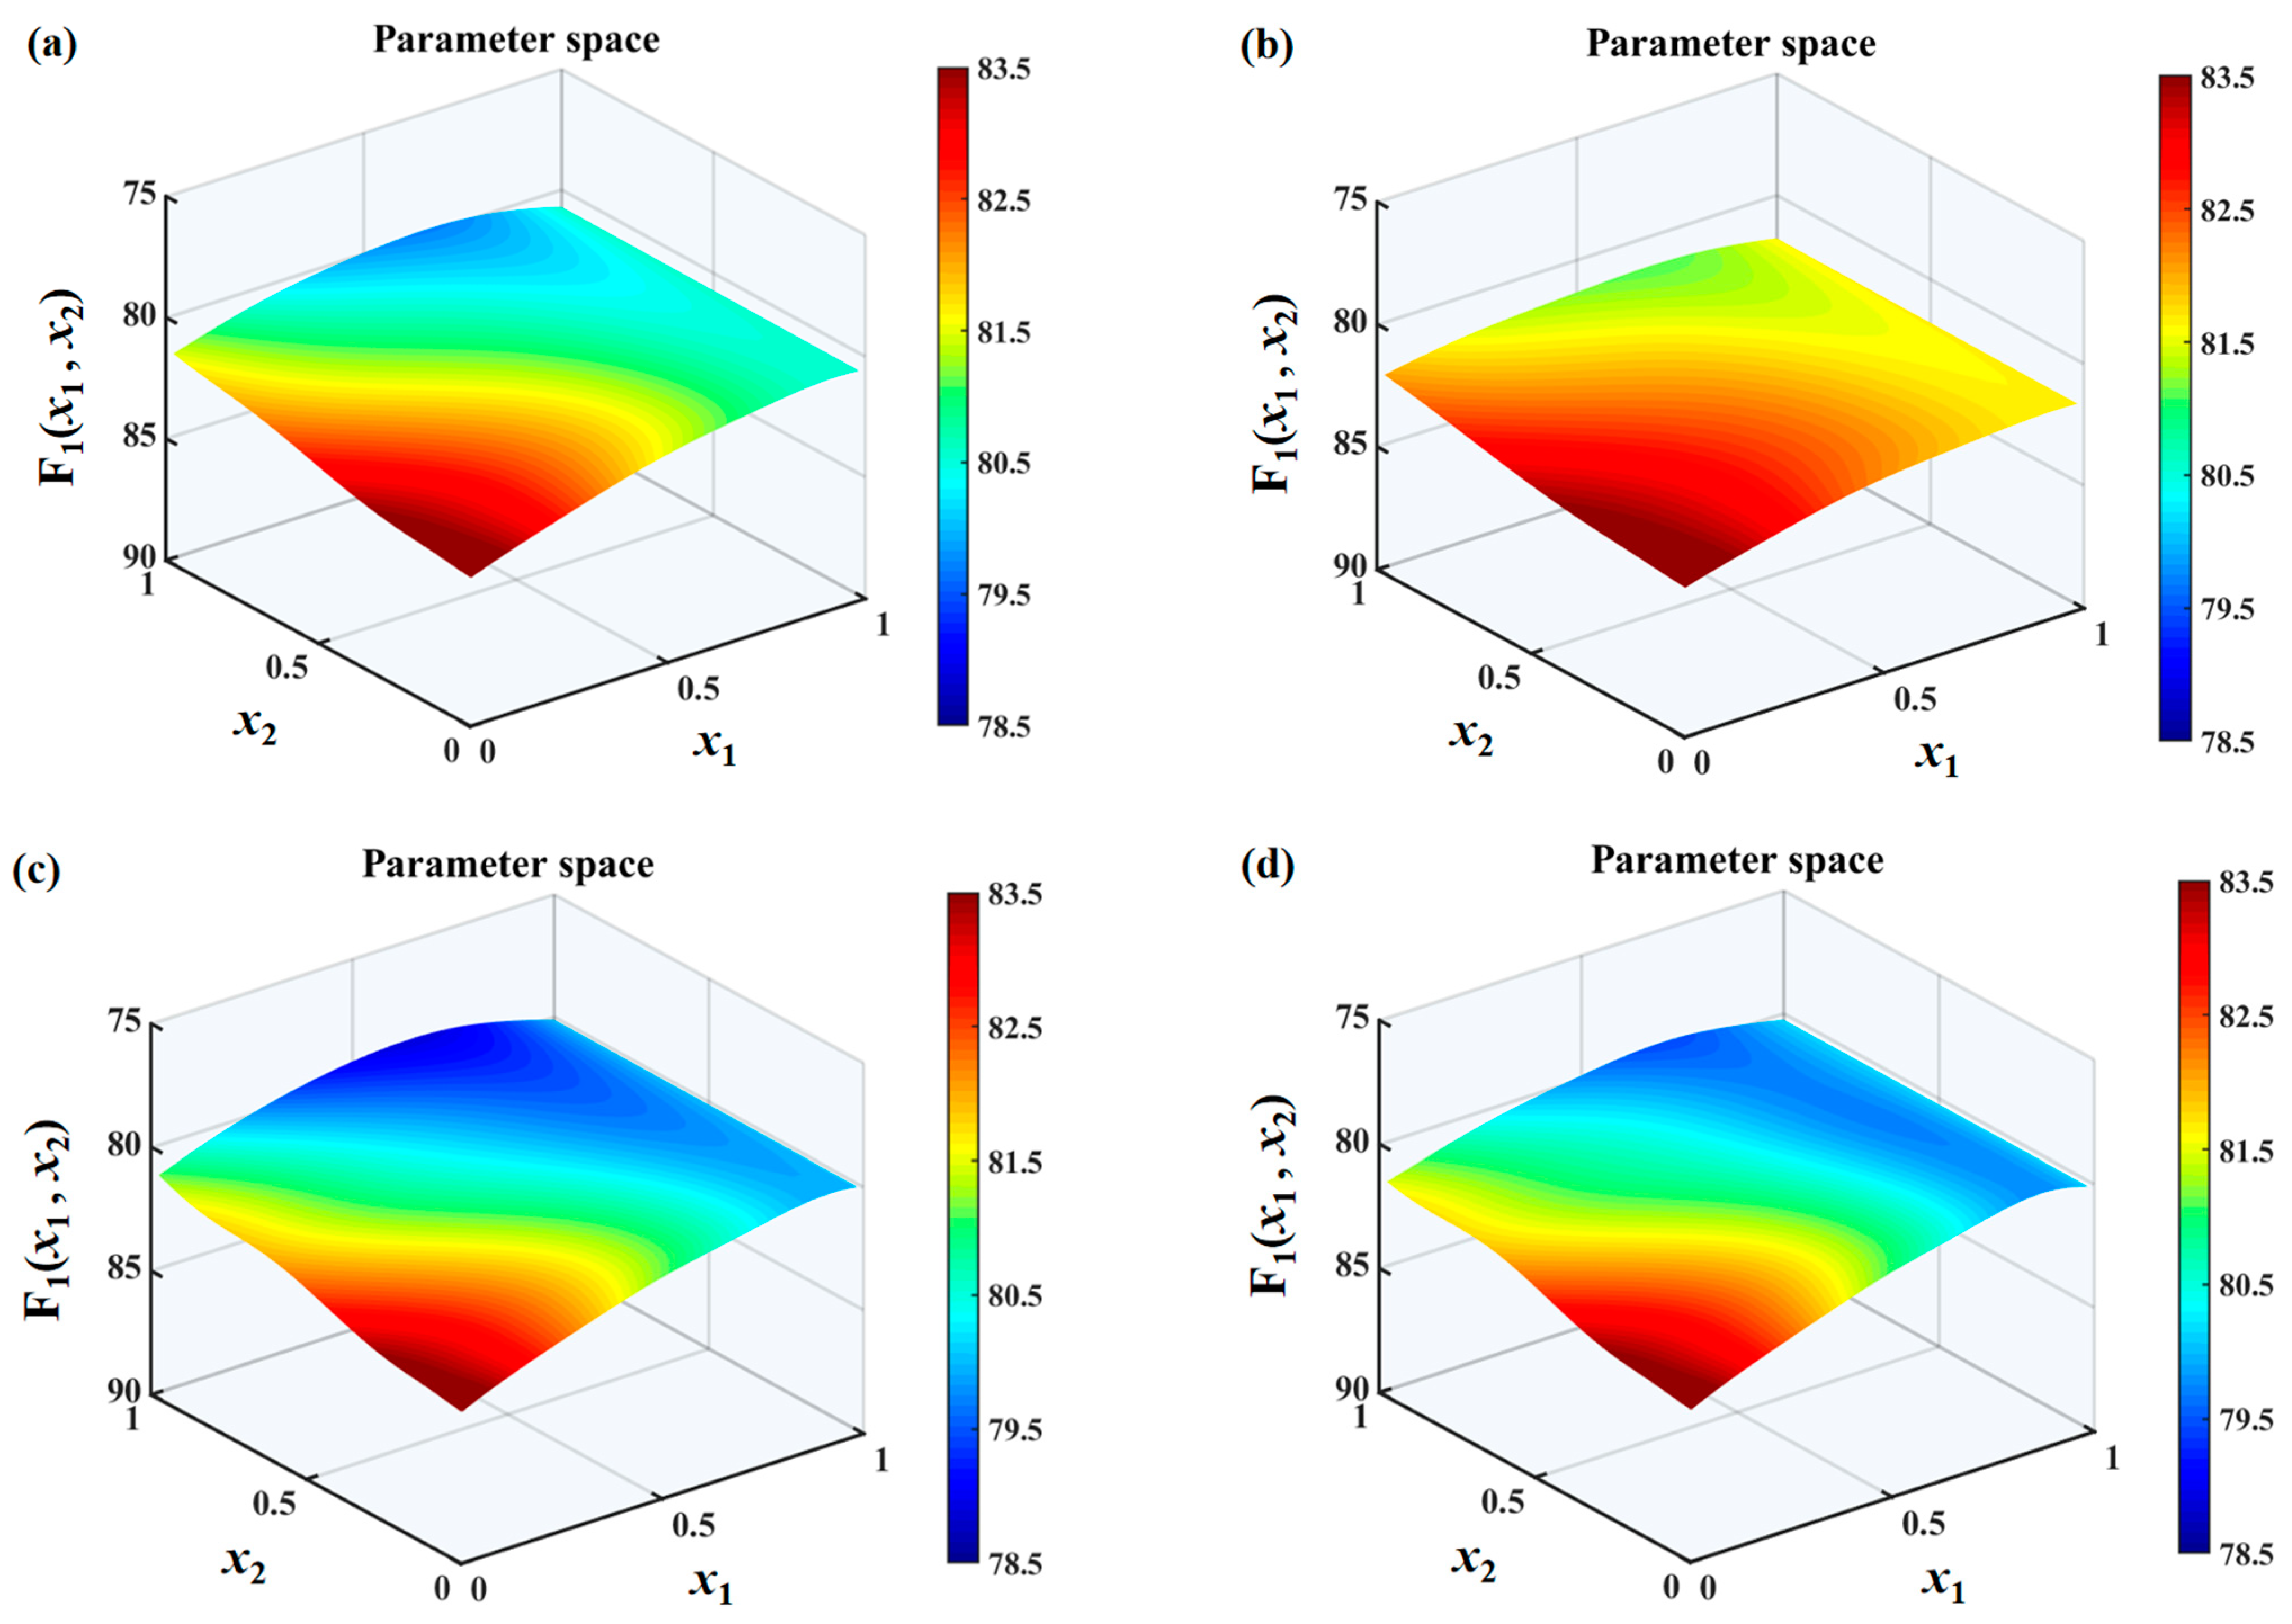
The search spaces under different
values are shown in
Figure 10,
Figure 11 and
Figure 12. It can be found that the overall sound pressure levels of flat plates with sinusoidal leading-edge serrations in the defined variable intervals are the smallest among the four kinds of serrated flat plates studied. With a continuous increase in
, this advantage gradually becomes more significant. The noise-reducing ability of iron-shaped serrations is found to be comparable to that of sinusoidal serrations. The overall sound pressure levels of flat plates with the ogee-shaped serrations are the largest across the entire variable space, indicating that these serrations have a weaker ability to suppress noise emissions. When
is 1.0, a smaller sound pressure level can be easily obtained at a larger wavelength
. Therefore, the additional advantage of double-wavelength serrations is not significant at smaller
values. The smallest sound pressure level is distributed in approximately the middle of the wavelength at
, and an additional noise reduction generated by double-wavelength serrations is gradually achieved. For serrated wavelength
embedded in the double wavelengths at different
values, the larger amplitude
is conducive to noise reduction, which is in line with Howe’s early theory [
34,
35].
After optimization, the amplitude coefficient of the intermediate serrations is found to be one. At this value, the phase-cancellation interference between the root and tip of the serrations is enhanced, and this is consistent with the noise reduction trend shown in the previous research theory for single-wavelength serrations with larger
values. For the dominant wavelength
of the optimal double-wavelength serrations at
in this study,
is satisfied. In a previous study, Chaitanya et al. proposed the concept of an optimal serration angle [
] for single-frequency serrations [
36]. Here, it is confirmed that the wavelength at the optimal angle is about twice the turbulence integral length scale. This is consistent with the conclusion obtained in this study when
. The commonality in the noise reduction mechanism between the single- and double-wavelength serrations is thus illustrated to a certain degree. Compared with single-wavelength serrations, double-wavelength serrations of different frequencies also contribute to additional noise-reducing capabilities due to phase differences.
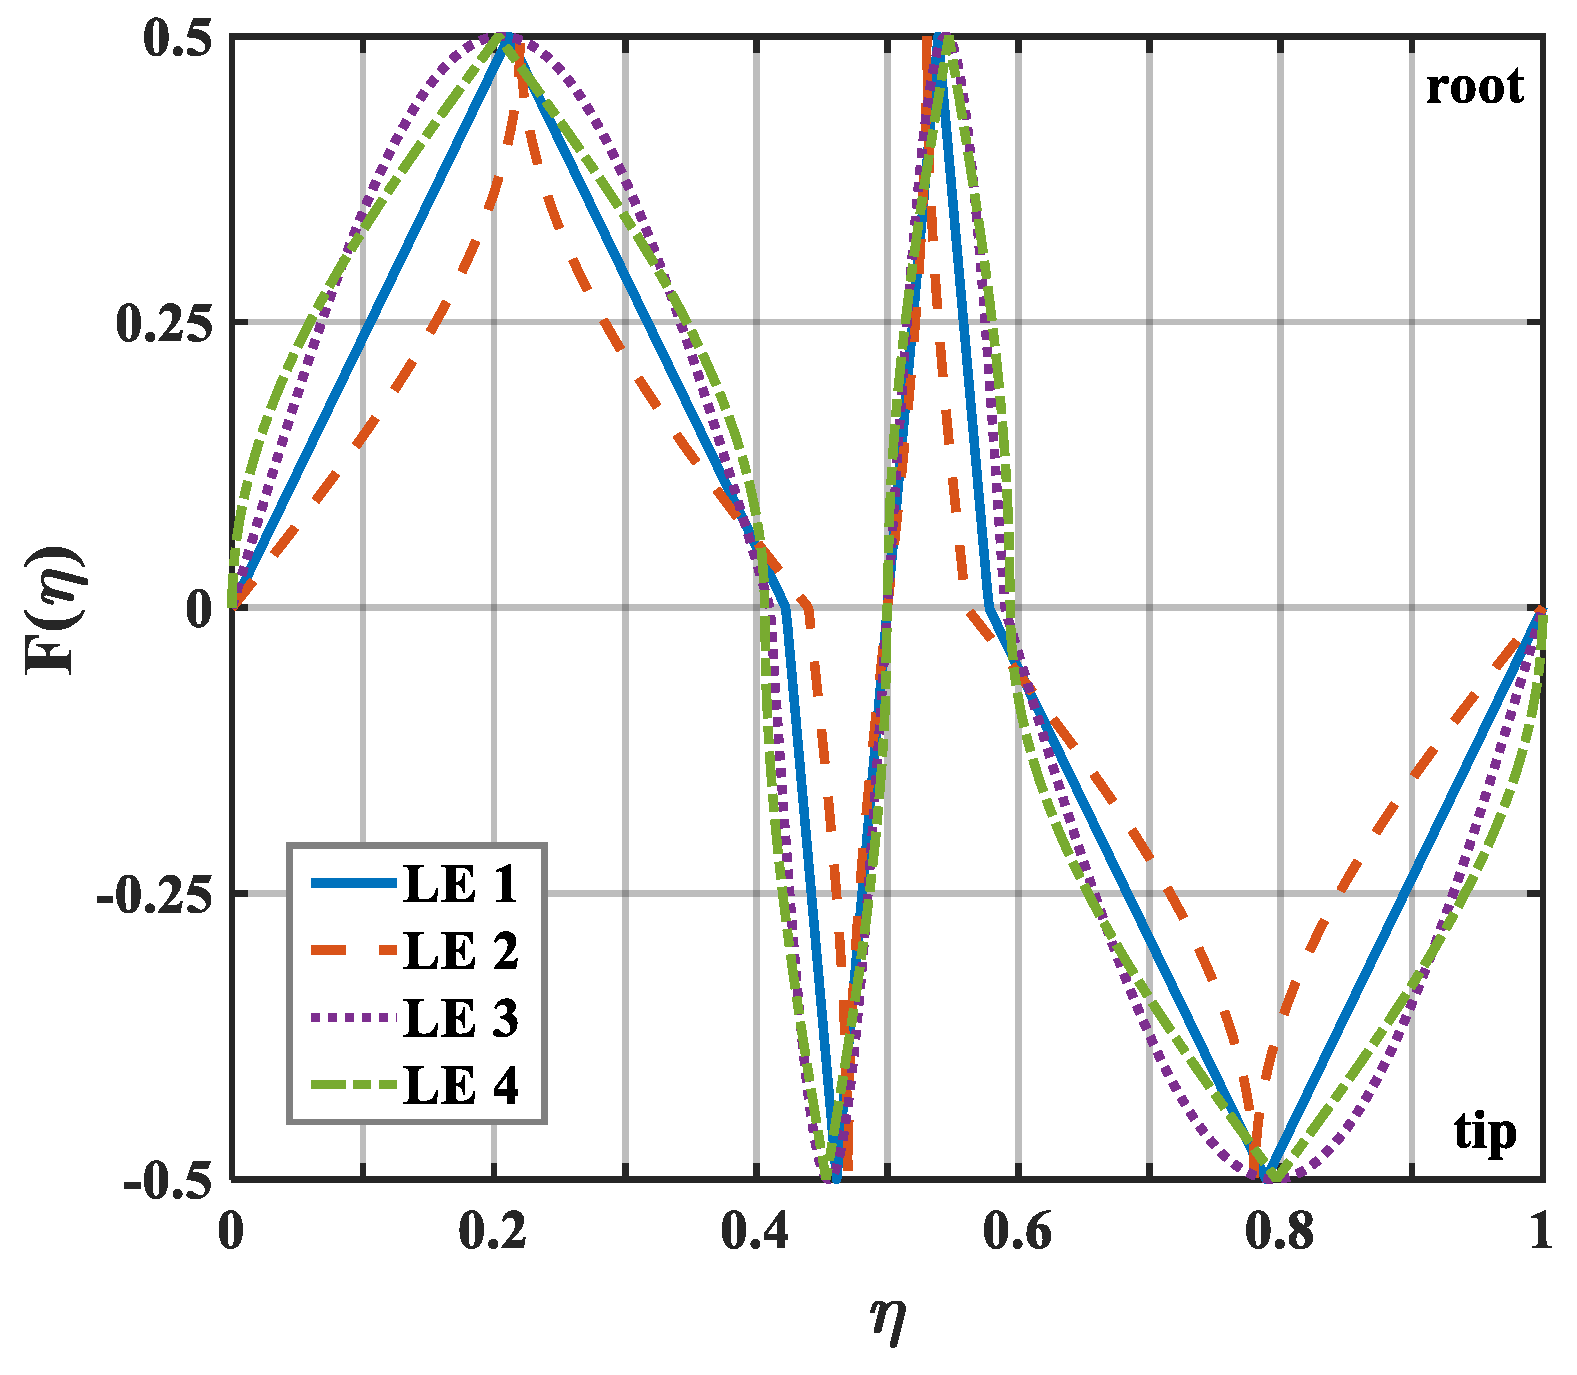
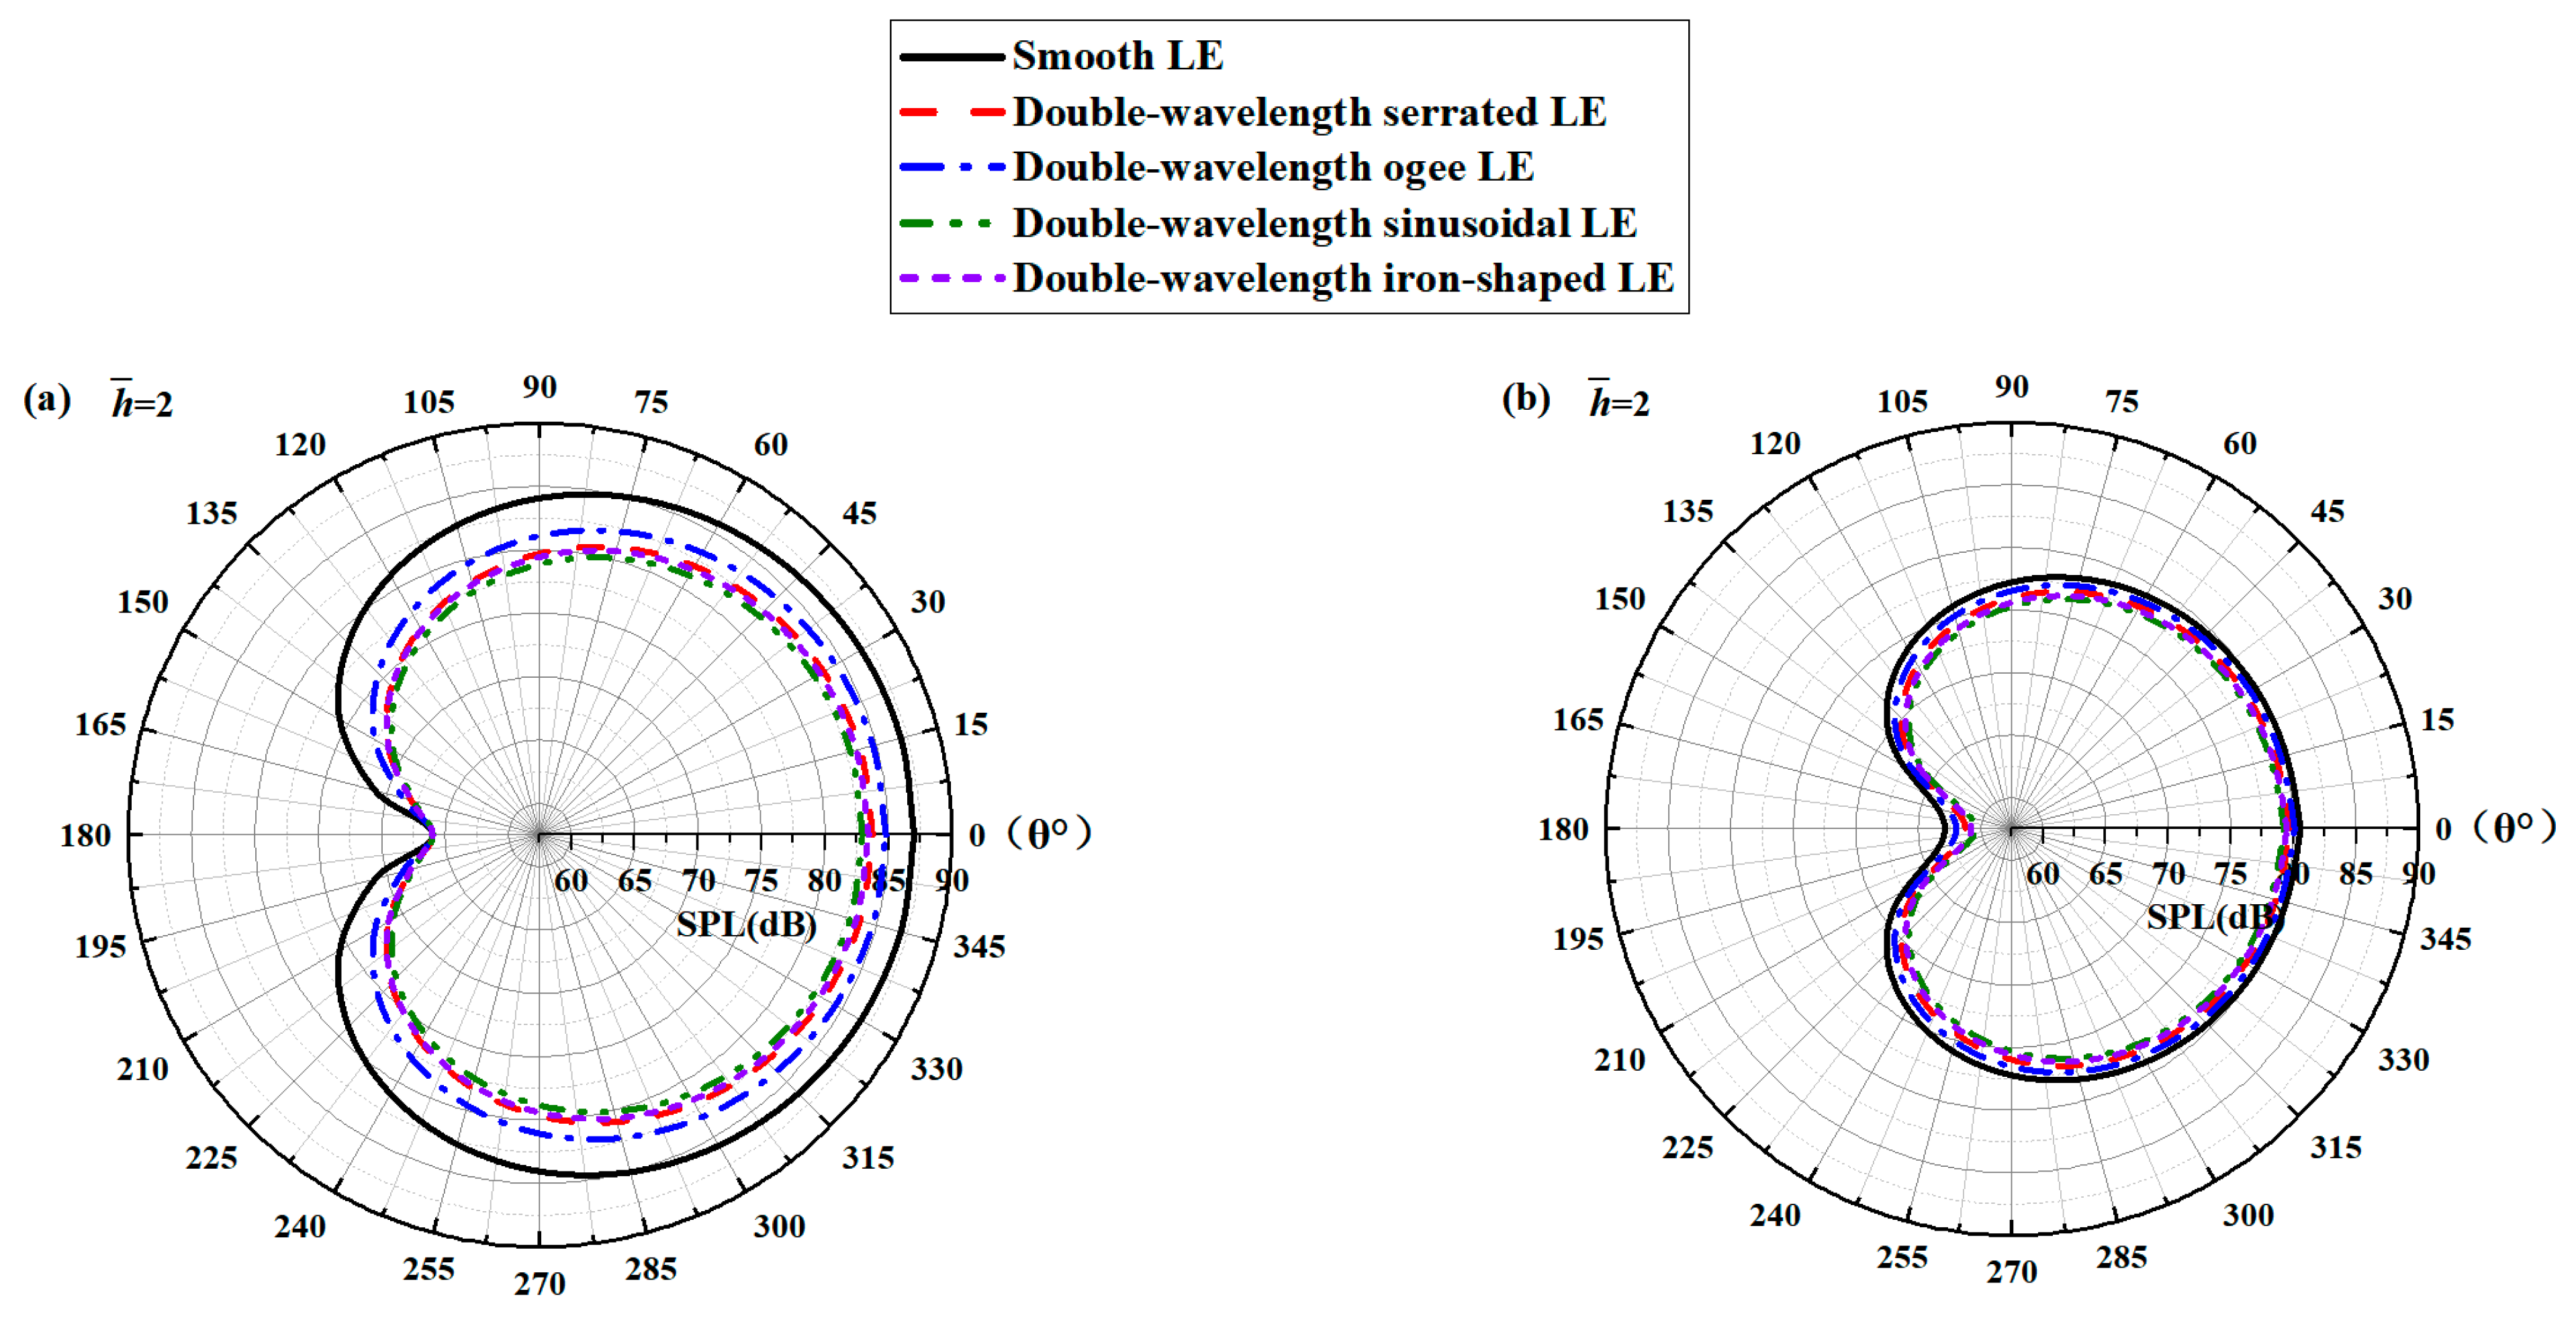
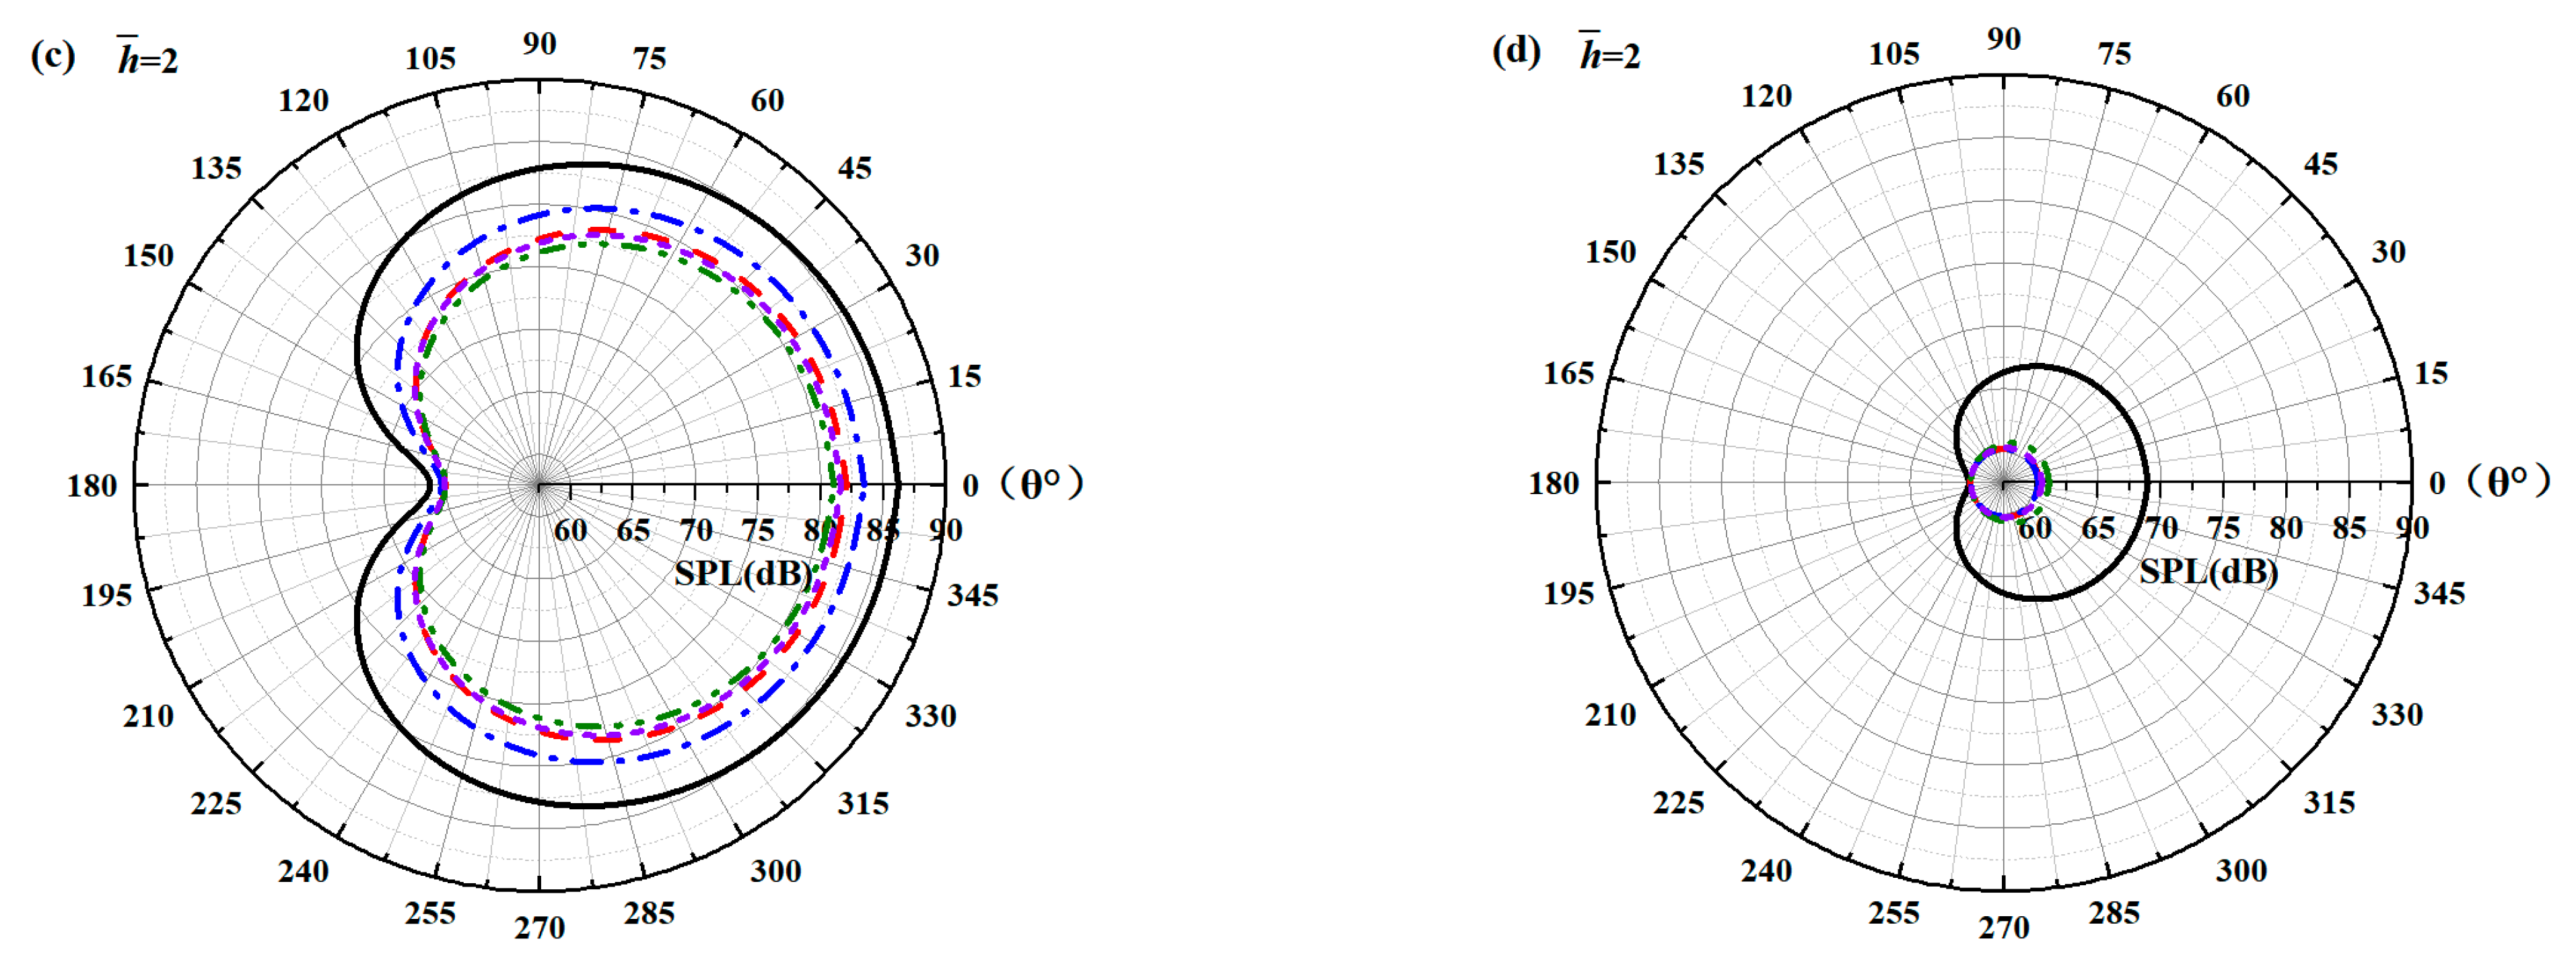
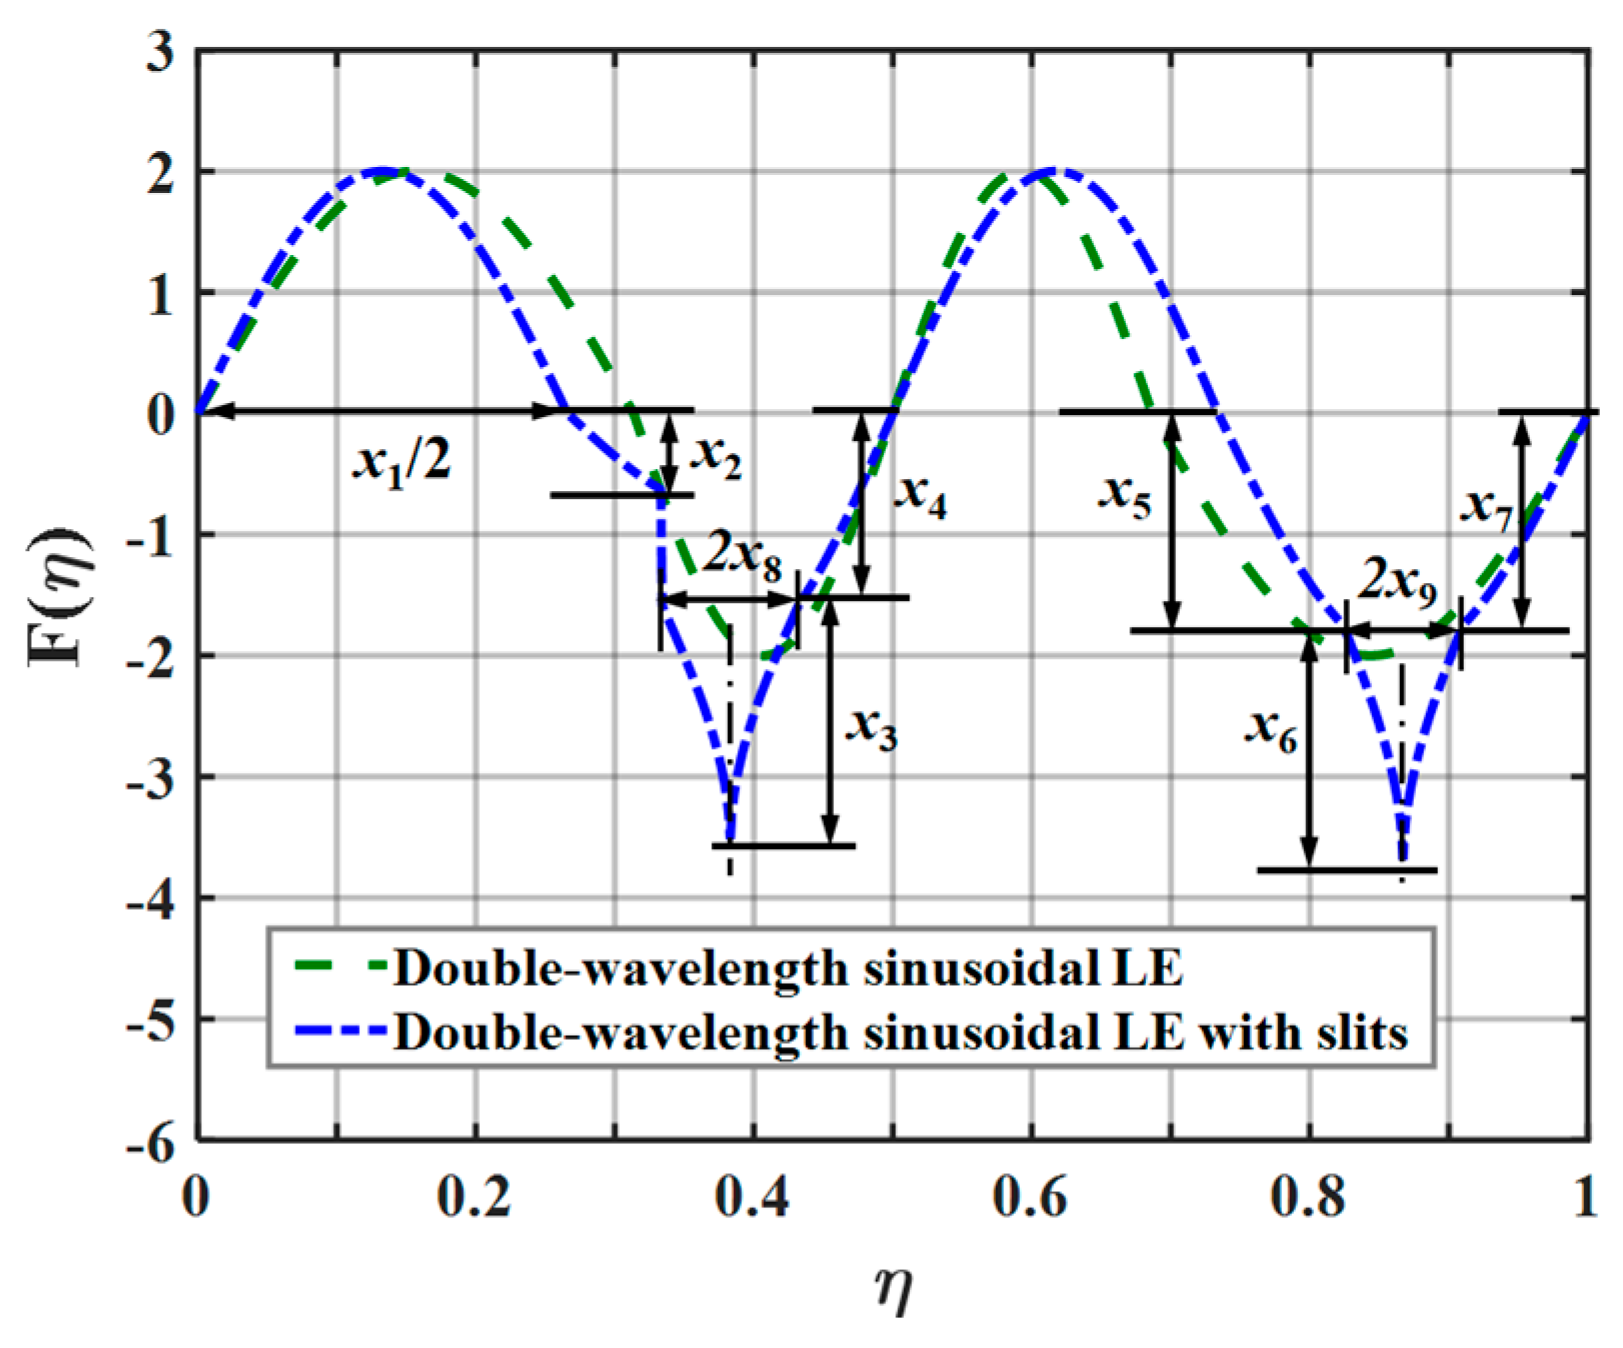
The geometric profiles with the minimum values of the overall sound pressure level at different tip-to-root ratios are illustrated in
Figure 13,
Figure 14 and
Figure 15. Combined with
Figure 1, the direction where
corresponds to the root of the serrations. On the contrary, the direction where
corresponds to the tip of the serrations. After optimization employing the whale optimization algorithm, it is found that the amplitude coefficients of the serrations are always one, which is similar to the conclusions reached by earlier researchers. This means that sharper auxiliary serrations are more likely to suppress noise emissions. The phase interference of the double-wavelength serrations also provides additional advantages for noise reduction.
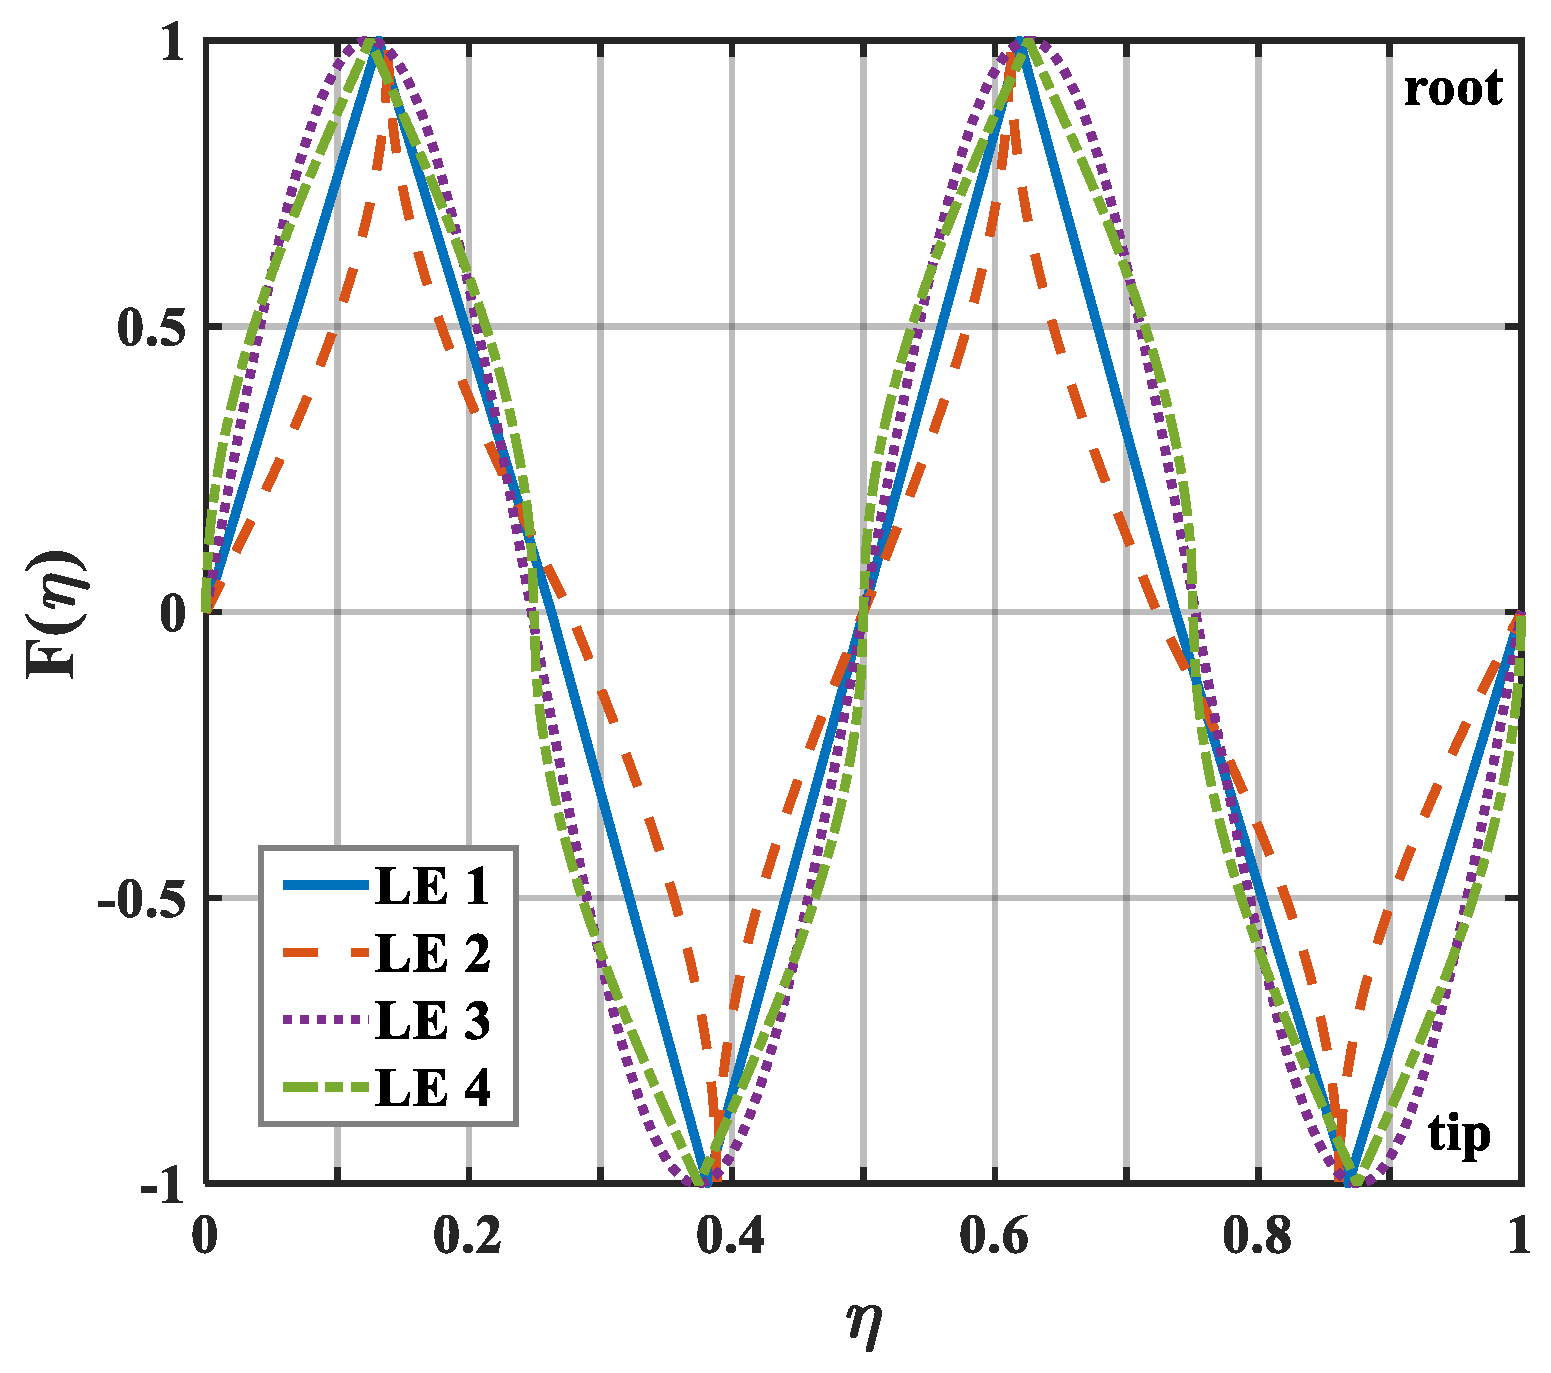
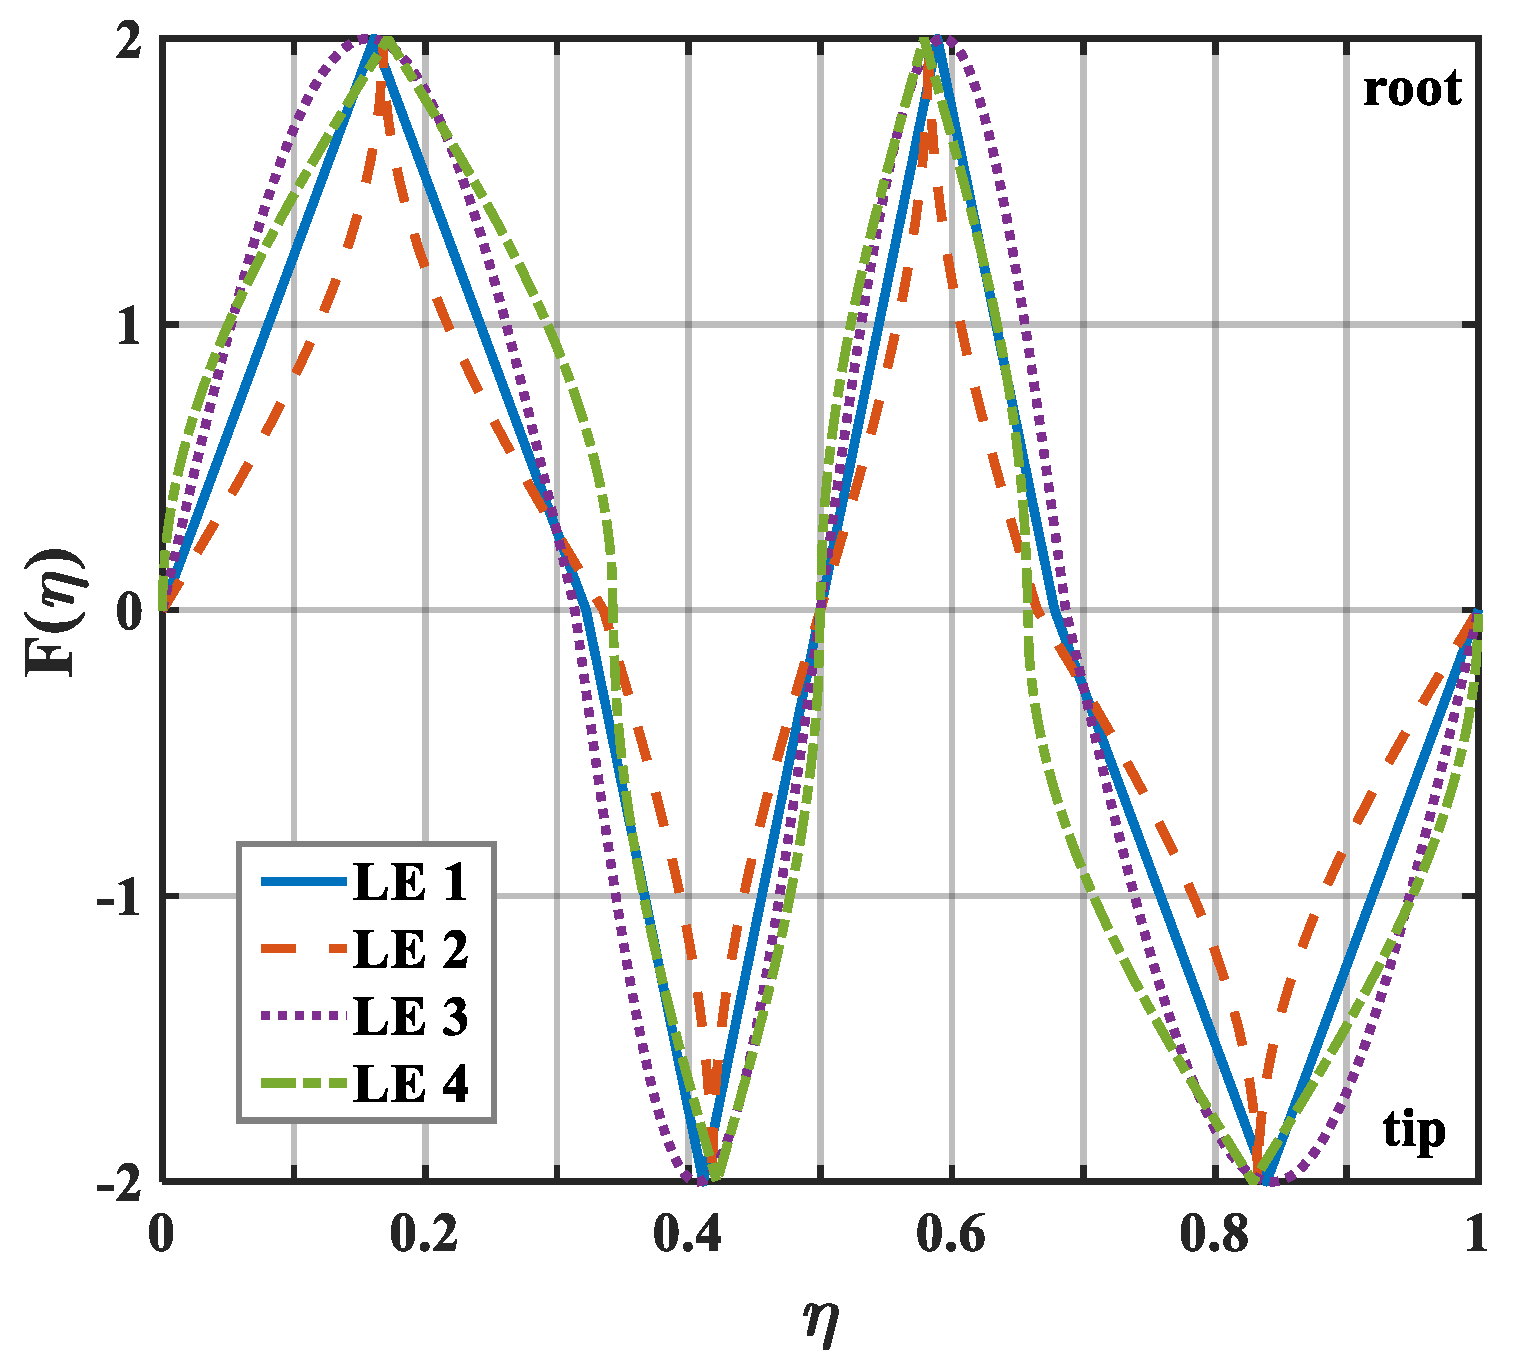
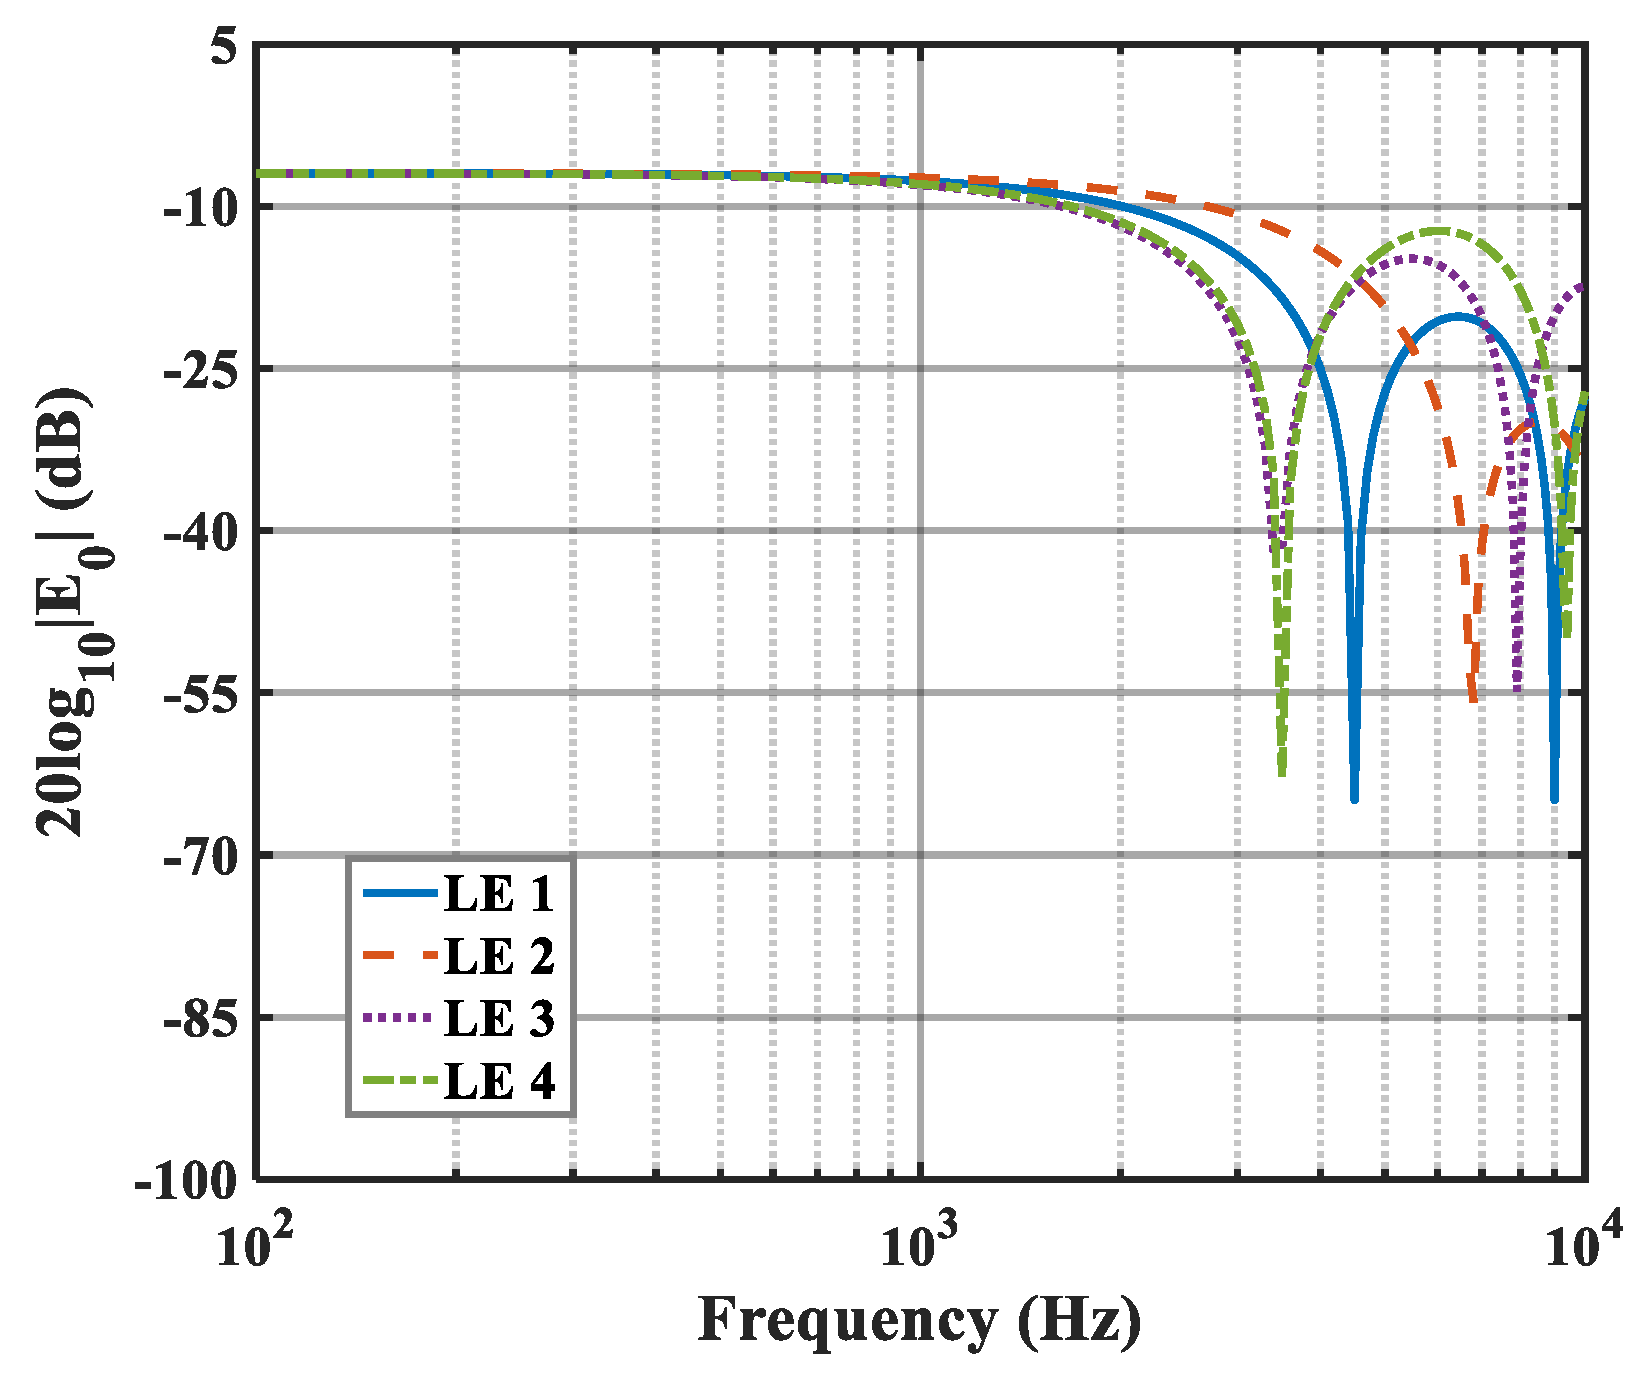
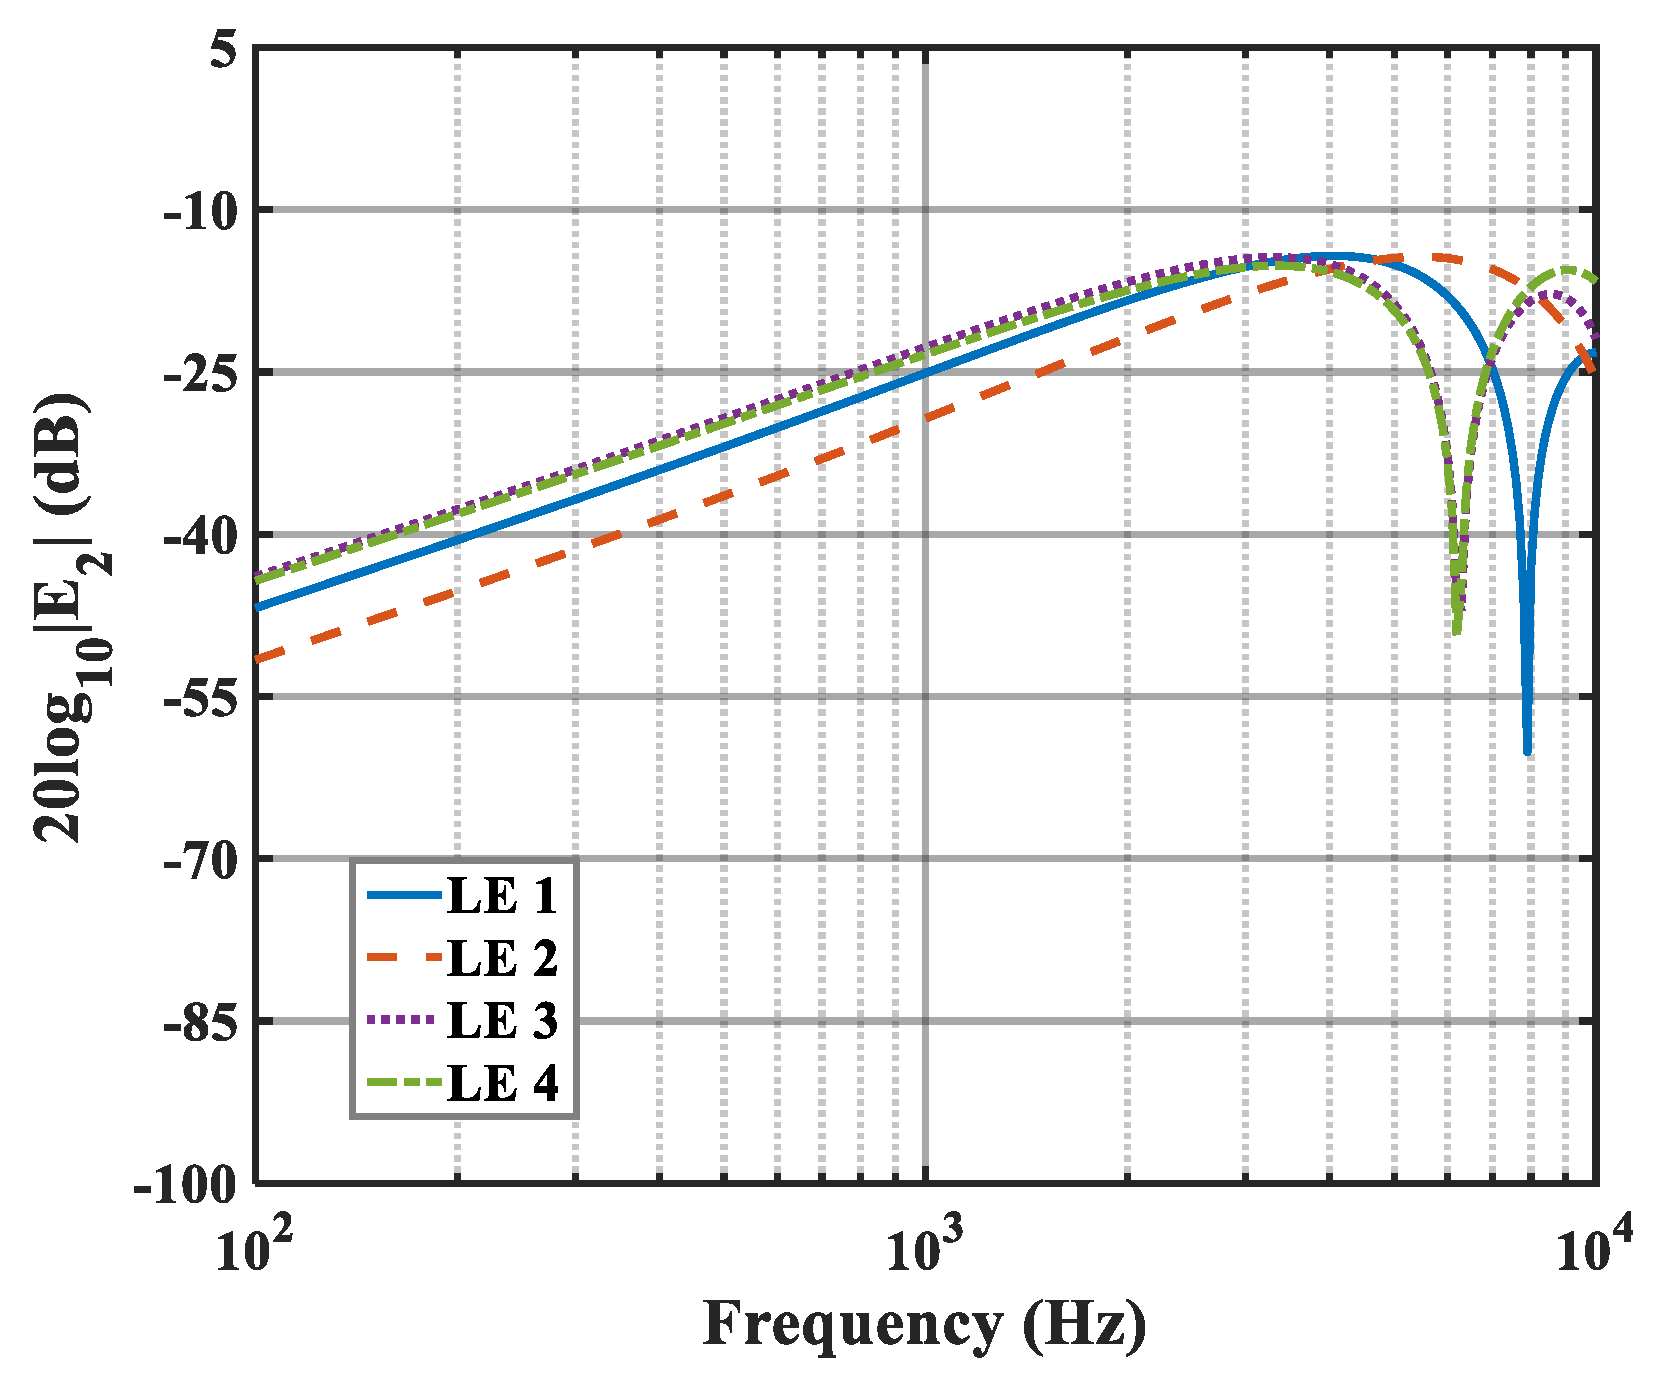
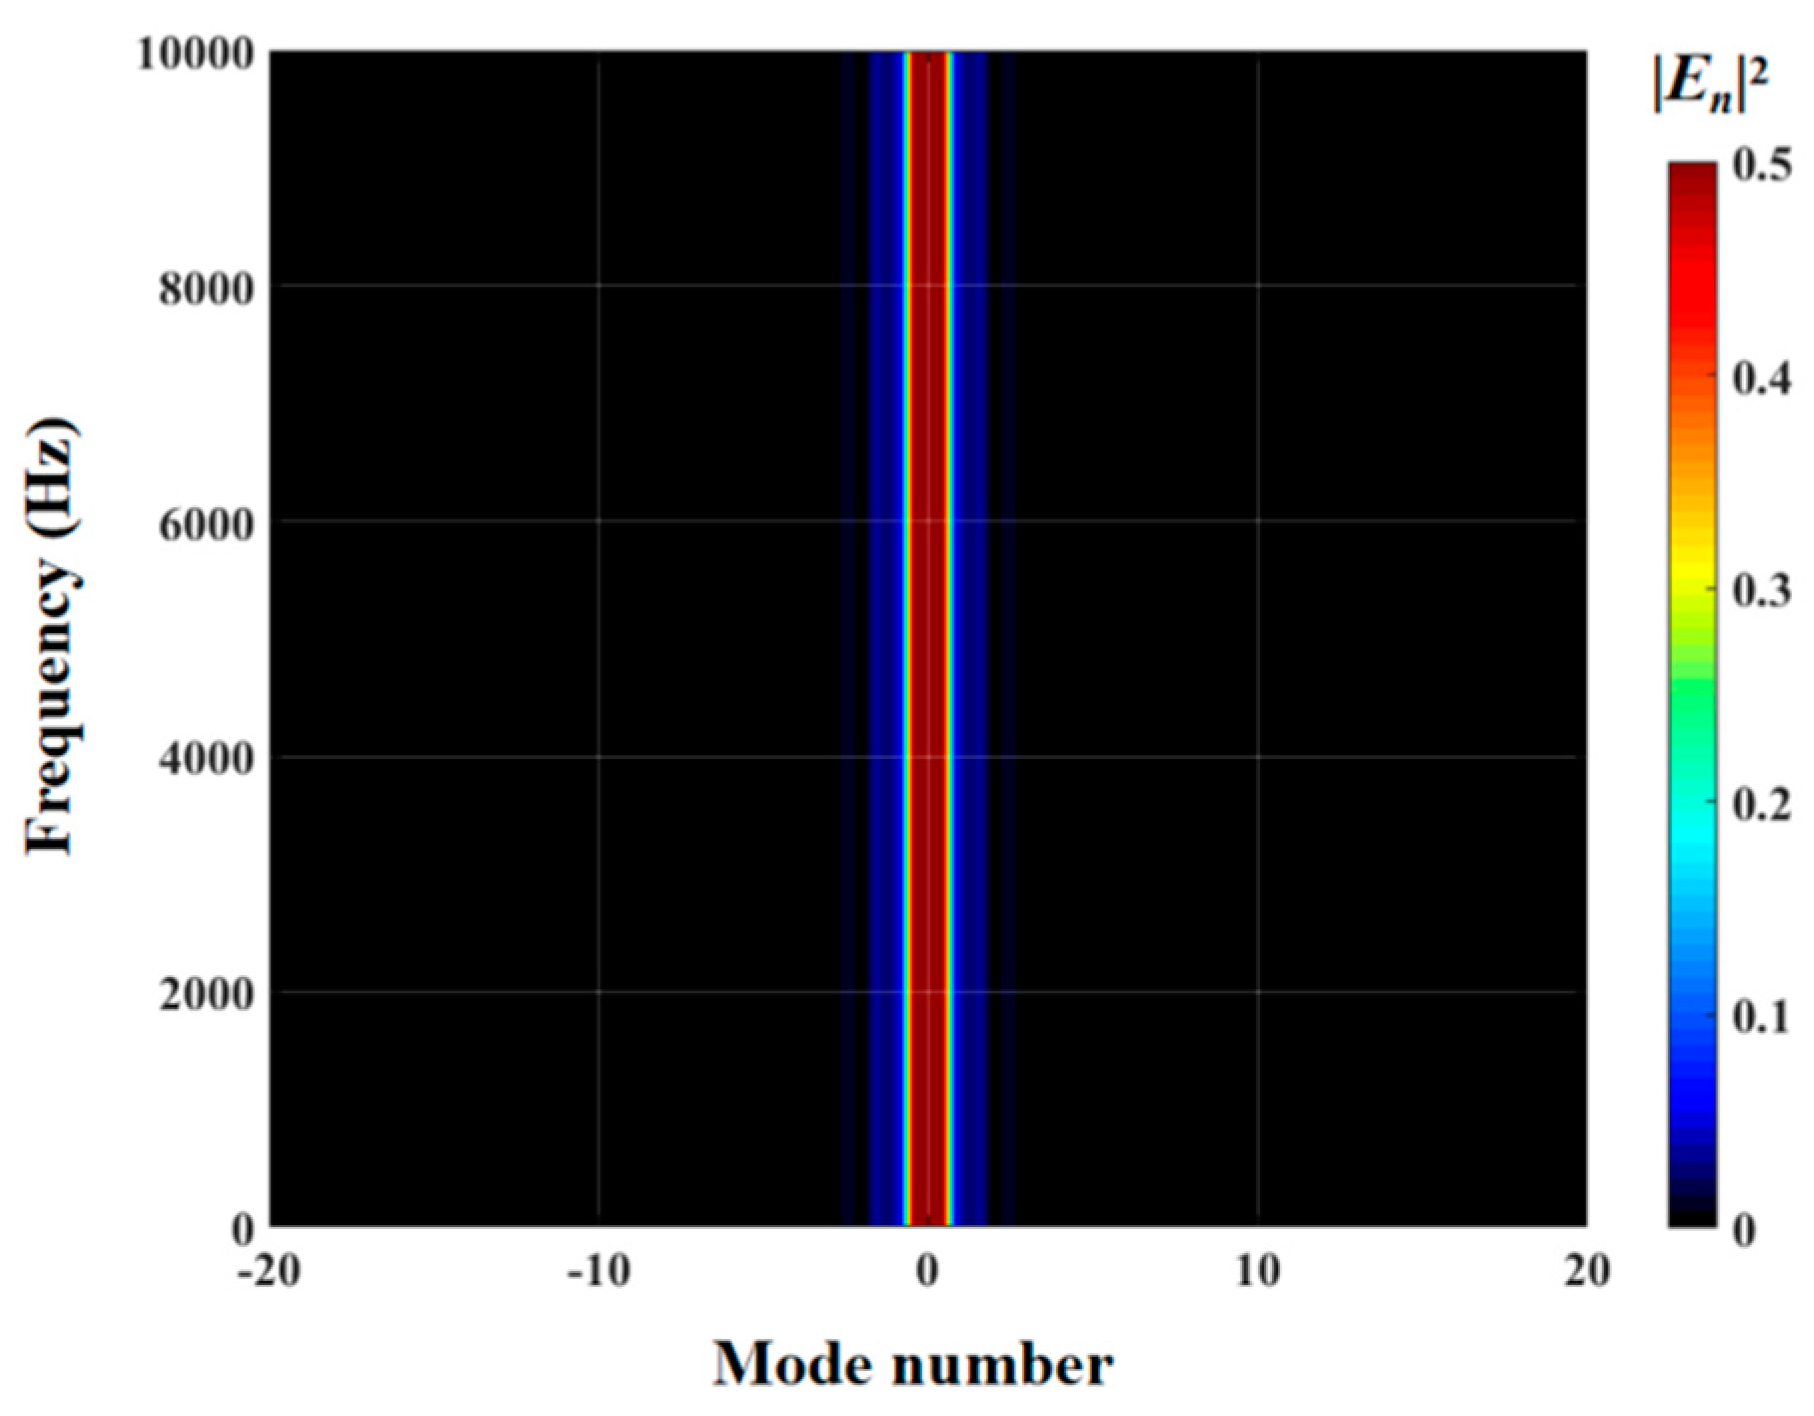
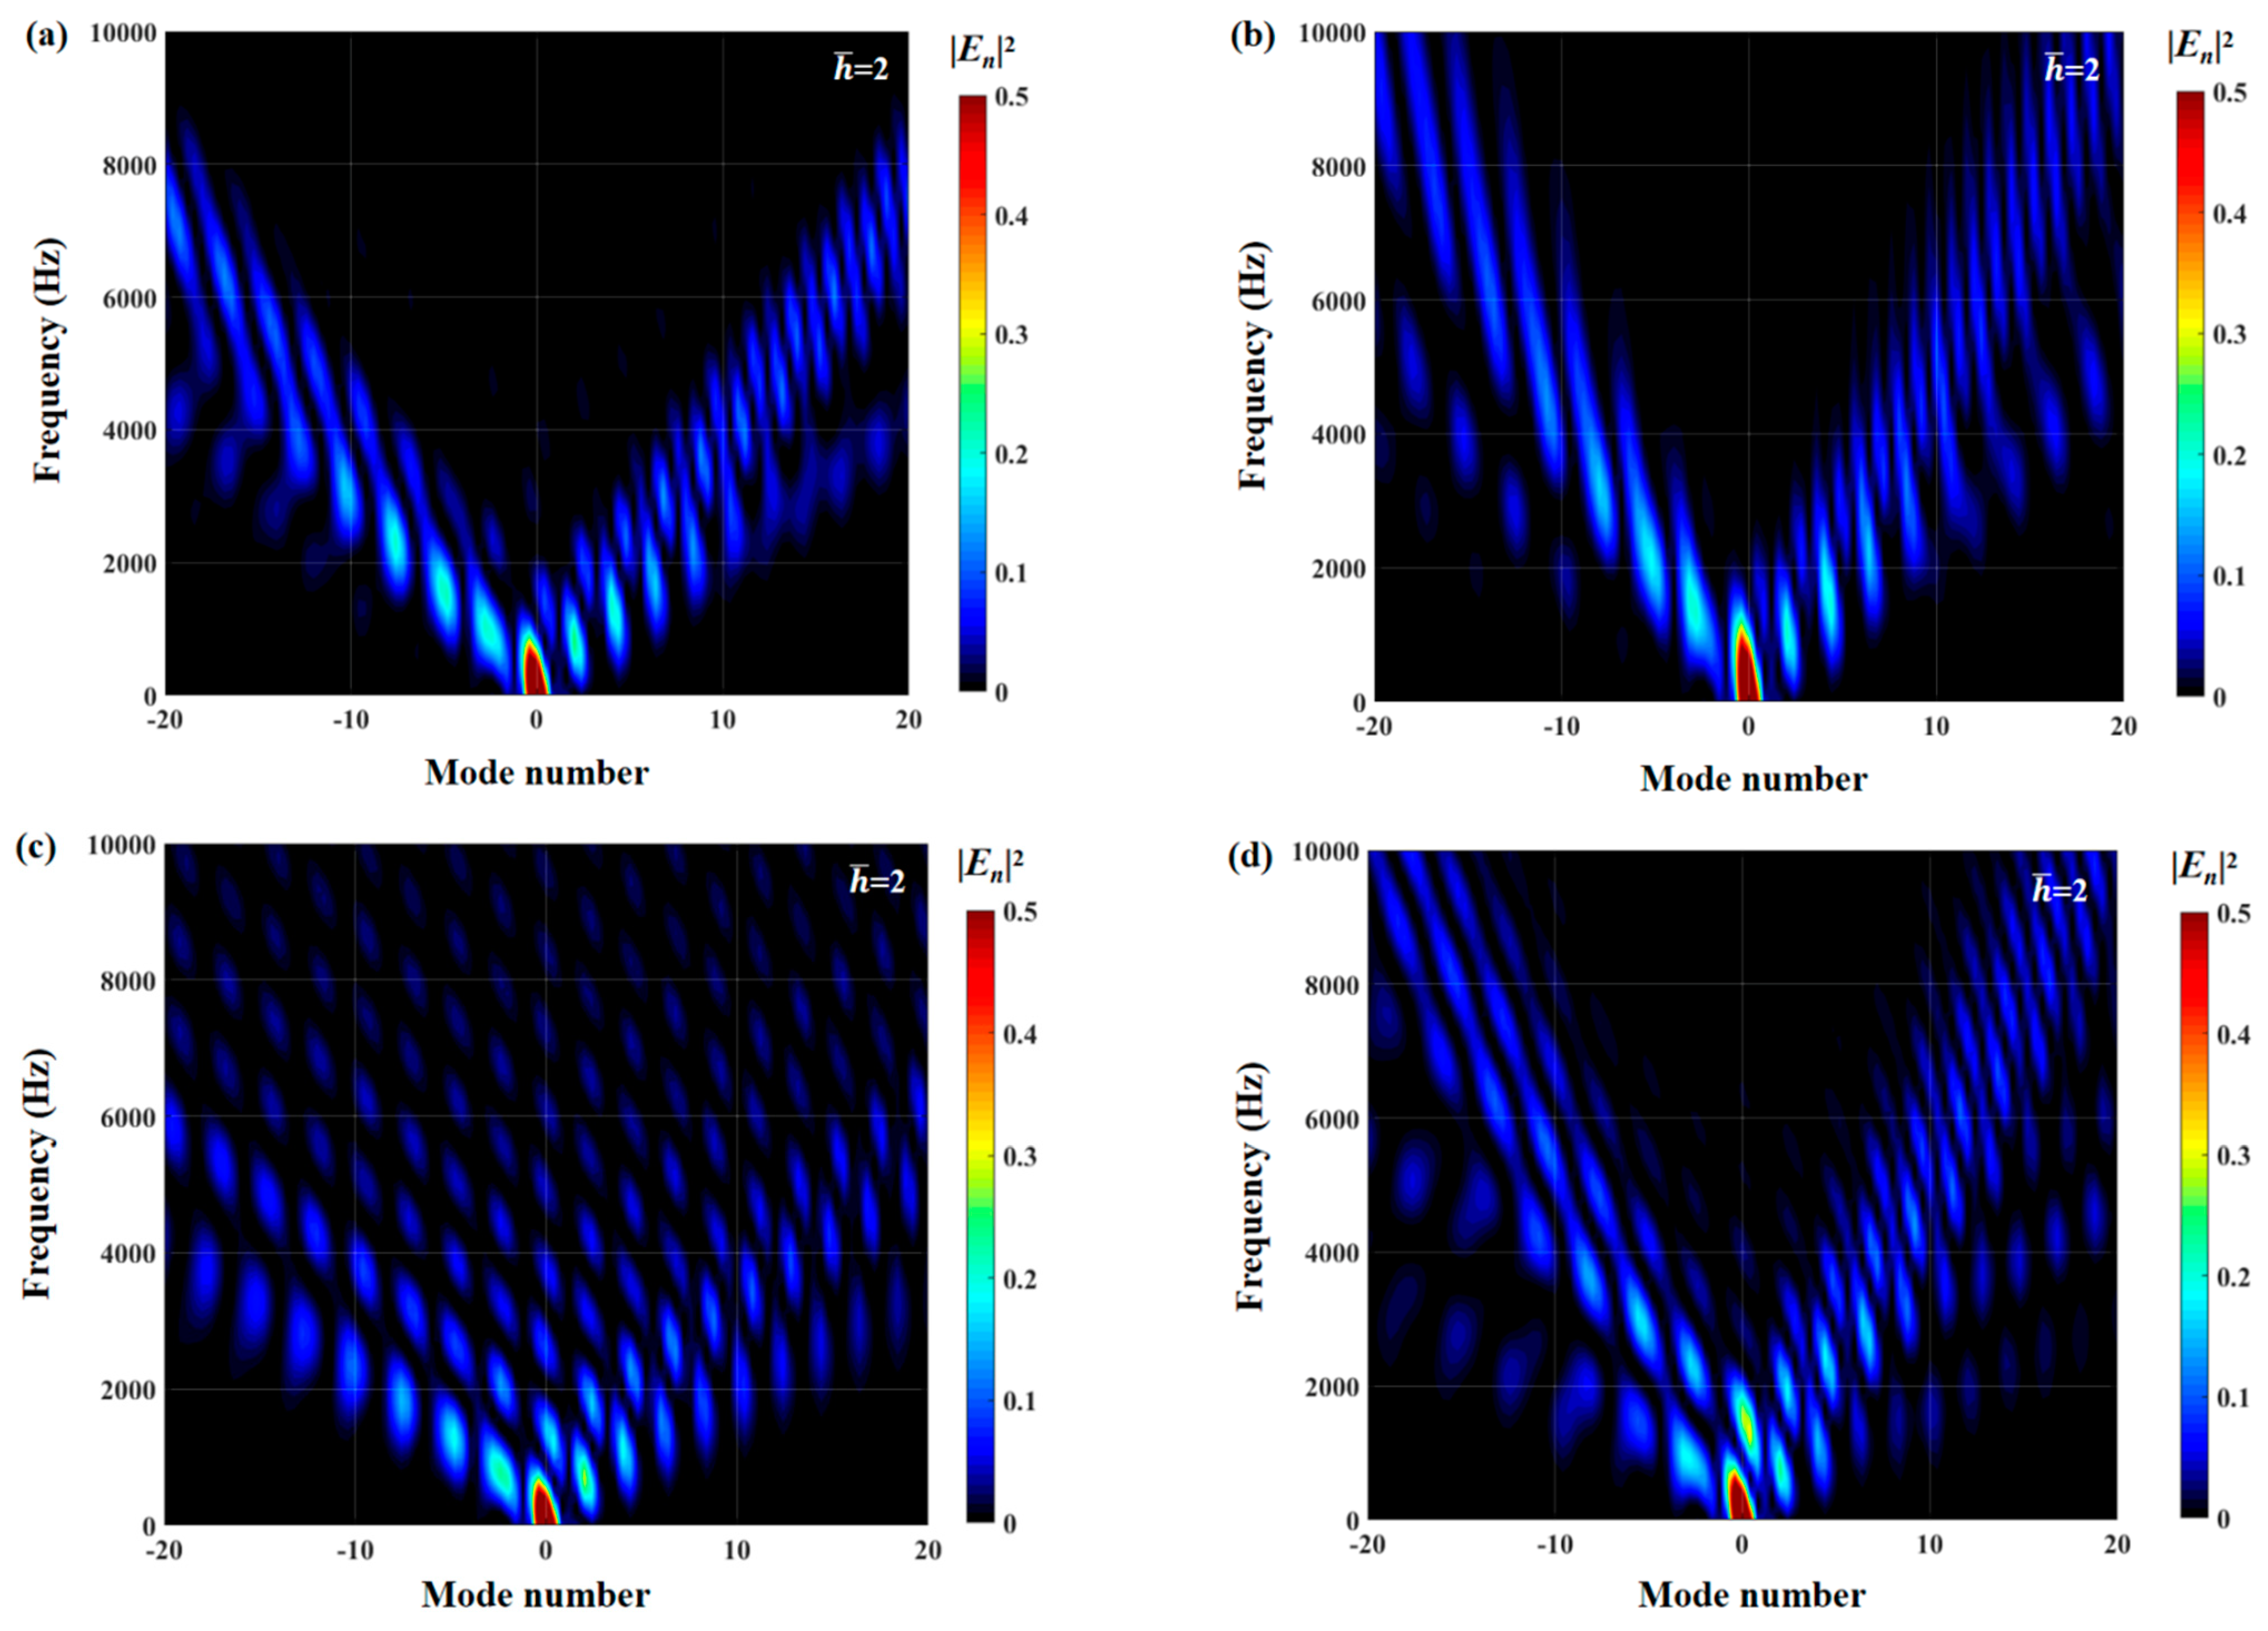
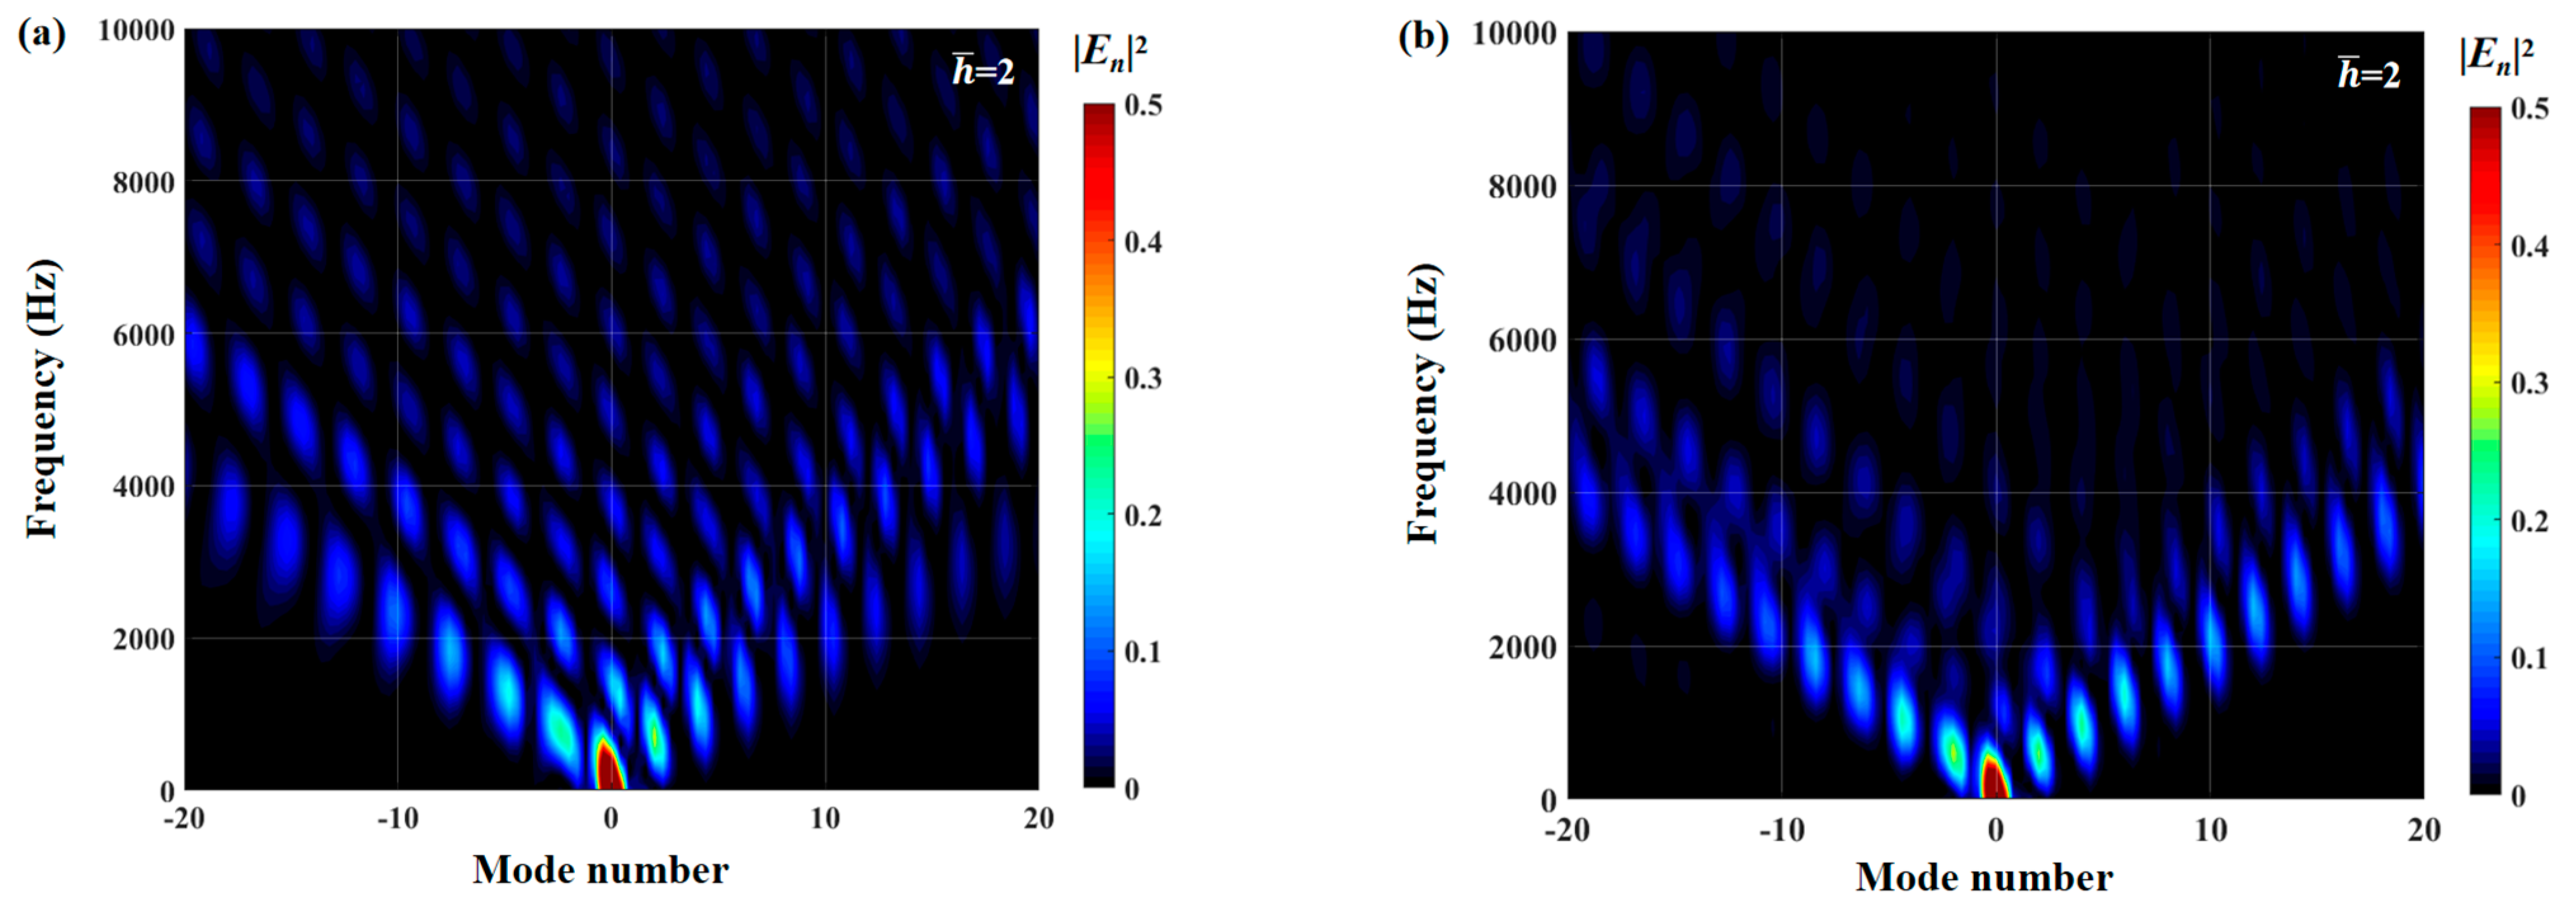
The effects of zero- and higher-order modes of E
n are also explored in
Figure 16,
Figure 17 and
Figure 18. With increasing modal order, the dominant parts of E
n for different serrations gradually tend toward higher frequencies. And, more modes need to be considered for higher frequencies. Since the higher-order modes contribute little to the sound pressure level at low frequencies, the calculation of higher-order modes is truncated to reduce the workload. Consequently, the zero-order dominant mode
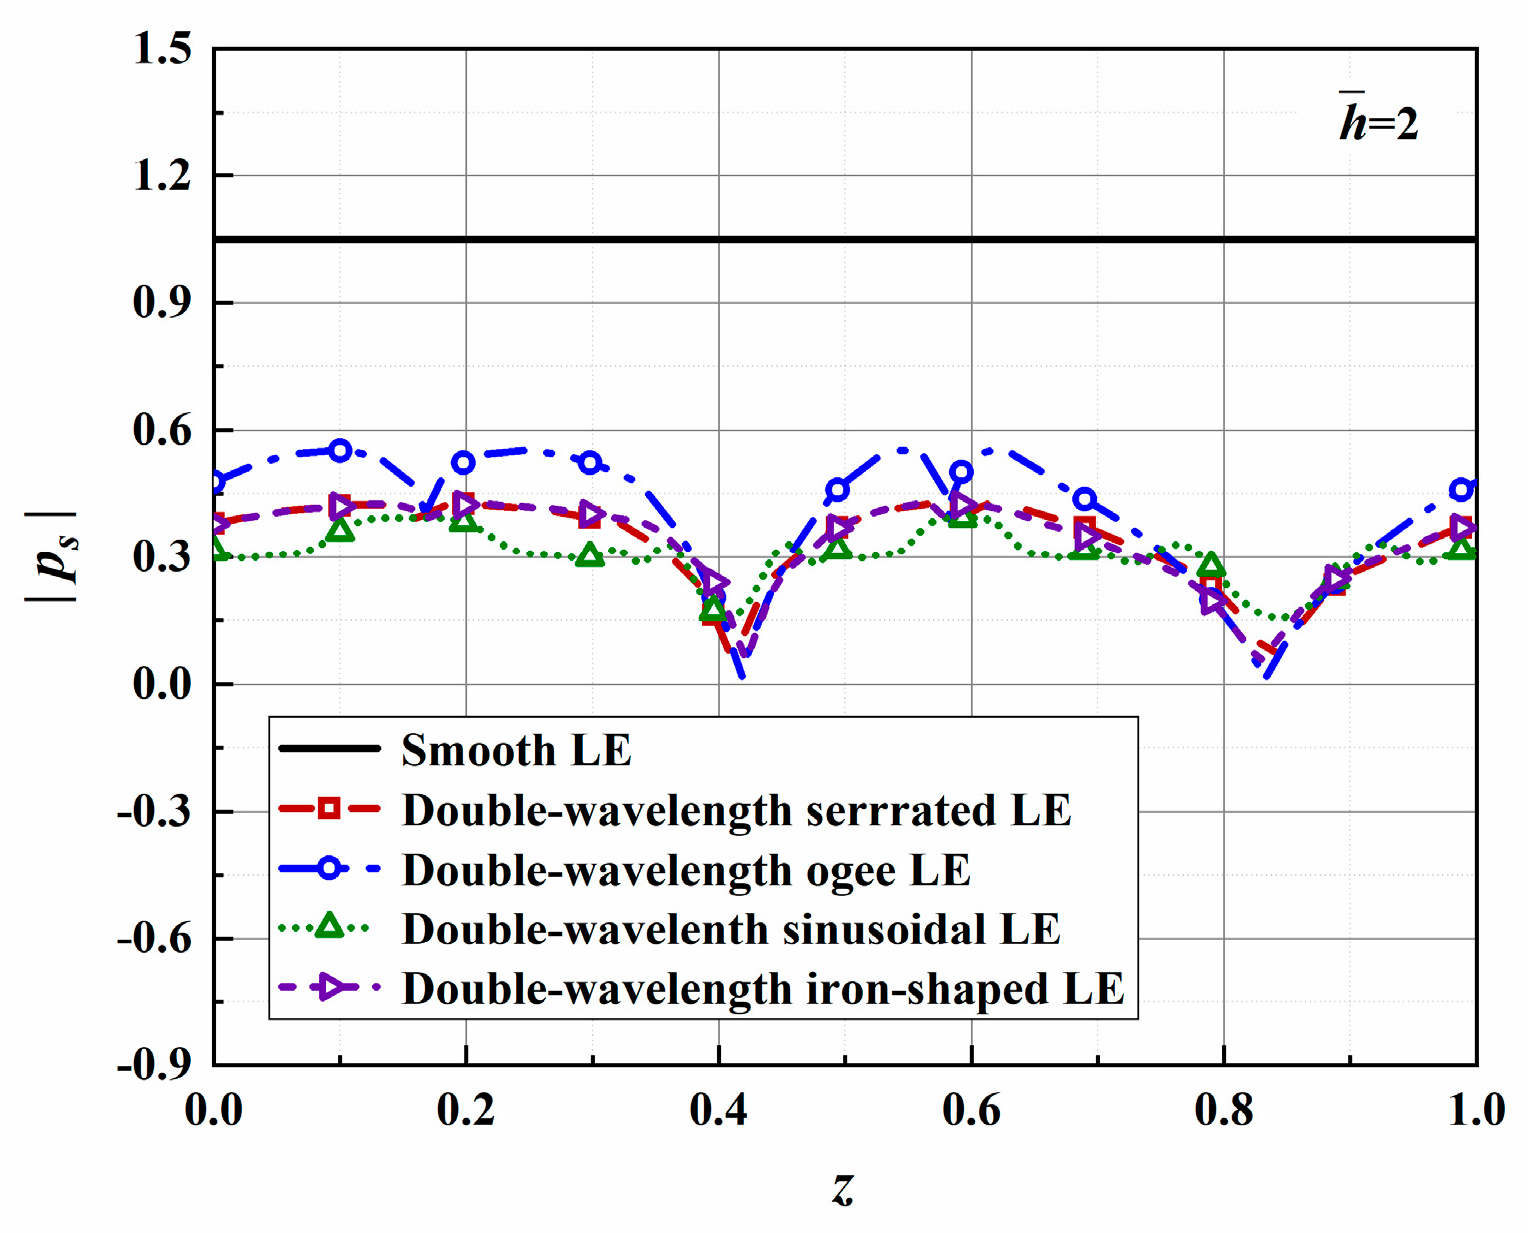
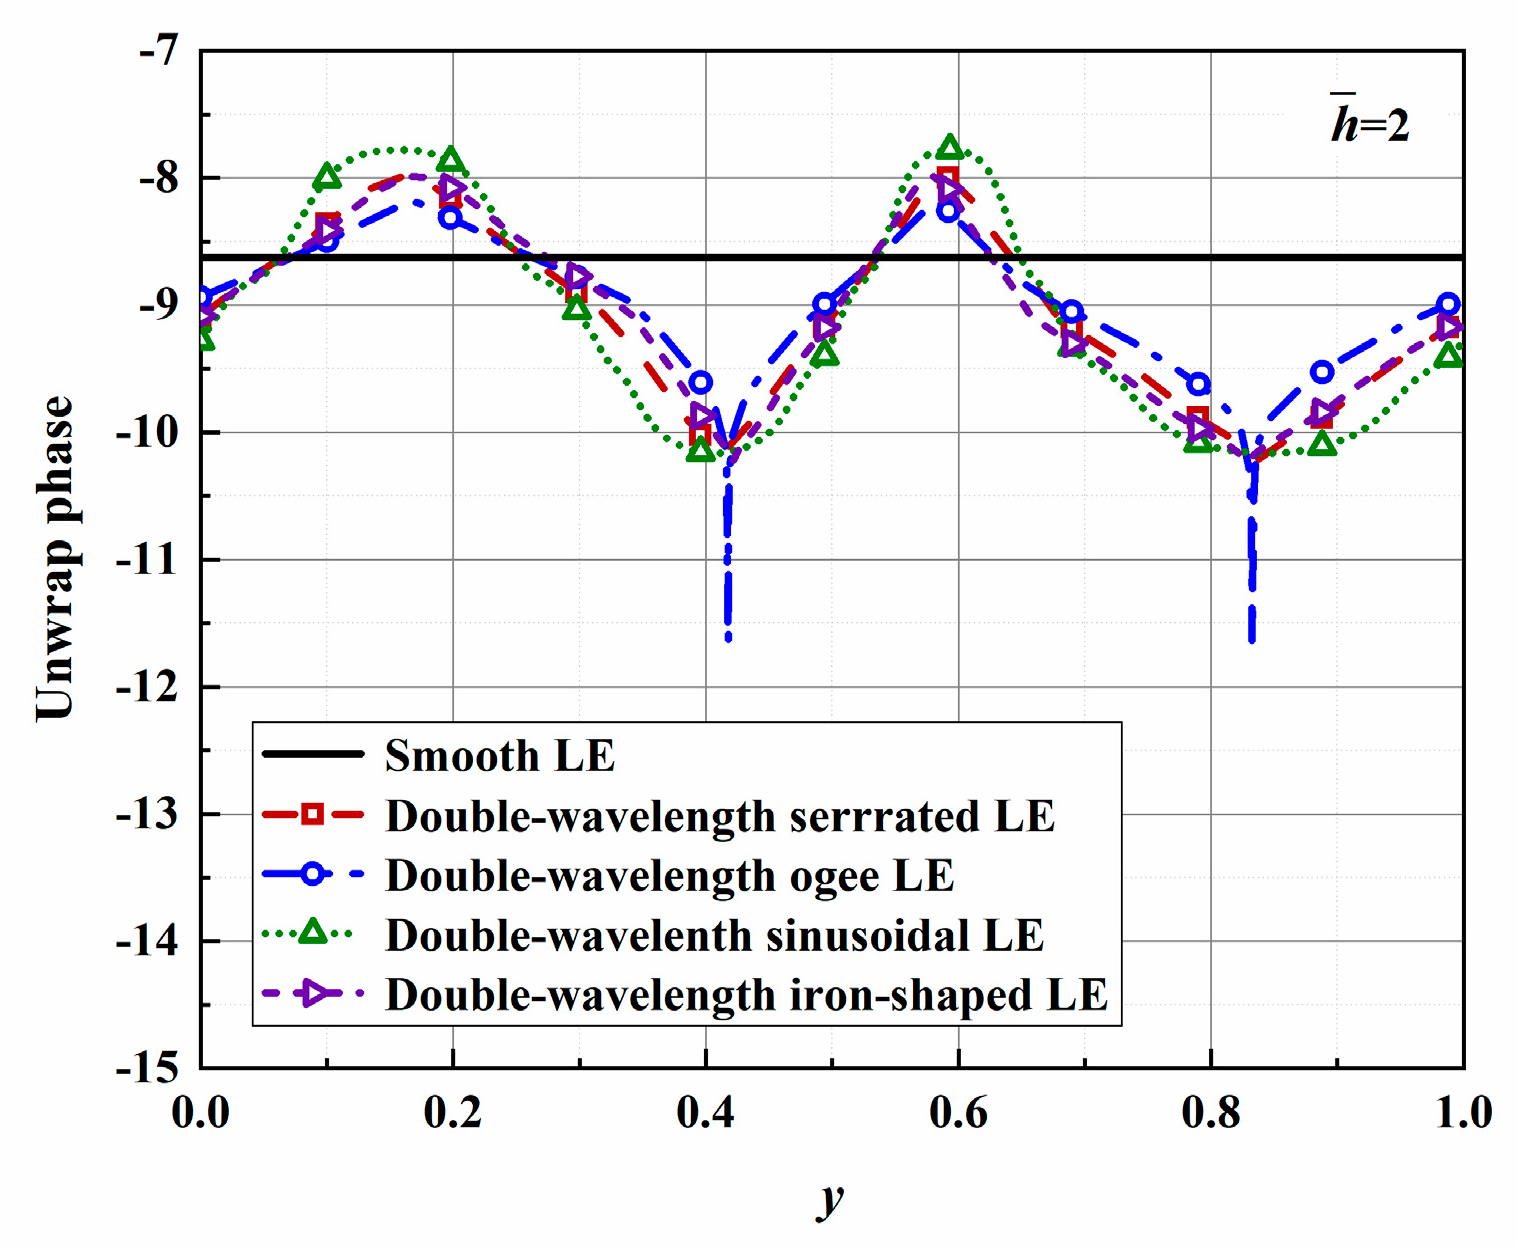
, which is related to the number of degrees of freedom of the system, is now discussed. Distributions of
for serrations with other tip-to-root ratios are shown in
Figure 19 and
Figure 20.
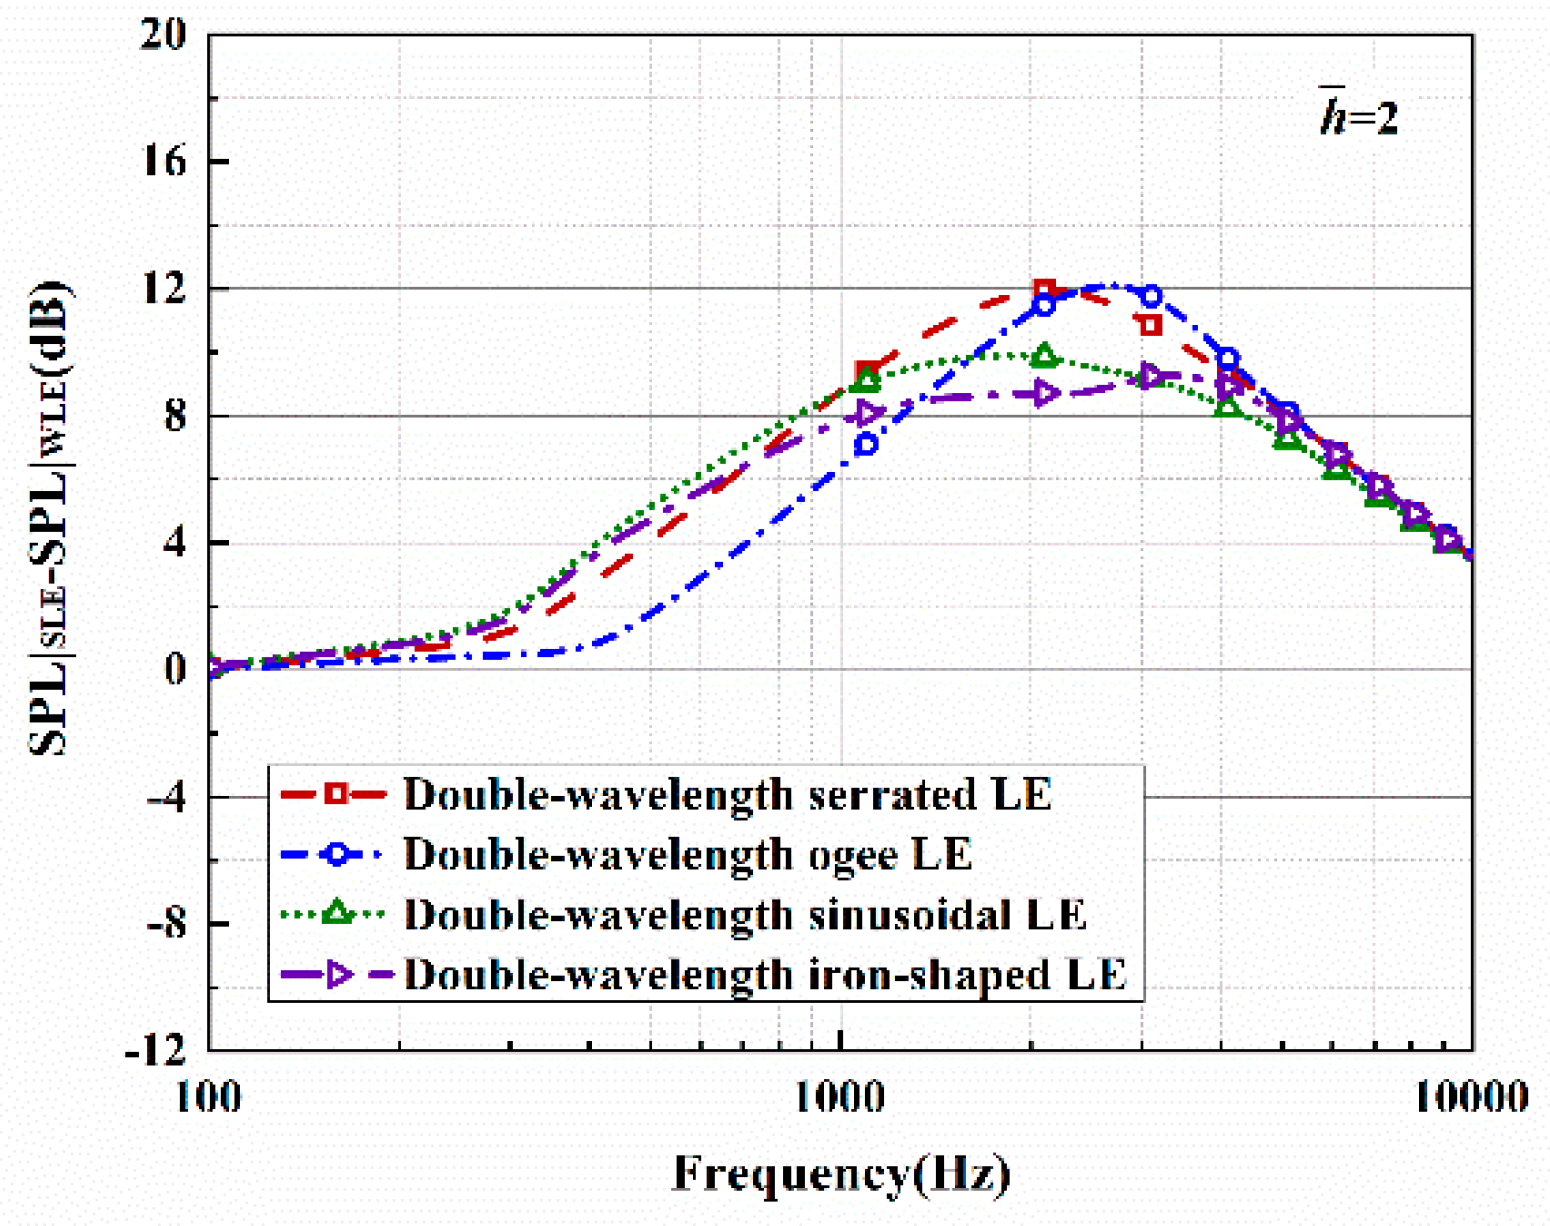
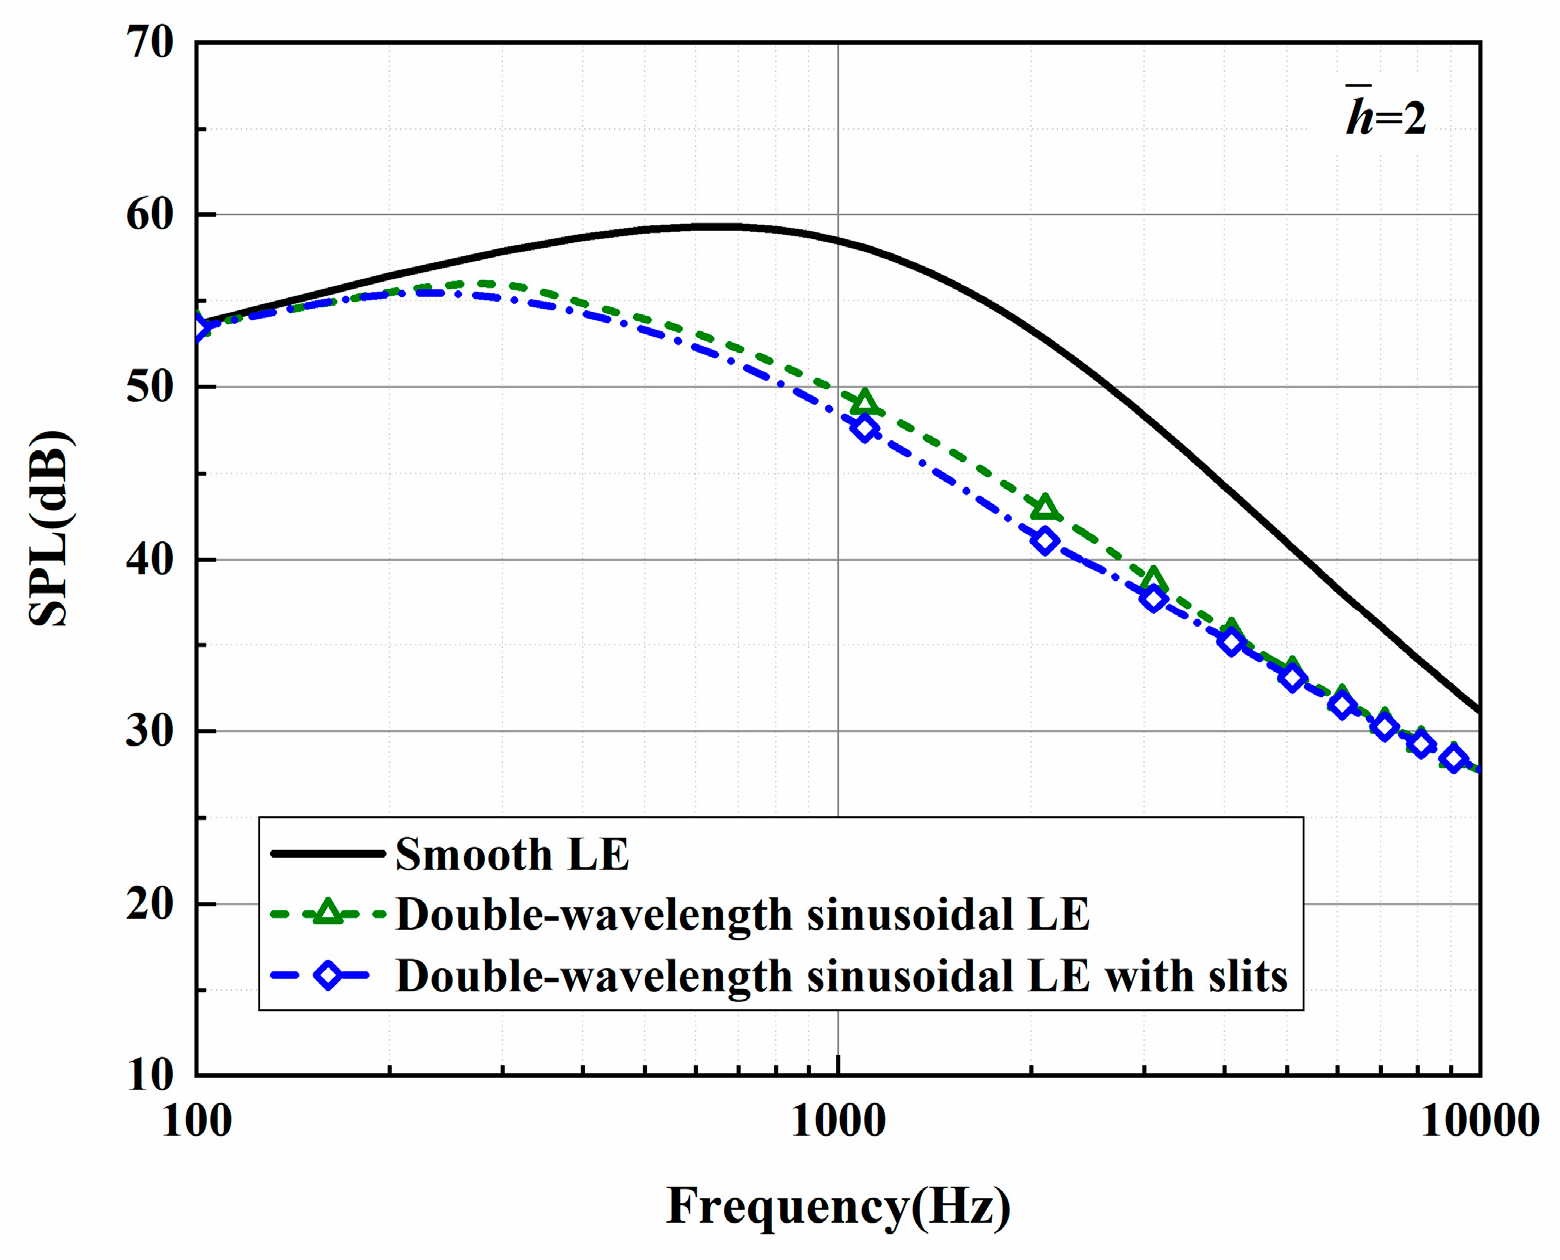
As increases, noticeable noise-reducing effects can be observed over the entire frequency range. Especially in the high-frequency band, the noise reduction advantage of ogee serrations is significant. Nevertheless, the effectiveness of the leading-edge serrations is limited on account of the trailing-edge self-noise. Considering these results in combination with the subsequent spectra, it can be seen that the difference in the overall sound pressure level is mainly concentrated in the low-to-medium frequency range. In addition, the noise reduction trend for the function at lower frequencies is similar to the trends of the sound pressure level spectra. From this perspective, the function can be adopted as a trend estimate for the evaluation of noise reduction performance.


