
Prediction and Measurement of Hovering Flapping Frequency Under Simulated Low-Air-Density and Low-Gravity Conditions


Abstract
1. Introduction
2. Materials and Methods
2.1. Calculation of the Predicted Frequency and Lift Coefficient
2.2. Experiment
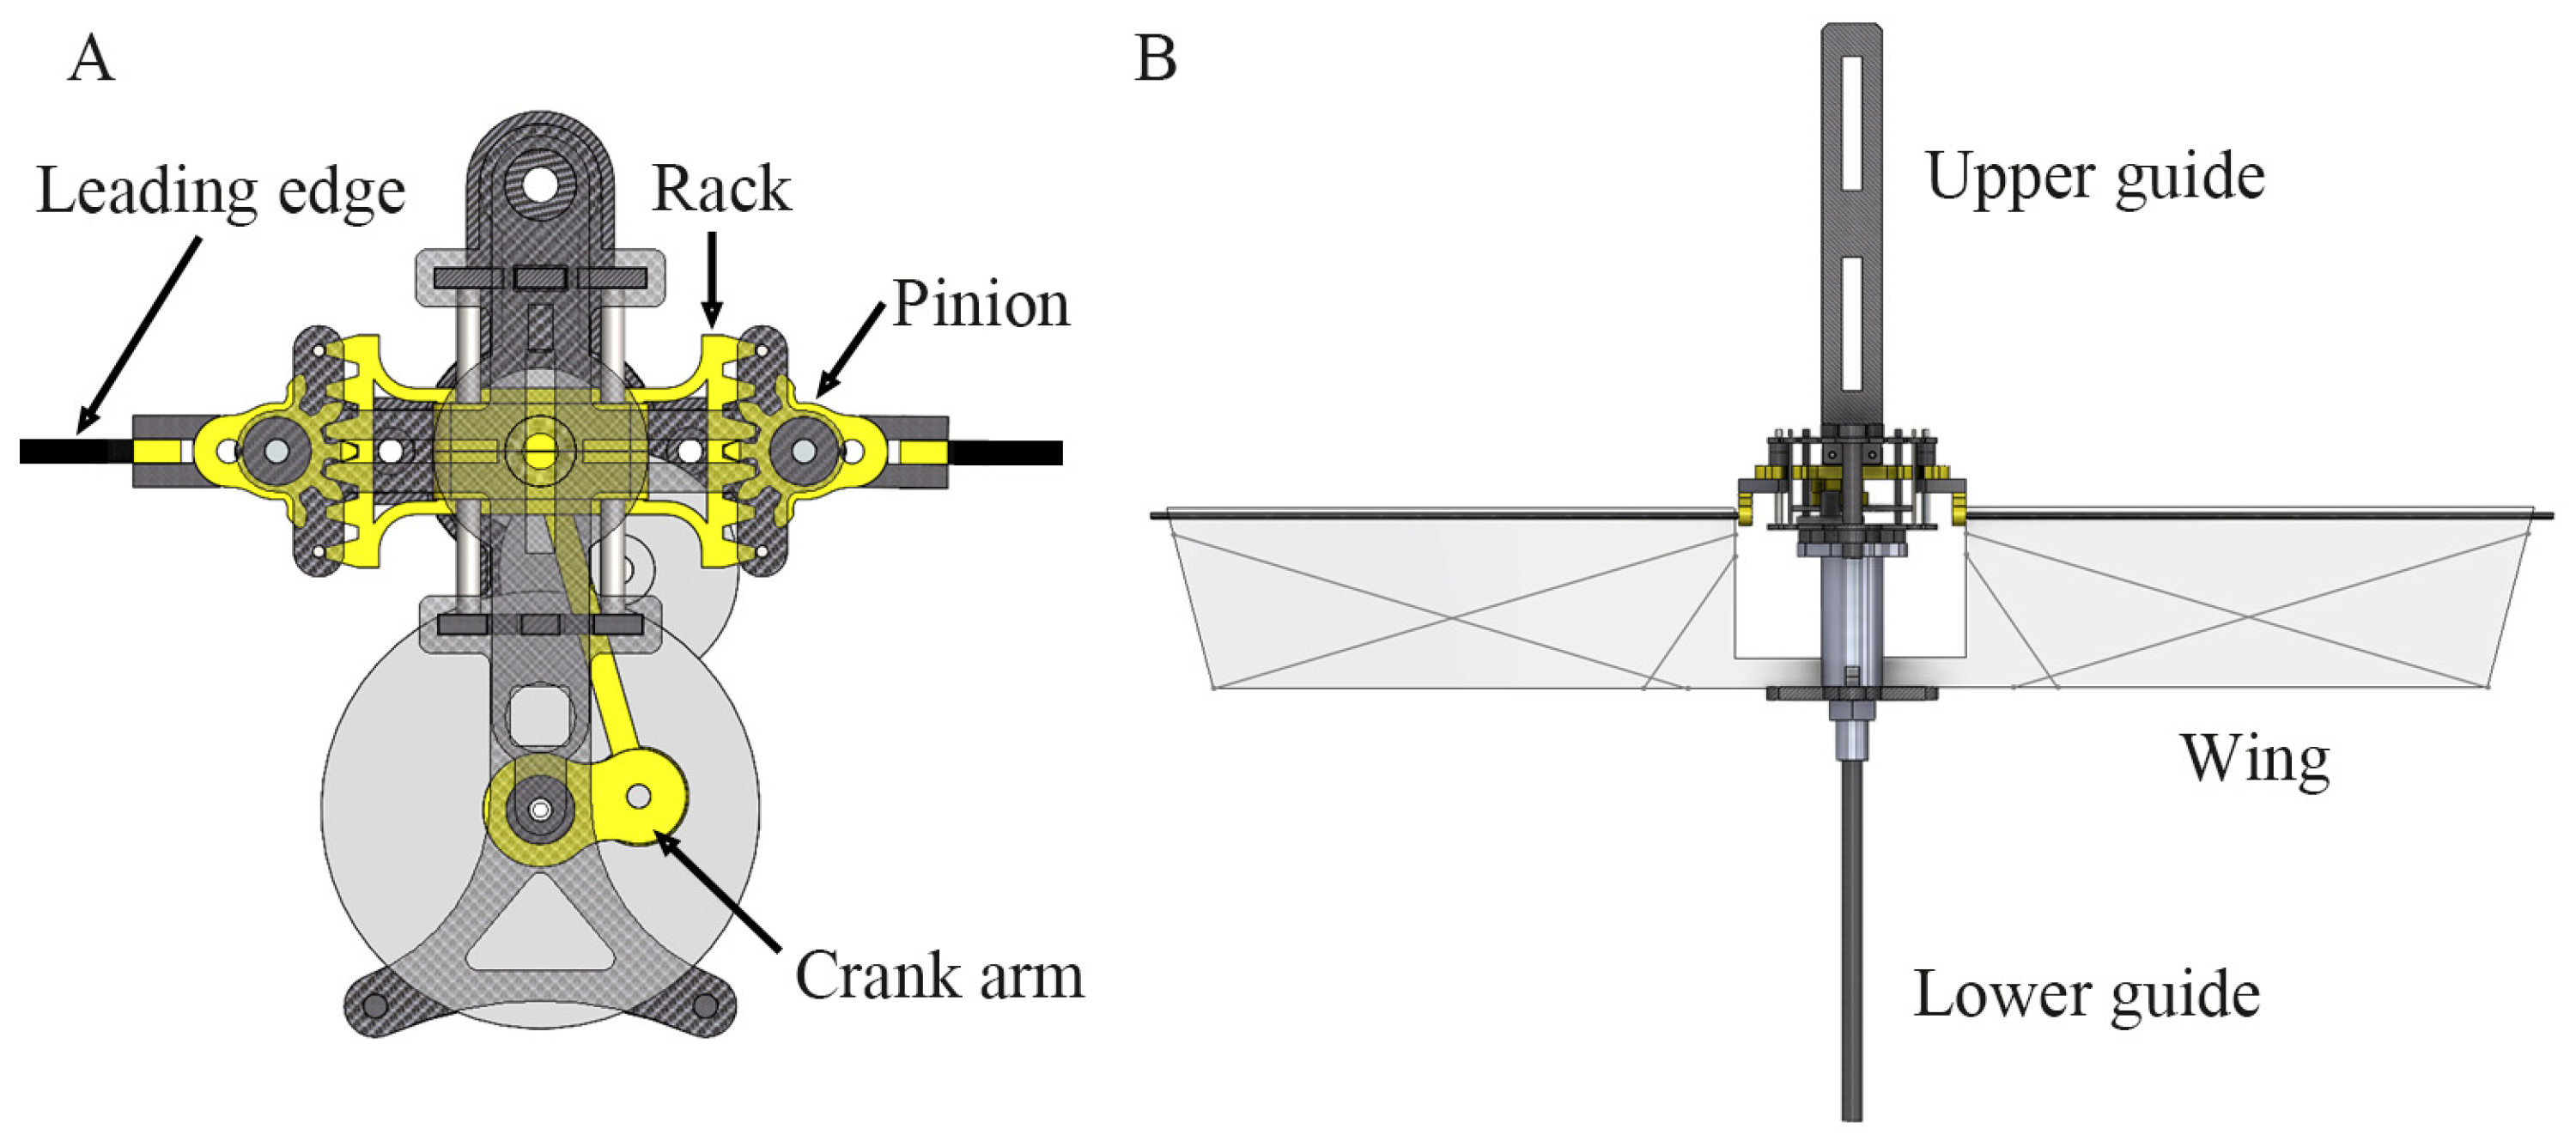
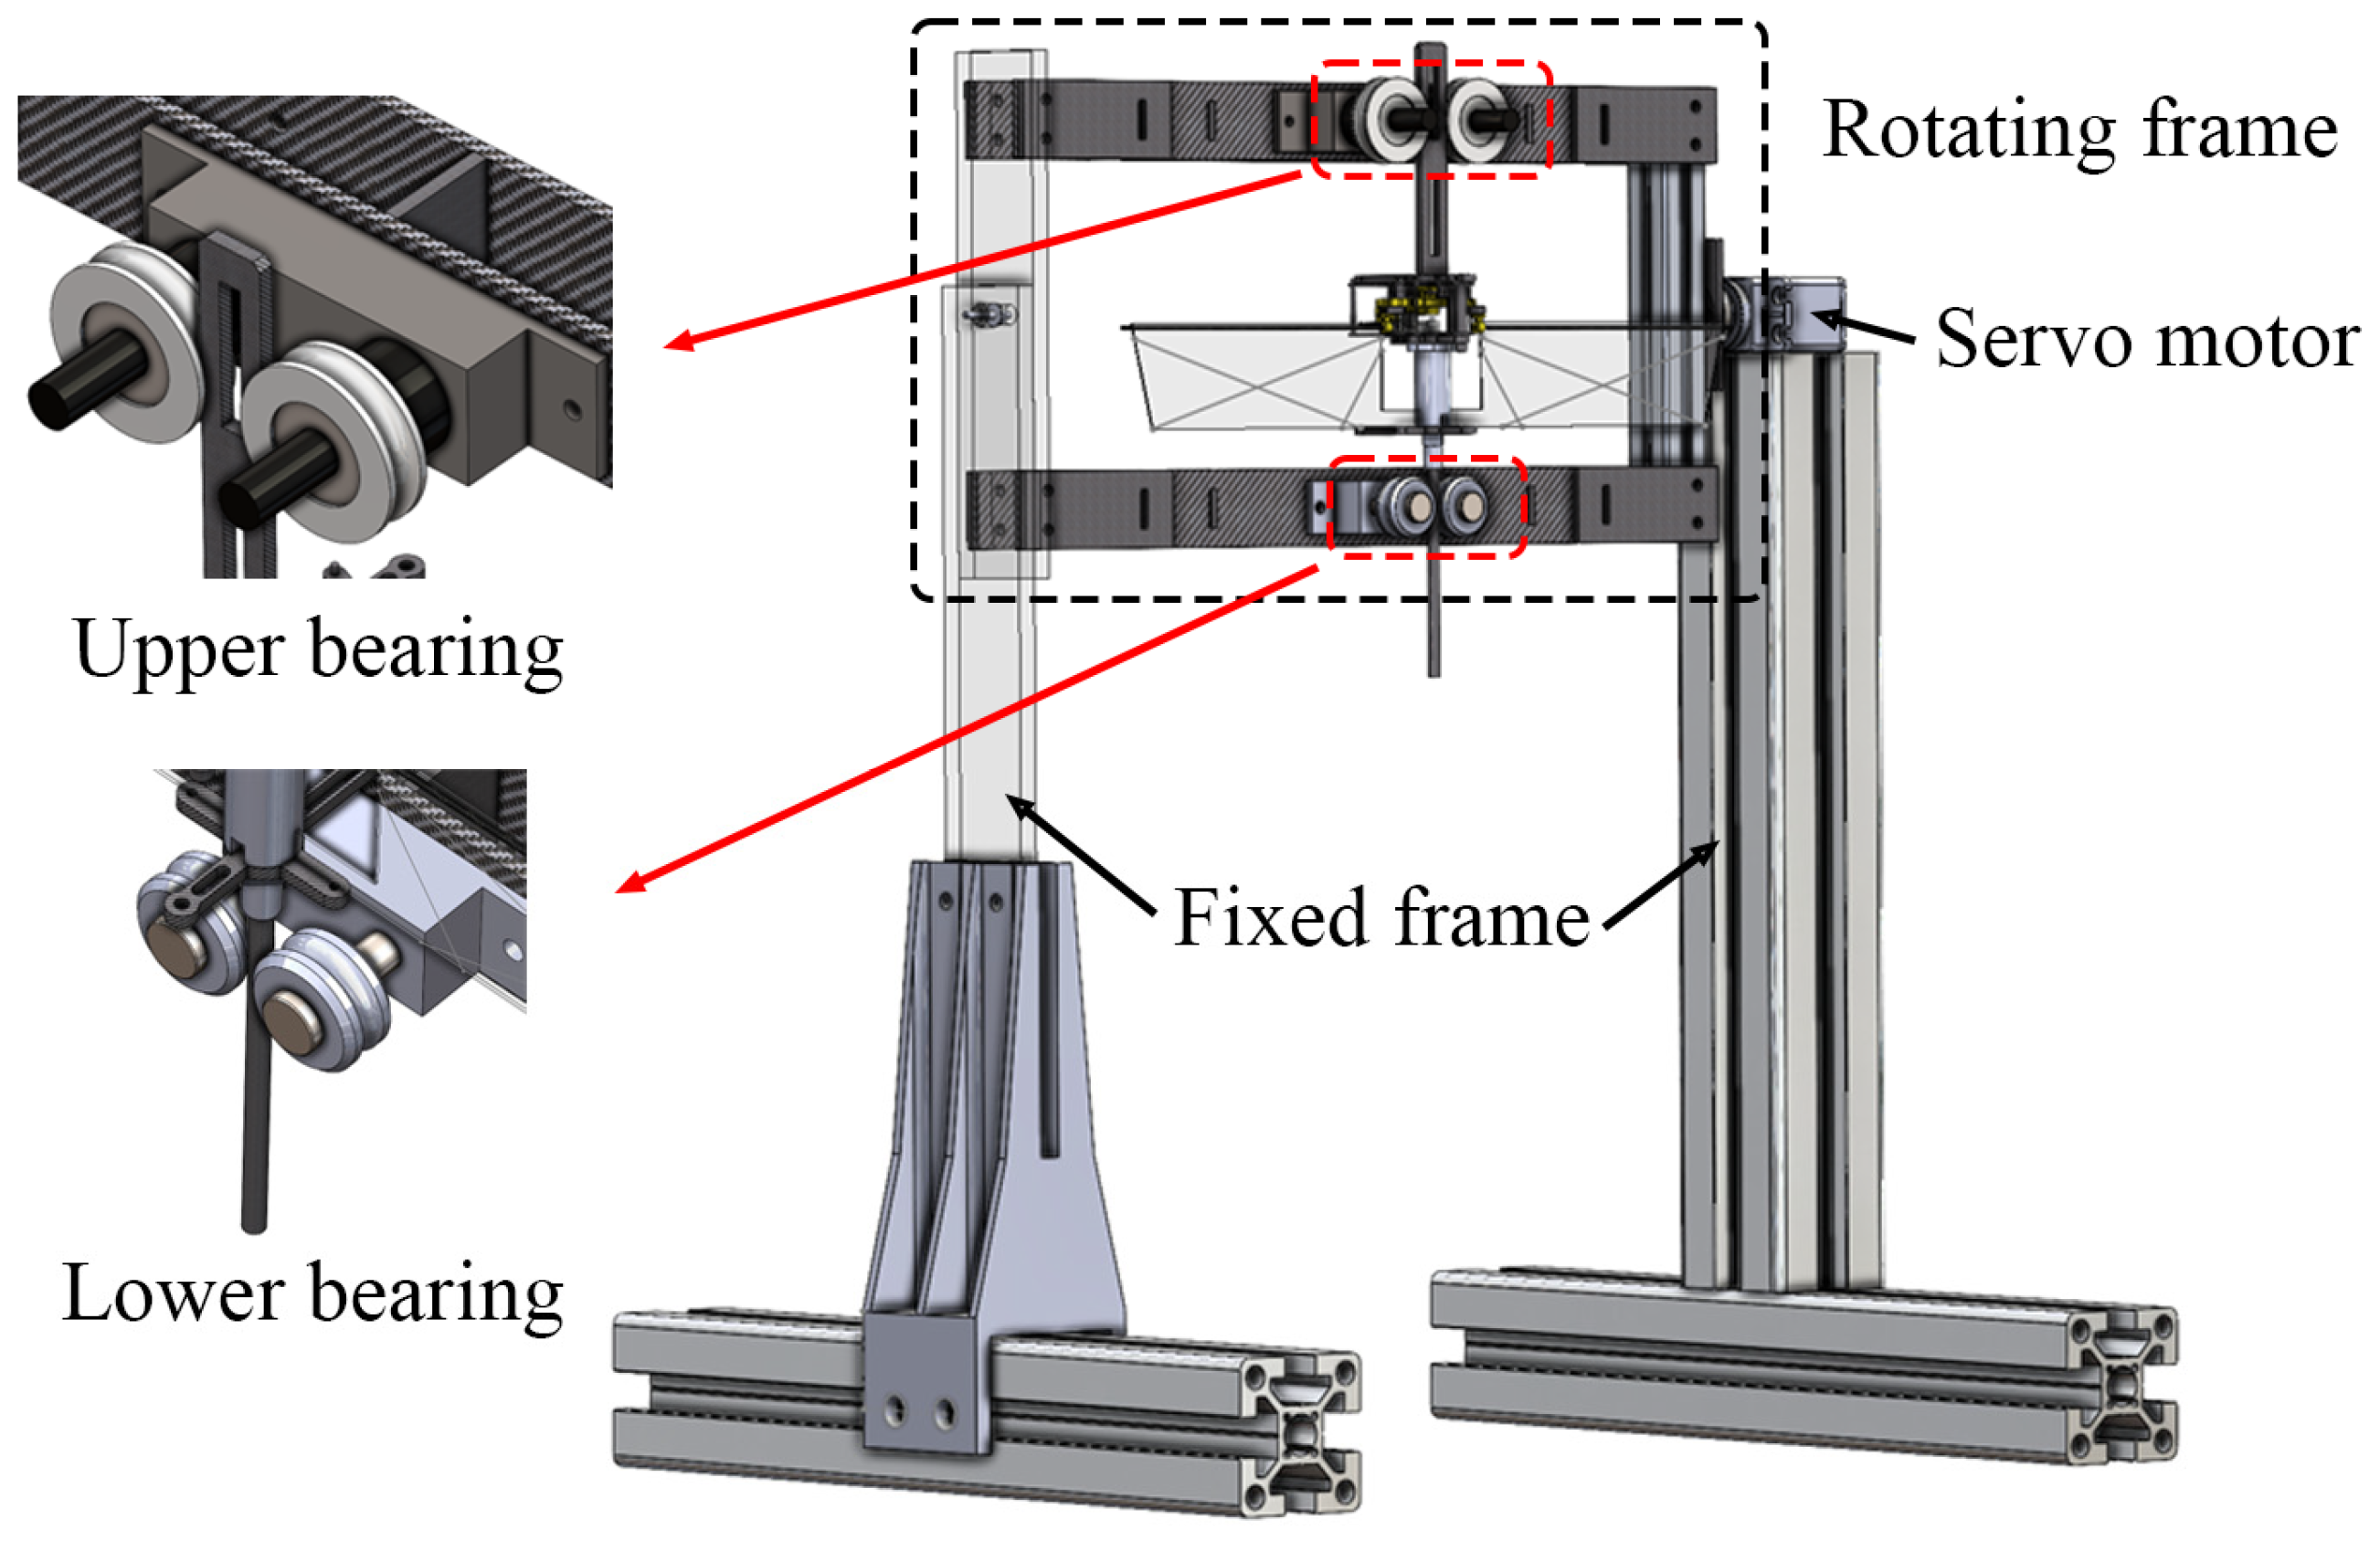
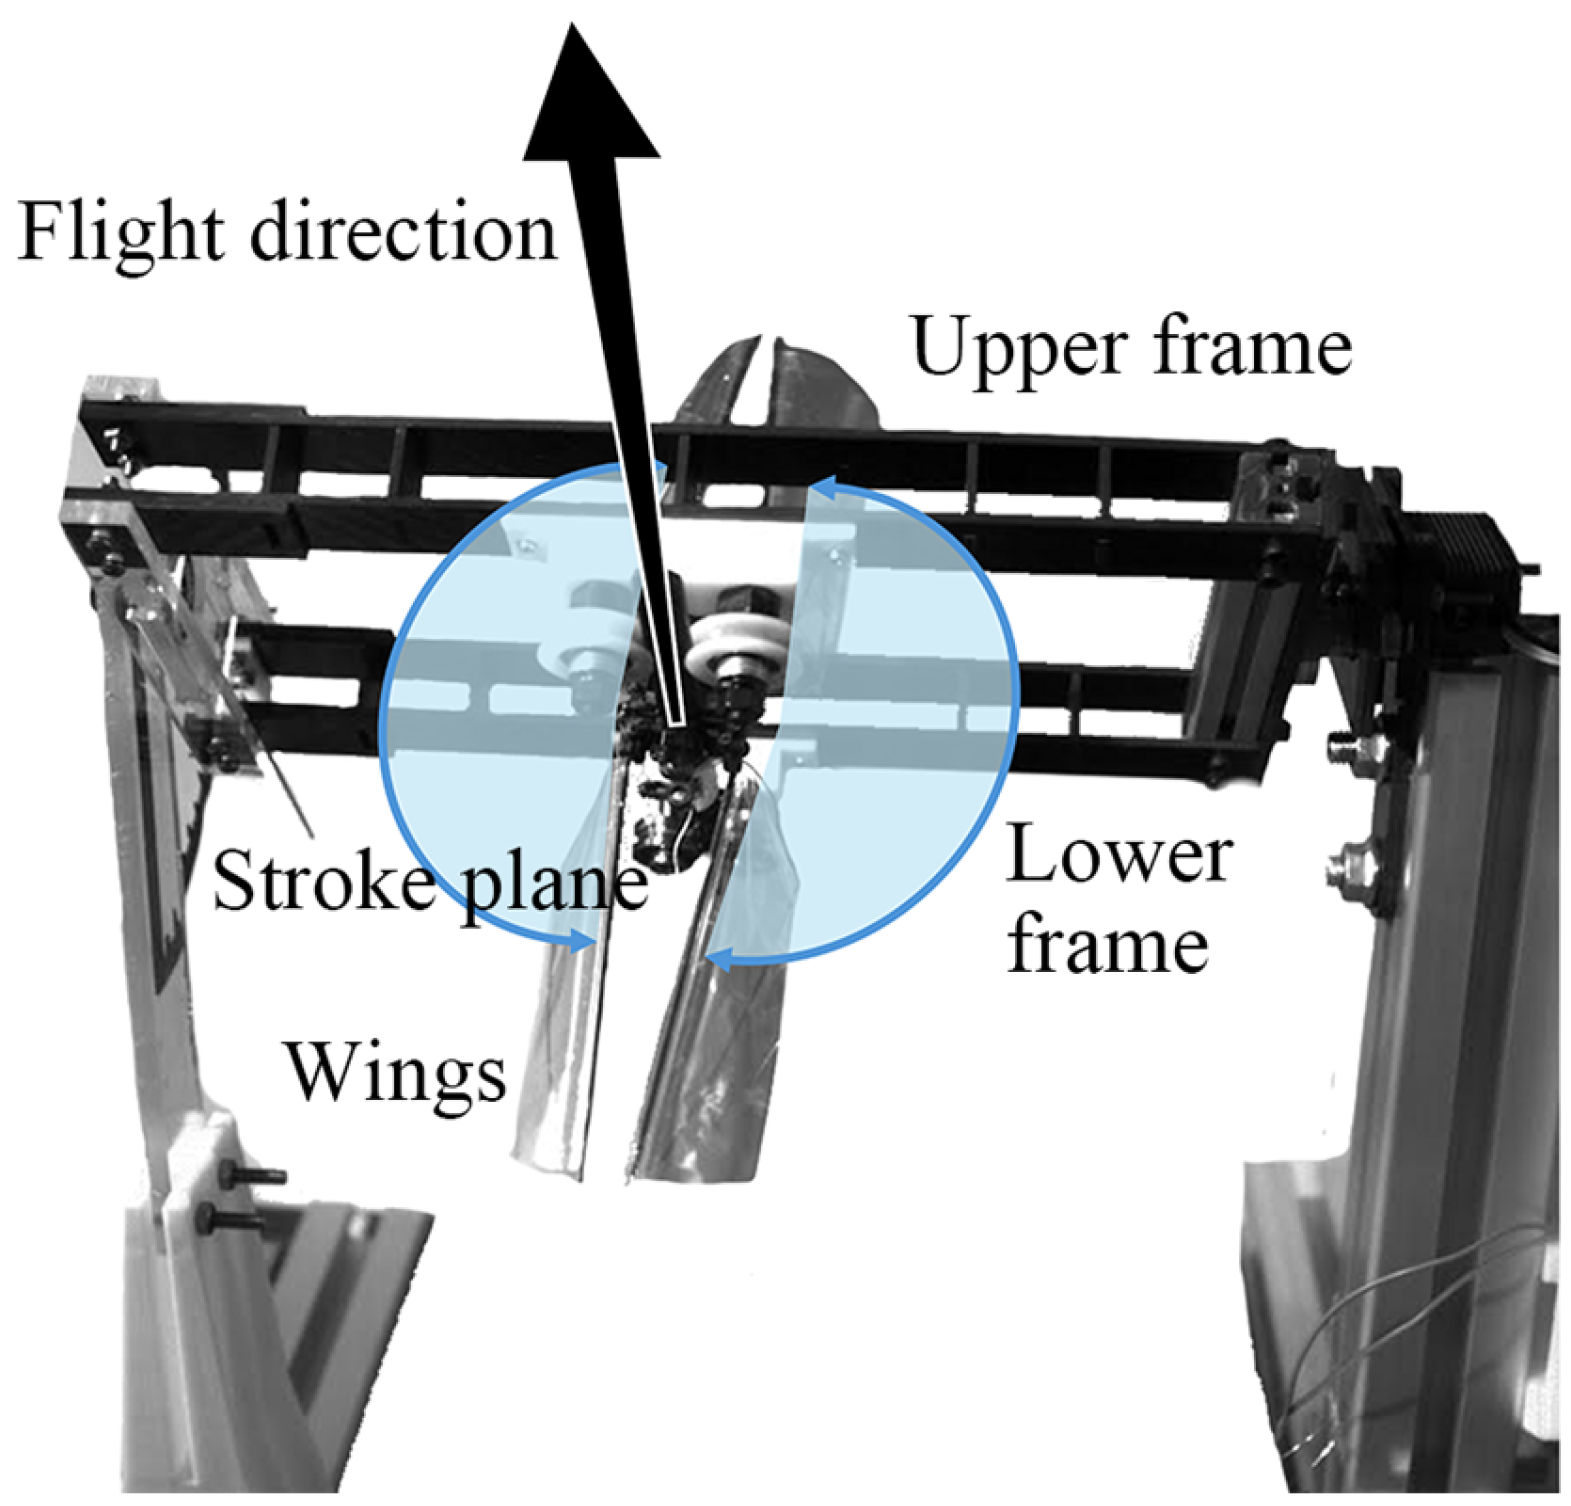
2.2.1. The Flapping-Wing System
2.2.2. Low-Air-Density Condition
2.2.3. Low-Gravity Condition
2.2.4. Verification of the Stand
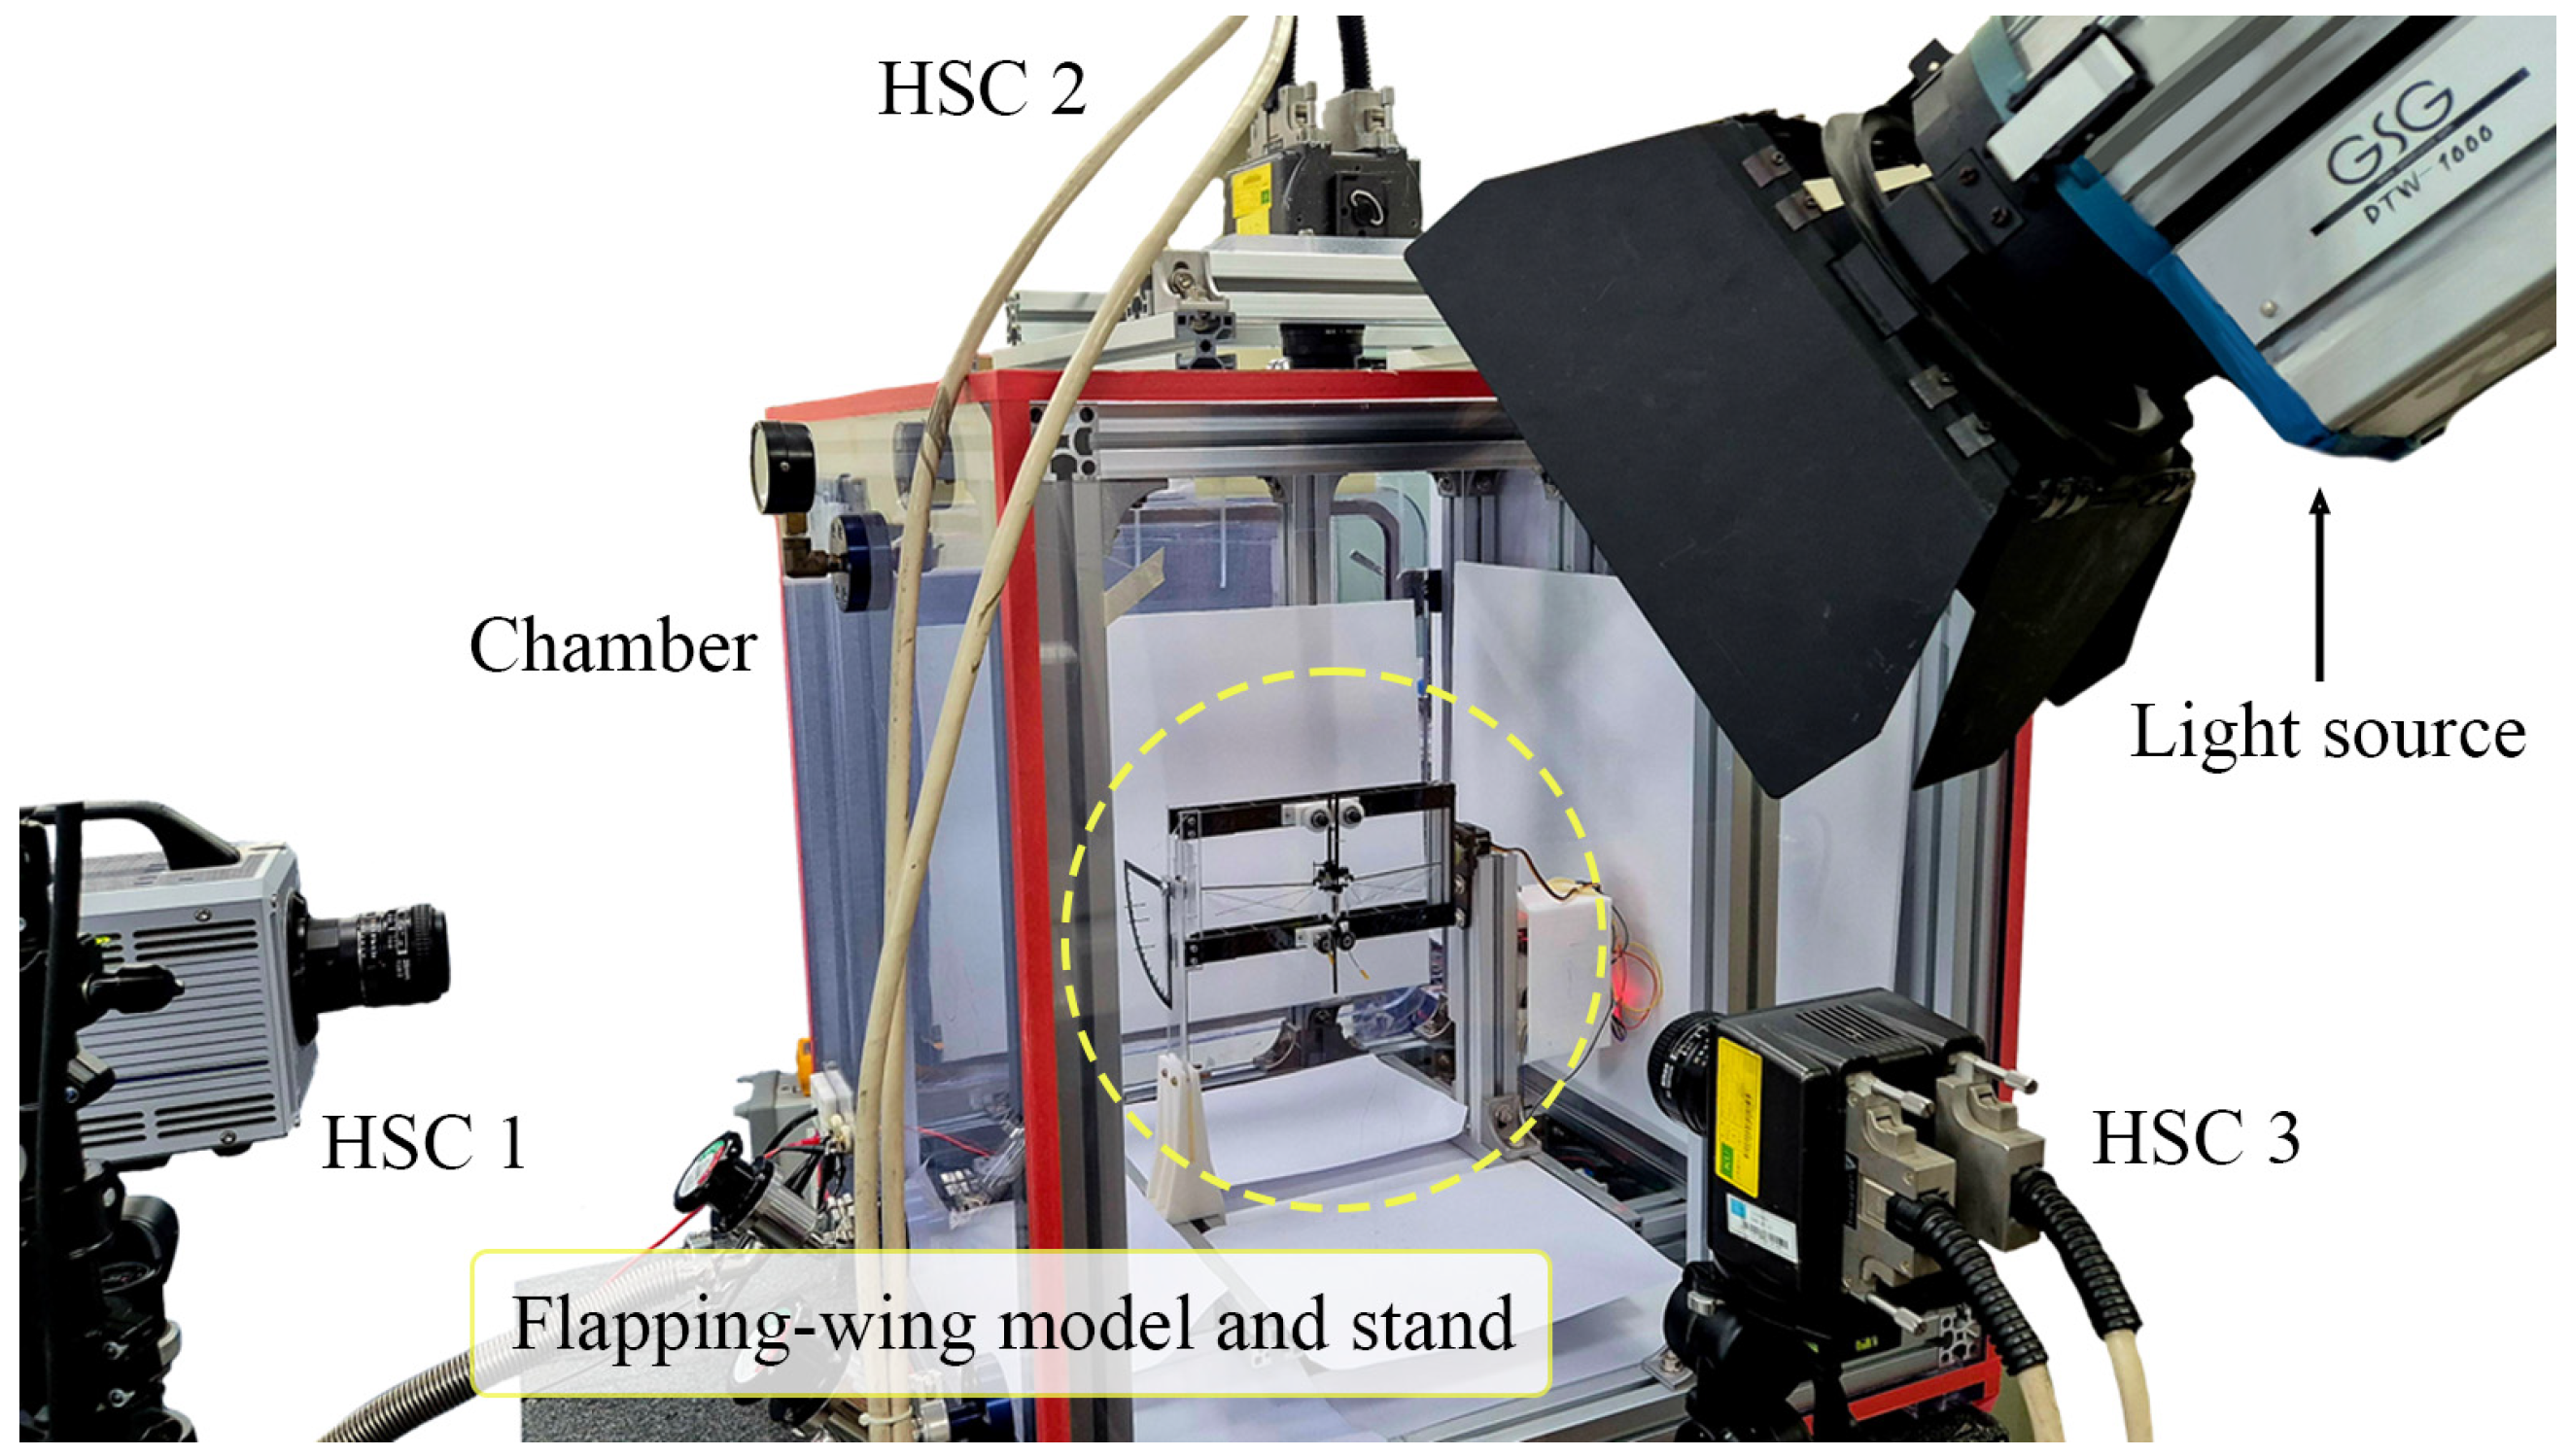
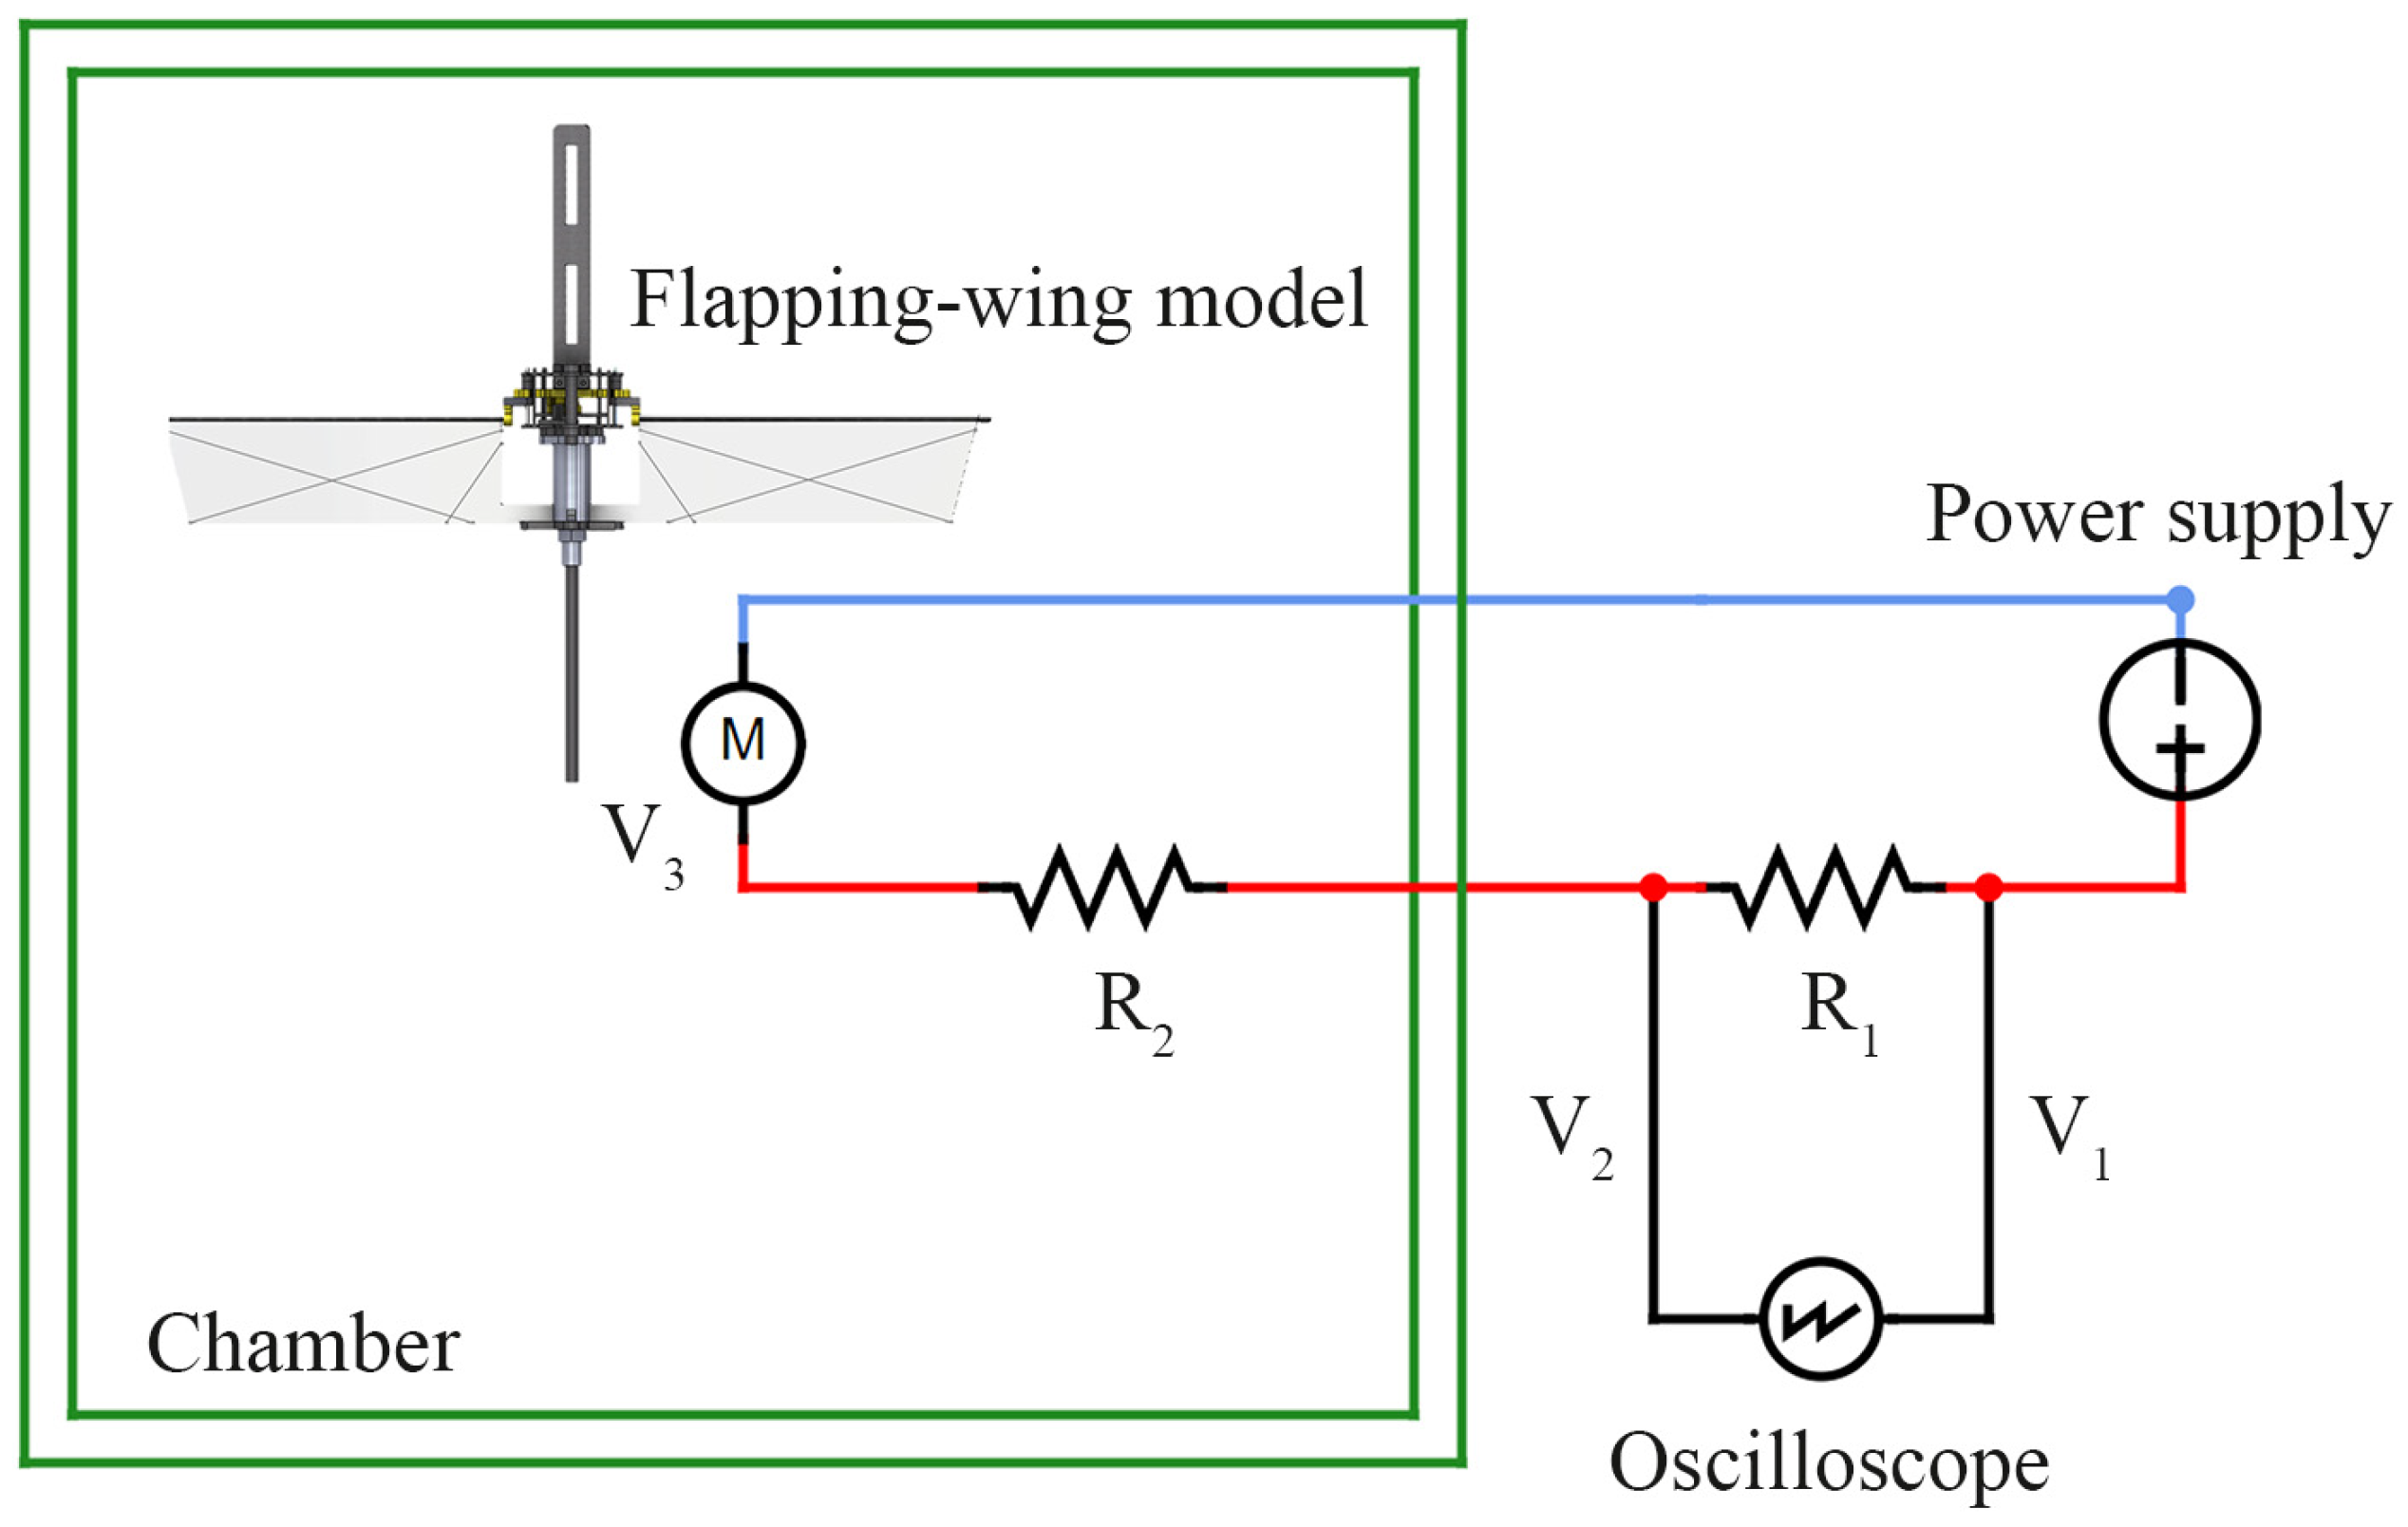
2.2.5. Experiment Setup
3. Results
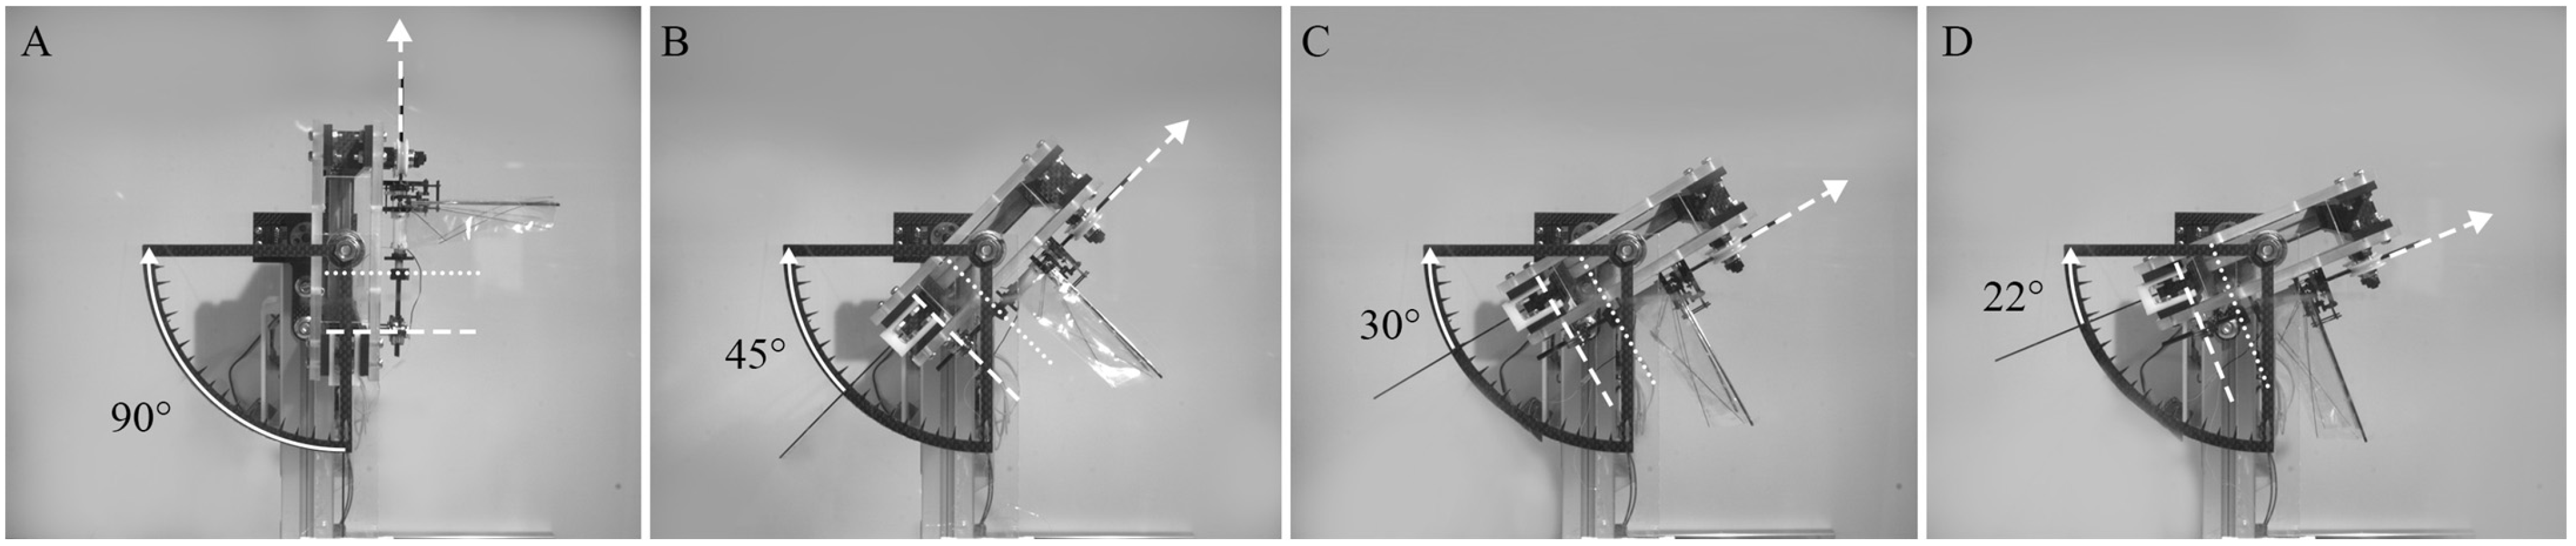
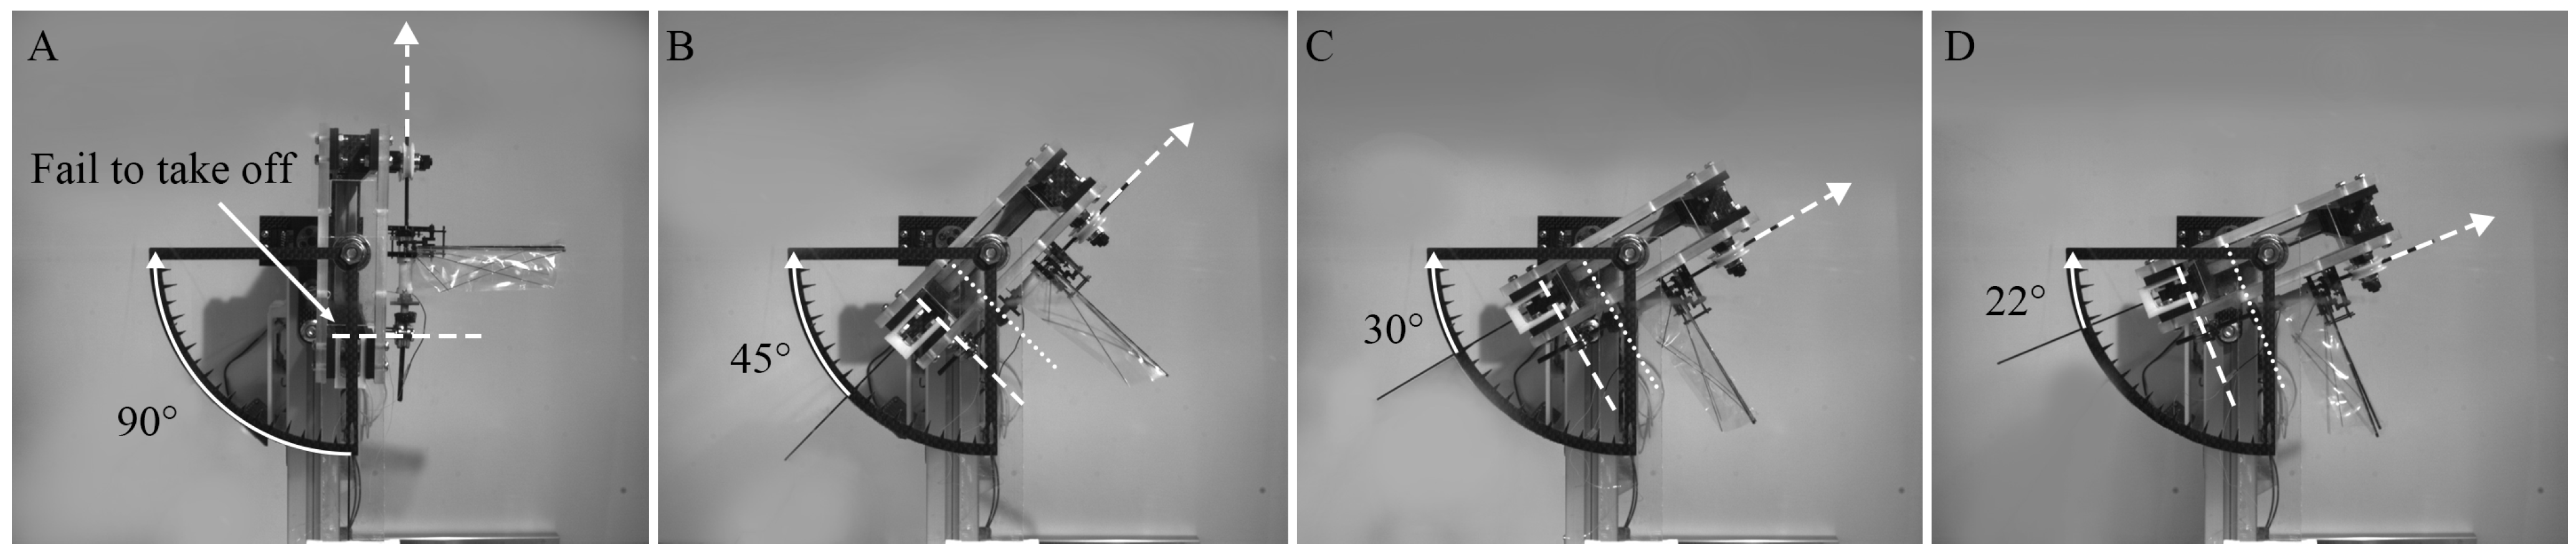
3.1. Hovering Test
3.2. Measured Flapping Frequency
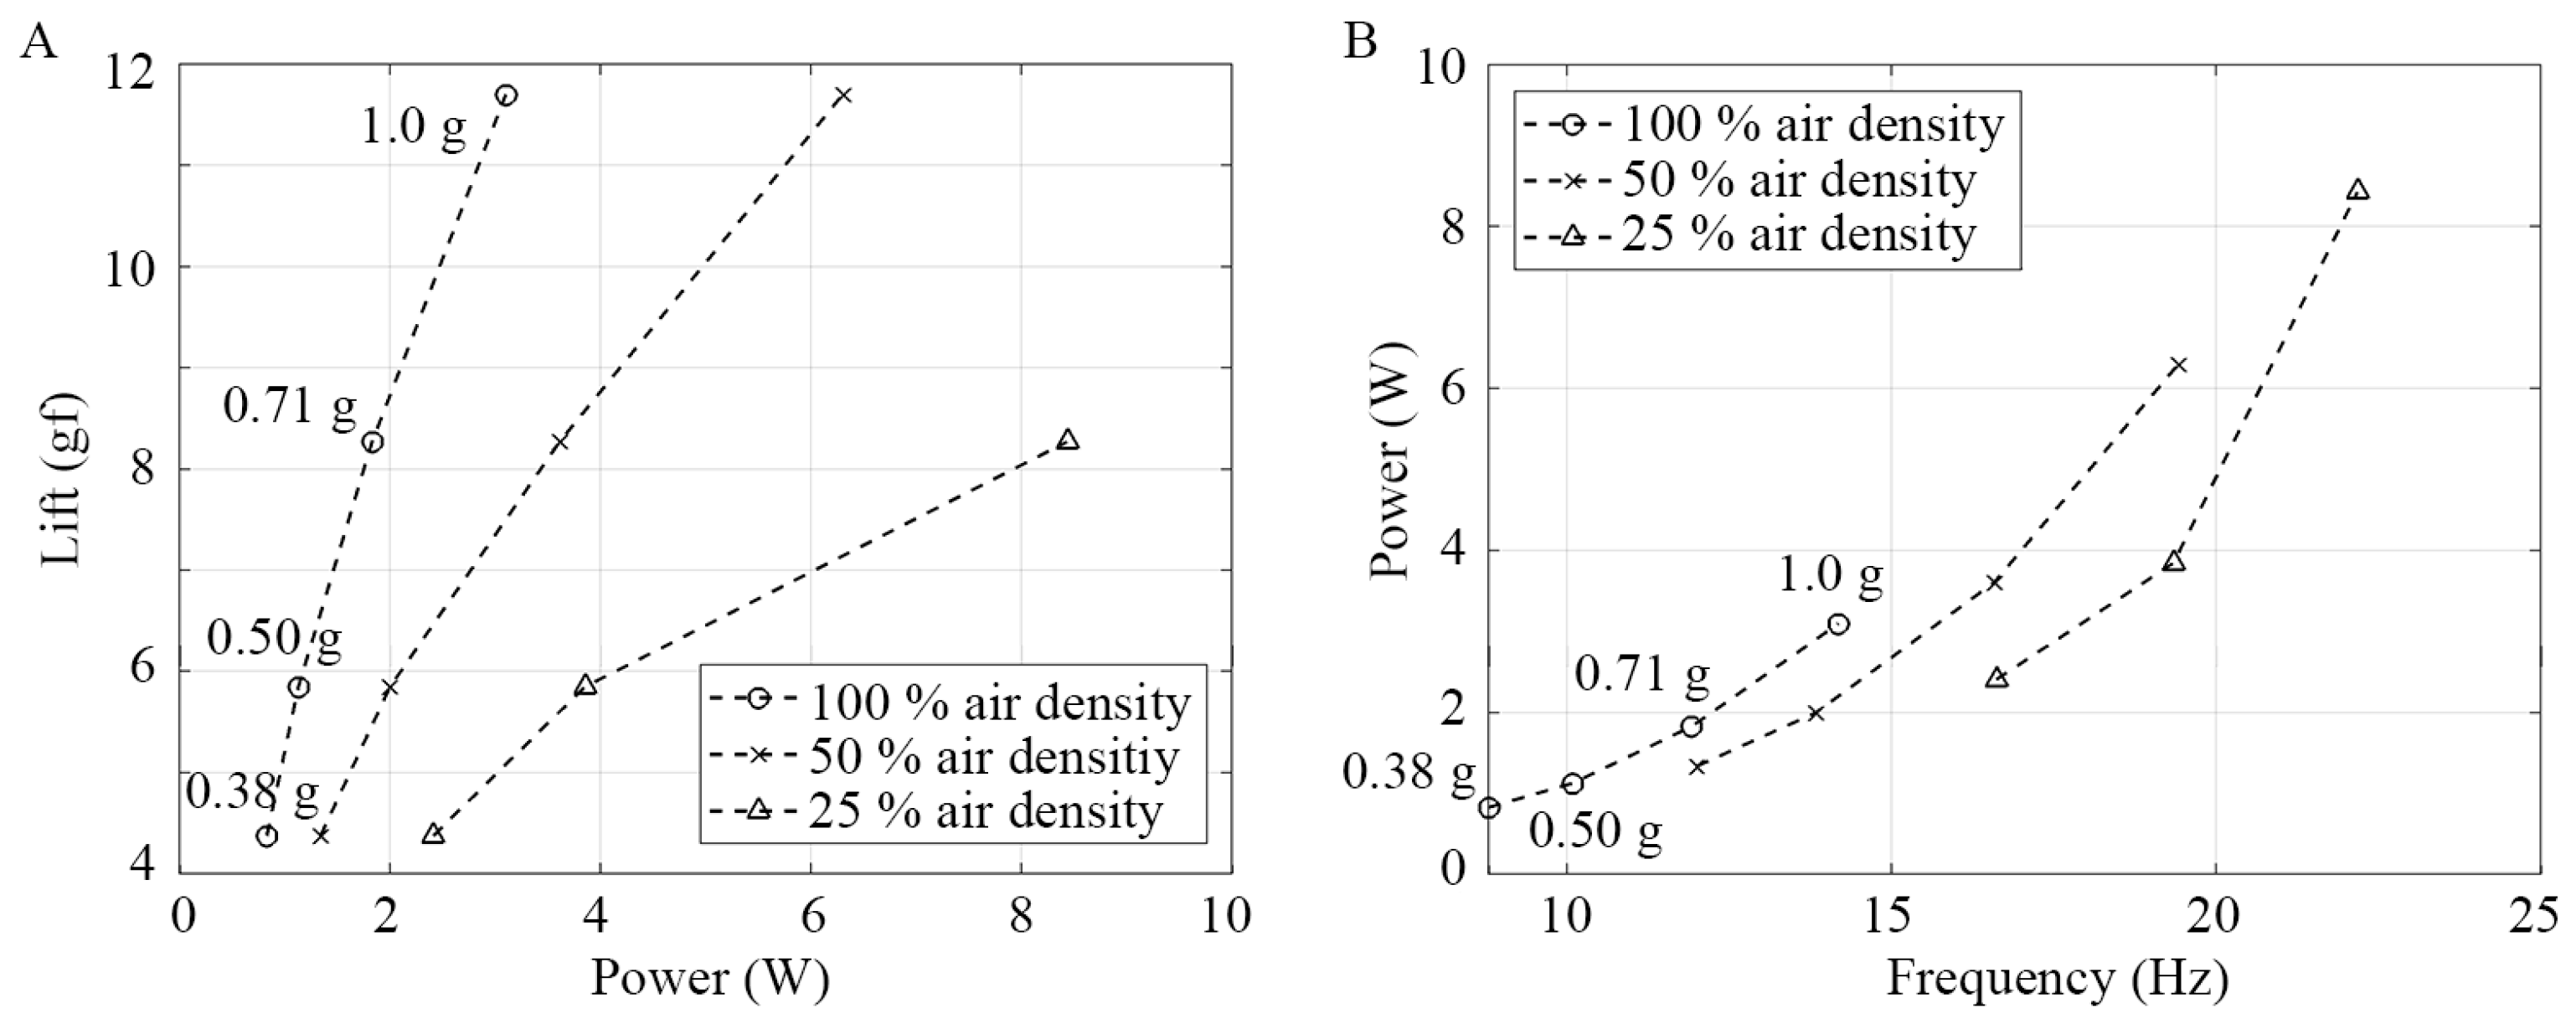
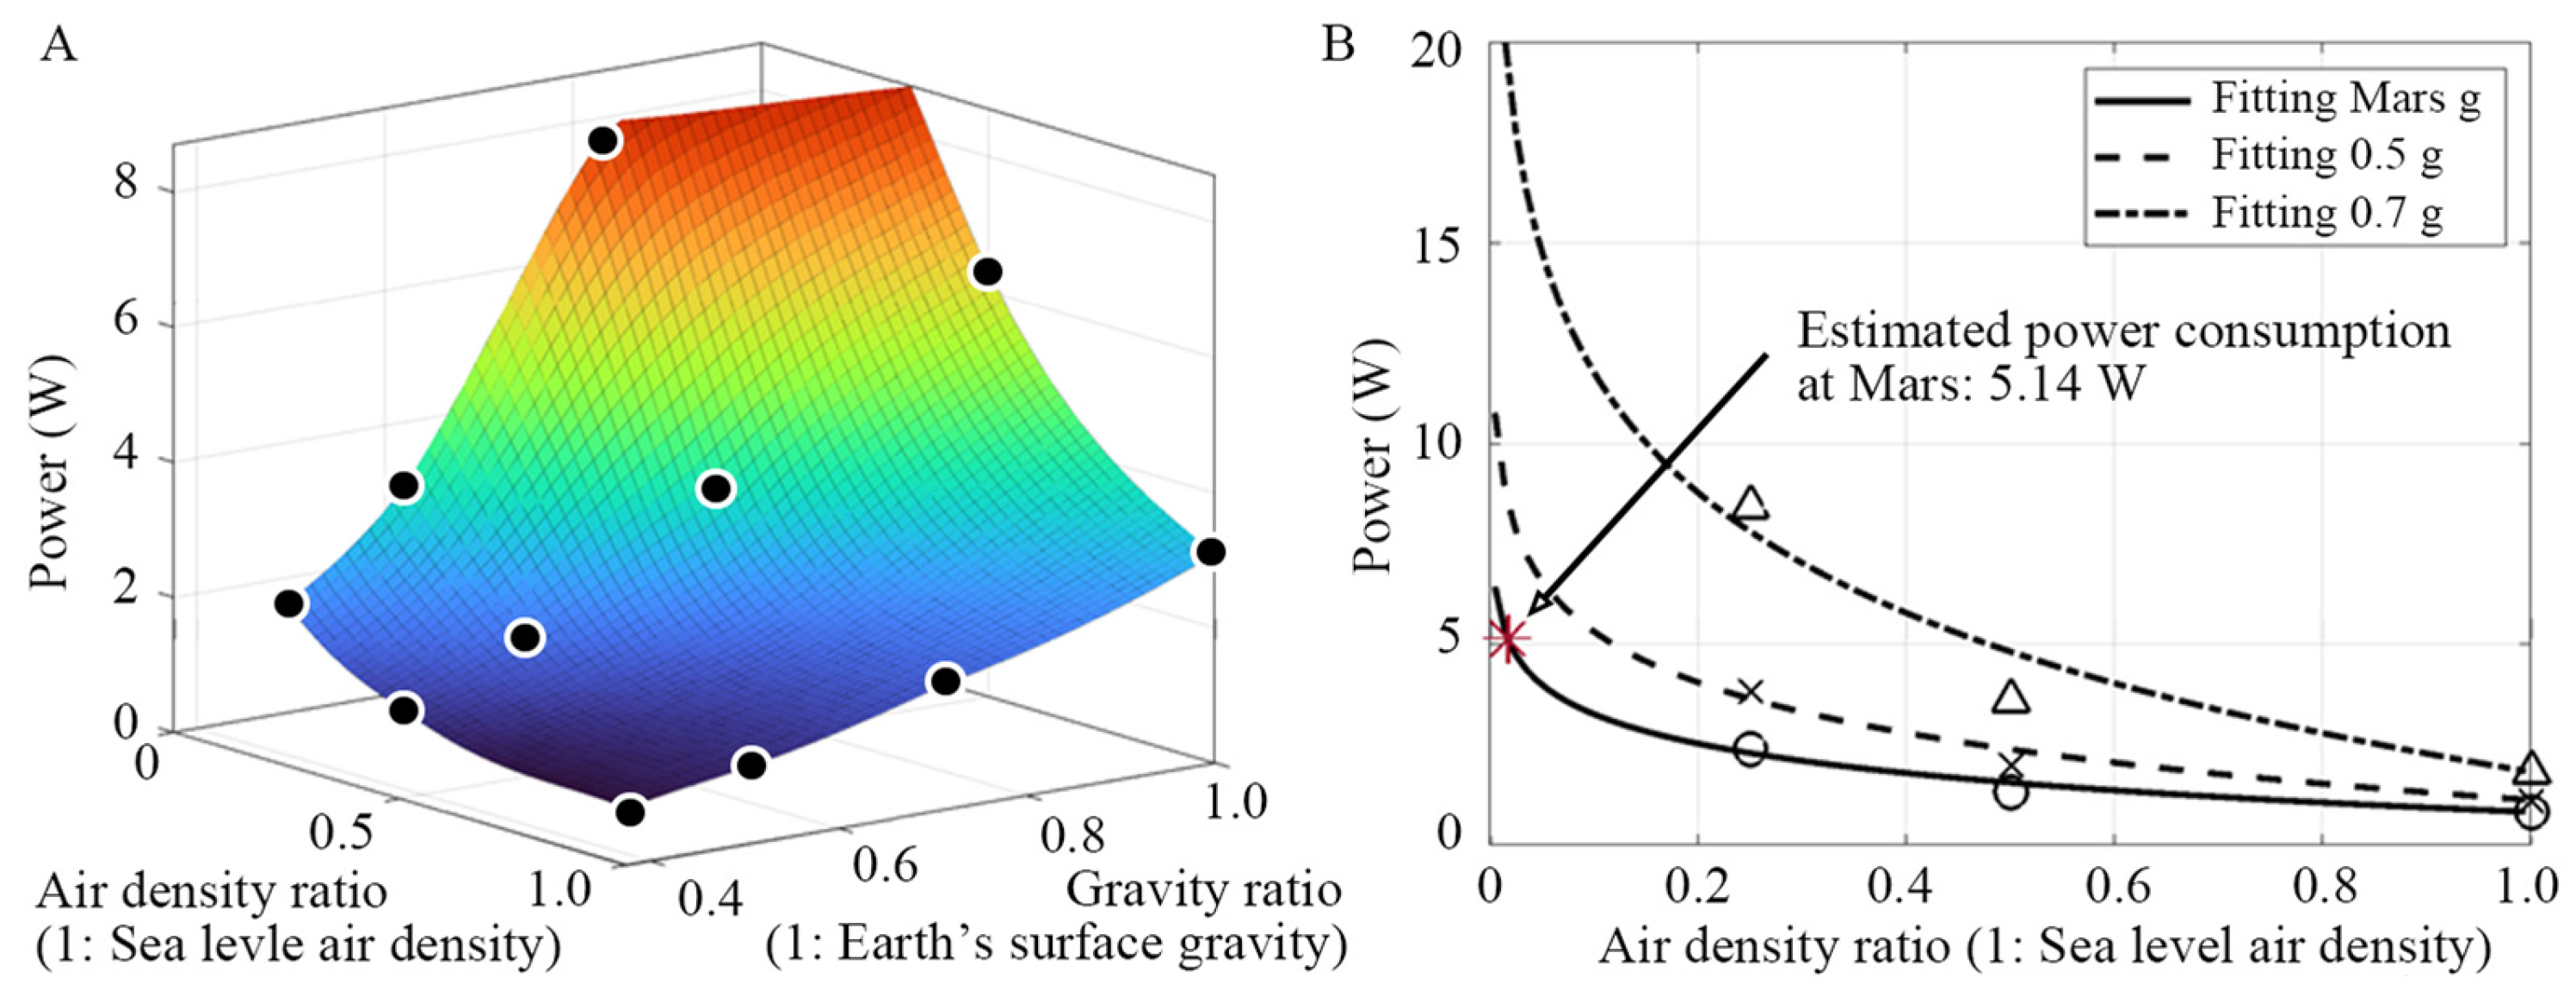
3.3. Power Consumption
4. Discussion
5. Conclusions and Future Work
Supplementary Materials
Author Contributions
Funding
Institutional Review Board Statement
Data Availability Statement
Conflicts of Interest
References
- Crouch, T.D. First Flight: The Wright Brothers and the Invention of the Airplane; Government Printing Office: Washington, DC, USA, 2002; ISBN 9780912627717.
- Petrosyan, A.; Galperin, B.; Larsen, S.E.; Lewis, S.R.; Määttänen, A.; Read, P.L.; Renno, N.; Rogberg, L.P.H.T.; Savijärvi, H.; Siili, T.; et al. The Martian Atmospheric Boundary Layer. Rev. Geophys. 2011, 49, RG3005. [Google Scholar] [CrossRef]
- Ingenuity Mars Helicopter Landing Press Kit. Available online: https://www.jpl.nasa.gov/news/press_kits/ingenuity/landing/quick_facts/ (accessed on 5 November 2024).
- Ingenuity Mars Helicopter. Available online: https://science.nasa.gov/mission/mars-2020-perseverance/ingenuity-mars-helicopter/#Overview,%20(n.d.) (accessed on 5 November 2024).
- Jestin, T. Why Titan Is the Best Place for Humans in the Solar System beyond Earth. Available online: https://www.spacetechasia.com/why-titan-is-the-best-place-for-humans-in-the-solar-system-beyond-earth/ (accessed on 5 November 2024).
- Fulchignoni, M.; Ferri, F.; Angrilli, F.; Ball, A.J.; Bar-Nun, A.; Barucci, M.A.; Bettanini, C.; Bianchini, G.; Borucki, W.; Colombatti, G.; et al. In Situ Measurements of the Physical Characteristics of Titan’s Environment. Nature 2005, 438, 785–791. [Google Scholar] [CrossRef] [PubMed]
- Huygens Probe Gas Chromatograph Mass Spectrometer. Available online: https://attic.gsfc.nasa.gov/huygensgcms/Titan.htm (accessed on 5 November 2024).
- Titan: Facts. Available online: https://science.nasa.gov/saturn/moons/titan/facts/ (accessed on 5 November 2024).
- Dragonfly, NASA’s Mission to Saturn’s Moon Titan. Available online: https://www.planetary.org/space-missions/dragonfly (accessed on 5 November 2024).
- Balaram, B.; Canham, T.; Duncan, C.; Grip, H.F.; Johnson, W.; Maki, J.; Quon, A.; Stern, R.; Zhu, D. Mars Helicopter Technology Demonstrator. In Proceedings of the 2018 AIAA Atmospheric Flight Mechanics Conference, Kissimmee, FL, USA, 8–12 January 2018; American Institute of Aeronautics and Astronautics: Reston, VA, USA, 2018. [Google Scholar]
- Dull, C.; Wagner, L.; Young, L.; Johnson, W. Hover and Forward Flight Performance Modeling of the Ingenuity Mars Helicopter. In Proceedings of the Aeromechanics for Advanced Vertical Flight Technical Meeting, Transformative Vertical Flight 2022, San Jose, CA, USA, 30 December 2022. [Google Scholar]
- Dragonfly. Available online: https://nssdc.gsfc.nasa.gov/nmc/spacecraft/display.action?id=DRAGONFLY (accessed on 5 November 2024).
- Mannam, N.P.B.; Alam, M.M.; Krishnankutty, P. Review of Biomimetic Flexible Flapping Foil Propulsion Systems on Different Planetary Bodies. Results Eng. 2020, 8, 100183. [Google Scholar] [CrossRef]
- Zdunich, P.; Bilyk, D.; MacMaster, M.; Loewen, D.; DeLaurier, J.; Kornbluh, R.; Low, T.; Stanford, S.; Holeman, D. Development and Testing of the Mentor Flapping-Wing Micro Air Vehicle. J. Aircr. 2007, 44, 1701–1711. [Google Scholar] [CrossRef]
- Wood, R.J. Design, Fabrication, and Analysis of a 3DOF, 3cm Flapping-Wing MAV. In Proceedings of the 2007 IEEE/RSJ International Conference on Intelligent Robots and Systems, San Diego, CA, USA, 29 October–2 November 2007; IEEE: Piscataway, NJ, USA, 2007; pp. 1576–1581. [Google Scholar]
- Karásek, M.; Muijres, F.T.; De Wagter, C.; Remes, B.D.W.; de Croon, G.C.H.E. A Tailless Aerial Robotic Flapper Reveals That Flies Use Torque Coupling in Rapid Banked Turns. Science 2018, 361, 1089–1094. [Google Scholar] [CrossRef] [PubMed]
- Karásek, M.; Percin, M.; Cunis, T.; van Oudheusden, B.W.; De Wagter, C.; Remes, B.D.; de Croon, G.C. Accurate Position Control of a Flapping-Wing Robot Enabling Free-Flight Flow Visualisation in a Wind Tunnel. Int. J. Micro Air Veh. 2019, 11, 1756829319833683. [Google Scholar] [CrossRef]
- Guo, Q.; Wu, C.; Zhang, Y.; Cui, F.; Liu, W.; Wu, X.; Lu, J. Development of a Bio-Inspired Tailless FWMAV with High-Frequency Flapping Wings Trajectory Tracking Control. J. Bionic Eng. 2024, 21, 2145–2166. [Google Scholar] [CrossRef]
- Ma, K.Y.; Chirarattananon, P.; Fuller, S.B.; Wood, R.J. Controlled Flight of a Biologically Inspired, Insect-Scale Robot. Science 2013, 340, 603–607. [Google Scholar] [CrossRef] [PubMed]
- Lentink, D.; Jongerius, S.R.; Bradshaw, N.L. The Scalable Design of Flapping Micro-Air Vehicles Inspired by Insect Flight. In Flying Insects and Robots; Springer: Berlin/Heidelberg, Germany, 2009; pp. 185–205. [Google Scholar]
- Jafferis, N.T.; Helbling, E.F.; Karpelson, M.; Wood, R.J. Untethered Flight of an Insect-Sized Flapping-Wing Microscale Aerial Vehicle. Nature 2019, 570, 491–495. [Google Scholar] [CrossRef] [PubMed]
- Seddon, J.; Newman, S. Basic Helicopter Aerodynamics, 3rd ed.; John Wiley & Sons: Hoboken, NJ, USA, 2011; ISBN 978-1-119-97272-3. [Google Scholar]
- Kang, C.; Fahimi, F.; Griffin, R.; Landrum, B.D.; Mesmer, B.; Zhang, G.; Lee, T.; Aono, H. Marsbee-Swarm of Flapping Wing Flyers for Enhanced Mars Exploration, NASA Innovative Advanced Concepts (NIAC)-Phase I: Final Report; NASA Public Inquiries Office: Washington, DC, USA, 2019.
- Bluman, J.E.; Pohly, J.A.; Sridhar, M.K.; Kang, C.; Landrum, D.B.; Fahimi, F.; Aono, H. Achieving Bioinspired Flapping Wing Hovering Flight Solutions on Mars via Wing Scaling. Bioinspir. Biomim. 2018, 13, 046010. [Google Scholar] [CrossRef] [PubMed]
- Keennon, M.; Klingebiel, K.; Won, H. Development of the Nano Hummingbird: A Tailless Flapping Wing Micro Air Vehicle. In Proceedings of the 50th AIAA Aerospace Sciences Meeting Including the New Horizons Forum and Aerospace Exposition, Nashville, TN, USA, 9–12 January 2012; American Institute of Aeronautics and Astronautics: Reston, VA, USA, 2012. [Google Scholar]
- Nguyen, Q.V.; Chan, W.L. NUS-Roboticbird: A Mission Capable Tailless Flapping Wing Micro Air Vehicle. In Proceedings of the 14th International Conference on Intelligent Unmanned Systems, Jeju, Republic of Korea, 20–23 August 2018. [Google Scholar]
- Tu, Z.; Fei, F.; Deng, X. Untethered Flight of an At-Scale Dual-Motor Hummingbird Robot with Bio-Inspired Decoupled Wings. IEEE Robot. Autom. Lett. 2020, 5, 4194–4201. [Google Scholar] [CrossRef]
- Phan, H.V.; Park, H.C. Mechanisms of Collision Recovery in Flying Beetles and Flapping-Wing Robots. Science 2020, 370, 1214–1219. [Google Scholar] [CrossRef] [PubMed]
- Phan, H.V.; Park, H.C.; Floreano, D. Passive Wing Deployment and Retraction in Beetles and Flapping Microrobots. Nature 2024, 632, 1067–1072. [Google Scholar] [CrossRef] [PubMed]
- Phan, H.V.; Aurecianus, S.; Au, T.K.L.; Kang, T.; Park, H.C. Towards the Long-Endurance Flight of an Insect-Inspired, Tailless, Two-Winged, Flapping-Wing Flying Robot. IEEE Robot. Autom. Lett. 2020, 5, 5059–5066. [Google Scholar] [CrossRef]
- Phan, H.V.; Kang, T.; Park, H.C. Design and Stable Flight of a 21 g Insect-like Tailless Flapping Wing Micro Air Vehicle with Angular Rates Feedback Control. Bioinspir. Biomim. 2017, 12, 036006. [Google Scholar] [CrossRef] [PubMed]
- Ha, G.; Phan, H.V.; Pham, T.H.; Park, H.C. Design and Flight of the KUBeetle Equipped with a Flapping-Wing Mechanism Based on a Rack-Pinion Mechanism. In Proceedings of the 17th International Conference on Intelligent Unmanned Systems (ICIUS 2021), Ho Chi Minh City University of Technology, VNU-HCM, Ho Chi Minh City, Vietnam, 25–27 August 2021. [Google Scholar]
- Tsuchiya, S.; Aono, H.; Asai, K.; Nonomura, T.; Ozawa, Y.; Anyoji, M.; Ando, N.; Kang, C.; Pohly, J. First Lift-off and Flight Performance of a Tailless Flapping-Wing Aerial Robot in High-Altitude Environments. Sci. Rep. 2023, 13, 8995. [Google Scholar] [CrossRef] [PubMed]
- Ha, G.; Park, H.C. Aerodynamic and Dynamic Characteristics of Flapping Wings under Low Air Density. Acta Astronaut. 2024, 222, 692–704. [Google Scholar] [CrossRef]
- Grip, H.F.; Lam, J.; Bayard, D.S.; Conway, D.T.; Singh, G.; Brockers, R.; Delaune, J.H.; Matthies, L.H.; Malpica, C.; Brown, T.L.; et al. Flight Control System for NASA’s Mars Helicopter. In Proceedings of the AIAA Scitech 2019 Forum, San Diego, CA, USA, 7 January 2019; American Institute of Aeronautics and Astronautics: Reston, VA, USA, 2019. [Google Scholar]
- Anderson, J. Introduction to Flight, 8th ed.; McGraw-Hill Higher Education: New York, NY, USA, 2014; ISBN 978-0078027673. [Google Scholar]
- Wood, C.P.; Spreen, W.C. An Investigation of the Relation Among Some of the Statistics for Upper-Air Pressure, Temperature and Density. J. Appl. Meteorol. 1963, 2, 292–297. [Google Scholar] [CrossRef]
- Ávila, S.P.; Melo, C.; Berning, B.; Sá, N.; Quartau, R.; Rijsdijk, K.F.; Ramalho, R.S.; Cordeiro, R.; De Sá, N.C.; Pimentel, A.; et al. Towards a ‘Sea-Level Sensitive’ Dynamic Model: Impact of Island Ontogeny and Glacio-eustasy on Global Patterns of Marine Island Biogeography. Biol. Rev. 2019, 94, 1116–1142. [Google Scholar] [CrossRef] [PubMed]
- Tanner, P.E.; Overmeyer, A.D.; Jenkins, L.N.; Yao, C.S.; Bartram, S.M. Experimental Investigation of Rotorcraft Outwash in Ground Effect. In Proceedings of the AHS International Annual Forum & Technology Display, Virginia Beach, VA, USA, 5–7 May 2015. [Google Scholar]
- Bayliss, C.R.; Hardy, B.J. Transmission and Distribution Electrical Engineering, 4th ed.; Elsevier Ltd.: Amsterdam, The Netherlands, 2011; ISBN 978-0-08-096912-1. [Google Scholar]


| Lift (gf) | Frequency (Hz) | ||
|---|---|---|---|
| Prediction ) | Measurement (Load cell) | Tilting test (HSC) | Load cell (Signal) |
| 11.70 ) | 11.97 (+2.35%) (SD = 0.0449) | 14.21 | 14.16 (−0.35%) (SD = 0.0264) |
| 8.27 ) | 8.49 (+2.69%) (SD = 0.0410) | 11.95 | 11.98 (+0.25%) (SD = 0.0273) |
| 5.85 ) | 5.98 (+2.26%) (SD = 0.0595) | 10.07 | 10.08 (+0.10%) (SD = 0.0105) |
| 4.38 ) | 4.49 (+2.61%) (SD = 0.0282) | 8.77 | 8.72 (+0.57%) (SD = 0.0182) |
| Tilting Angle | Lift (gf) | Measured Freq. (Hz) | Predicted Freq. (Hz) | Difference (%) | Cycle-Average Lift Coefficient |
|---|---|---|---|---|---|
| 90° (1.00 g) | 11.70 | 14.21 | 14.21 (Ref.) | N/A | 1.022 (Ref.) |
| 45° (0.71 g) | 8.27 | 11.95 | 11.95 | +0.02 | 1.021 (+0.10) |
| 30° (0.50 g) | 5.85 | 10.07 | 10.05 | +0.25 | 1.027 (+0.49) |
| 22° (0.38 g) | 4.38 | 8.77 | 8.69 | +0.90 | 1.025 (+0.29) |
| Tilting Angle | Lift (gf) | Measured Freq. (Hz) | Predicted Freq. (Hz) | Difference (%) | Cycle-Average Lift Coefficient |
|---|---|---|---|---|---|
| 90° (1.00 g) | 11.70 | 19.57 | 20.09 | −2.59 | 1.034 (+1.17) |
| 45° (0.71 g) | 8.27 | 16.52 | 16.89 | −2.15 | 1.034 (+1.17) |
| 30° (0.50 g) | 5.85 | 13.87 | 14.21 | −2.36 | 1.039 (+1.66) |
| 22° (0.38 g) | 4.38 | 12.09 | 12.30 | −1.65 | 1.034 (+1.17) |
| Tilting Angle | Lift (gf) | Measured Freq. (Hz) | Predicted Freq. (Hz) | Difference (%) | Cycle-Average Lift Coefficient |
|---|---|---|---|---|---|
| 90° (1.00 g) | 11.70 | N/A | 28.41 | N/A | N/A |
| 45° (0.71 g) | 8.27 | 22.37 | 23.89 | −6.36 | 1.084 (+6.07) |
| 30° (0.50 g) | 5.85 | 19.23 | 20.09 | −4.27 | 1.081 (+5.77) |
| 22° (0.38 g) | 4.38 | 16.56 | 17.39 | −4.51 | 1.091 (+6.75) |
| Power (W) | Air Density Condition | ||
|---|---|---|---|
| Gravity condition | 100% | 50% | 25% |
| 90° (1.00 g) | 3.10 | 6.30 | N/A |
| 45° (0.71 g) | 1.83 (−41.0%) | 3.61 (−42.7%) | 8.43 |
| 30° (0.50 g) | 1.13 (−38.4%) | 2.00 (−44.5%) | 3.85 (−54.3%) |
| 22° (0.38 g) | 0.83 (−26.8%) | 1.34 (−33.1%) | 2.41 (−37.4%) |
Disclaimer/Publisher’s Note: The statements, opinions and data contained in all publications are solely those of the individual author(s) and contributor(s) and not of MDPI and/or the editor(s). MDPI and/or the editor(s) disclaim responsibility for any injury to people or property resulting from any ideas, methods, instructions or products referred to in the content. |
© 2025 by the authors. Licensee MDPI, Basel, Switzerland. This article is an open access article distributed under the terms and conditions of the Creative Commons Attribution (CC BY) license (https://creativecommons.org/licenses/by/4.0/).
Share and Cite
Lim, H.; Ha, G.; Park, H.C. Prediction and Measurement of Hovering Flapping Frequency Under Simulated Low-Air-Density and Low-Gravity Conditions. Biomimetics 2025, 10, 83. https://doi.org/10.3390/biomimetics10020083
Lim H, Ha G, Park HC. Prediction and Measurement of Hovering Flapping Frequency Under Simulated Low-Air-Density and Low-Gravity Conditions. Biomimetics. 2025; 10(2):83. https://doi.org/10.3390/biomimetics10020083
Chicago/Turabian StyleLim, Hyeonjun, Giheon Ha, and Hoon Cheol Park. 2025. "Prediction and Measurement of Hovering Flapping Frequency Under Simulated Low-Air-Density and Low-Gravity Conditions" Biomimetics 10, no. 2: 83. https://doi.org/10.3390/biomimetics10020083
APA StyleLim, H., Ha, G., & Park, H. C. (2025). Prediction and Measurement of Hovering Flapping Frequency Under Simulated Low-Air-Density and Low-Gravity Conditions. Biomimetics, 10(2), 83. https://doi.org/10.3390/biomimetics10020083