Article

The Marriage Behavior of the Greek Population from 1991 to 2021: A Study Through Gross Nuptiality Tables

by
Vasilis S. Gavalas
Department of Geography, University of the Aegean, 81100 Mytilene, Greece
Genealogy 2025, 9(2), 32; https://doi.org/10.3390/genealogy9020032
Submission received: 14 February 2025 / Revised: 17 March 2025 / Accepted: 20 March 2025 / Published: 24 March 2025

Abstract

:
One of the most refined tools that have been devised for the analysis of marriage behavior of a population is the nuptiality tables. There are two main categories of such tables: gross and net. The latter (net tables) are primarily used for the study of reproduction in natural fertility populations, while the former (gross tables) are more suitable for comparing nuptiality among several populations, as differences in net tables may be due to differences either in mortality or in nuptiality or to an unknown mixture of both. In what follows, gross, abridged, period nuptiality tables have been constructed for the single population of Greece for four time points: 1991, 2001, 2011, and 2021. A significant decline in nuptiality was observed during the thirty-year period, with the age pattern of marriage being different by sex. While spinsters nowadays (2021) are more likely to marry at old ages (especially at ages above 40) than ever in the past, this is not the case for bachelors anymore. For a bachelor in Greece, the probabilities of marrying are lower in every age group than ever in the last 30 years.

1. Introduction

Across many European countries, a notable decline in nuptiality has been observed in recent decades, reflecting significant shifts in social conditions. This trend is attributed to multiple factors, including increased individualization, the rise of cohabitation as a socially acceptable alternative to marriage, and greater female participation in higher education and the labor force (Lesthaeghe 2010; Billari and Kohler 2004). Economic uncertainties, particularly among young adults, have also contributed to delayed marriage and family formation. These changes have resulted in a diversification of family structures and a postponement of traditional life course transitions (Kreyenfeld et al. 2012).
Within this broader European context, Greece presents a compelling case study, due to the significant social, economic, and political transformations that occurred in the first decades of the 21st century. Notably, Greece experienced substantial economic fluctuations, including the severe financial crisis that began in the late 2000s, which had profound effects on social behaviors and decision making, potentially influencing marriage rates and age at marriage. The austerity measures and high unemployment rates likely contributed to a delay in marriage and family formation, mirroring trends observed in other economically stressed regions (Salamaliki 2017).
Marriage patterns have been studied thoroughly for Greece and its geographical regions during the 20th and the 21st centuries (Kontogiannis 2022a, 2022b; Rontos and Salvati 2020; Gavalas 2008, 2015, 2019; Gavalas and Raftakis 2024). However, studies of marriage patterns usually examine three variables of nuptiality: (1) The mean age at first marriage for each sex. (2) The age difference between spouses. (3) Permanent celibacy by sex. Coupled with anthropological studies, they can also refer to ways of household organization upon marriage (neo-locality, patri-locality, or matri-locality). Nevertheless, none of these studies explores the probability of marriage in each age group by sex, or the average number of years a single person is expected to remain a bachelor or spinster at a given age. These aspects of the marriage pattern can be studied only by constructing nuptiality tables, that is, tables that describe the marriage course of a (synthetic or real) birth cohort. Regardless of how meticulous an analysis based on nuptiality tables may seem, it is the only way to systematically analyze the marriage habits of a population and to understand the extent to which marriage rates and hence probabilities of marrying fluctuate over time. Comprehensive tables of this nature are absent from published sources pertaining to Greece in the 21st century.
This paper attempts to construct nuptiality tables for the single population of Greece from 1991 to 2021 by using census data. Then, the technical aspects of constructing nuptiality tables are laid out, focusing on the peculiarities of the Greek data and the practical challenges that these data pose.

Hypotheses

Based on the observed social and economic trends in Greece, and drawing upon established demographic theories, the following hypotheses were formulated:
Delayed Marriage with Diverging Gender Patterns:
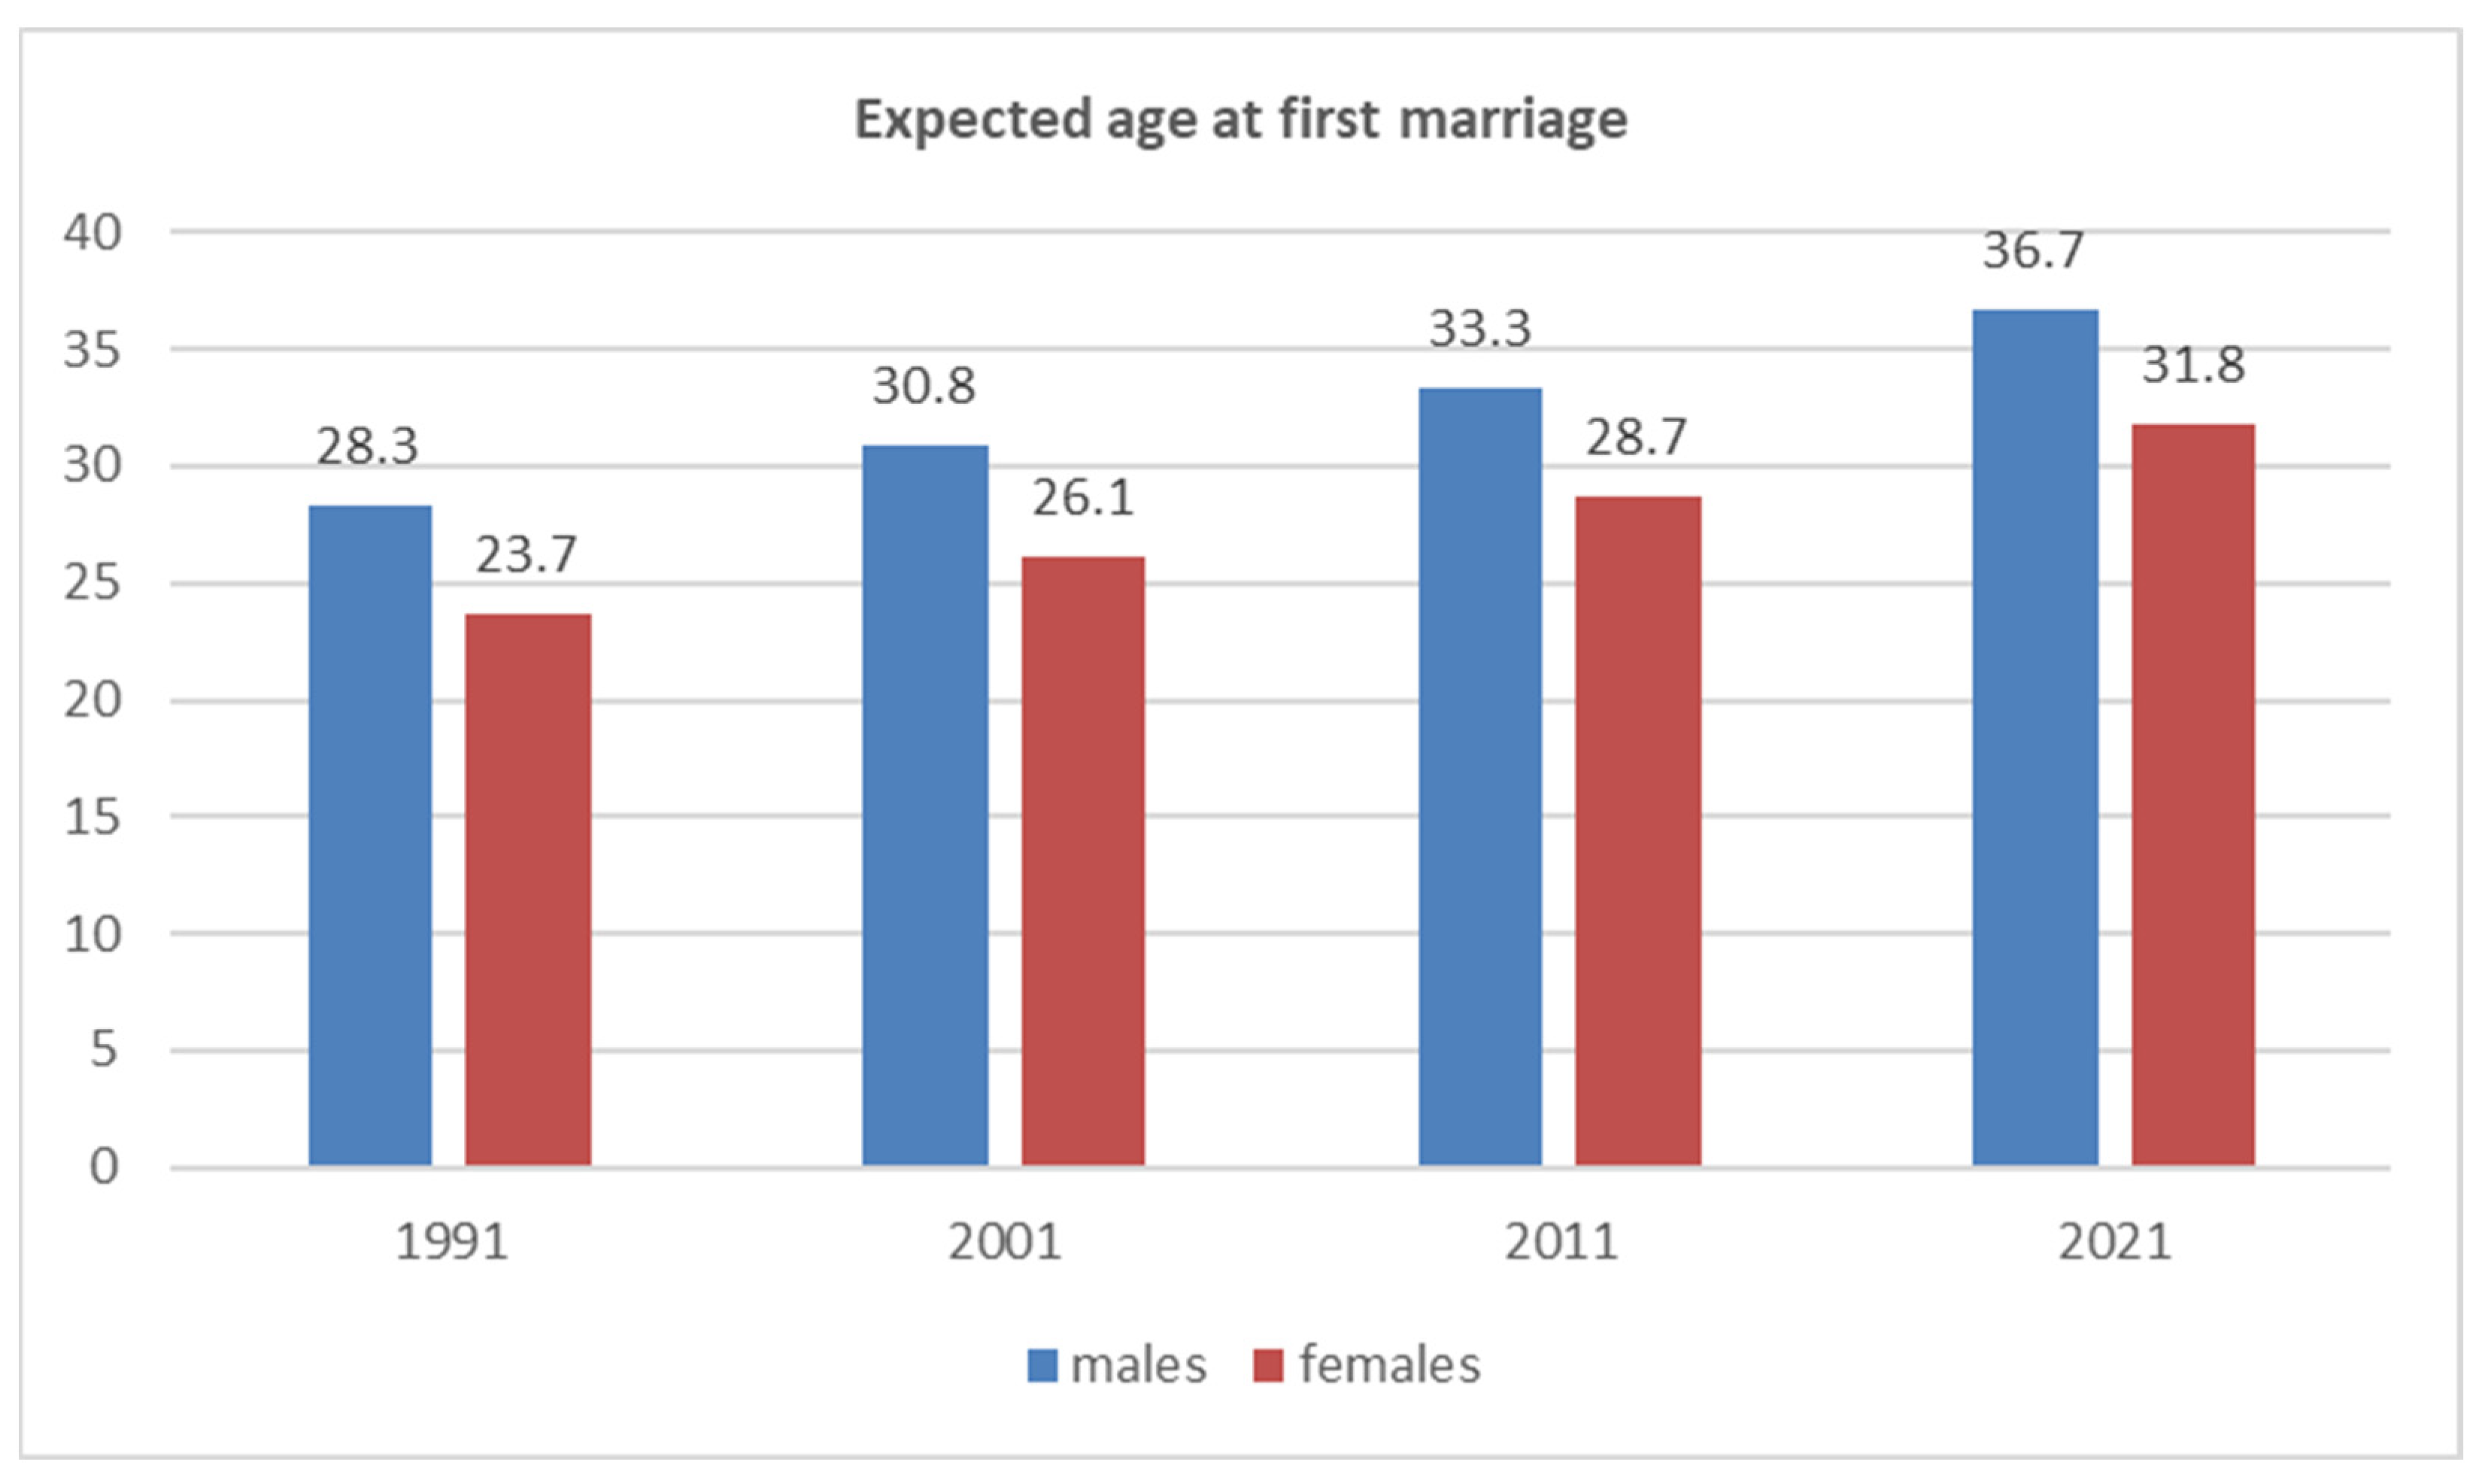
  • It is anticipated that age at first marriage has significantly increased for both sexes in Greece from 1991 to 2021, with a more pronounced delay observed among females. This hypothesis is based on the inspection of the Singulate Mean Age at Marriage (SMAM), as this was derived by census returns (Gavalas 2025).
Shift in Age-Specific Marriage Probabilities:
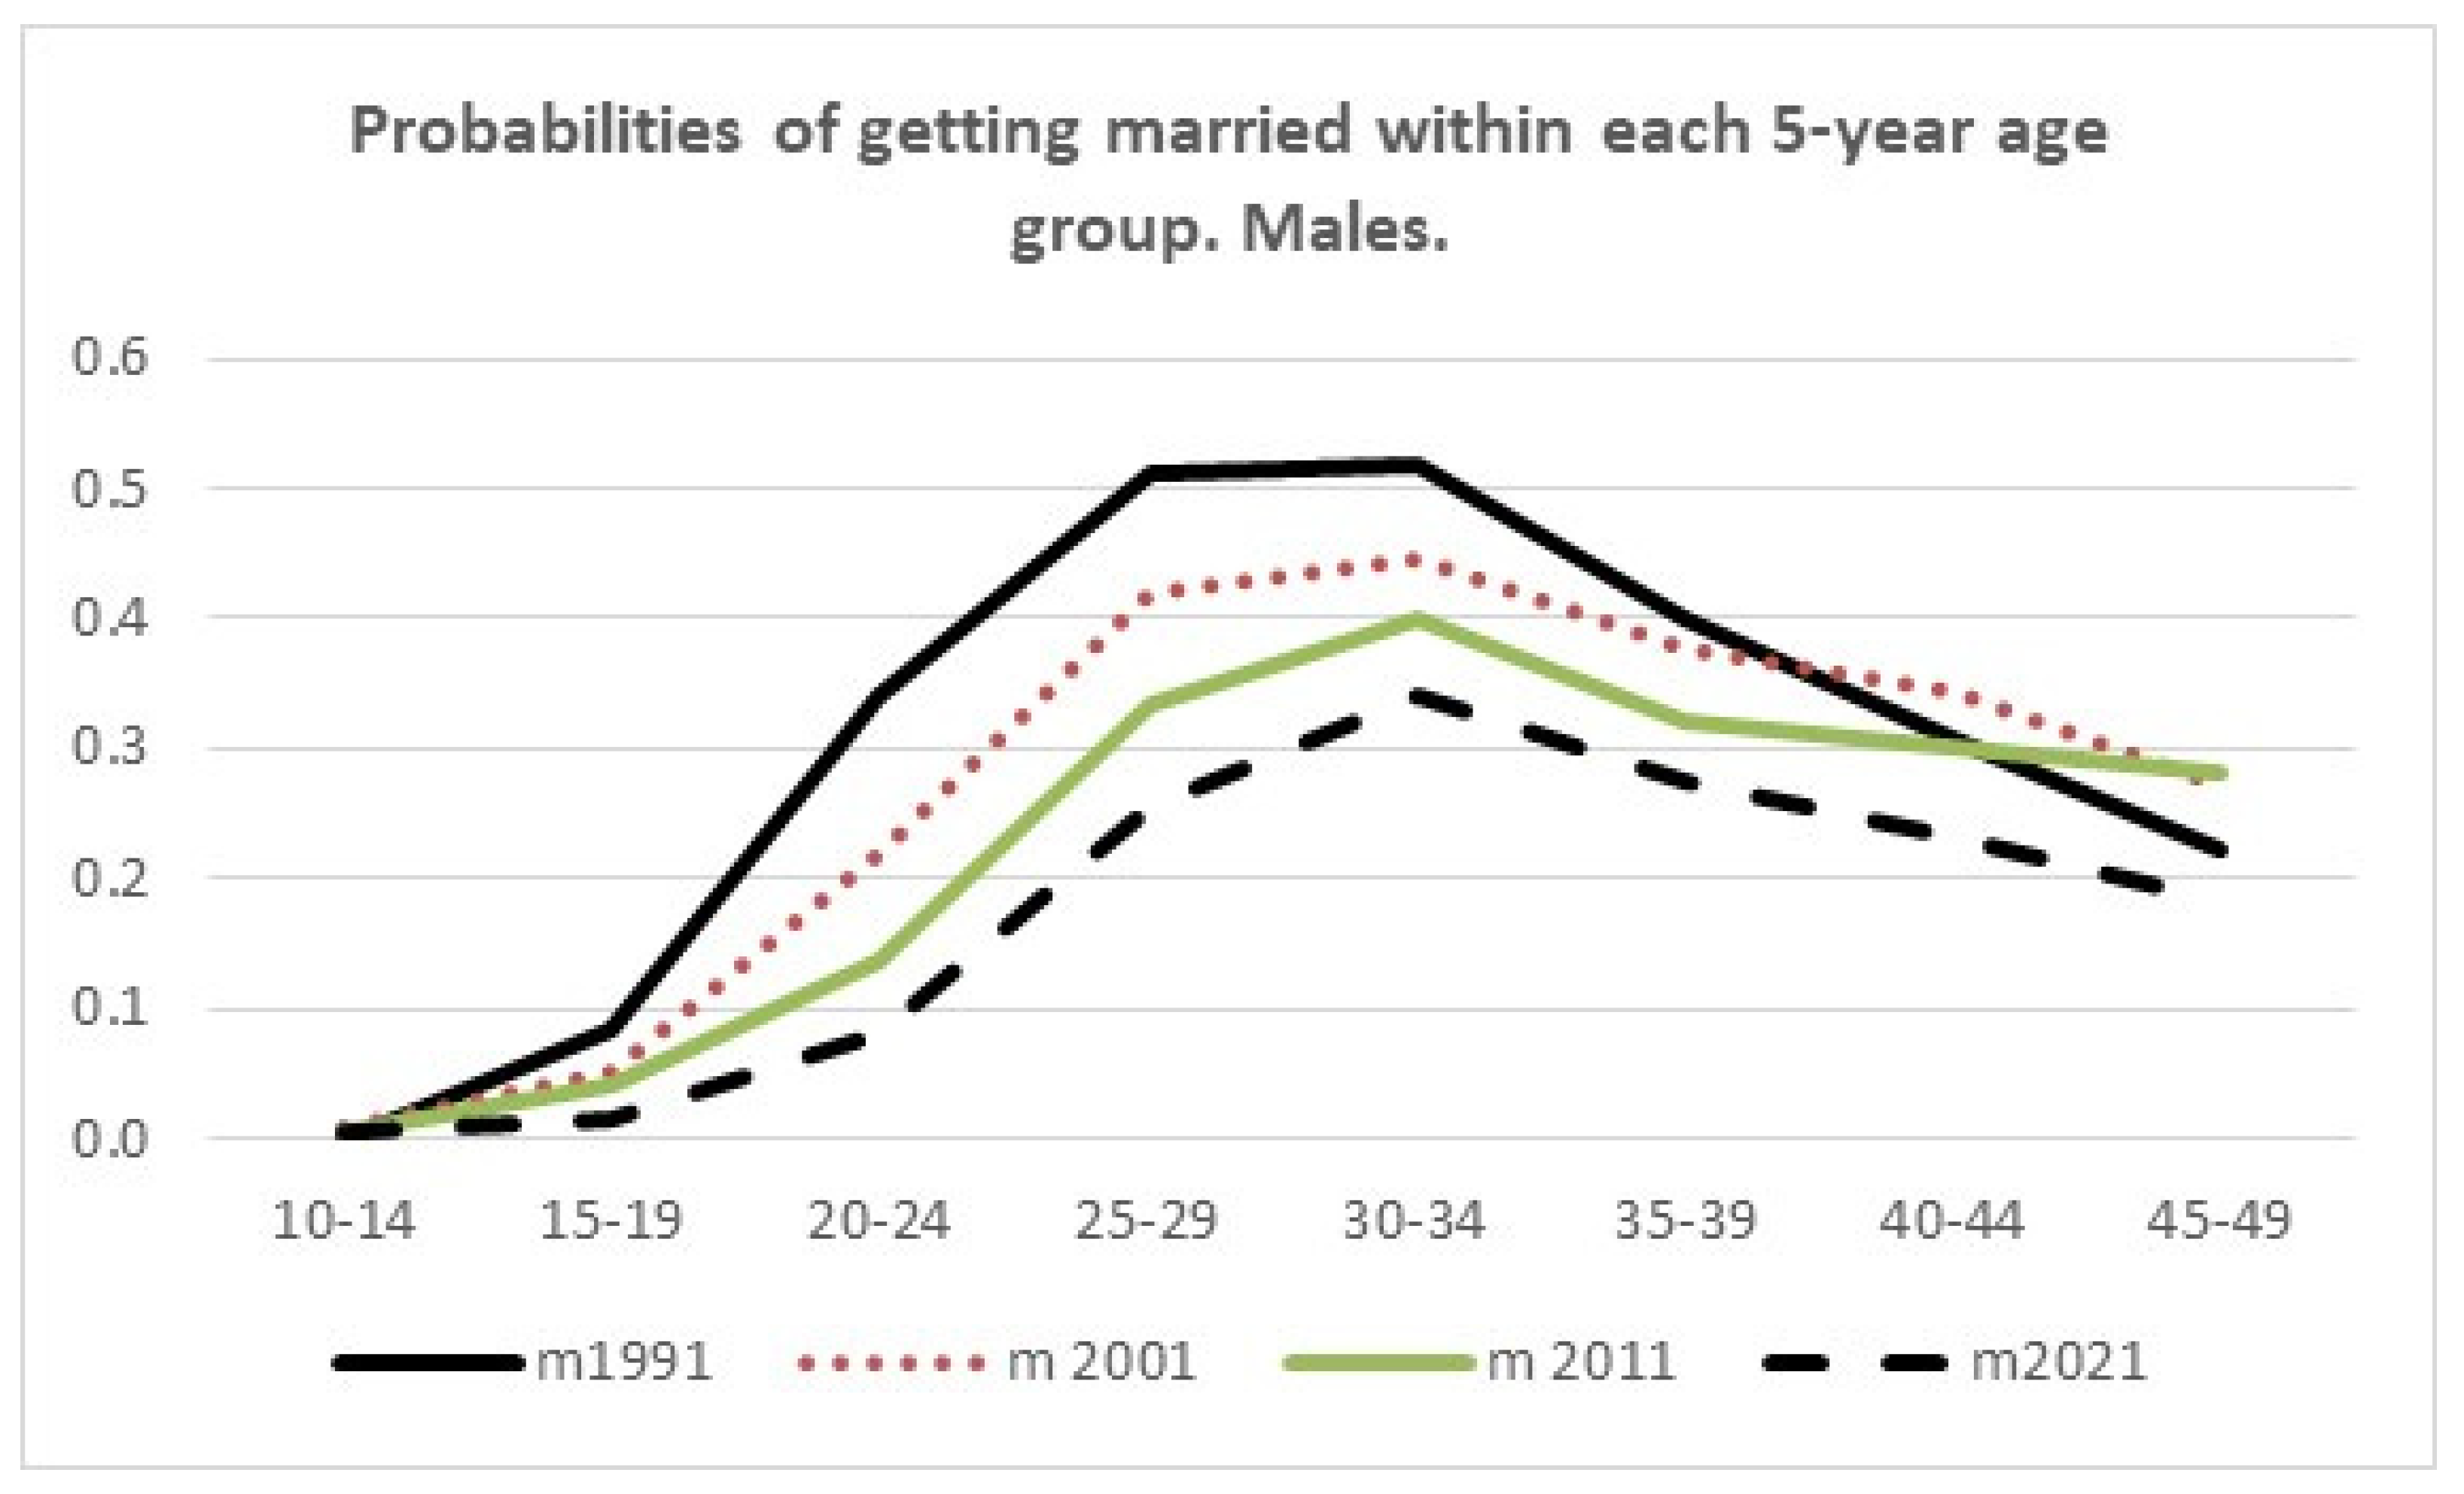
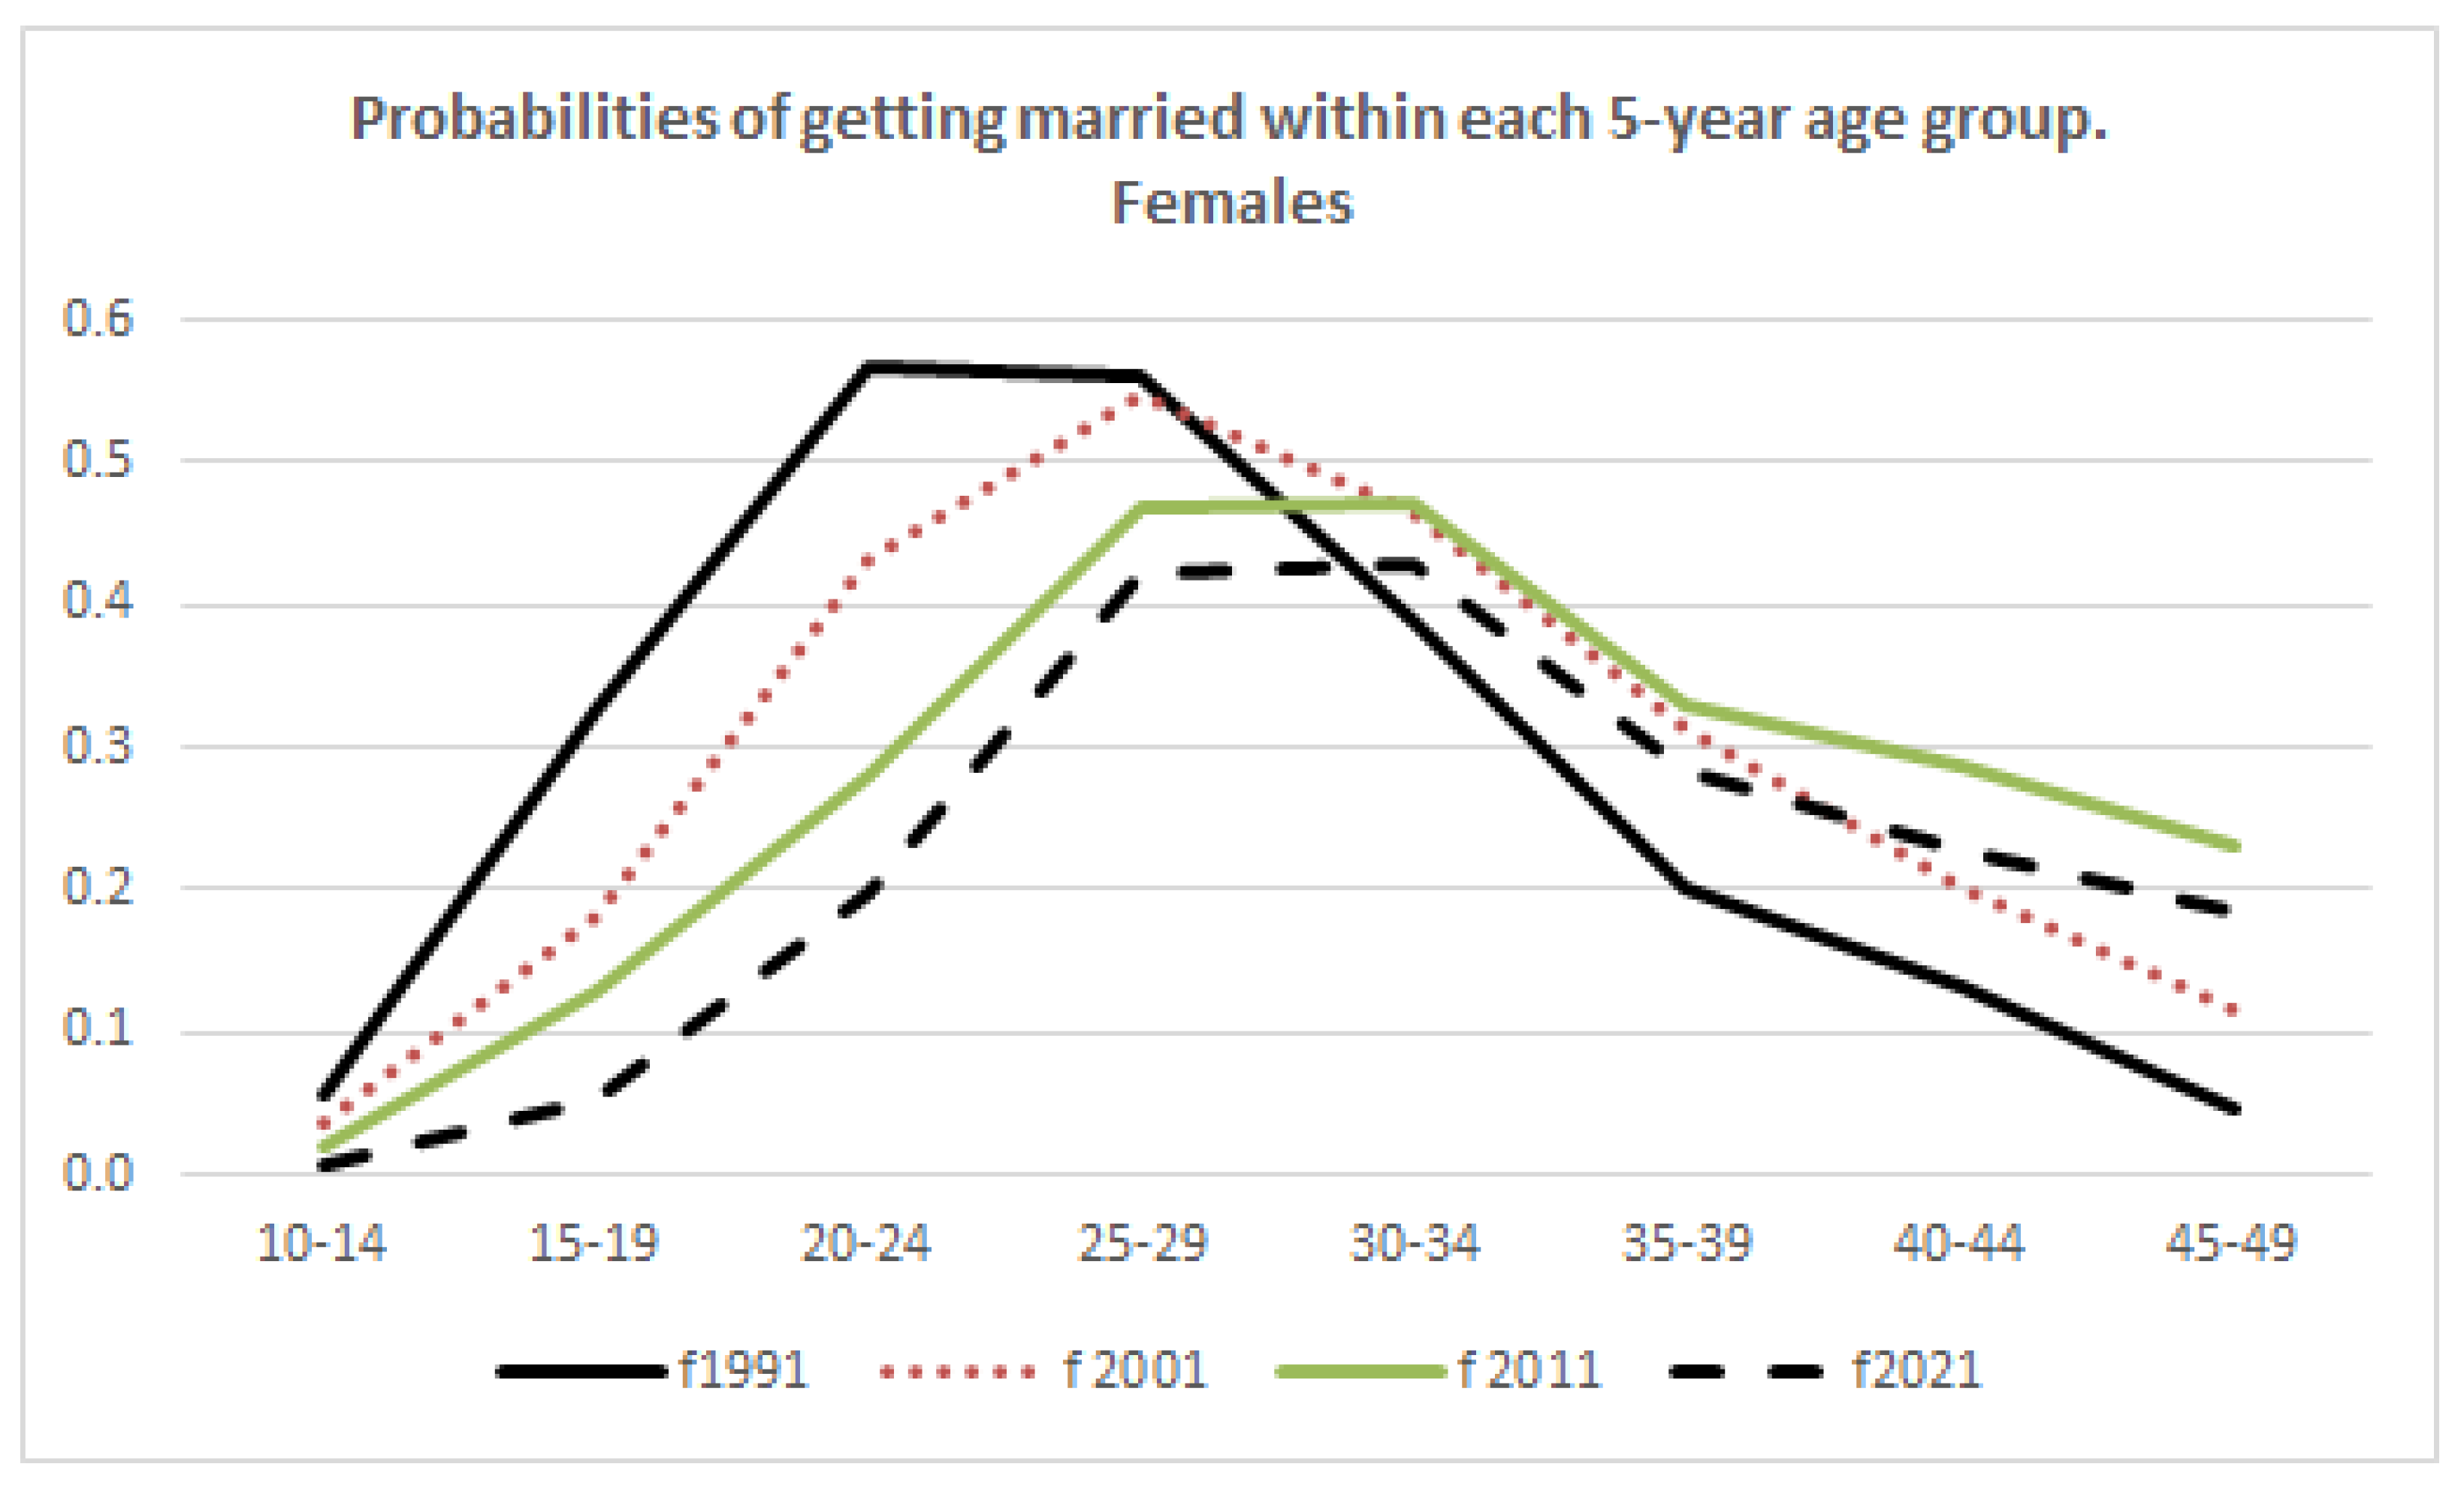
  • A notable shift in age-specific marriage probabilities is expected, with a decline in marriage rates at younger ages and an initial increase at older ages. Yet, it remains to be seen if this increased probability of marrying at older ages persisted from 1991 all the way to 2021 and whether this is true for both sexes.
Increased Permanent Celibacy with Gender Disparity:
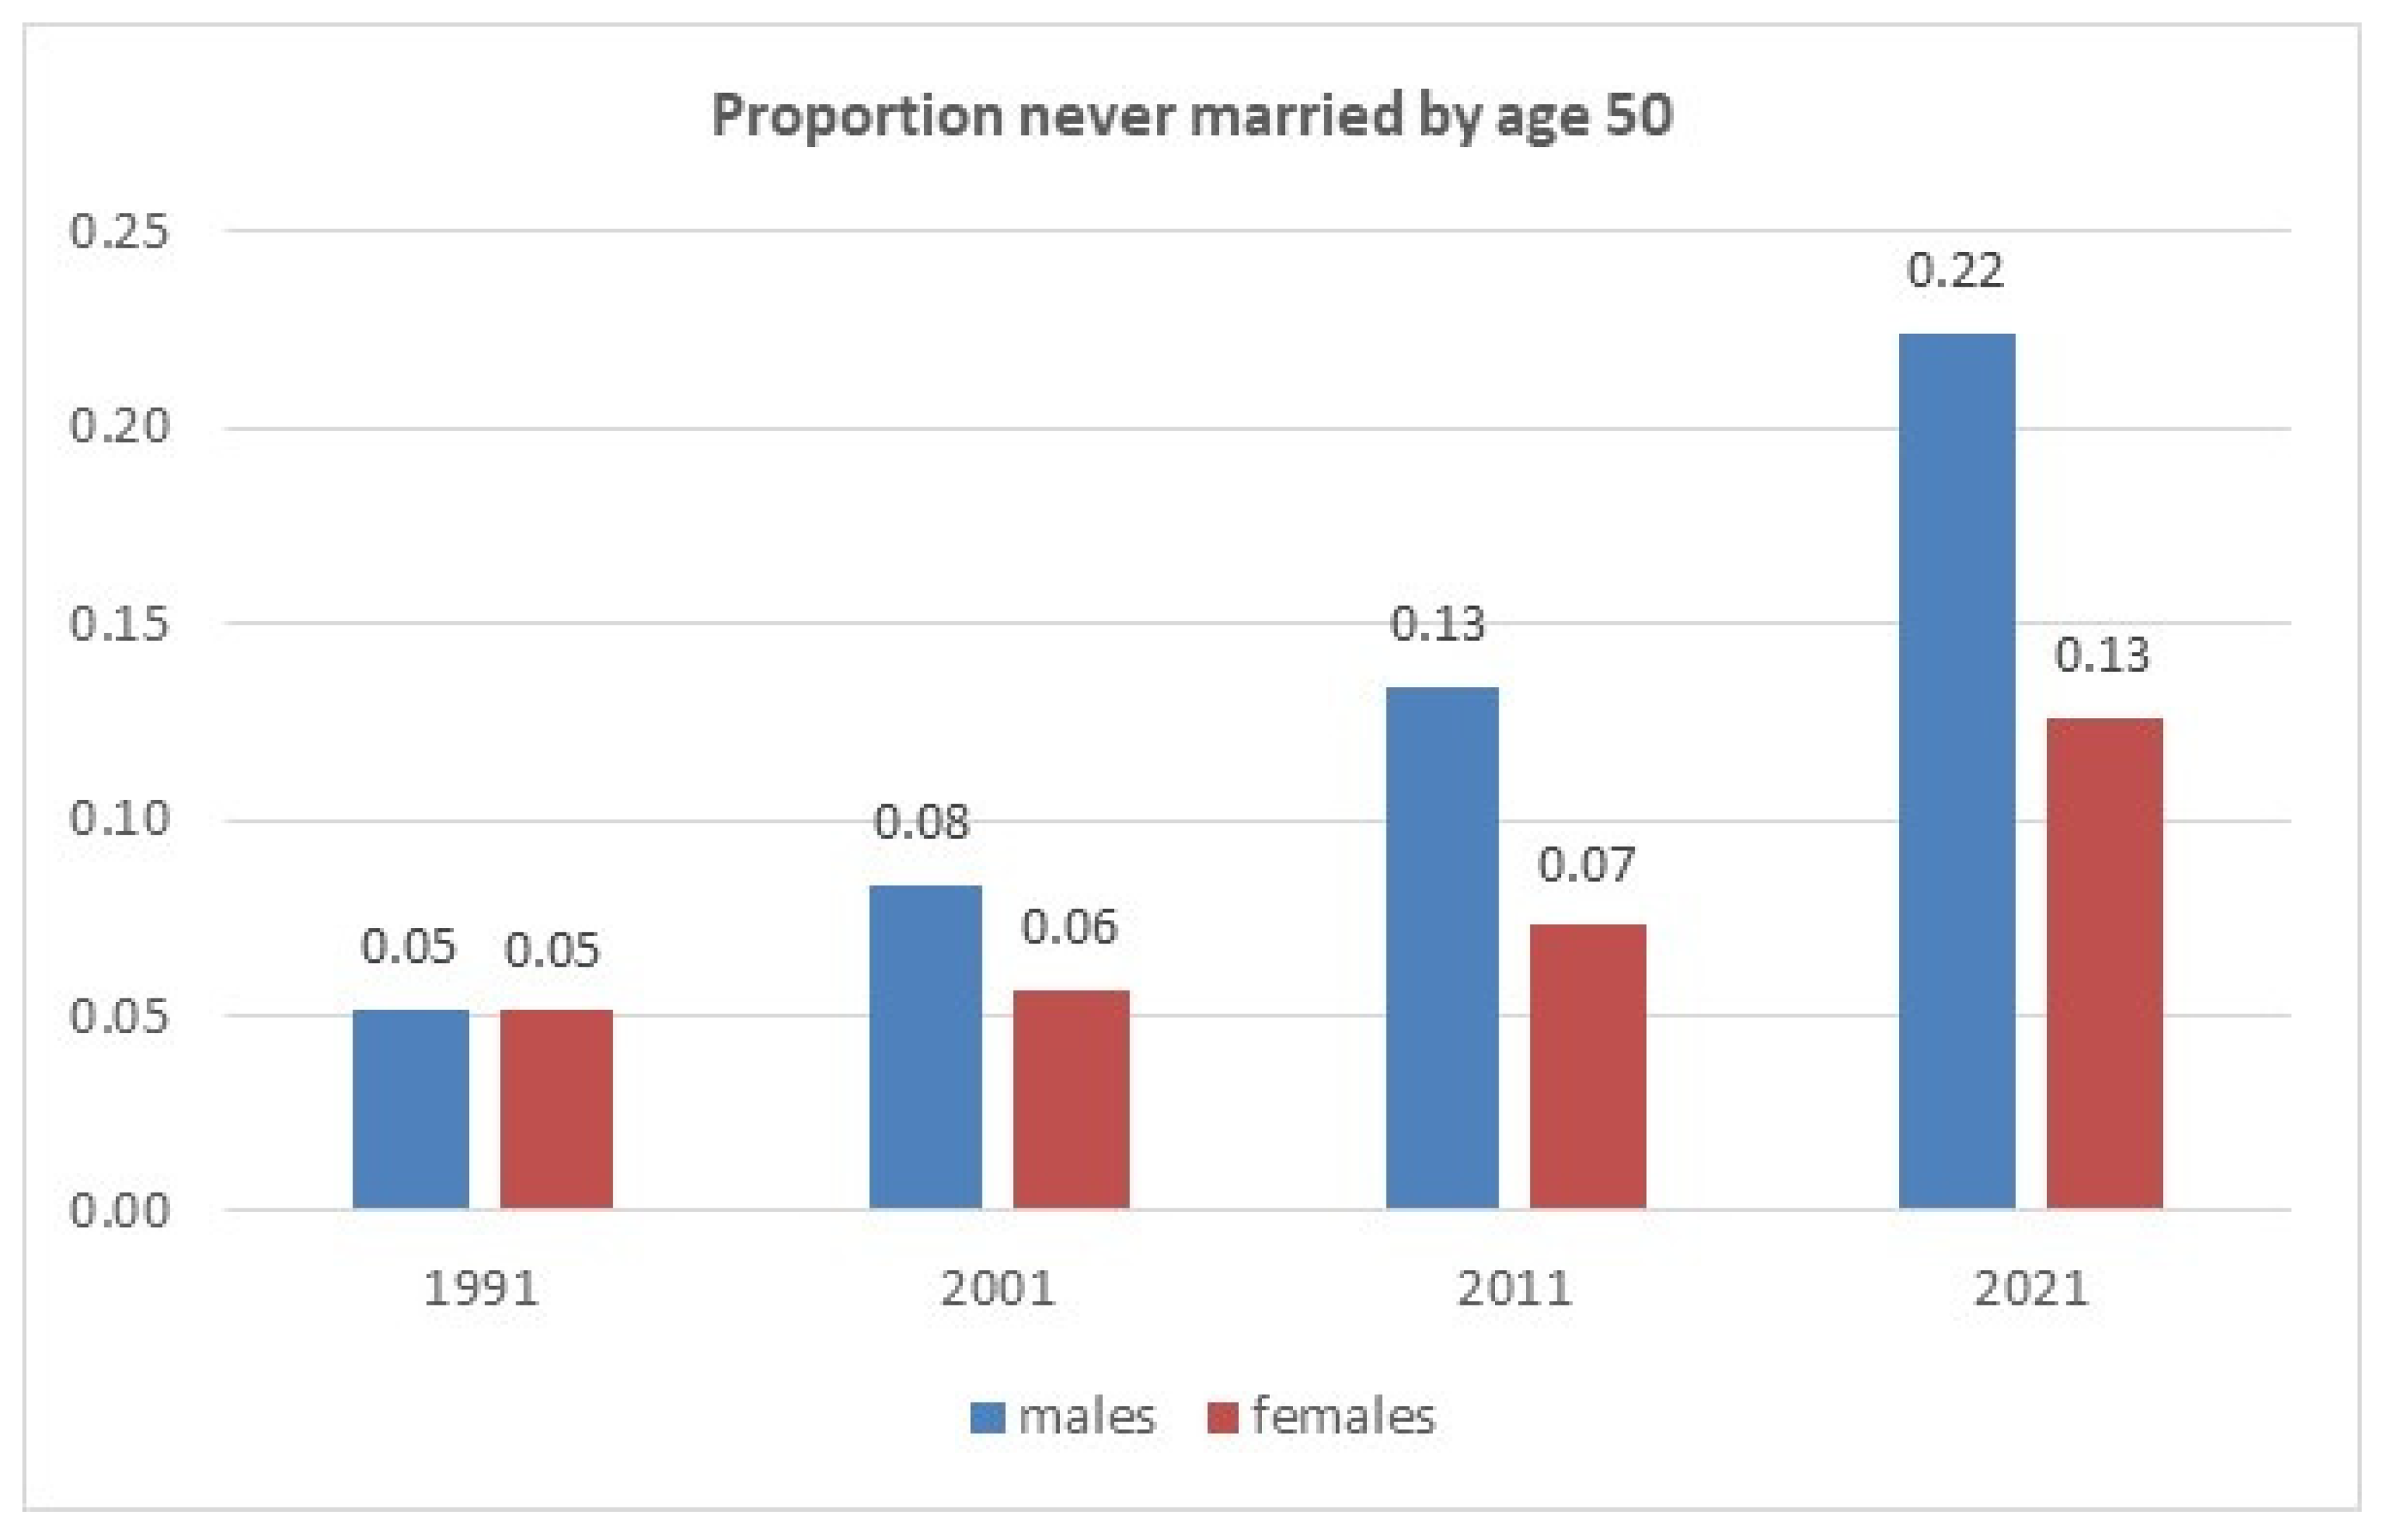
  • It is expected that the proportion of individuals remaining permanently single (never married by age 50) has significantly increased between 1991 and 2021, with a substantially higher increase observed among males compared to females. Analysis of census data regarding permanent celibacy supports this trend (Gavalas 2025).
Nuptiality tables: Methodological issues.
Nuptiality tables are classified into various categories according to the criteria we use to construct them.
Based on the year of reference, nuptiality tables are categorized into two categories:
(1)
Cohort tables;
(2)
Period tables.
Cohort tables are based on the age-specific nuptiality marriage rates of an actual birth cohort. They assume that the marriage history of a birth cohort has been recorded for every single member of this cohort, from the moment the member is born to life up to his/her death. Cohort nuptiality tables are suitable for longitudinal analysis and offer the most reliable way to study nuptiality. Their disadvantage is that all the members of a birth cohort should have completed their life cycle, and therefore these tables are more pertinent to the study of past generations.
Period nuptiality tables describe the marriage history of a fictional (synthetic) birth cohort and are based on marriage rates of a period (usually one year), which are calculated as the number of marriages of an age group over the population of this specific age group. Since data refer to a single year (or period), the demographer ends up calculating marriage rates of different birth cohorts that got married the same year (or period). Hence, the marriage history does not refer to a real birth cohort, but to an imaginary cohort that is made up of many different birth cohorts (therefore, the term “synthetic” cohort). Period tables are not as accurate and trustworthy as the cohort tables, but it is the only way for us to observe the current and future trends in nuptiality, without having to wait for every member of a birth cohort to die.
Based on the age intervals that are used to construct the nuptiality table, another two categories are discerned:
(1)
Full tables;
(2)
Abridged tables.
A full nuptiality table shows data for every single year of age. An abridged table sorts ages into wider intervals (usually 5-year age groups). Abridged tables are more common because census data, which are the base for the construction of nuptiality tables, are usually published in 5-year age groups.
Last, but not least, based on whether the nuptiality table incorporates mortality considerations, nuptiality tables are classified in the following:
(1)
Net tables;
(2)
Gross tables.
In net nuptiality tables, both marriage and death are decrements. In other words, net tables follow a birth cohort (either actual or synthetic) of, say, 10,0001 males or females throughout their life, and observe how this birth cohort of single persons is gradually decimated either due to marriage or due to death, or due to a combination of both. On the other hand, in gross nuptiality tables, the age-specific marriage rates are used to follow a cohort of bachelors or spinsters through life to show how, from one age to the next, their numbers are reduced. In this case, mortality rates are ignored. These gross nuptiality tables show the impact of primary nuptiality2 neutralizing the effect of mortality. They are the most adequate tools with which to study comparative nuptiality patterns among populations with differential mortality patterns.
This paper tries to explore nuptiality in Greece throughout a thirty-year period and to pinpoint current and future trends. Therefore, abridged, period (chronological), gross nuptiality tables are constructed.

2. Data and Methods

For the construction of nuptiality tables, the methodology and notation proposed by Papadakis and Tsimpos (2004) were followed. However, the aforementioned authors refer to the construction of full net nuptiality tables (that is, two-parameter decrement tables). For the construction of the gross nuptiality tables that are presented in Appendix A, the principle of a single decrement table was followed, as this was set out by Malaker (1973). Further consultation on technical details was derived from various demographic texts (Mertens 1965; Saveland and Glick 1969; Siampos 1993).
Census data
Population statistics, categorized by age, sex, and marital status, are required to construct a nuptiality table. The data used in this analysis were obtained from the Greek censuses of 1991, 2001, 2011, and 2021 (ELSTAT n.d.; ELSTAT 2024). The relevant notation is as follows:
  • nPx: Population (of each sex) from age x to age x + n.
  • nPCx: Single population (of one sex) from age x to age x + n.
Stationary population derived from census data
Cx: Single population at the start of age x.
nmx: Number of marriages at ages x to x + n.
nnx: Probability of a single person at age x to get married by the age x + n.
ex: Expected years of single life remaining at the start of age x (or average number of years living in the single state from those who are unmarried at age x).
nLx: Person-years in the single state between ages x and x + n.
Tx: Population in the single state from age x and above.
For those familiar with life table notation, it is obvious that nmx in a nuptiality table corresponds to ndx in the life table and nnx corresponds with nqx. Moreover, Cx corresponds to lx.
Basic functions
Cx: A power of 10 is set as a radix of the nuptiality table and it is assumed that, up to the age of ten, everyone is single. For the next ages, Cx is derived by multiplying the proportion of single persons in the actual population with the radix of the nuptiality table:
C x = P C n x P n x · 100,000
From this point onwards, the following functions are derived:
  • nmx = Cx − Cx+n
  • nnx = nmx/Cx
  • nLx = (n · Cx+n) + (nαx · nmx)
  • Tx = Τx+n + nLx with initial condition Τω= Lχ;
  • ex = Tx/Cx.
Τω: The terminal age, where every member of the cohort of singles has disappeared (either due to death or due to marriage).
nαx: The average person-years lived in a single state from those who were single at the start of age x but ceased to be so by age x + n.
All nuptiality tables presented in Appendix A are based on the hypothesis that the phenomenon of primary nuptiality (i.e., getting married for the first time) comes to an end at age 55.
The drawback of nuptiality tables is that they refer to a stationary, and not to an actual, population. Formula (1) is the key to converting data from the actual population to a stationary one. In the nuptiality tables shown in Appendix A, columns 3 and 4 refer to the actual population, whereas columns 5 to 11 refer to a hypothetical stationary population.
A stationary population is closed to migratory movements, its growth rate is zero, and its age structure is constant over time. Furthermore, in the stationary population of a gross nuptiality table (like those in Appendix A), a birth cohort of 100,000 single persons is gradually reduced due to marriage. In actual populations, the number of single persons is not necessarily reduced from one age group to the next one3. This fact can result in the peculiarity of the number of single persons in the stationary population of the nuptiality table (Cx in our notation) not always being reduced by age. This was the case with the female nuptiality table of 1991. In the actual population, single females in the age group 50–54 were more numerous than single females in the age group 45–49 (as can be seen in the nPCx column of the relevant table in Appendix A). Therefore, a smoothening procedure had to be applied to have a monotonic reduction in single persons by age.
The smoothening procedure is the following: First, the proportion marrying between ages x and x + n (npmx) for each age group is calculated. Thereafter, the rate of change in proportions marrying from one age group to the next is also calculated (nrmx). This rate is used to derive the number of single persons at the start of age x from ages 50 and above: Cx = Cx-n − (nrmx · Cx-n). For example, the number of single females at age 50 in the nuptiality table of 1991 was derived as C50 = C45 − (5rm45 · C45).

3. Results

The likelihood of marrying for a bachelor in Greece has dropped dramatically from 1991 to 2021 in all age groups (Figure 1). In 1991, the nuptiality curve for males was bimodal, with the probabilities of marrying being equally high at ages 25–29 and 30–34 (more than 0.51). In 2021, a bachelor was more likely to get married between the ages of 30 and 34, but the probability was much lower than 30 years earlier (0.342). It is noteworthy that in 2001 and 2011, the probabilities of a single male marrying, although they were lower than in 1991 at ages up to 40 years, were higher at ages above 40 (higher at 40–44 for 2001 and at 45–49 for 2001 and 2011 compared to 1991). This shift in nuptiality at older ages is not observed anymore in 2021, where the likelihood of first marriage is lower than in the past 30 years in every age group. This drop in nuptiality rates is reflected in the level of permanent celibacy: never married males by age 50 have risen from 5.2% in 1991 to 22.4% in 2021 (ELSTAT 2024).
A different picture is presented in Figure 2 for spinsters. In 1991, the nuptiality curve for females peaked at 20–24 (0.568) and the probabilities of a first marriage dropped spectacularly after age 30. Thirty years later, in 2021, a spinster was more likely to get married between 30 and 34 years of age, and the probabilities of a first marriage were much higher in every age group above 30 than they were in 1991. Consequently, for females, a drop in nuptiality rates at young ages (10–29) since the 1990s has been followed by an increase in these rates at older ages. Nevertheless, this shift towards a late wedding was not enough to compensate for the postponed marriages at young ages: the level of female permanent celibacy has risen from 5.1% in 1991 to 12.6% in 2021 (ELSTAT 2024).
Figure 3 and Figure 4 serve to pinpoint the different nuptiality curves of males and females and the changes that took place over the thirty-year period. By and large, spinsters were more likely to get married than bachelors, at ages up to 25–29 in 1991 and up to 30–34 in 2001 and 2011. For older ages (after 30 in 1991 and after 35 in 2001 and 2011), a bachelor was more likely to marry than a spinster. Paradoxically, this long-lasting pattern has changed in the second decade of the 21st century. A bachelor in 2021 was less likely to get married than a spinster was, in almost every age group from 10–14 to 45–49. The word “almost” is written because in the age group 40–44, the probabilities of first marriage were the same for both sexes (0.23).
Figure 5 shows the expected years of remaining single for a newborn, as an approximation to the mean age at first marriage. In the thirty-year period under consideration, an increase in the age at first marriage was recorded for both sexes, but more so for males. In 2021, a bachelor was expected marry 8.4 years older than he would be in 1991 (age at first marriage had increased from 28.3 to 36.7 between these two dates), while a spinster in 2021 was expected to marry 8.1 years older than in 1991 (from 23.7 to 31.8). One would expect that this considerable deferment of marriage would have repercussions in the fertility of the population as well, as the reproductive age span of women from marriage to age 50 would be shorter. However, the mean age of the mother at first birth was 30.7 in 2020 (CIA 2025), which is below the mean age at first marriage. That implies that many women bear their first child before getting married.
The extent of permanent celibacy in the population can be approximated by Figure 6. The rise in the proportions never married during the study period (1991–2021) is spectacular, especially for males. Nearly one in four males born in the early 1970s (therefore, being in their 50s in the 2020s) will remain a bachelor for life, compared to one in eight women of the same birth cohort.

4. Discussion

Nuptiality tables provide a more nuanced and comprehensive way to study marriage patterns compared to conventional analysis. Unlike simple descriptive statistics, nuptiality tables offer a structured framework to analyze probabilities of marriage at different ages, providing a broader understanding of marriage timing. In the case of Greece, two findings are obvious from the study of nuptiality tables: (1) A decrease in marriage rates and in nuptiality rates4 during the thirty-year period of 1991–2021, and (2) a shift in marriage from younger to older ages. However, these changes are not uniform for males and females. For females, the decrease in marriage rates was partially (not entirely) counterbalanced by a shift in the age-pattern of nuptiality. In 2021, a spinster was 1.7 times more likely to enter matrimony (for the first time) at the ages of 40–44, and 4 times more likely to do so at the ages of 45–49 than they would have been 30 years earlier. For bachelors, on the other hand, the likelihood of marrying was less in 2021 than in 1991 in all age groups5. Hence, for males, the decrease in marriage rates is not counterbalanced by a shift in the age at marriage, and, therefore, permanent celibacy has skyrocketed from 5.2% in 1991 to 22.4% in 2021.
According to official published statistics, life expectancy at birth for a male was 74.8 and 77.4 years for 1991 and 2021, respectively (Eurostat 2025). The expectation of remaining single for a newborn male was, according to our nuptiality tables, 28.3 and 36.7 years for 1991 and 2021, respectively. Therefore, an average male would have spent 38% of his life single in 1991, while this percentage increased in 47% thirty years later (in 2021). If one makes the same calculations for females (given that life expectancy for them was 79.8 and 82.9 for 1991 and 2021, respectively), one finds that an average female would have spent 30% of her life in the single state in 1991 and 38% in 2021. Thus, a feature of the traditional Mediterranean pattern, which was that males spent greater parts of their life as singles (Laslett 1983), is exacerbated in our time, not so much due to the age difference between spouses, as it was the case in the past, but because permanent celibacy affects far more males than females.
In general, the results of this research work brought to light findings that diverge from the hypotheses posed in the introduction. The hypothesis of a delayed marriage is confirmed, but a late marriage is not more pronounced among females, as it was initially hypothesized. The Nuptiality tables indicate that spinsters were marrying 8.1 years older in 2021 than in 1991, while bachelors were marrying 8.4 years older at the end of this 30-year period (1991–2021). This is a recent development, given that up to the 2010s, the age at first marriage for females was increasing with greater rates than that of males (Gavalas 2019). The second hypothesis posed in the introduction was a shift in probabilities of age at marriage. It has been well documented by other studies on Greece that a shift in marriage from younger to older ages has occurred in recent decades, and therefore, it was generally thought that the likelihood of marriage after the age of 40 would have been higher in the 2020s than it was in the past decades. This research paper establishes that this is not the case for bachelors anymore. While, up to 2011, a bachelor was indeed more likely to marry after 40 than in 1991 and in 2001, in 2021, the likelihood of doing so was lower in all age groups than in the past 30 years. Spinsters, on the other hand, are more likely to enter matrimony (for the first time) at ages 40 and above than they were 30 years earlier.
Conclusively, the use of gross nuptiality tables allows for a robust comparison of nuptiality trends across different time periods, independent of mortality changes. This methodological choice provides a clearer picture of the evolution of marriage patterns in Greece. Recent data suggest a decline in marriage rates in Greece, mirroring a trend that started in Scandinavian countries in the late 1960s and spread in Northwest Europe from the 1970s onwards (Höpflinger 1985). This phenomenon could be attributed to various economic and social factors (the widespread entry of women into tertiary education and their mass participation in the labor market), but it is mainly an outcome of an increasing emphasis on individual autonomy. The institution of marriage, even in its wider non-traditional sense (that is, counting civil partnerships as marital unions) is declining, and this trend indicates a shift in attitudes away from the customary family formation and traditional life paths.

Funding

This research received no external funding.

Institutional Review Board Statement

Not applicable.

Informed Consent Statement

Not applicable.

Data Availability Statement

The original contributions presented in this study are included in the article.

Conflicts of Interest

The authors declare no conflict of interest.

Appendix A

Table A1. Gross abridged period nuptiality tables for the single population of Greece.
Males 1991
(1)(2)(3)(4)(5)(6)(7)(8)(9)(10)(11)
xnnPxnPCxnaxCxnmxnnxnLxTxex
05286,143286,1432.5100,00000.000500,0002,832,08828.3
55341,078341,0782.5100,00000.000500,0002,332,08823.3
105387,720387,7202.5100,00000.000500,0001,832,08818.3
155394,647392,2892.5100,00083870.084479,0321,332,08813.3
205399,821366,2882.591,61331,3350.342379,726853,0569.3
255359,353216,6092.560,27730,9080.513224,118473,3297.9
305361,163106,0722.529,37015,1810.517108,895249,2128.5
355342,07848,5362.514,18956800.40056,742140,3169.9
405336,44928,6262.5850826090.30736,01883,5749.8
455278,58916,4342.5589913140.22326,21047,5568.1
505319,25514,6382.545856320.13821,34621,3464.7
Females 1991
xnnPxnPCxnaxCxnmxnnxnLxTxex
05270,844270,8442.5100,00000.000500,0002,366,72323.7
55322,356322,3562.5100,00000.000500,0001,866,72318.7
105366,726366,4062.5100,00055320.055486,1711,366,72313.7
155371,958351,3832.594,46830,7970.326395,351880,5529.3
205391,591249,3332.563,67236,1590.568227,962485,2017.6
255362,39899,7072.527,51315,4410.56198,963257,2399.3
305367,77744,3992.512,07246870.38848,643158,27613.1
355339,23825,0522.5738514970.20333,182109,63314.8
405336,80219,8312.558887770.13227,49876,45113.0
455281,37414,3812.551112350.04624,96748,9539.6
505338,06017,2922.548761570.03223,98723,9874.9
Males 2001
xnnPxnPCxnaxCxnmxnnxnLxTxex
05271,741271,7412.5100,00000.000500,0003,083,22630.8
55280,959280,9592.5100,00000.000500,0002,583,22625.8
105306,063306,0282.5100,0008200.008497,9502,083,22620.8
155381,964378,8322.599,18052240.053482,8401,585,27616.0
205437,659411,2062.593,95620,5590.219418,3821,102,43711.7
255437,801321,3322.573,39730,8640.421289,823684,0559.3
305443,373188,5772.542,53218,9970.447165,170394,2329.3
355393,45992,6032.523,53688370.37595,585229,0629.7
405388,36757,0832.514,69850700.34560,817133,4789.1
455356,41434,3172.5962826130.27141,61072,6617.5
505338,47023,7462.5701616110.23031,05131,0514.4
Females 2001
xnnPxnPCxnaxCxnmxnnxnLxTxex
05258,528258,5282.5100,00000.000500,0002,612,73226.1
55265,055265,0552.5100,00000.000508,9512,112,73221.1
105281,739281,4042.5100,00035800.036526,1401,603,78116.0
155346,954334,5322.596,42017,6170.183478,9431,077,64111.2
205398,743314,2222.578,80333,9710.431285,365598,6987.6
255412,286184,8372.544,83224,4810.546125,324313,3347.0
305429,69887,4472.520,35194280.46363,152188,0109.2
355392,39442,8612.510,92334150.31341,340124,85811.4
405395,53029,6962.5750815200.20231,67083,51811.1
455359,06321,5002.559886920.11627,73951,8488.7
505350,74118,5732.552955050.09524,10824,1084.6
Males 2011
xnnPxnPCxnaxCxnmxnnxnLxTxex
05274,788274,7882.5100,00000500,0003,333,58933.3
55262,432262,4322.5100,00000500,0002,833,58928.3
105265,787265,7442.5100,0006420.0064498,3952,333,58923.3
155286,386284,5472.599,35841850.0421486,3281,835,19418.5
205325,127309,4342.595,17313,1990.1387442,8691,348,86614.2
255371,617304,6312.581,97427,4200.3345341,322905,99711.1
305417,861227,9612.554,55421,8320.4002218,191564,67510.4
355409,681134,0562.532,72210,4830.3204137,403346,48410.6
405414,02692,0762.522,23966850.300694,485209,0819.4
455367,08657,0992.515,55543910.282366,795114,5977.4
505355,55239,6912.511,16332060.287247,80247,8024.3
Females 2011
xnnPxnPCxnaxCxnmxnnxnLxTxex
05262,455262,4552.5100,00000500,0002,869,76028.7
55250,164250,1642.5100,00000500,0002,369,76023.7
105253,642253,4312.5100,00018830.0188495,2931,869,76018.7
155266,890261,8652.598,11712,5920.1283459,1061,374,46714.0
205301,970258,2612.585,52524,0990.2818367,379915,36110.7
255352,154216,3152.561,42628,7340.4678235,295547,9828.9
305404,614132,2762.532,69215,3600.4698125,060312,6879.6
355403,14869,8742.517,33257420.331372,304187,62710.8
405418,64048,5192.511,59033280.287249,628115,32210.0
455381,34331,5042.5826119200.232436,50765,6958.0
505375,93423,8392.5634110070.158829,18829,1884.6
Males 2021
xnnPxnPCxnaxCxnmxnnxnLxTxex
05212,295212,2952.5100,00000500,0003,668,92836.7
55239,198239,1982.5100,00000500,0003,168,92831.7
105277,154277,1112.5100,0004110.0041498,9742,668,92826.7
155273,992272,8672.599,58914450.0145494,3362,169,95521.8
205270,924265,8982.598,14580460.0820470,6101,675,61917.1
255276,007248,6802.590,09922,9870.2551393,0291,205,00913.4
305289,196194,0862.567,11222,9410.3418278,209811,98012.1
355344,715152,2652.544,17112,0980.2739190,612533,77112.1
405397,884127,6152.532,07374020.2308141,863343,16010.7
455399,84098,6482.524,67244830.1817112,153201,2968.2
505397,35880,2242.520,18947210.233989,14389,1434.4
Females 2021
xnnPxnPCxnaxCxnmxnnxnLxTxex
05200,460200,4602.5100,00000500,0003,177,55431.8
55226,545226,5452.5100,00000500,0002,677,55426.8
105261,334261,2782.5100,0006950.0069498,2632,177,55421.8
155255,736253,9592.599,30551030.0514483,7671,679,29216.9
205249,698235,2202.594,20218,5440.1969424,6491,195,52412.7
255256,678194,1972.575,65831,9550.4224298,401770,87510.2
305280,403122,5432.543,70218,6910.4277171,786472,47410.8
355342,07885,5602.525,01270790.2830107,362300,68912.0
405396,42971,0912.517,93340800.227579,464193,32710.8
455401,88055,6712.513,85325420.183562,908113,8638.2
505409,77046,3482.511,31122400.198050,95550,9554.5
Note: For the construction of the 2021 tables, those in civil partnerships were regarded as being married. They are not included in the single population (nPCx).

Notes

1
All decrement tables, either life tables or nuptiality tables, refer to a stationary population, the radix of which is a power of 10 (usually 1000 or 10,000 or 100,000).
2
The term primary nuptiality refers to first marriages.
3
Especially in our data, the Greek population has more numerous cohorts at older ages because of the declining fertility rates, which characterize Greece since the mid-1970s.
4
In nuptiality table terminology, the term “marriage rate” is used in the sense of a central rate (i.e., marriages per thousand singles in a given age group), while the term “nuptiality rate” is used for the probability of marriage (Mertens 1965).
5
However, this is a recent development; in 2001 and 2011, a bachelor was less probable to marry up to 40 years of age than in 1991, but he was more likely to do so at ages after 40 compared to 1991.

References

  1. Billari, Francesco C., and Hans-Peter Kohler. 2004. Patterns of Low and Lowest-Low Fertility in Europe. Population Studies 58: 161–76. [Google Scholar] [PubMed]
  2. CIA. 2025. Greece. People and Society. The World Factbook. Available online: https://www.cia.gov/the-world-factbook/countries/greece/#people-and-society (accessed on 6 February 2025).
  3. ELSTAT. 2024. 2021 Population Census Household Results [Table A05. 2021 Population Census. Resident Population by Sex and Legal Marital Status]. Available online: https://www.statistics.gr/en/2021-census-res-pop-results (accessed on 2 January 2025).
  4. ELSTAT. n.d. Digital Library: Population Censuses and Statistics of the Natural Movement of the Population of Greece. Available online: http://dlib.statistics.gr/portal/page/portal/ESYE (accessed on 30 June 2019).
  5. Eurostat. 2025. Life Tables by Age and Sex. Available online: https://ec.europa.eu/eurostat/databrowser/view/demo_mlifetable__custom_15285753/default/table?lang=en (accessed on 7 February 2025).
  6. Gavalas, Vasilis S. 2008. Marriage Patterns in Greece during the Twentieth Century. Continuity and Change 23: 509–29. [Google Scholar]
  7. Gavalas, Vasilis S. 2015. The World We Have Gained: Population Geography of Modern Greece. Mytilene: Reprographics. (In Greek) [Google Scholar]
  8. Gavalas, Vasilis S. 2019. The Population of the Aegean Archipelago: 1920–2020 a Century of Demographic and Social Development of the Aegean Societies. Thessaloniki: Disigma. (In Greek) [Google Scholar]
  9. Gavalas, Vasilis S. 2025. Human Geography of the Ionian Islands. Volos: University of Thessaly Press. (In Greek) [Google Scholar]
  10. Gavalas, Vasilis S., and Michail Raftakis. 2024. Redefining Family Structures: Births out of Wedlock in 21st Century Greece. Population, Space and Place 30: e2806. [Google Scholar]
  11. Höpflinger, François. 1985. Changing Marriage Behaviour: Some European Comparisons. Genus 41: 41–64. [Google Scholar] [PubMed]
  12. Kontogiannis, George. 2022a. The Evolution of Marriages and of Nuptiality in Greece. Demo News 43: 1–4. (In Greek). [Google Scholar]
  13. Kontogiannis, George. 2022b. Union Formation and Dissolution in the Countries of the European South, with an Emphasis on Greece: A Comparative Analysis. Volos: University of Thessaly. (In Greek) [Google Scholar]
  14. Kreyenfeld, Michaela, Gunnar Andersson, and Ariane Pailhé. 2012. Economic Uncertainty and Family Dynamics in Europe: Introduction. Demographic Research 27: 835–52. [Google Scholar] [CrossRef]
  15. Laslett, Peter. 1983. Family and Household as Work Group and Kin Group: Areas of Traditional Europe Compared. In Family Forms in Historic Europe. Edited by Richard Wall. Cambridge: Cambridge University Press. [Google Scholar]
  16. Lesthaeghe, Ron. 2010. The Unfolding Story of the Second Demographic Transition. Population and Development Review 36: 211–51. [Google Scholar] [PubMed]
  17. Malaker, C. R. 1973. Construction of Nuptiality Tables for the Single Population in India: 1901–1931. Demography 10: 525–35. [Google Scholar] [PubMed]
  18. Mertens, Walter. 1965. Methodological Aspects of the Construction of Nuptiality Tables. Demography 2: 317–48. [Google Scholar]
  19. Papadakis, Michael, and Kleon Tsimpos. 2004. Demographic Analysis. Athens: Stamoulis. (In Greek) [Google Scholar]
  20. Rontos, Kostas, and Luca Salvati. 2020. Space Matters? Exploring Gender Differentials in the Age at Marriage, Greece (1980–2017). Social Sciences 9: 59. [Google Scholar] [CrossRef]
  21. Salamaliki, Paraskevi K. 2017. Births, Marriages, and the Economic Environment in Greece: Empirical Evidence over Time. Journal of Family and Economic Issues 38: 218–37. [Google Scholar]
  22. Saveland, Walt, and Paul Glick. 1969. First-Marriage Decrement Tables by Color and Sex for the United States in 1958–60. Demography 6: 243–60. [Google Scholar] [CrossRef] [PubMed]
  23. Siampos, George. 1993. Demography. Athens: Sbilias. (In Greek) [Google Scholar]
Figure 1. Probabilities of first marriage within each 5-year age group. Greece, males 1991–2021. Source: Data from Appendix A.
Genealogy 09 00032 g001
Figure 2. Probabilities of first marriage within each 5-year age group. Greece, females 1991–2021. Source: Data from Appendix A.
Genealogy 09 00032 g002
Figure 3. Probabilities of first marriage within each 5-year age group by sex. Greece, 1991–2001.
Genealogy 09 00032 g003
Figure 4. Probabilities of first marriage within each 5-year age group by sex. Greece, 2011–2021.
Genealogy 09 00032 g004
Figure 5. Expected years of single life at birth by sex. Greece 1991–2021. Source: Data from Appendix A.
Genealogy 09 00032 g005
Figure 6. Proportions never married by age 50 by sex (referring to the stationary population of nuptiality tables). Greece 1991–2021. Source: Data from Appendix A.
Genealogy 09 00032 g006
Disclaimer/Publisher’s Note: The statements, opinions and data contained in all publications are solely those of the individual author(s) and contributor(s) and not of MDPI and/or the editor(s). MDPI and/or the editor(s) disclaim responsibility for any injury to people or property resulting from any ideas, methods, instructions or products referred to in the content.

