1. Introduction
Departments of transportation (DOTs) are the main governmental entities accountable for the development, construction, maintenance, and operation of interstates and roadways within their respective state [
1]. Since construction, maintenance, and traffic control operations expose roadway workers to different hazards (some potentially fatal), state DOTs have an obligation to improve and advocate for the safety of their employees.
While all state DOTs are responsible for administrating and maintaining their state roadway systems, individual organizations can have different approaches to their organization’s safety programs. The primary purpose of these efforts is to prevent work-related fatalities, injuries, and/or illnesses. Additional considerations include the desire to limit the negative financial implications that incidents can create for employees, their families, and organizations alike. Safety programs should employ proactive strategies to control and improve worker safety at the workplace [
2]. Aspects such as the organizational size, availability of funds, and organizational structure can differ broadly from one state to another, and may influence implementation. Regardless, state DOTs should mirror best practices that have shown to be effective in reducing harmful worker outcomes.
The Alabama Department of Transportation (ALDOT) began Implementing a revised Worker Safety Program in 2020. To determine the state of the practice (SOTP), ALDOT collaborated with the University of Alabama at Birmingham (UAB) to conduct a SOTP survey of state DOTs nationwide to review realistic practices, policies, and programs. The aims of the SOTP Survey on U.S. DOT Worker Injuries and Safety Program Efforts were to identify risks and trends, and provide recommendations for reducing the occurrence of worker injuries and illnesses. The survey aimed to gather information about the safety programs of state DOTs, including their training and education efforts, injury analysis practices, and effective safety initiatives. The survey results were intended to highlight contrasts in safety efforts across responding DOTs and provide insights into best practices for improving worker safety. By disseminating the findings, the goal of the survey is to help state DOTs implement effective safety programs and reduce the incidence of worker injuries and illnesses.
Literature Review
DOTs across the United States provide jobs for almost 55,000 employees [
3]. However, the number of employees per state varies greatly; this is related to the lane miles of the state highways, the number of bridge structures, the population, passenger trips per year, etc. This creates discrepancies regarding the extent of coverage required from a worker safety standpoint. Regardless of the agency size, the construction/maintenance occupational group represents the majority of the DOT workforce. Moreover, these workers experience the highest number of injuries/illnesses. These transportation workers routinely deal with hazards related to conducting work in sites adjacent to traffic, working with heavy equipment, transporting heavy materials, and are often exposed to extreme weather conditions [
4]. Critical hazards causing concern in highway construction/maintenance operations were identified in a study by Hancher et al. and included the following: (1) runovers, backovers and rollovers of heavy machinery, (2) falls, (3) vegetation trimming and cutting, (4) crane operation, (5) short-term/quick patching, (6) electric work activities, (7) lack of use of proper personal protective equipment (PPE), (7) visibility and hearing, (8) trenching, shoring, and excavation, and (9) debris removal on highways [
5]. These hazards should be properly and frequently addressed in maintenance worker training programs.
To reduce risks in the workplace, different control measures can have varying levels of hierarchy. The hierarchy of controls are as follows: (1) avoiding or reducing the hazard impact, (2) engineering controls, (3) administrative controls, and (4) PPE. Engineering controls include removing or minimizing the risk, and the design/redesign of work areas, equipment, or processes able to eliminate, minimize, enclose or isolate the hazard(s). Administrative controls include written guidelines for operation and safe work practices, exposure period constraints, supervising the usage of hazardous materials, alarms, signs, and warnings, teamwork, and training [
6].
Research conducted for the Iowa Department of Transportation and aiming to mitigate the risks associated with highway maintenance operations proposed several strategies to decrease the frequency and severity of injuries. Strategies included revising existing guidelines and manuals, exploring new technologies for training and information sharing, focusing on worker and equipment visibility, holding meetings to discuss best practices, minimizing the number of workers and vehicles in high-risk environments, and emphasizing the importance of the appropriate placement of temporary traffic controls. These strategies aim to improve the safety performance of transportation maintenance workers [
7].
The intent of a safety program according to the Occupational Safety and Health Administration (OSHA) is to protect workers from existing hazards and any possible risks in the workplace. An efficient safety program can considerably decrease the rate of injuries, as it allows organizations to create a safe workplace and promote cooperation and employee involvement [
8]. Safety programs are based on gathering information from different sources such as current injury records, hazard assessments, repetitive task investigations, and the identification of indirect factors leading to injuries. By interpreting this information, effective measures can be taken to lessen the effects of workplace injuries [
9].
The Nevada DOT, for example, developed a workers’ compensation system able to explore injury trends based on different characteristics. This system enables recurring injuries and their associated tasks to be addressed, and can integrate controls to be shared with employees. Other features of the Nevada DOT Safety Management System include crash investigation and the tracking of employee training. The positive outcomes of the implementation of their safety program can be observed when examining work-related injury records from 2011 to 2020. In 2011, the Nevada DOT recorded 145 work-related injuries; this is compared to 75 injuries in 2019 and 55 in the year 2020 [
10]. Another case study conducted on the Tennessee DOT (TDOT), which ranks in the top five highway systems in the United States [
11], discusses how the agency was able to improve communication, enhance the management and analysis of safety data and trends, as well as implement corrective measures using Tableau software, a dashboard reporting tool. This electronic system facilitates the prioritization and allocation of resources regarding urgencies and priorities. TDOT assessed that workers’ compensation and property damage cost savings were around USD 1 M in 2019 alone [
10].
The survey questions were developed based on a review of the existing literature on worker safety programs and input from experts in the field. The variables investigated in the survey were determined and chosen based on the aims of the survey and in order to collect data on a range of variables related to worker safety, including the following:
Agency demographics
Injury documentation and data collection practices
Training and education efforts
The nature, source, and cause of common injuries
Injury and fatality rates
Near miss incident reporting and analysis
Ergonomic assessments and training
Funding and resource allocation for safety programs
These variables were analyzed individually and collectively to unveil any correlations or causations, such as the size of the DOT and funding, the injury rate and percent of employees who frequently work in construction and/or maintenance operations, as well as the injury documentation process and near miss reporting.
Reviewing the realistic practices, policies, and programs used by peer DOTs can educate decision makers about the hazards of their work environments/tasks and significantly improve the implementation of their safety programs.
2. Materials and Methods
The research survey was developed using Qualtrics and targeted respondents who were identified as responsible for their respective state DOT safety program. The survey can be found on the Qualtrics website via the following link:
https://uab.co1.qualtrics.com/jfe/form/SV_cCvniASQhmvD9Ai (accessed on 5 July 2022).
The survey comprised forty questions divided into six categories: (1) Agency Demographics, (2) Injury Reporting and Documentation, (3) Injury Trends, (4) Data Collection, (5) Training, and (6) Safety-Related Policies and Procedures. The question types included multiple choice, Likert scale (i.e., 5-point), text entry, file upload, and matrix table format questions. The responses to the Likert scale and multiple choice questions were examined using descriptive statistics to recognize patterns and trends. The responses to open-ended (i.e., subjective) questions were qualitatively analyzed using a thematic analysis approach that provides a content-driven interpretation of data. The thematic method was used to detect, investigate, and report patterns. This was accomplished by gathering and organizing the survey responses in an excel spreadsheet that was easy to manage and visualize. Responses from the same organizations were examined to ensure consistencies, notes were taken and initial observations about recurring responses were noted. The next step was creating different charts and visualizations for each question’s responses to identify patterns and generate initial insights; this was performed until data saturation was reached and no new themes or insights were captured from the data. Finally, descriptions for each insight were documented and a narrative describing these insights was created.
The nationwide survey of state DOT worker injury and safety efforts was deployed over a four-week period (5 July to 31 July 2022), with follow-up reminders sent weekly to non-responders. Ultimately, the survey response rate was 44% (22 of 50 US States). This response rate is considered above average in organizational research [
12].
For content validity, the authors met with a panel of safety experts from the Alabama Department of Transportation (ALDOT) and reviewed each question in the survey to guarantee relevance and comprehensiveness, as well as to collect feedback and make necessary modifications to ensure that the questions were not confusing and adequately covered the goals of the survey.
Respondents’ job titles differed and included titles such as Safety Coordinator, Chief of Occupational Safety and Health, Safety Program Manager, Occupational Safety and Health Branch Manager, etc. In total, 73% of the respondents’ job titles included the word safety. In addition, 36% included Director or Administrator, 32% included Manager or Coordinator, and 32% included Health. A justification for the validity of the survey responses was achieved based on the responding individuals’ job titles, which demonstrate knowledge, awareness, and access to the agency’s current safety efforts, practices, issues, and information.
Different respondents from the same organization were asked to complete the survey. In total, 23% of the responding agencies submitted two or more responses from different safety personnel. These responses were assessed for similarities individually as well as collectively, and were all found to maintain consistency and ensure reliability.
Participating DOTs are shown in
Figure 1 and are classified according to the respective state’s governing OSHA plan (i.e., State or Federal). State Plans are still overseen by the Federal regulatory agency OSHA and must be as or more stringent than OSHA regulations with regard to safeguarding the work environment.
3. Results
The following section includes the results of the survey and is divided into the following sections: (
Section 3.1) Agency Demographics, (
Section 3.2) Injury Reporting and Recordkeeping, (
Section 3.3) Injury Trends, (
Section 3.4) Data Collection, (
Section 3.5) Training, and (
Section 3.6) Safety Program Funding, Related Topics, and Procedures. Descriptive statistics were used to analyze the responses to the Likert scale and multiple choice questions and to recognize patterns and trends in the data. Visualization tools, while not a statistical technique per se, were used for conveying the survey findings effectively. Charts and graphs can help present survey results in a visually appealing and comprehensible manner.
3.1. Agency Demographics
The survey instrument collected contact information for each agency and responding individual(s). The respondents’ job titles differed and included the following: Safety Coordinator, Chief of Occupational Safety and Health, Safety Program Manager, Occupational Safety and Health Branch Manager, etc. In total, 73% of the respondents’ job titles included the word safety. In addition, 36% included Director or Administrator, 32% included Manager or Coordinator, and 32% included Health. A viable justification for the validity of the survey responses was supported by the responding individuals’ job titles, which demonstrate knowledge, awareness, and access to the agency’s current safety efforts, practices, issues, and information.
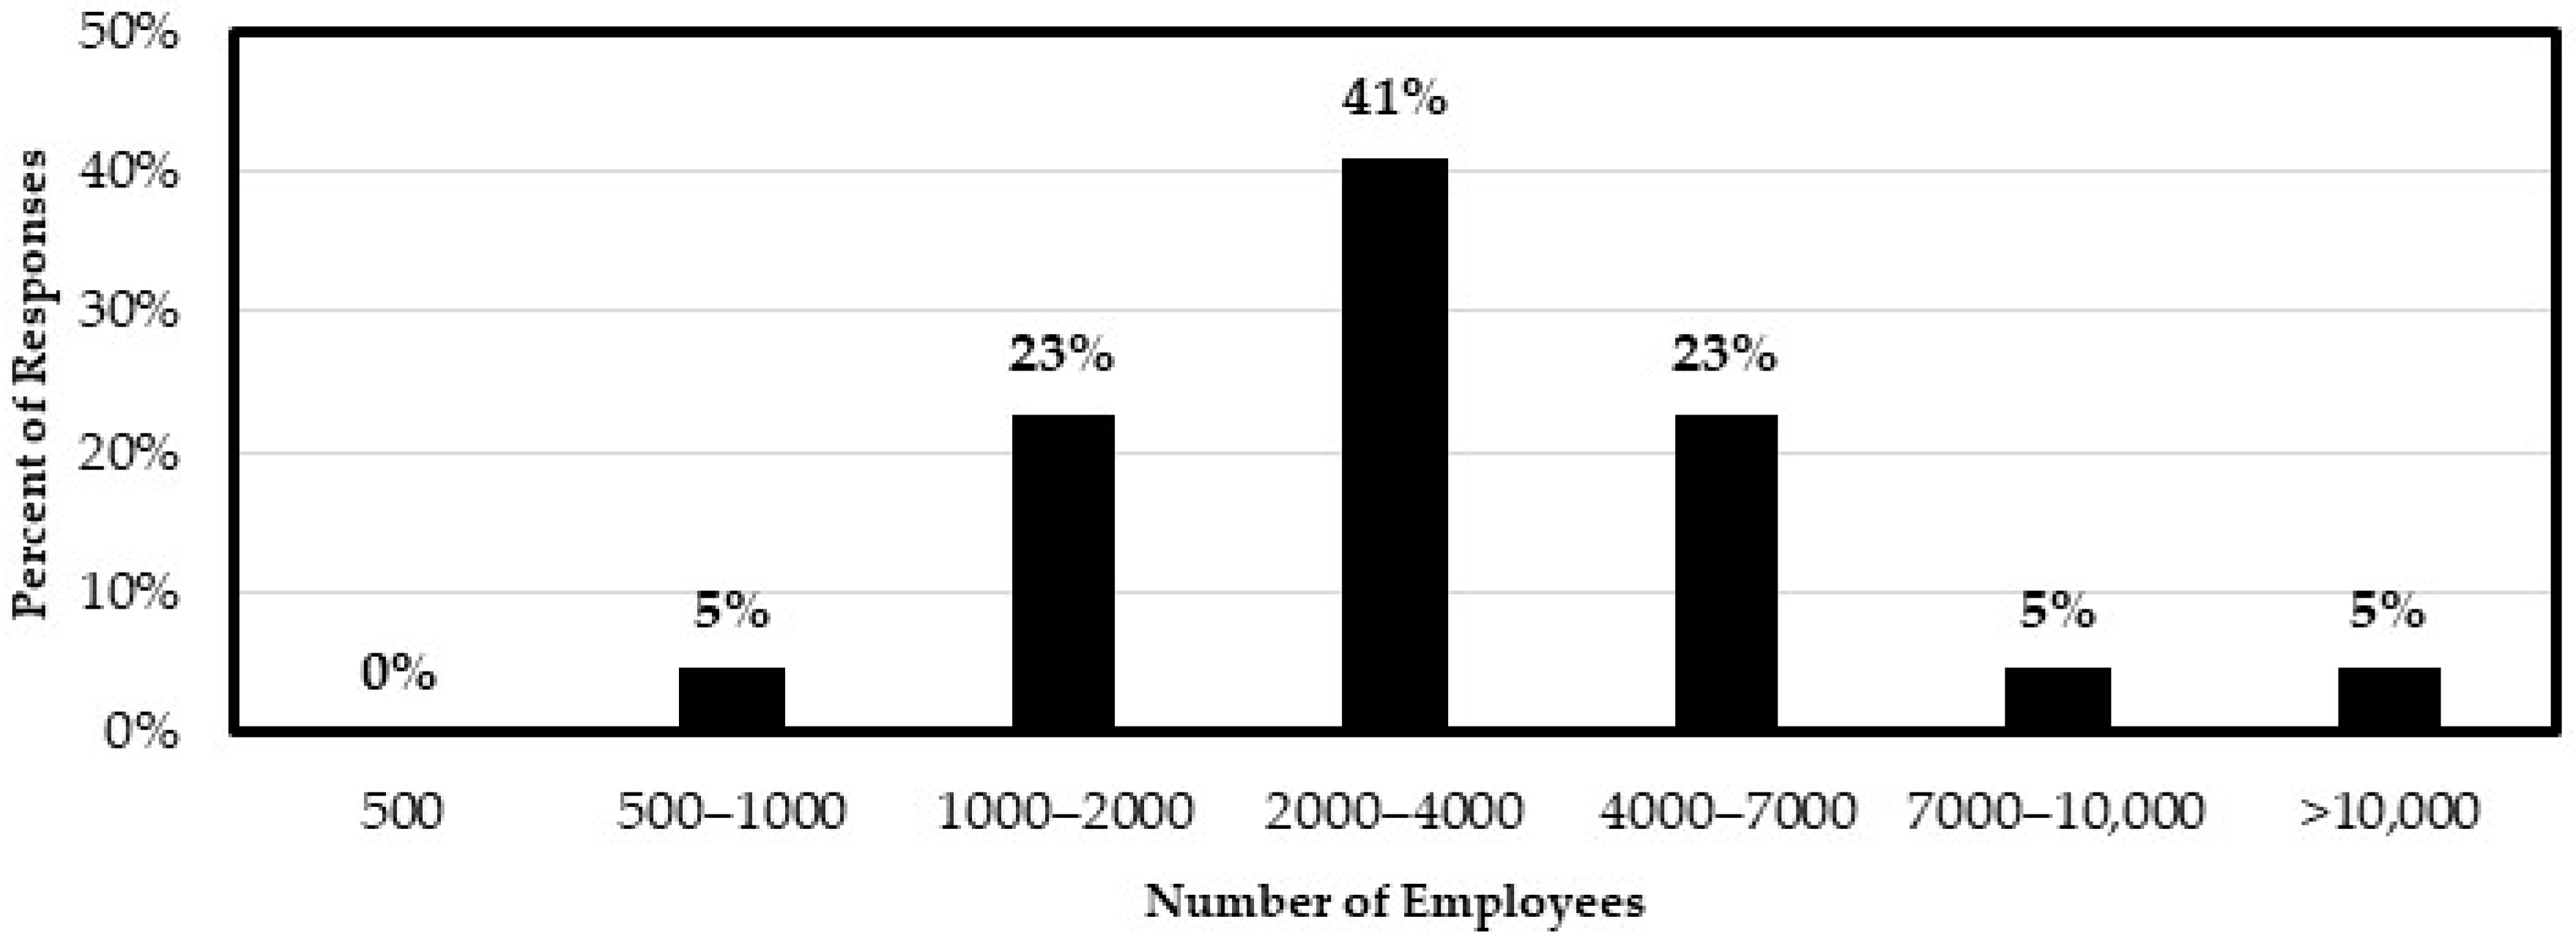
Further survey questions inquired about the size of the agency regarding the number of employees and the percentage of workers who frequently work in construction and/or maintenance operations.
Figure 2 shows that no responding agency operates with fewer than 500 employees, while most agencies range between 2000–4000 employees (41%).
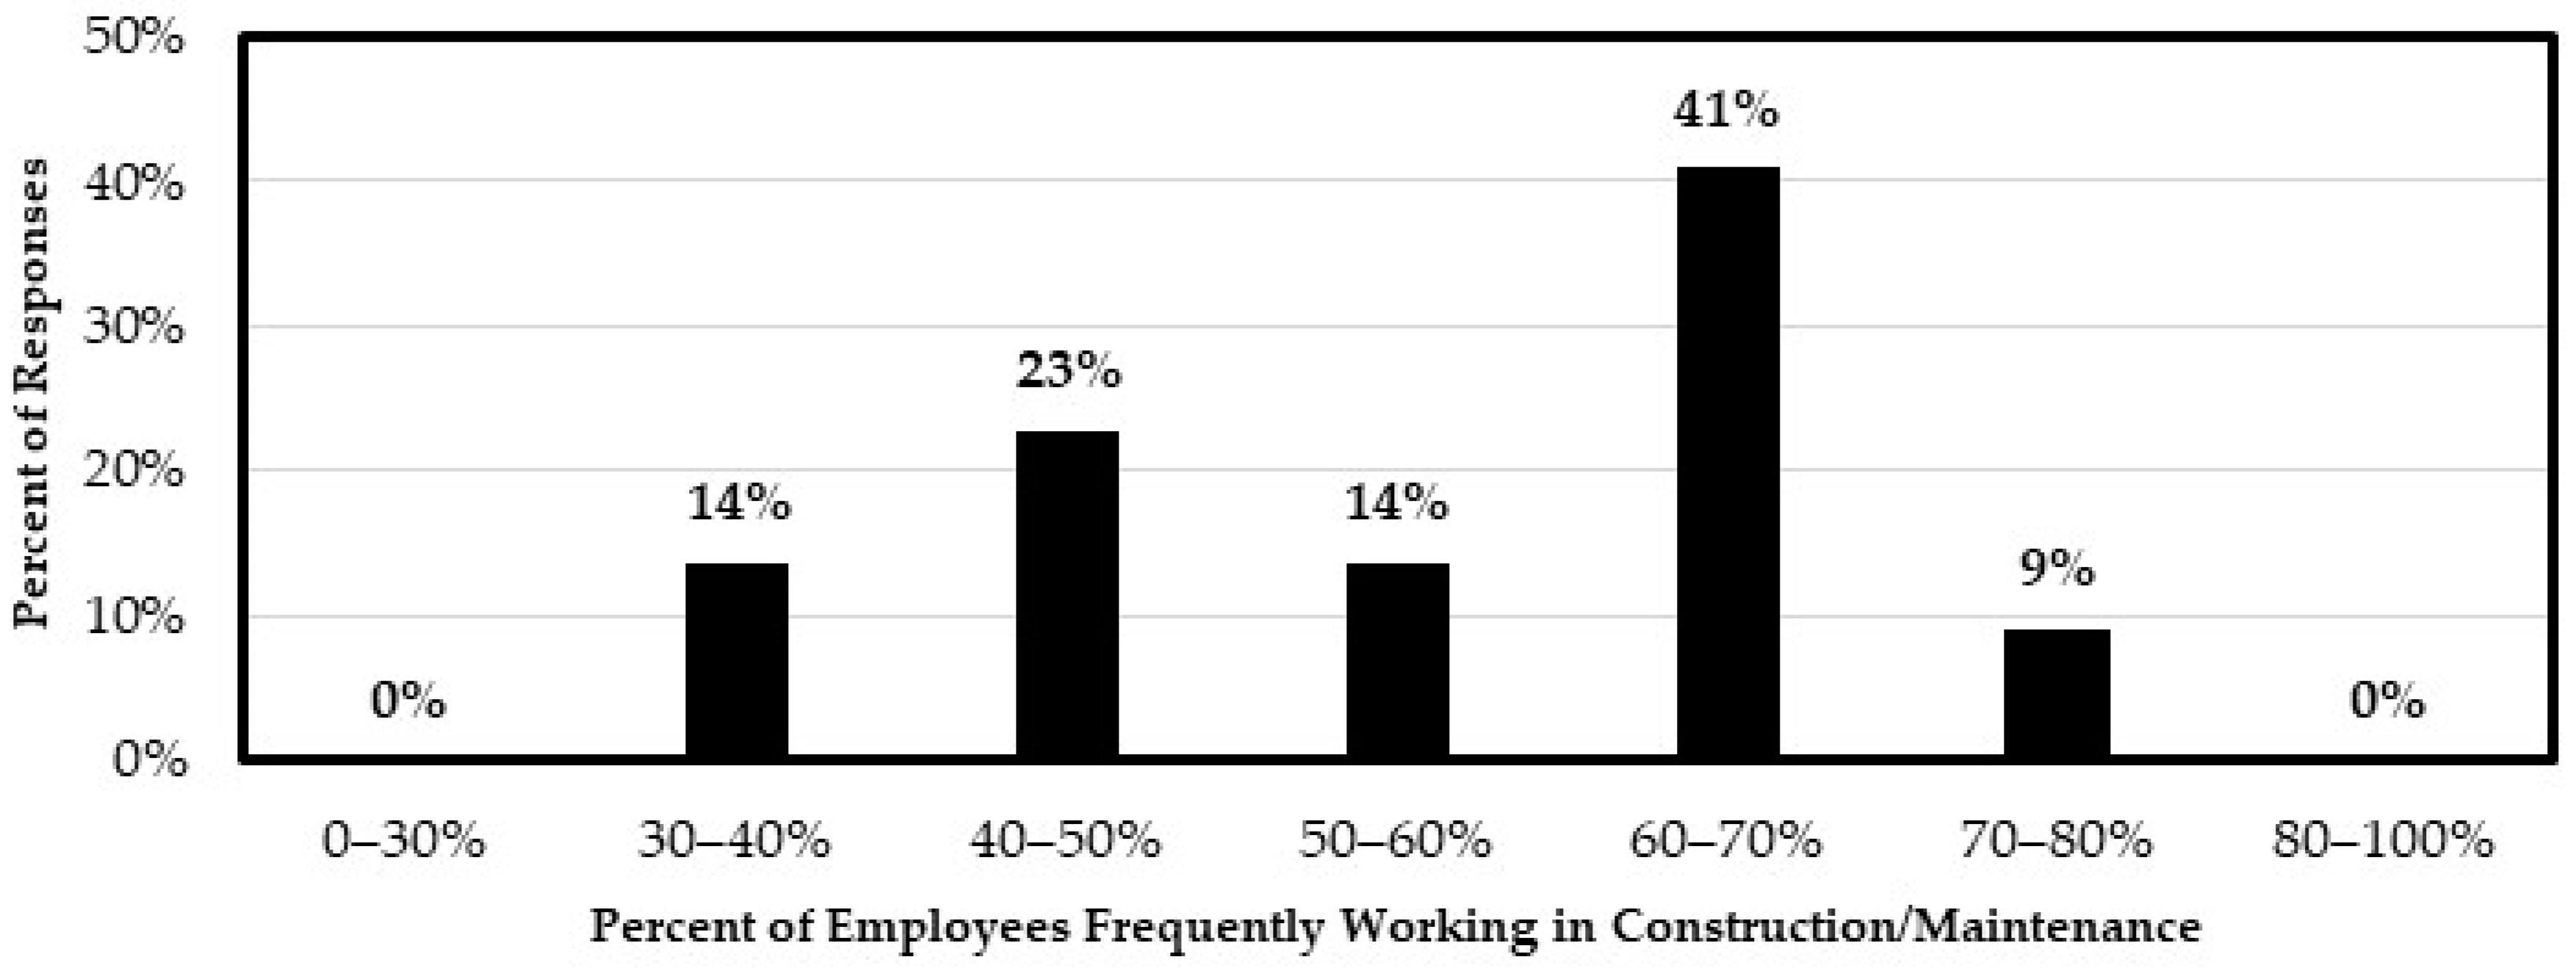
Figure 3 shows the percentage of employees who frequently work in construction/maintenance operations.
In total, 60% of the respondents reported that more than half of their employees work in construction/maintenance operations, which highlights the need for DOTs to prioritize worker safety, given the inherent hazards associated with these operations.
3.2. Injury Reporting and Recordkeeping
The survey examined the procedures implemented when incidents, fatalities, or injuries occurred in order to gain a better understanding of national practices. The survey respondents were asked to provide their method of reporting and documenting incidents, along with an indication of the importance of each action on a Likert scale.
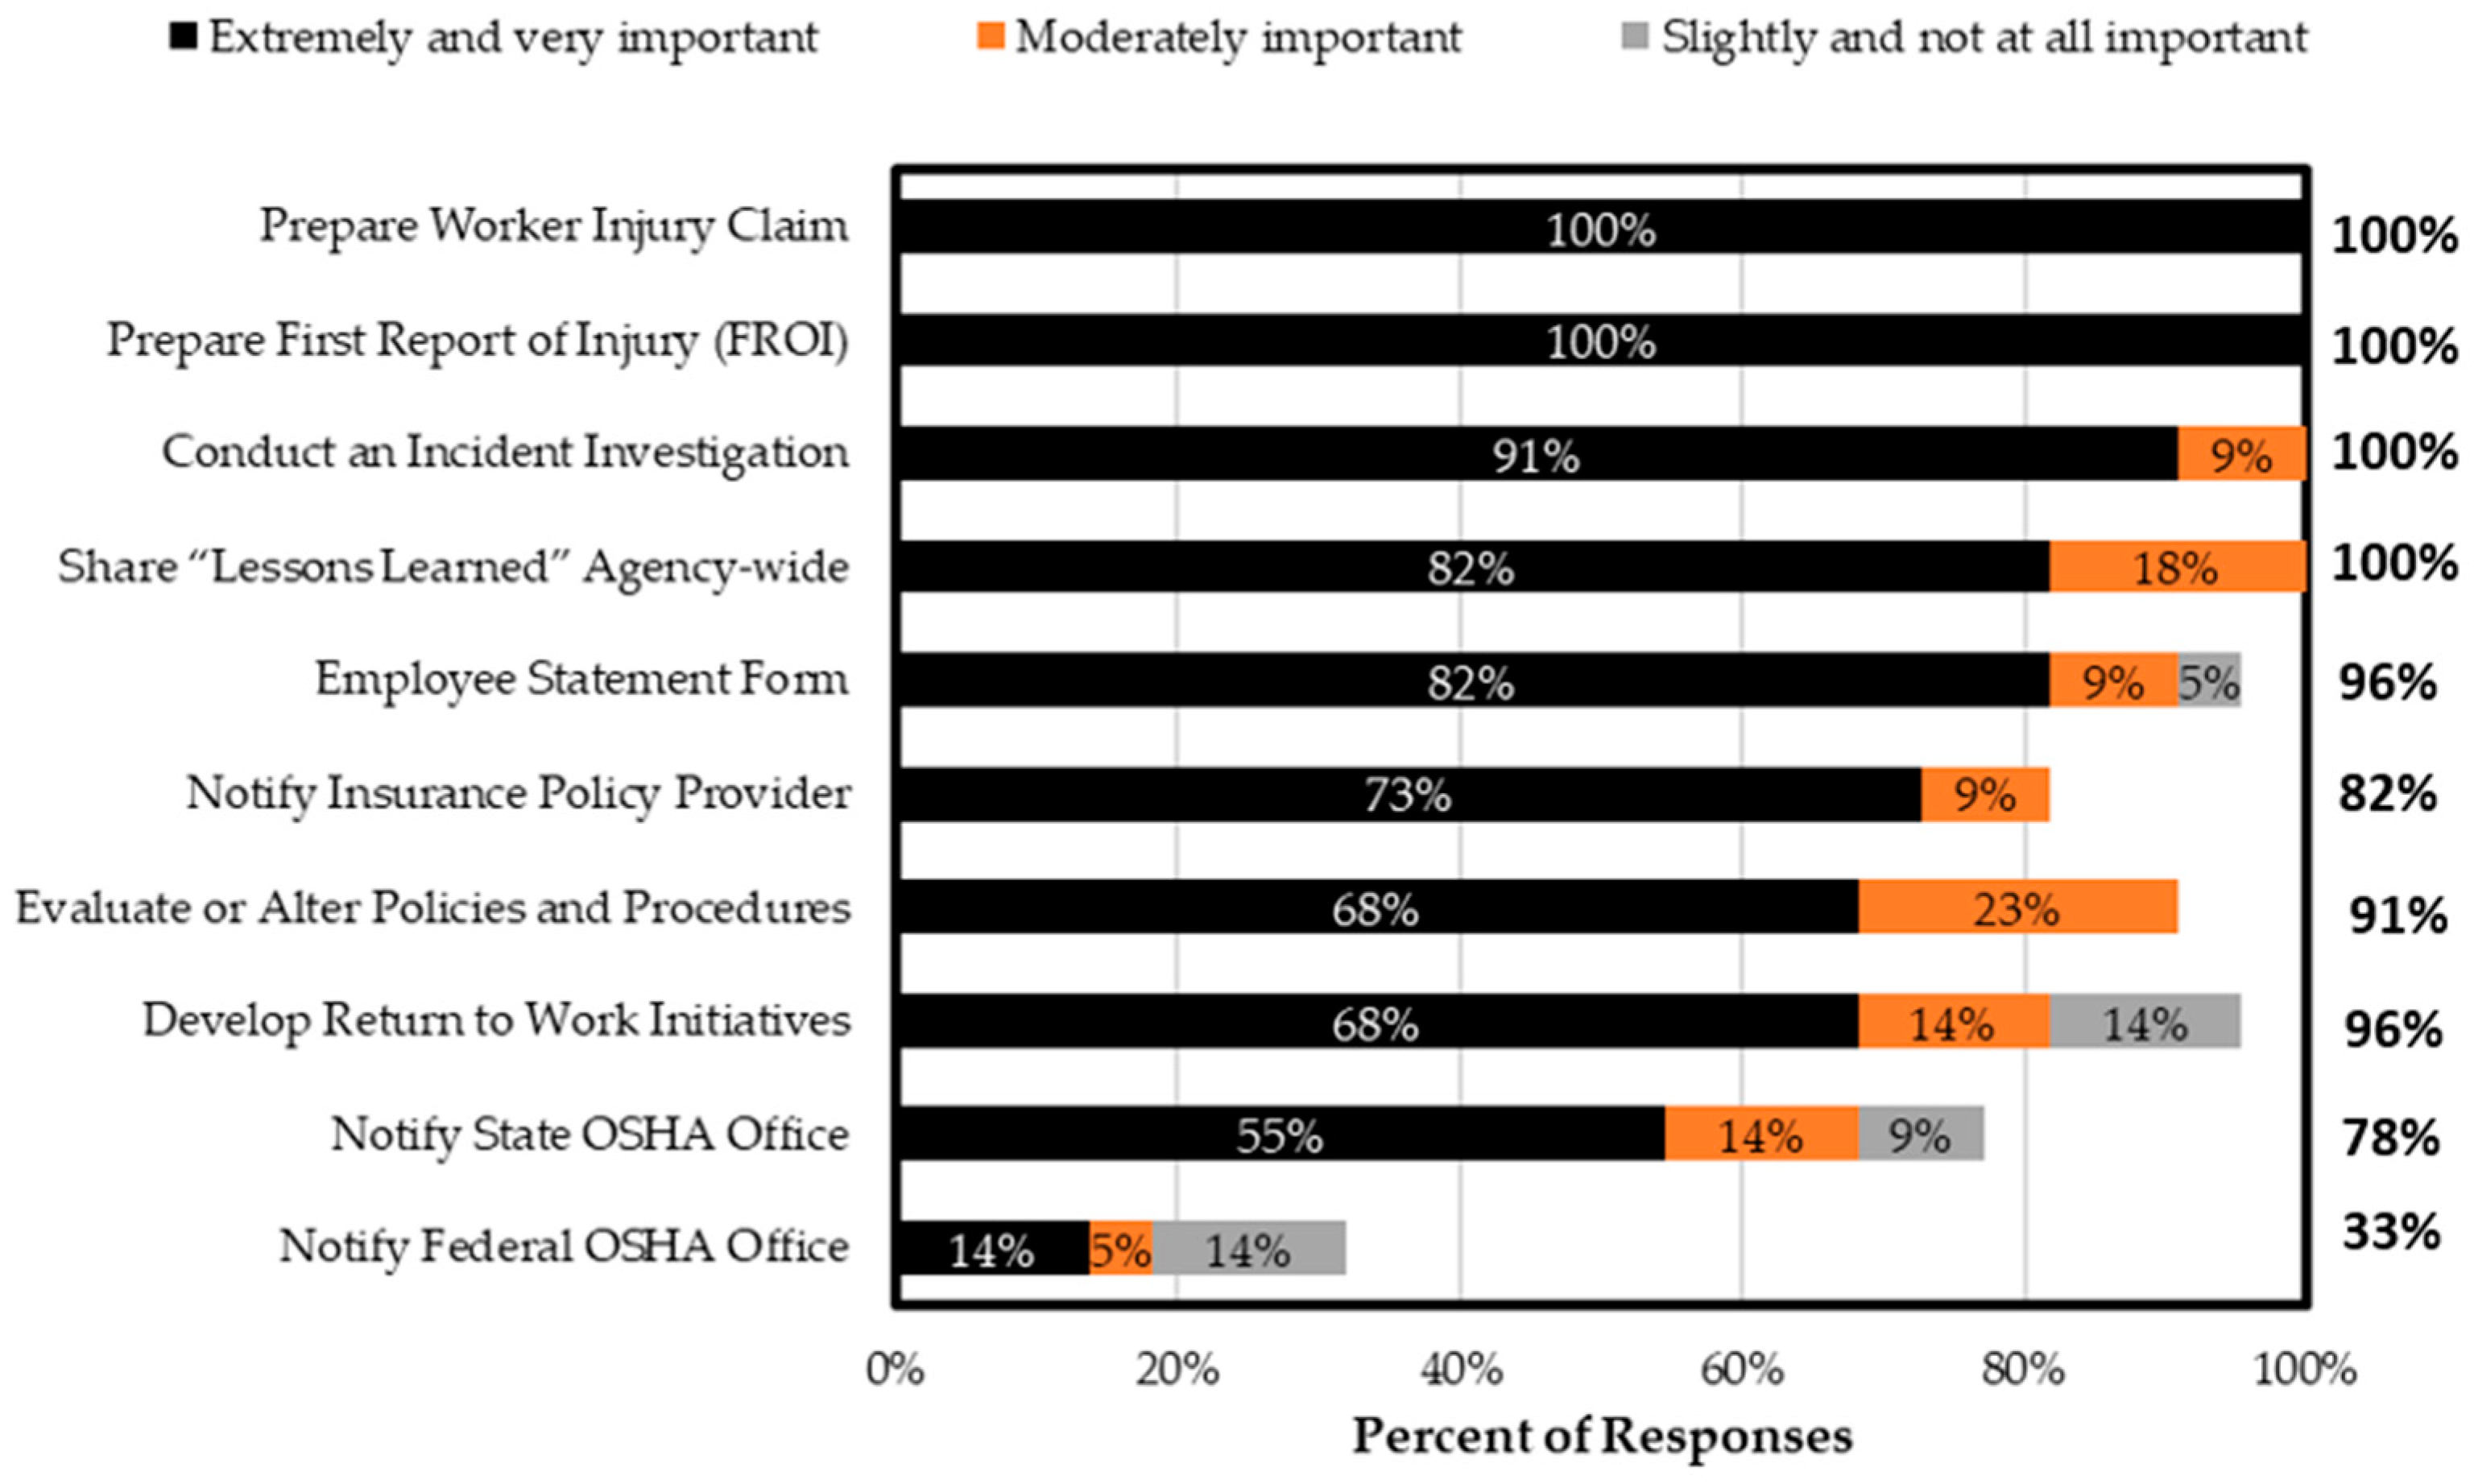
Figure 4 illustrates that the majority of responding DOTs have consistent practices for reporting and recording injuries. An exception was notifying OSHA offices (federal or state), which is dependent on whether a DOT has an OSHA-approved State Plan that covers state and local government workers. Other actions reported to be performed by survey respondents included the dissemination of weekly statewide reports for sharing lessons learned and creating discussion opportunities, as well as the investigation of preventable and lost-time accidents in greater depth.
Figure 4 also establishes that the completion of ‘Worker Injury Claim’ and ‘First Report of Injury (FROI)’ forms is considered to be among the most important reporting and recordkeeping efforts. Once established, a claims process for the affected worker can begin (i.e., receiving medical treatment and/or compensation).
The format utilized by a DOT to record injury data must be convenient, efficient, and enable the maintenance of injury records. The survey results indicated that an online database is the preferable option, with 73% of respondents employing an online database and 41% using discrete electronic means of documentation. However, 27% of responding agencies still use paper copies and another 5% reported that they do not use any specific format. A substantial need to enhance the injury reporting, record keeping, and data collection methods of state DOTs exists. The available methods used to collect and maintain injury data utilizing web-based platforms include Intelex Software, Velocity EHS software, and an internal Excel spreadsheet.
A near miss is an incident that does not cause injury or damage to equipment but has the high potential to do so. Reporting near misses improves the identification and control of hazards, further reducing risks and injuries by implementing corrective measures before an actual event takes place. Respondents were asked to indicate whether their agency has a system to report such occurrences and whether this system is complementary to reporting injuries. In total, 59% of the respondents indicated that their agency records near misses, while 38% of these agencies have a similar reporting procedure for near misses as for incidents causing injuries or fatalities. The differences in reporting near misses were identified through a thematic method of analyzing survey responses. The survey collected information regarding the reporting procedures for near misses, including whether identification was required, what information was collected, and who was responsible for reporting. The survey also asked about the reasons for not reporting near misses. The responses were analyzed to identify the different approaches to reporting near misses, including anonymous reporting, verbally reporting to a supervisor or safety officer, and conducting a joint investigation with the employee(s) involved and their supervisor. A study by Gambatese et al., 2017, found that the main reason for not reporting near misses was the absence of a precise definition of a near miss [
13]. Overall, the survey responses were used to identify the different approaches to reporting near misses and to provide recommendations for improving near-miss-reporting practices.
A study conducted by Marks et al. (2014) revealed that the prevailing approach to recording near misses is through a highly secure online database, particularly designed to facilitate queries based on industry-specific criteria. These databases consist of voluntarily submitted data, either contributed by the individuals directly involved in the incident or by eyewitnesses. While submissions can be made anonymously or with the identity of the reporting person disclosed, most of the literature examined reported a penchant for anonymous submissions. The study goes on to propose a comprehensive framework for a near-miss-reporting program that encompasses various domains, including the following: (1) general program information, (2) a comprehensive definition of a near miss, (3) the flow of information, (4) knowledge dissemination, (5) a checklist for near miss reports, (6) the establishment of a near miss database, (7) employee training activities, and (8) fostering an environment that encourages reporting, as well as diligent investigation processes [
14].
Furthermore, emphasizing the importance of documenting and tracing near misses regarding workplace safety in general and the relationship between near misses and injuries will encourage workplaces to employ near-miss-reporting practices [
15].
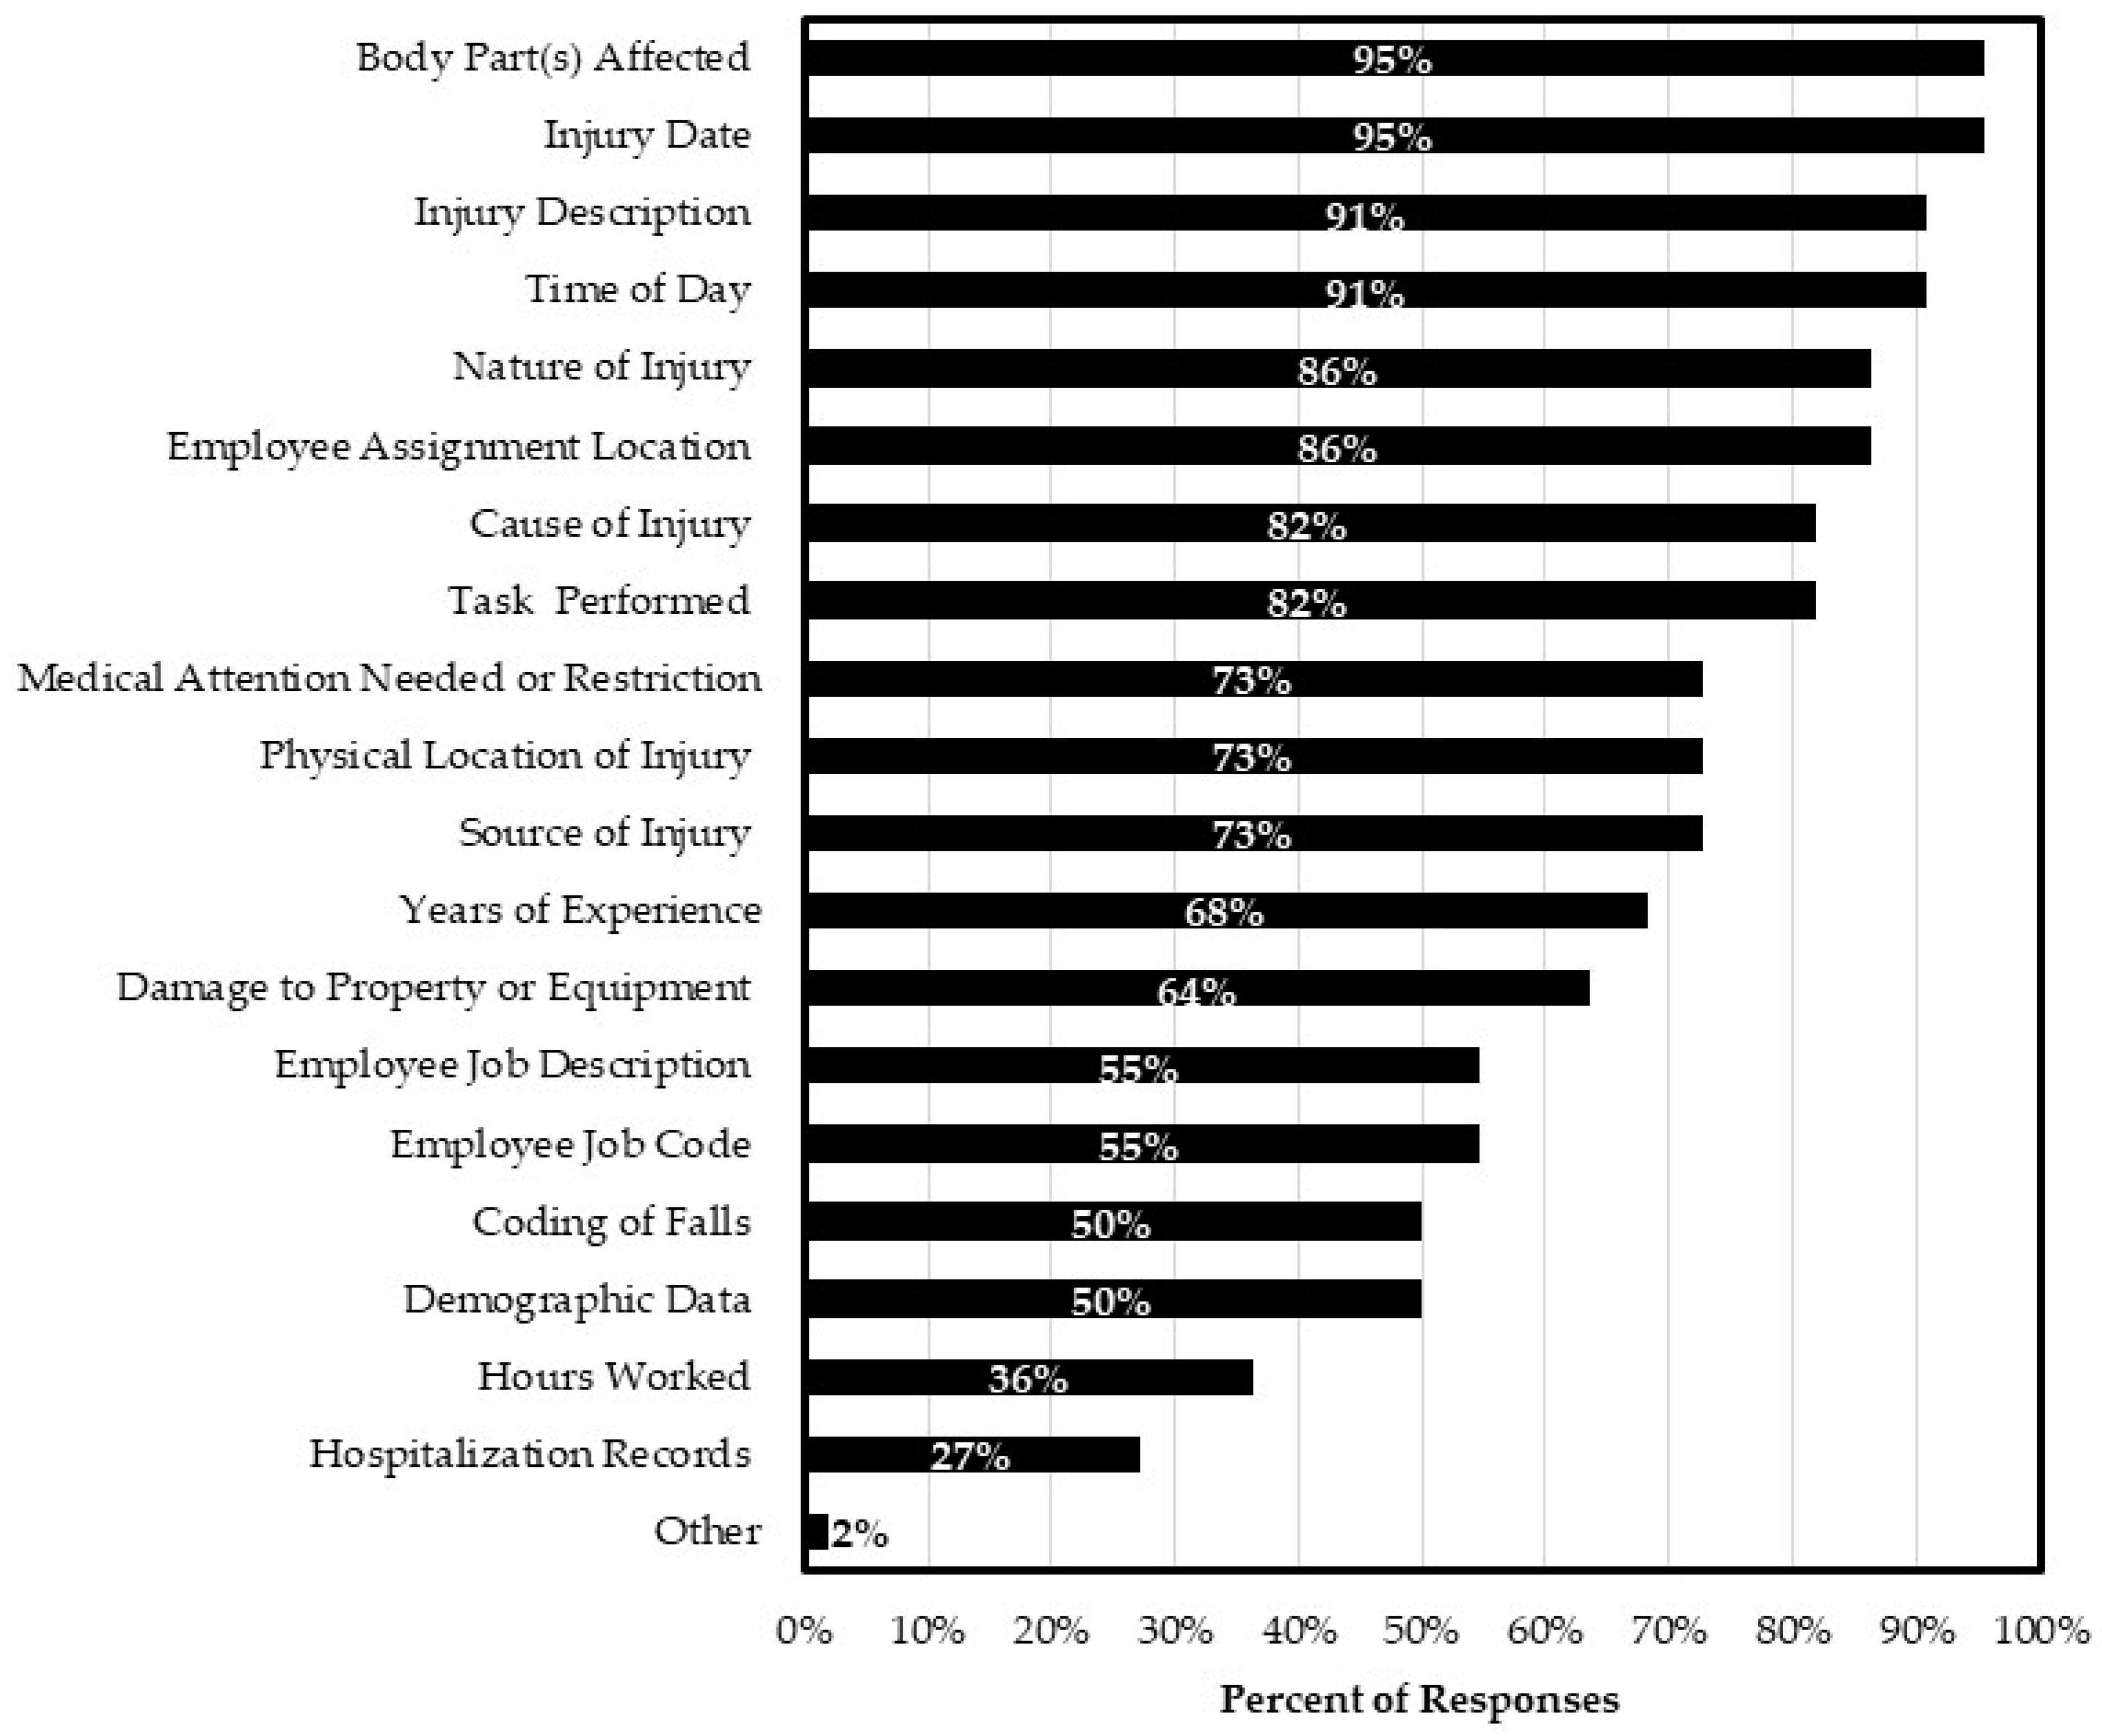
The survey collected information on the methods used by state DOTs to further categorize actual injuries within their databases.
Figure 5 displays the common injury classification criteria and is ranked according to the percentage of responses.
3.3. Injury Trends
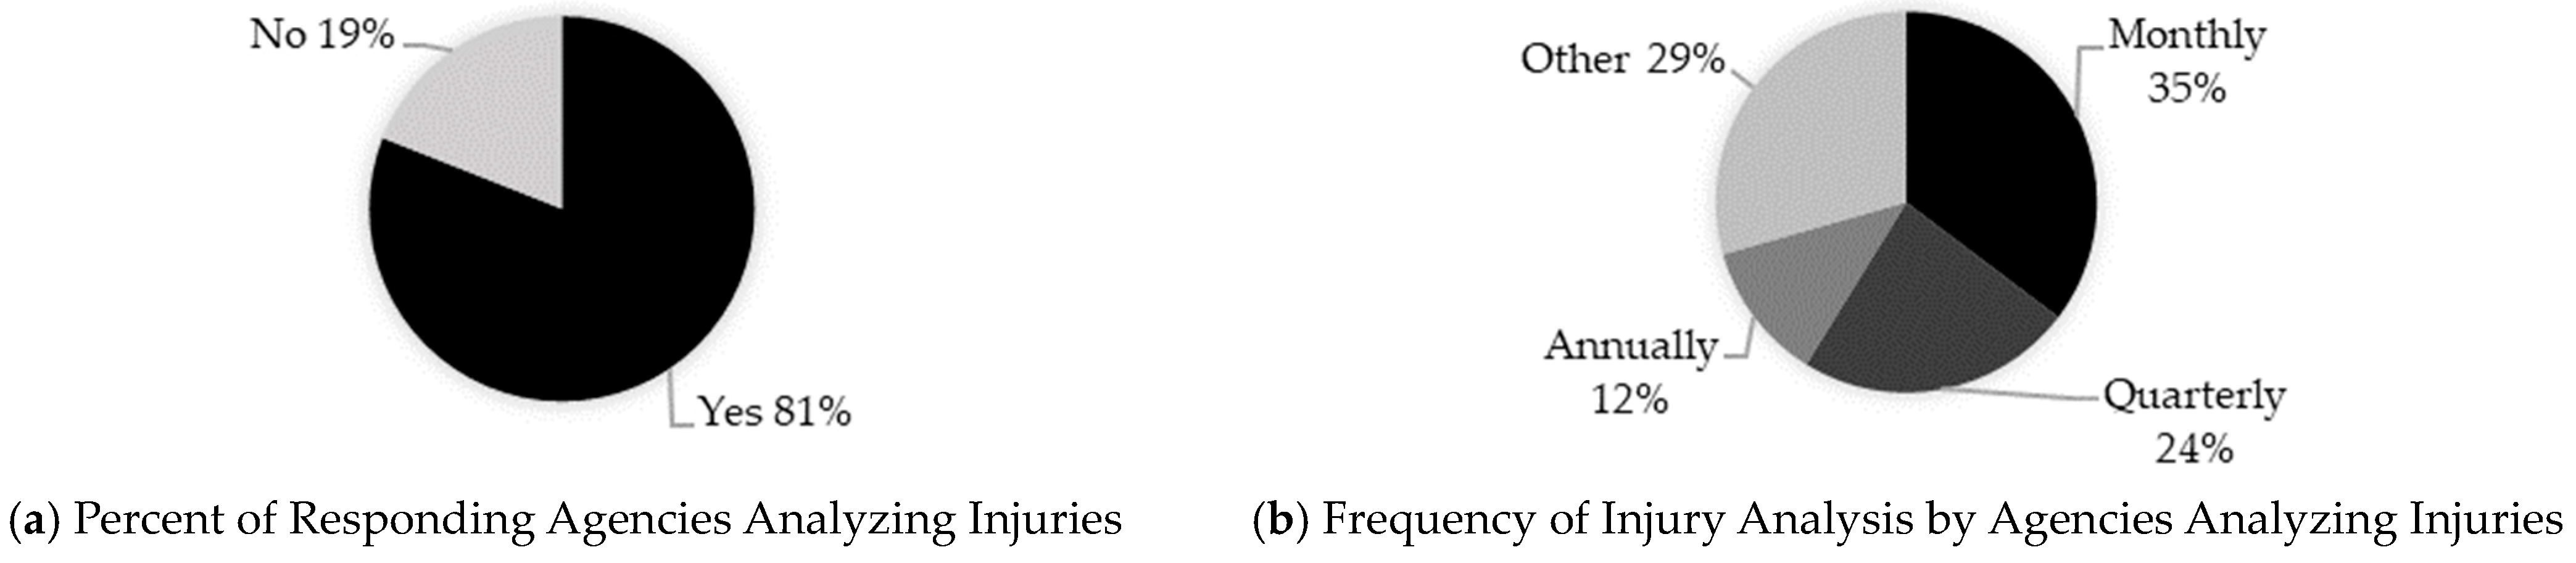
The survey identified common and unique injury trends experienced by state DOTs. Recognizing trends and common hazards facilitates the implementation of effective countermeasures, and the evaluation of successes and the comparison of different data sets and time frames. In total, 81% of the respondents reported that their agencies analyze injury trends consistently, as shown in
Figure 6a. Respondents who answered “Yes” to performing injury analysis were then prompted to indicate the frequency of the analysis. The most common analysis frequency reported was monthly, as shown in
Figure 6b. Other reported frequencies included weekly, depending on requests and agency demands.
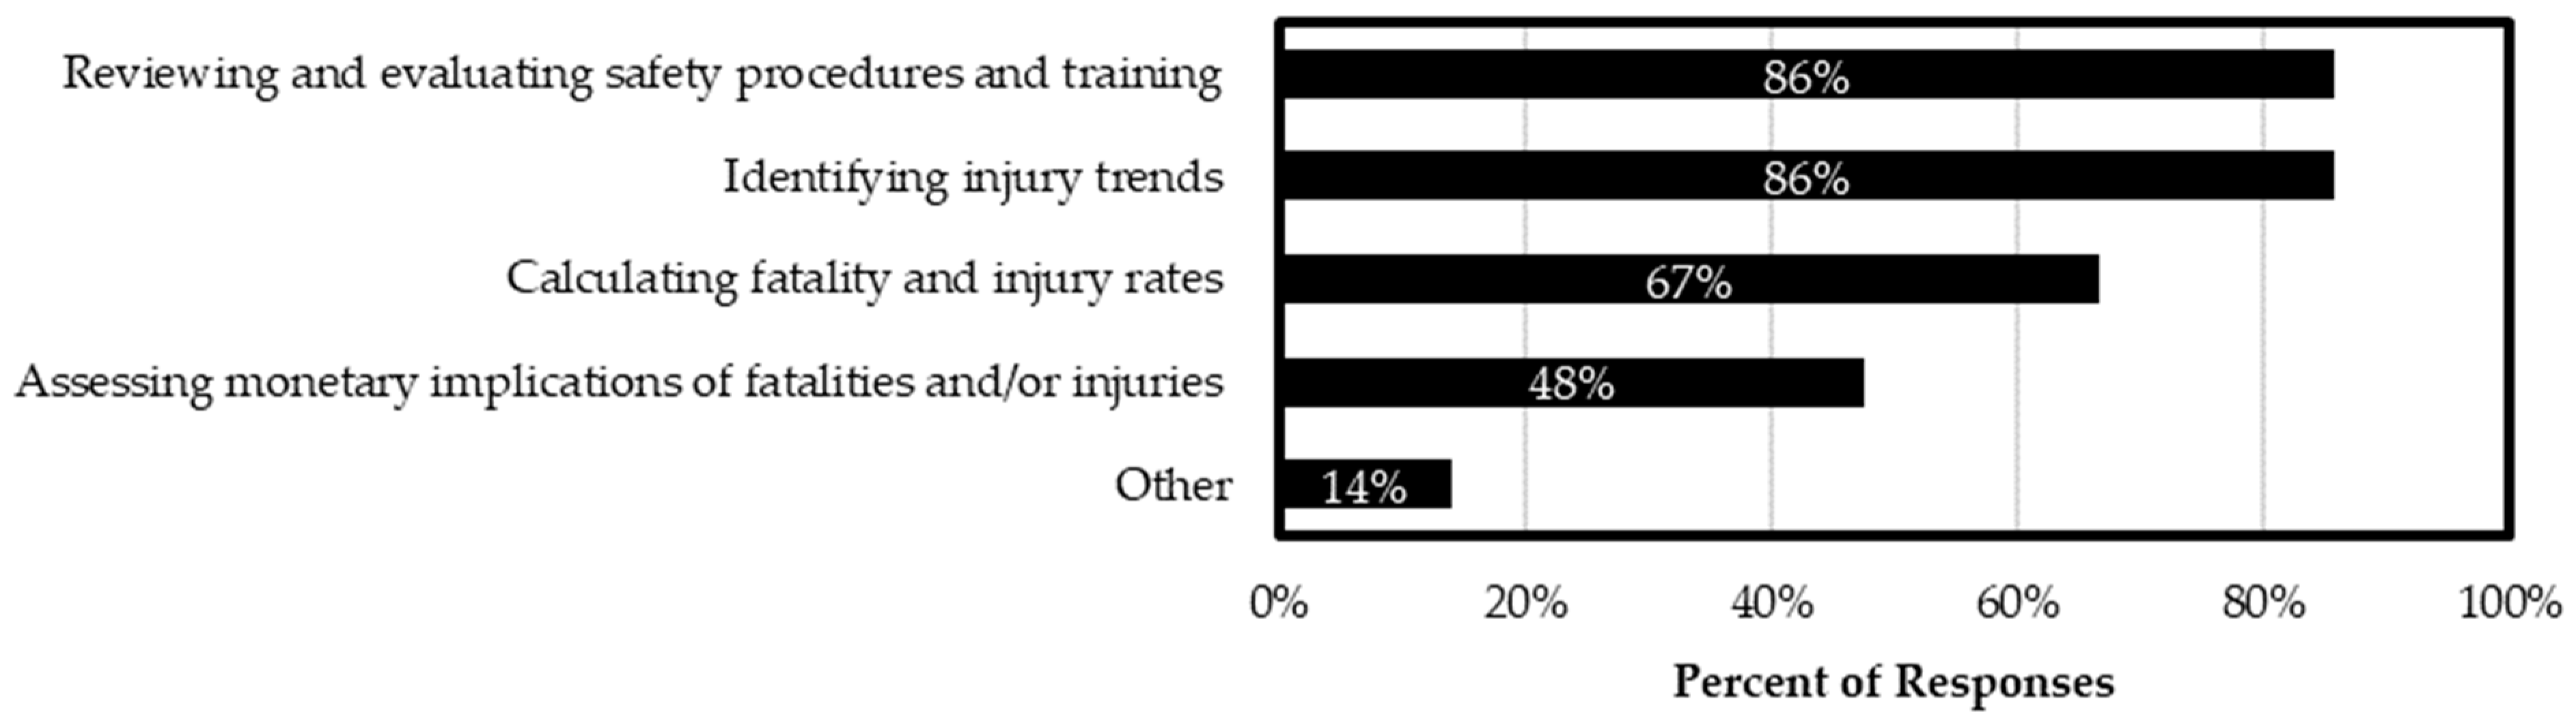
Maintaining records allows agencies to comply with mandatory OSHA regulations pertaining to recordkeeping. More critically, it also provides an efficient tool with which to identify injury trends, assess the monetary implications of fatalities and/or injuries, investigate current procedures, plan future improvements to guidelines and procedures, as well as evaluate the success of employed measures.
Figure 7 shows that the majority of responding agencies use injury records to review and evaluate safety procedures and training (86%), as well as identify injury trends (86%). Other reported uses included improving the recordkeeping, recording and evaluation process for senior leaders/supervisors.
Fatal injury rates assess the likelihood of sustaining a fatal work injury and are expressed as the ratio of fatalities per total hours worked per 100,000 full-time equivalent employees (FTE, working 40 h per week, 50 weeks per year). Nonfatal injury rates according to industry are calculated using hours worked data, expressed per 100 FTE [
16]. Rates can be utilized to explore the comparative number of injuries and/or fatalities among different DOTs, industries, and job descriptions, whether on a state or nationwide level.
Only two respondents reported a fatality rate of zero and one agency reported a rate of one per 100,000 FTE; meanwhile, the remaining respondents did not indicate a rate. Although the anonymity of the respondents was promised and the purpose of the survey was communicated, the low response rate might be explained by legal and liability concerns related to disclosing sensitive information. As for the non-fatal injury rate, 10 respondents reported rates ranging from 1.6 to 9.4 per 100 FTE, with an average of 4.05 and a median of 3.66 per 100 FTE.
Under-reporting is a factor that should be taken into consideration when calculating injury rates. It can lead to (1) a substantial underestimation of work-related injuries on the national level; (2) difficulty in identifying and addressing workplace hazards and risks; (3) the inability to accurately measure the effectiveness of safety and health programs; (4) the reduced ability to provide resources to high-hazard industries and occupations; (5) increased costs to workers, employers, and society due to lost productivity, medical expenses, and workers’ compensation claims; (6) reduced trust between workers and employers, which can negatively impact workplace safety culture; and (7) difficulty in accurately characterizing and eliminating barriers to gathering correct work-related injury and illness rates. Under-reporting can involve two types of actions: employers who provide incorrect information to the Bureau of Labor Statistics (BLS) regarding the number and severity of workplace injuries and illnesses, and employees who choose not to report their work-related injuries or illnesses to their employers. There are a number of reasons as to why under-reporting occurs, such as the inadequate recordkeeping practices of employers, a limited understanding of regulations among workers, the fear of job loss if injuries are reported, and employer programs that discourage the reporting of injuries by offering rewards or punishments. The Recordkeeping National Emphasis Program conducted by OSHA between 2009 and 2012 indicated that the fear of retaliation among workers and disciplinary measures implemented by employers are the primary factors contributing to under-reporting [
17].
The questionnaire requested respondents to identify the job description(s) or occupational group(s) that experienced or are most likely to experience the highest number of injuries. All respondents indicated that Transportation and Maintenance workers experience the highest number of injuries in their agencies, which is expected considering that this group constitutes the highest percentage of DOT employees and considering the hazardous nature of their assigned duties. Other job descriptions with high injury rates included Highway Incident Response staff, Equipment Operators & Toll Collectors, and Traffic Painters.
The survey investigated the most common injury characteristics suffered by employees. Certain types or characteristics of injuries occur more often than others. Examining such characteristics helps DOTs better understand and develop safety polices and countermeasures. The survey focused on four characteristics, namely the nature, source, and cause of injuries, and the body part affected.
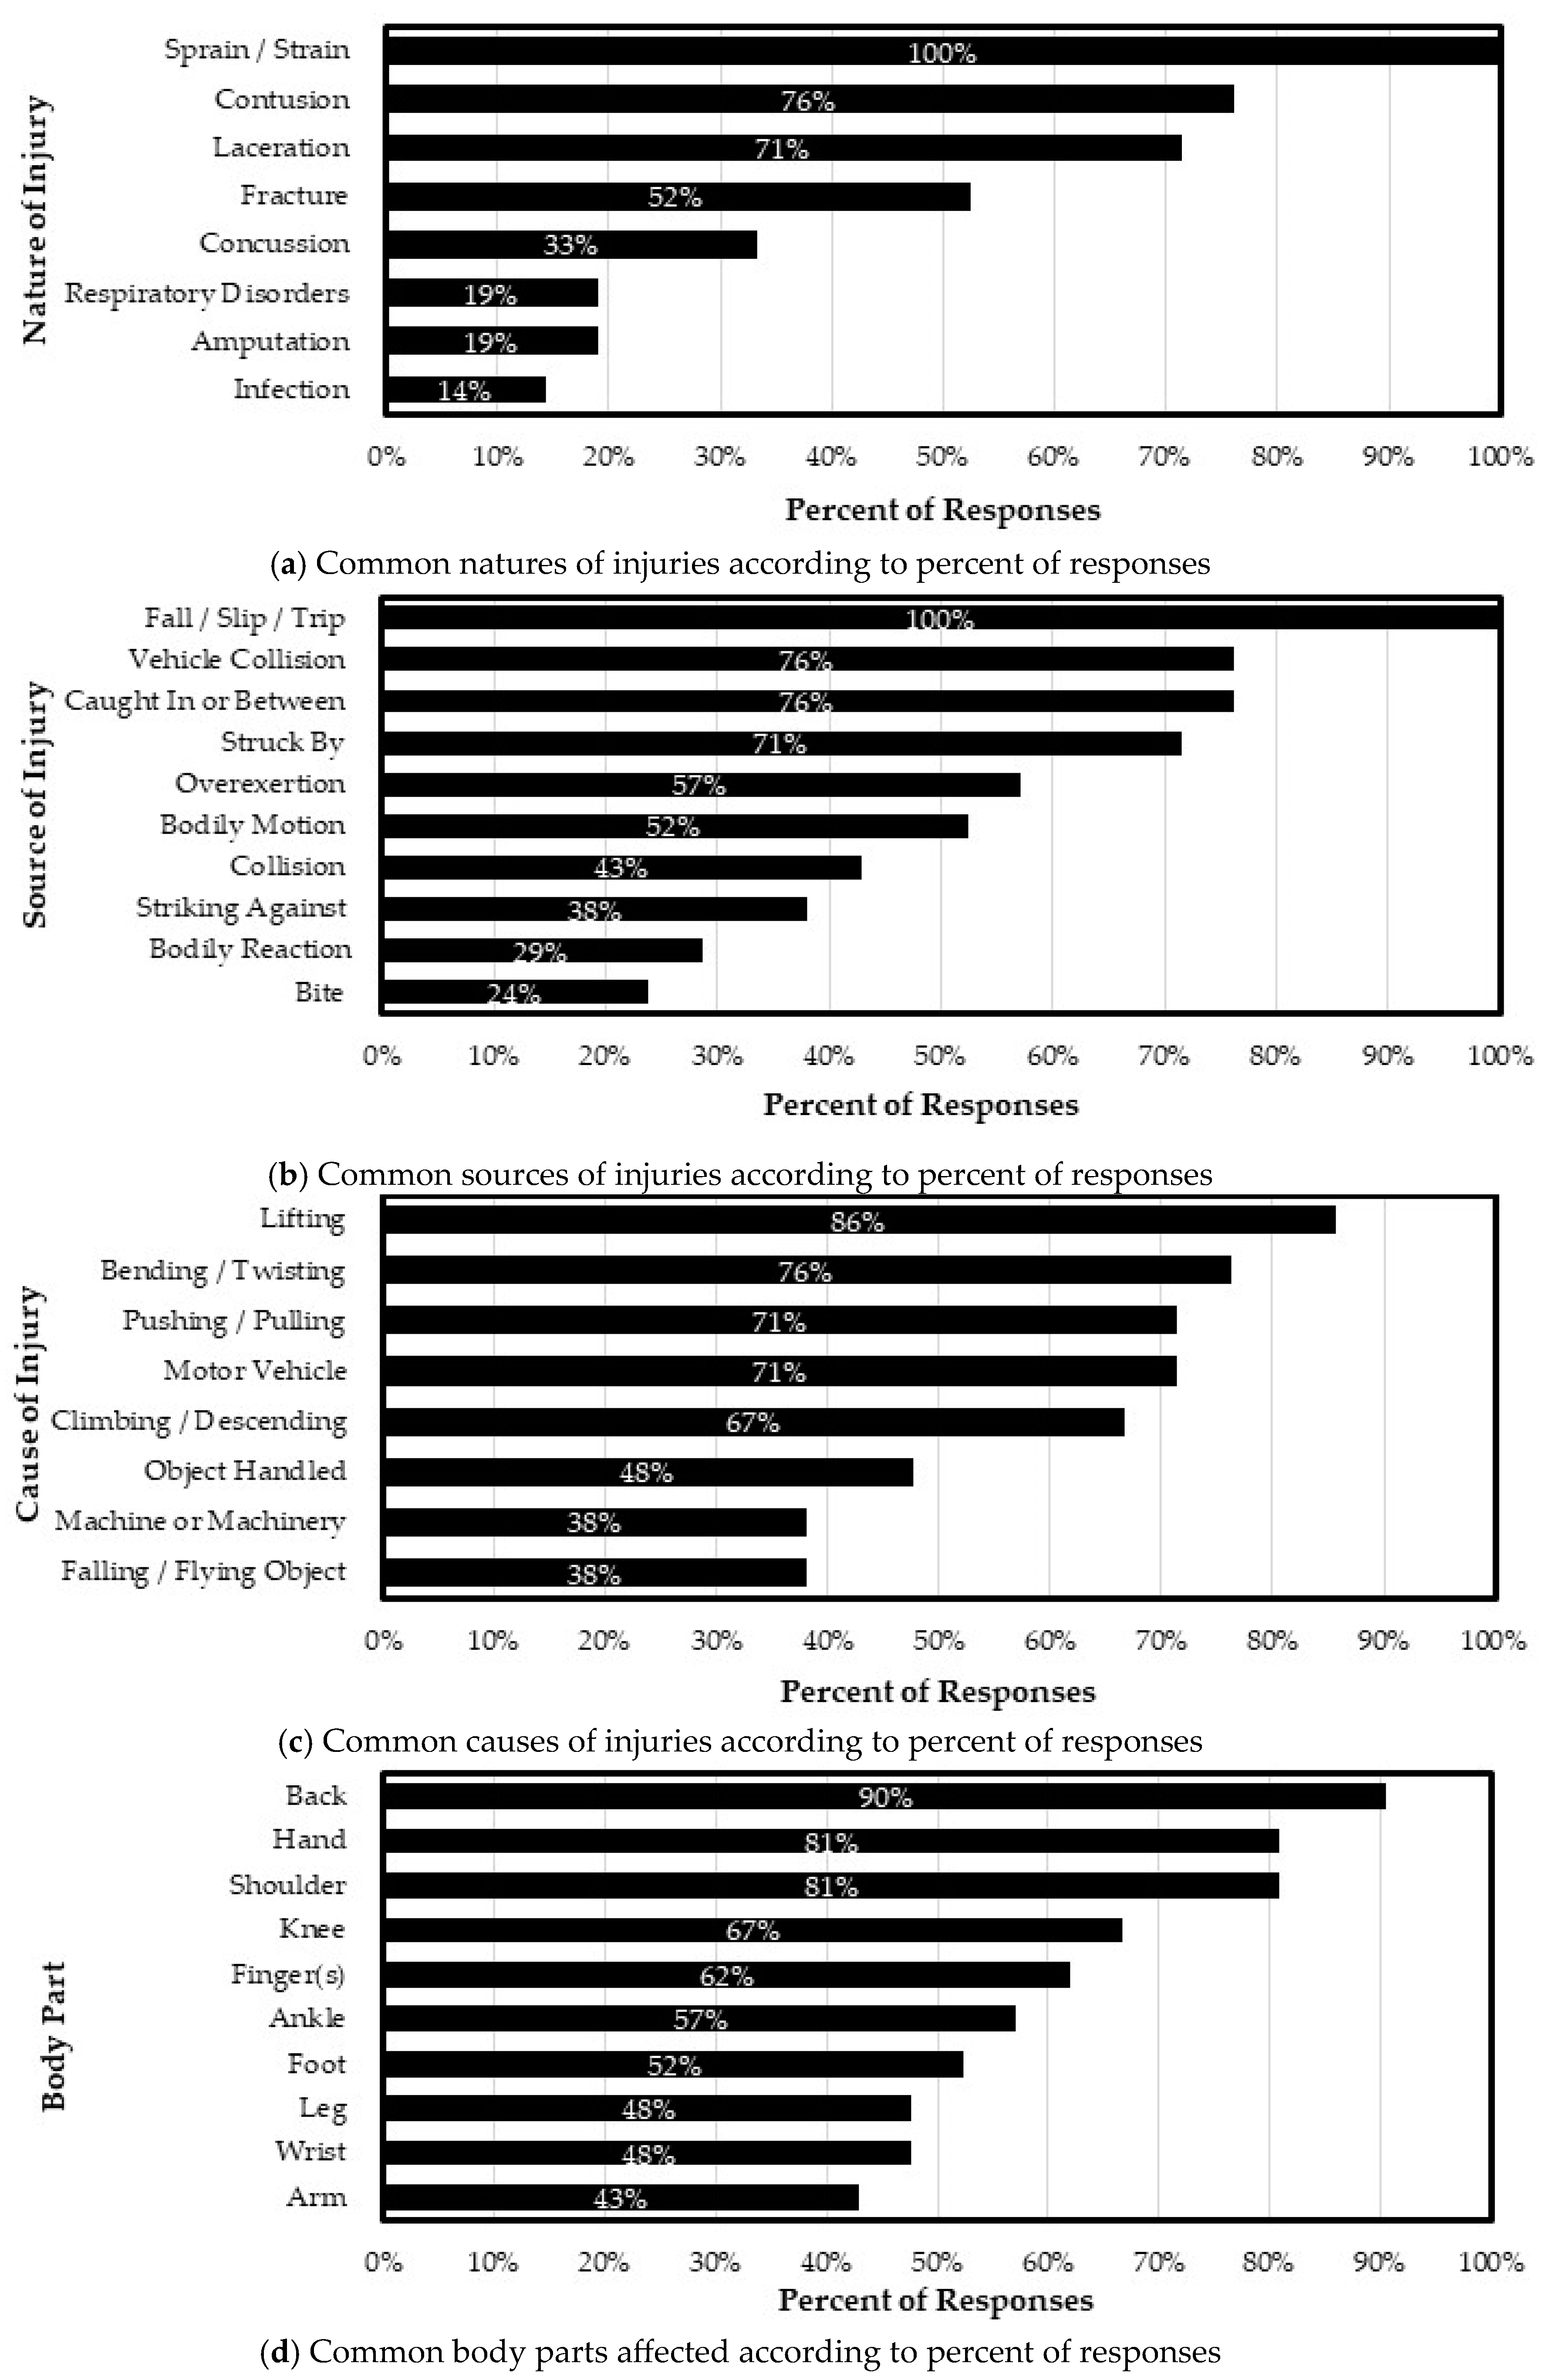
The nature of the injury is the principal physical characteristic(s) of the injury or illness [
18].
Figure 8a shows the most common natures of injury cited by responding agencies. The figure shows that the highest natures reported by agencies are sprain/strain with a 100% response rate, followed by contusion (76%), laceration (71%), and fracture (52%), respectively. These statistics are similar to the most common natures of nonfatal occupational injuries recorded in the 2020 Bureau of Labor Statistics (BLS) annual report for all industries [
19].
As part of the questionnaire, a distinction was made between the source and cause of injuries. The source mainly describes “the manner in which the injury was produced or inflicted” [
20], while the cause of injury identifies the object, substance, bodily motion, or exposure that directly produced or inflicted the injury. The most cited sources of injury according to the percentage of responses are shown in
Figure 8b, with Fall/Slip/Trip (100%), Vehicle Collision (76%), Caught In or Between (76%), Struck By (71%), and Overexertion (57%).
The causes reported by respondents are shown in
Figure 8c, which indicates that Lifting (86%), Bending/Twisting (76%), Motor Vehicle (71%), Pushing/Pulling (71%), and Climbing/Descending (67%) are the top five reported causes of injuries. It is worth noting that Lifting, Bending/Twisting, Pushing/Pulling, and Climbing/Descending can all be listed under Overexertion and Bodily Motion.
Figure 8d shows the most affected body parts, according to the percent of responses. The top five most frequently injured body parts reported were the back (90%), hand and shoulder (81%), knees (67%), and fingers (62%).
The manner of addressing the hazards resulting in near misses, injuries, or fatalities was also explored.
Figure 9 shows the methods used to address hazards, according to the percent of responses. In total, 90% of the respondents indicated that hazards are investigated when an injury or a near miss is reported. Only 10% stated that their agencies have a yearly budget allocated for correcting hazards. One other reported method was toolbox/tailgate meetings that aim to specifically recognize the hazards that employees will encounter during a specific job.
3.4. Data Collection
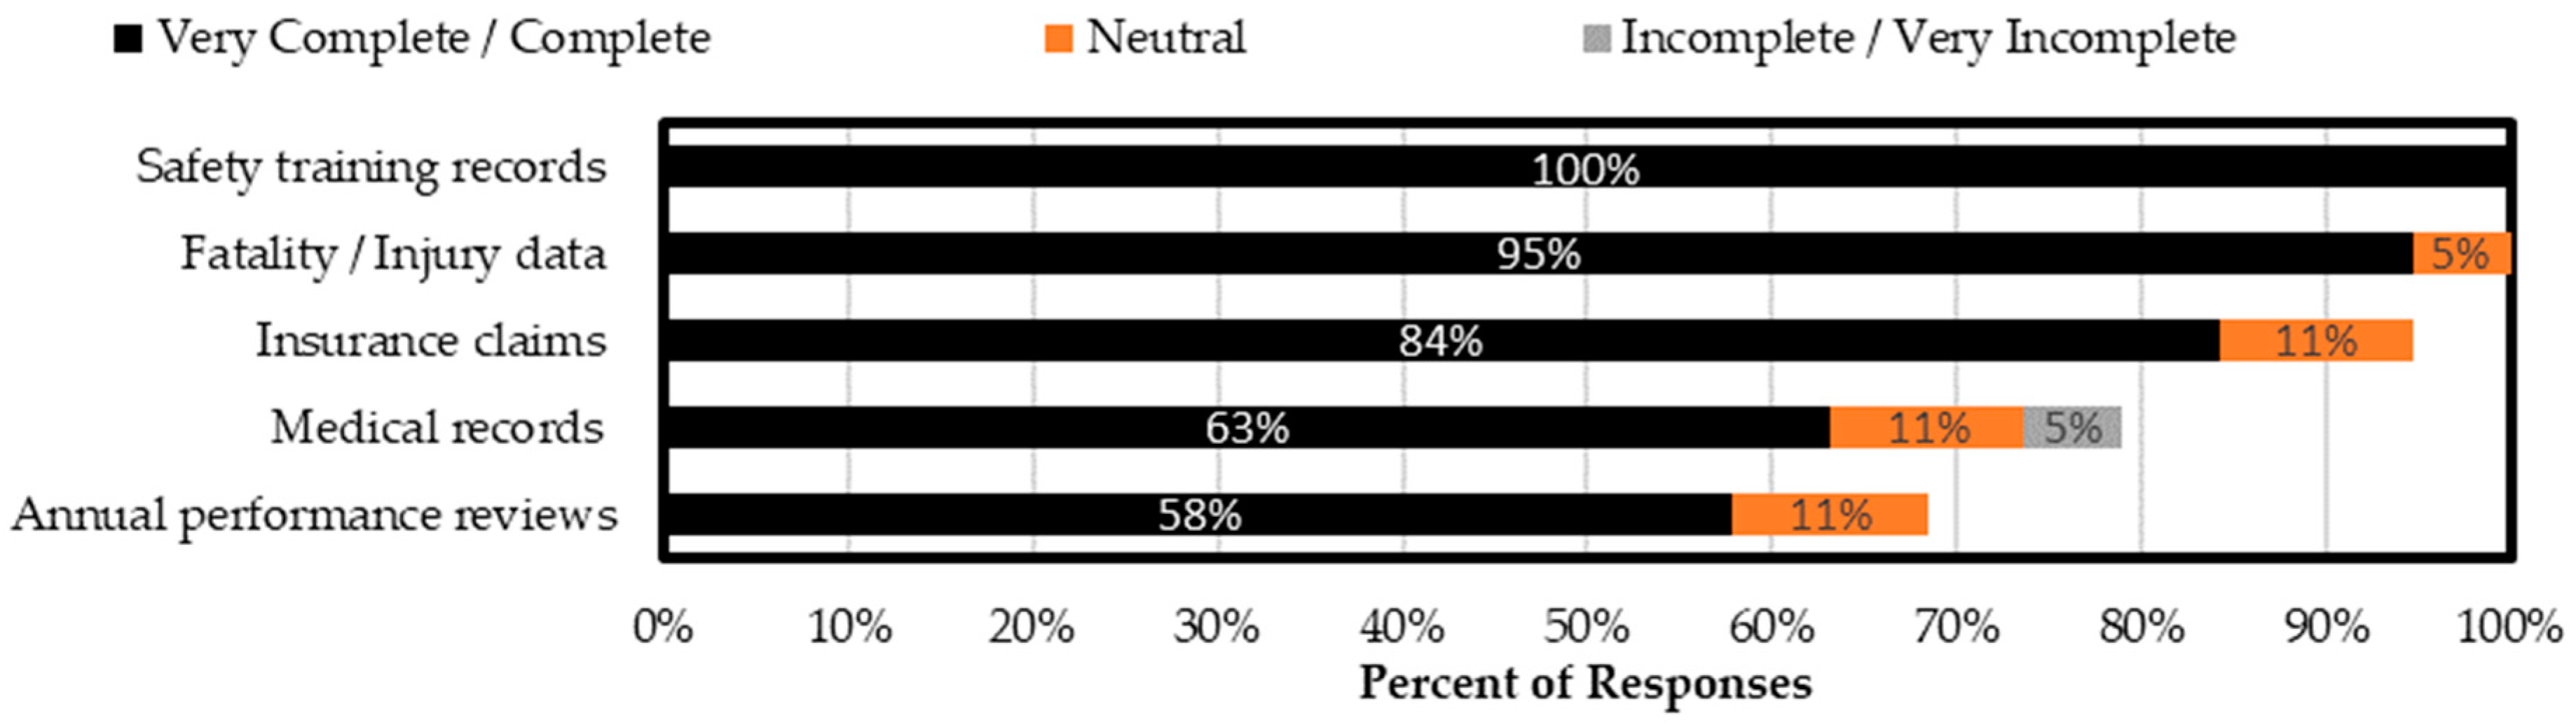
Part four of the survey sought to examine the sources of data available and analyzed by different agencies. Respondents were requested to check all available datasets used by their state DOT, as well as rank these sources based on the completeness of available information. “Completeness” refers to the extent to which the database contains all the relevant records and data elements that it should, i.e., the number of missing records and the number of missing data elements within existing records. A data element refers to an individual field or piece of information that is coded within each record. For example, in a sprain injury record, data elements might include the date and time of the injury, the location, the task performed during injury, and the severity of the injury sustained. “Complete” signifies that the dataset has no missing records, but might have missing data elements; however, the adequacy of the dataset is not compromised. Meanwhile, “Very Complete” indicates a higher degree of completeness and excellence. On the other hand, “Incomplete” suggests that the information in the dataset is partially unfinished, while “Very Incomplete” indicates a more severe level of incompleteness. The choice between these scales depends on the level of detail and differentiation needed to capture the data. The authors chose to combine the scale of “Very Complete” with “Complete”, as well as “Incomplete” with “Very incomplete”, for (1) simplicity and ease of interpretation, (2) ease of reporting and visualization, (3) more meaningful comparisons, (4) a reduction in data noise, and (5) to avoid subjectivity and inconsistency in the responses.
Most available sources identified in the survey included safety training records, injury/fatality data, and insurance claims, as seen in
Figure 10. Respondents were asked to rank these sources on a scale from 1–5, 5 being very complete and 1 being very incomplete. The average “completeness” rank was as follows: safety training records (4.6), fatality/injury data (4.5), insurance claims (4.1), medical records (3.4), and annual performance reviews (3.2). These sources include much of the main safety information necessary for reviewing, improving, and evaluating safety programs and policies. Medical records and annual performance reviews scored lower in completeness, which may indicate restrictions on the availability of information due to confidentiality or health information privacy concerns.
A study by McInnes et al., 2014, identified three primary sources for data collection: compensation claims, emergency department data, and hospital admissions data. Each of these sources provides a unique perspective on the historical trends of injuries. The research aimed to compare how different datasets captured the weight of occupational injuries based on injury- or population-level characteristics. Interestingly, workers’ compensation and emergency department data demonstrated a decline in injury risk over time. In contrast, hospital admissions data revealed an elevated risk of injuries. Analyses further indicated that emergency department data accounted for the highest rate of injuries among younger workers and a significant percentage of open-wound and burn injuries. On the other hand, workers’ compensation data accounted for the highest percentage of musculoskeletal injuries. Fracture injury rates were comparable amongst all three datasets. Based on these findings, it becomes evident that utilizing various data sources for occupational injury investigation can influence different inferences in relation to injury trends. Therefore, it is important to use multiple data sources to obtain a more comprehensive understanding of work-related injuries. The study also highlights the need for the ongoing monitoring and evaluation of work-related injury surveillance systems to ensure that they are capturing accurate and complete data [
21].
In total, 74% of the respondents indicated that the previously mentioned data are integrated into programmatic decision making in relation to worker safety. To gain a better understanding of how different state DOTs integrate available data into their decision-making process, the survey asked respondents to elaborate. The survey collected the following responses:
Hazard recognition and elimination;
Updating training and awareness programs for specific jobs and conditions;
Calculating injury and incident rates, which are then used to modify or implement policies;
Reviewing safety/injury data for budgetary and hiring processes;
Identifying areas with repeated issues;
Re-aligning work habits to better protect employees against hazards;
Evaluating senior leaders based on safety performance;
Advocating for funding and policy updates.
An additional factor that needs to be considered is how quickly data are available after an incident occurs. Obtaining information on injuries in a timely manner is crucial for updating and adjusting strategies based on current problem areas or injury trends. In total, 63% of agencies indicated that data become available immediately after an incident, 26% obtain data within a few days, and 11% have the information available within a week, as shown in
Figure 11.
An important measure of any safety program is ensuring that on-going data analysis pertaining to work injuries and associated costs, as well as assessments of the effectiveness of countermeasures, are being performed. In total, 79% of the respondents answered “Yes” to conducting previous or ongoing analysis. The processes reported were as follows: (1) making queries to the database, (2) developing a platform able to gather and compare data, (3) tracking multiple metrics on a monthly basis, (4) reviewing collected data on a regional/statewide basis during high-level executive management meetings to ensure the dissemination of information, (5) evaluating injury trends based on all compensation claims to identify short- and long-term solutions, and (6) reviewing incidents on a weekly basis with the agency’s safety team and a third-party administrator.
3.5. Training
The next section of the questionnaire involved questions about the safety training programs provided at different state DOTs. A successful training program should be designed to build and improve practical skills and knowledge so that tasks are performed efficiently and safely. Employees of different state DOTs have common tasks and shared training topics. Agencies can benefit from the experience of peer DOTs, while at the same time tailoring their training programs to accommodate the specific needs and concerns of their state agency.
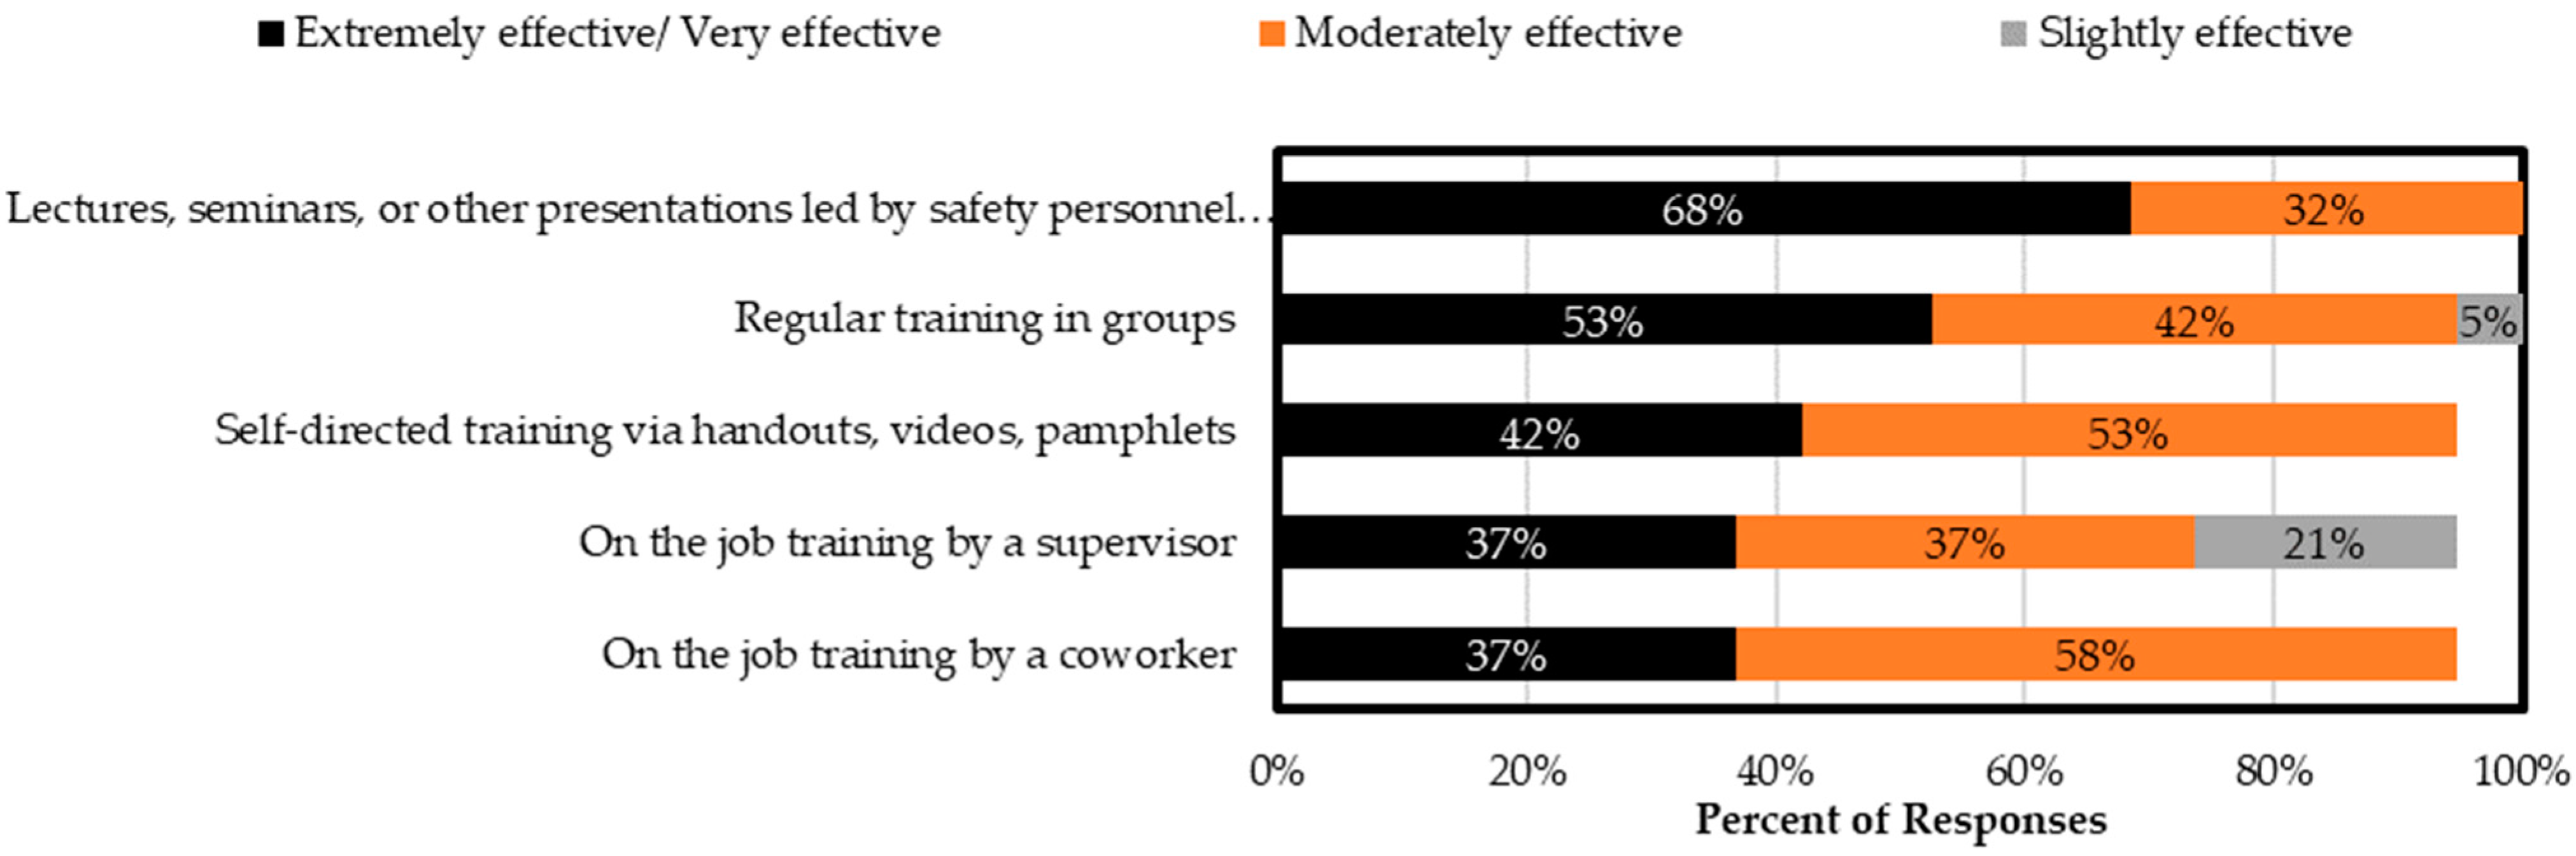
It was found that 84% of the responding agencies address OSHA regulations or follow an OSHA-approved State Plan for training, with these agencies reporting the provision of similar types of training at their agency. In total, 100% of the respondents reported the provision of regular training in groups, as well as lectures, seminars, or other presentations led by safety personnel; meanwhile, 95% of agencies reported providing on-the-job training led by a supervisor or coworker and self-directed training via handouts, videos, or pamphlets. The question also instructed respondents to rate the type of training based on effectiveness. The effectiveness was judged according to how well the type of training contributes to the success of the agency’s safety program, worker satisfaction and performance improvements.
Figure 12 below shows the different types of training practiced at state DOTs ranked by their degree of effectiveness. The most effective type of training found in the survey was lectures, seminars, or other presentations, with 68% of respondents reporting that they are extremely or very effective. The least effective training type, as reported by respondents, was on-the-job training led by a supervisor or coworker.
It is particularly important to offer updated training regularly to address new hazards that can arise from adjustments to job tasks or procedures. OSHA also requires more frequent training if worker conduct indicates that previous training has been insufficient or not completely grasped [
22].
Figure 13 below shows the frequency of training offered according to the percent of responses. The figure illustrates that the majority of responding DOTs (84%) offer training during employee onboarding, while 26% offer training once a year. Although the training requirements of the OSHA standards state that training is to be conducted at least once a year, it is urged that safety meetings, discussions and drills be organized more often [
22]. This is consistent with the survey responses, which indicate that training is offered multiple times throughout the year (i.e., more than once a month, monthly, and more than once a year).
The survey further solicited feedback on the training topics offered at different DOTs. Responses included training on litter pickup, ergonomics, poisonous plants, insects, terrain hazards, confined spaces, Mine Safety and Health Administration (MSHA), tower climbing and rescue, lock-out/tag out, trenching/excavation, defensive driving, traffic-control-related topics, maintenance-activity-related topics, loading/unloading equipment, preventing runovers/backovers, fall protection, and homeless encampment cleanup.
3.6. Safety Program Funding, Related Topics and Procedures
The final section of the survey investigated different safety focuses amongst state DOTs. In total, 60% of the respondents indicated that their agency has a current safety focus, program, theme, or initiative(s), which included:
C.A.R.E.S program: C: Communicate; A: Ask questions; R: Responsibility; E: Empower; S: Share (Utah DOT);
ALSAFE go the extra mile for safety (Alabama DOT);
Everyone Goes Home Safely (Kansas DOT);
What’s your Why (Washington DOT);
Leading Indicators and the Culture of Safety (Washington DOT);
Think Safe Work Safe all the time (Mississippi DOT);
Stop Work Authority-type campaign (Texas DOT);
A focus on trenching and the proper use of wheel chocks (Wyoming DOT);
A safety award program that awards each department with zero or the lowest number of recordable/lost time injuries and equipment damage (West Virginia DOT).
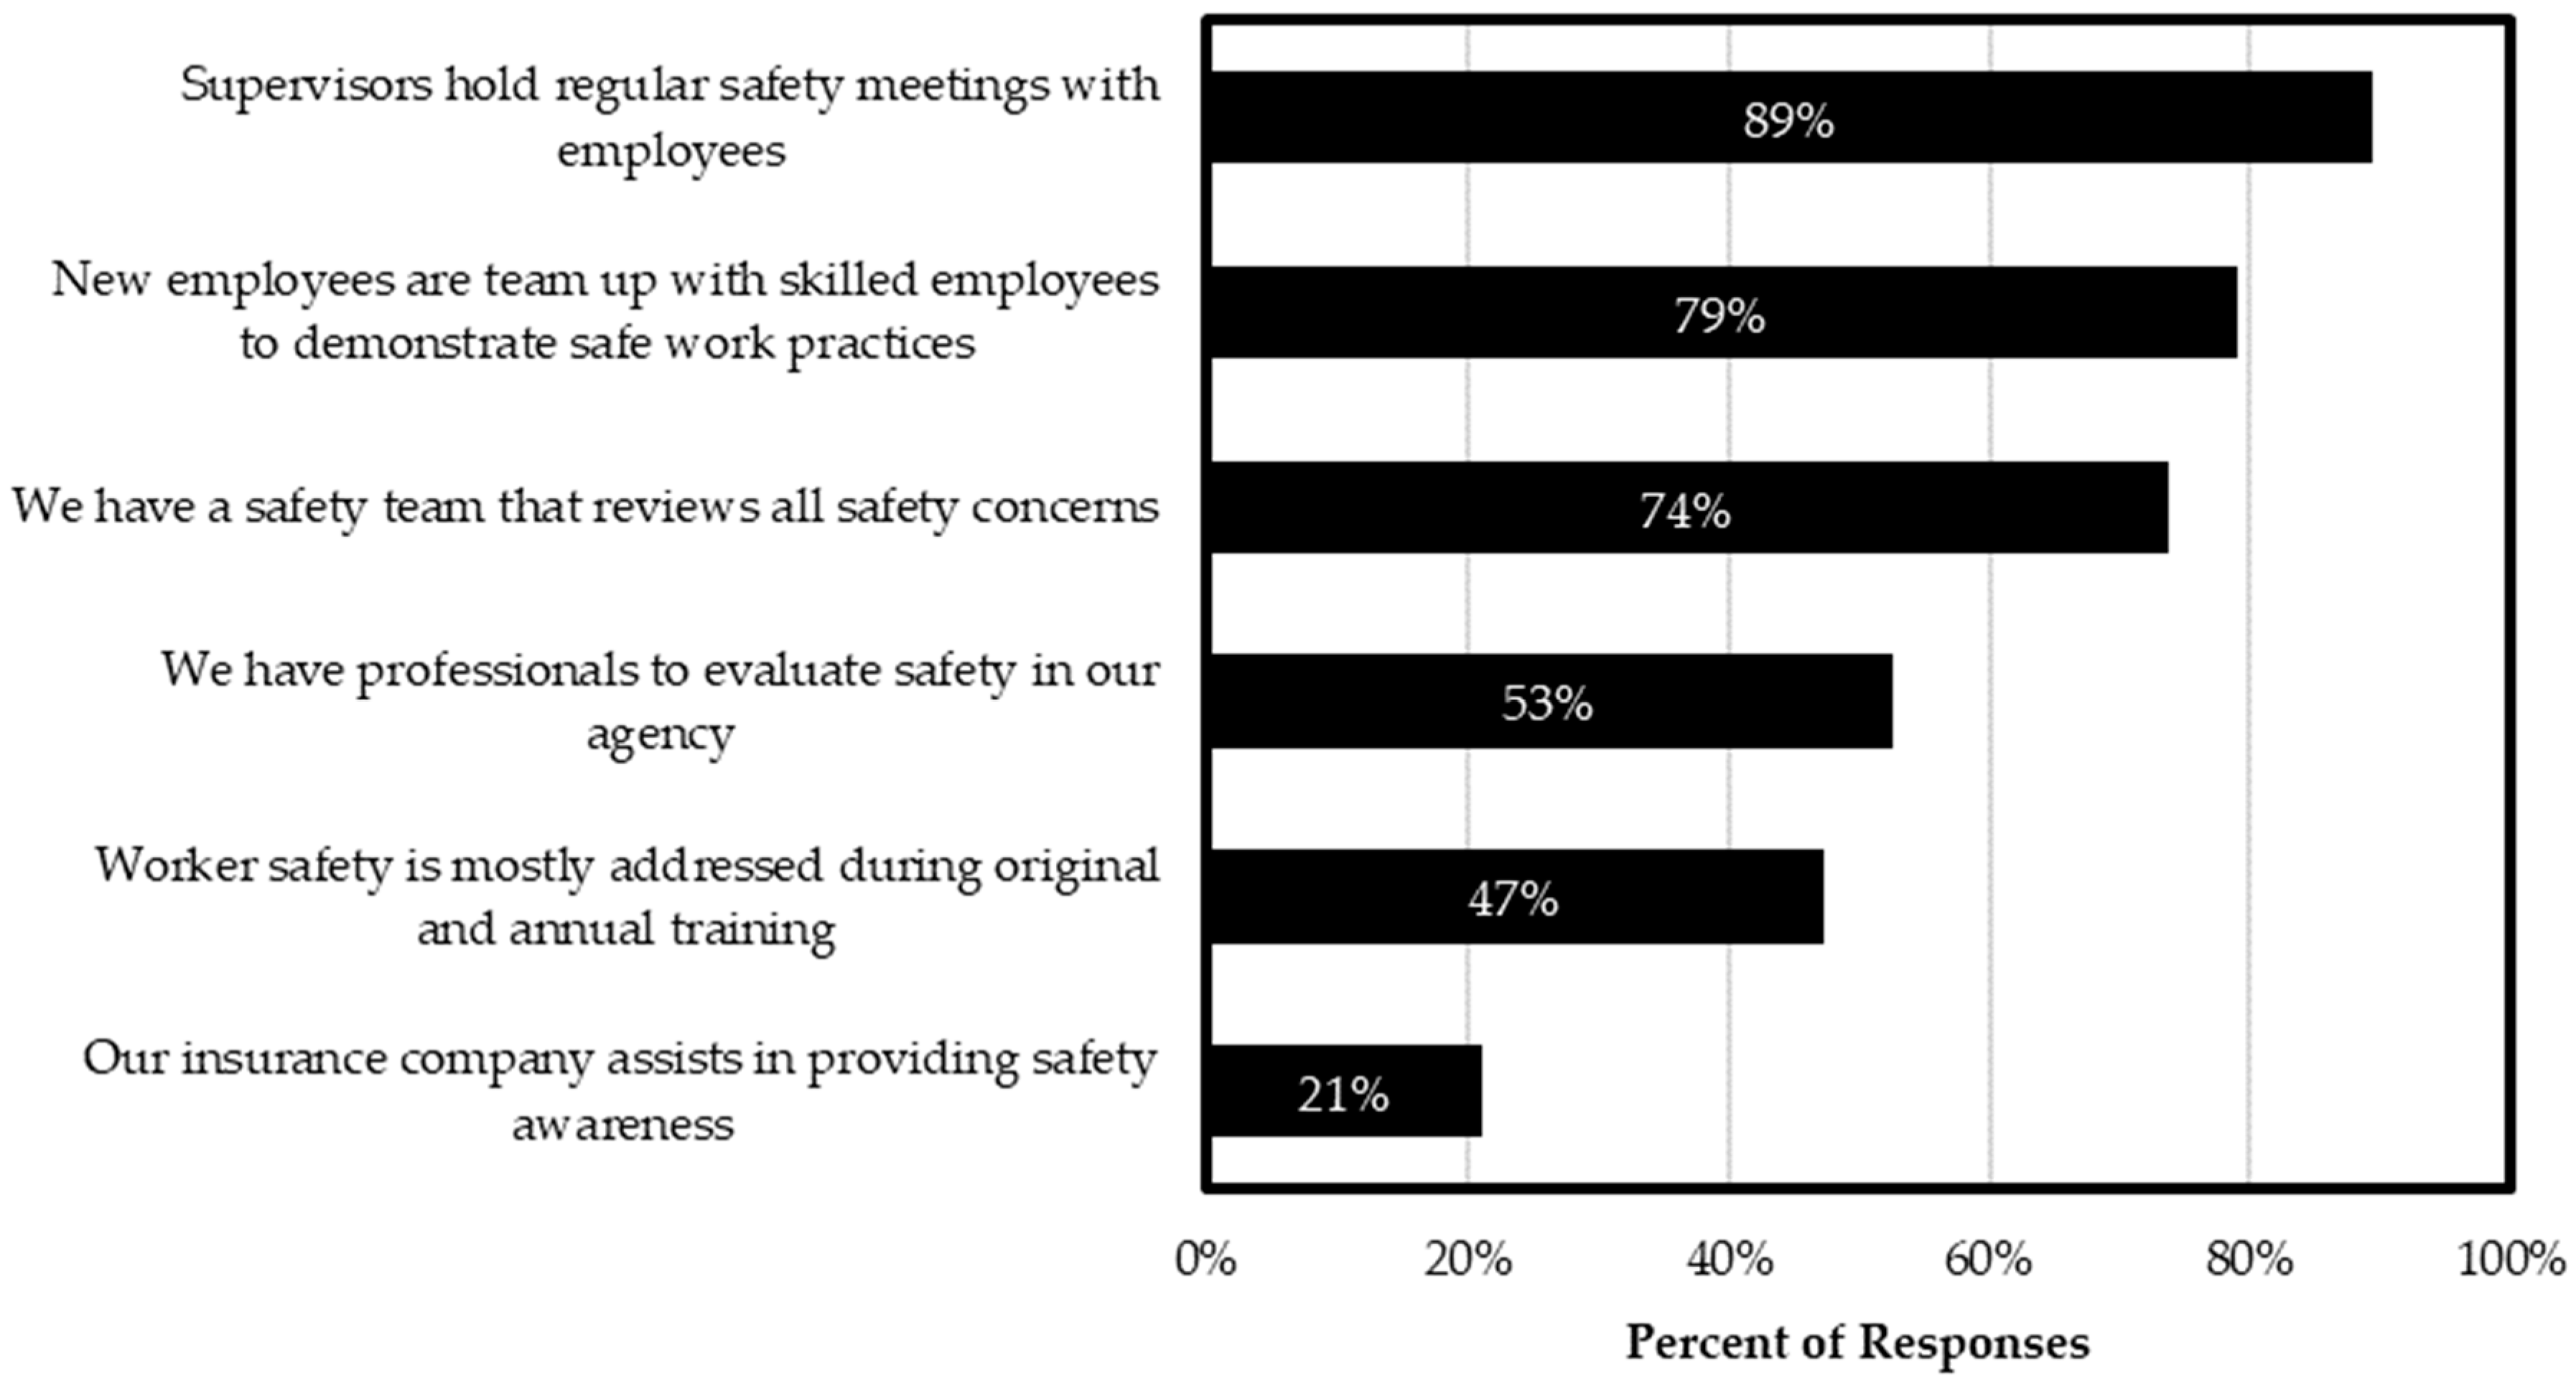
Regarding the frequency with which safety meetings are held, 89% of the respondents indicated that their supervisors hold regular safety meetings with employees, as shown in
Figure 14. The least reported element of the safety focus was acquiring safety and health guidance from the insurance company of the state DOT. Other reported elements included the following: communication, safety orientations, training throughout the year as needed, conducting incident safety reviews, encouraging the use of a safety application in safety meetings and daily safety huddles, and working hard to use all safety and injury information effectively.
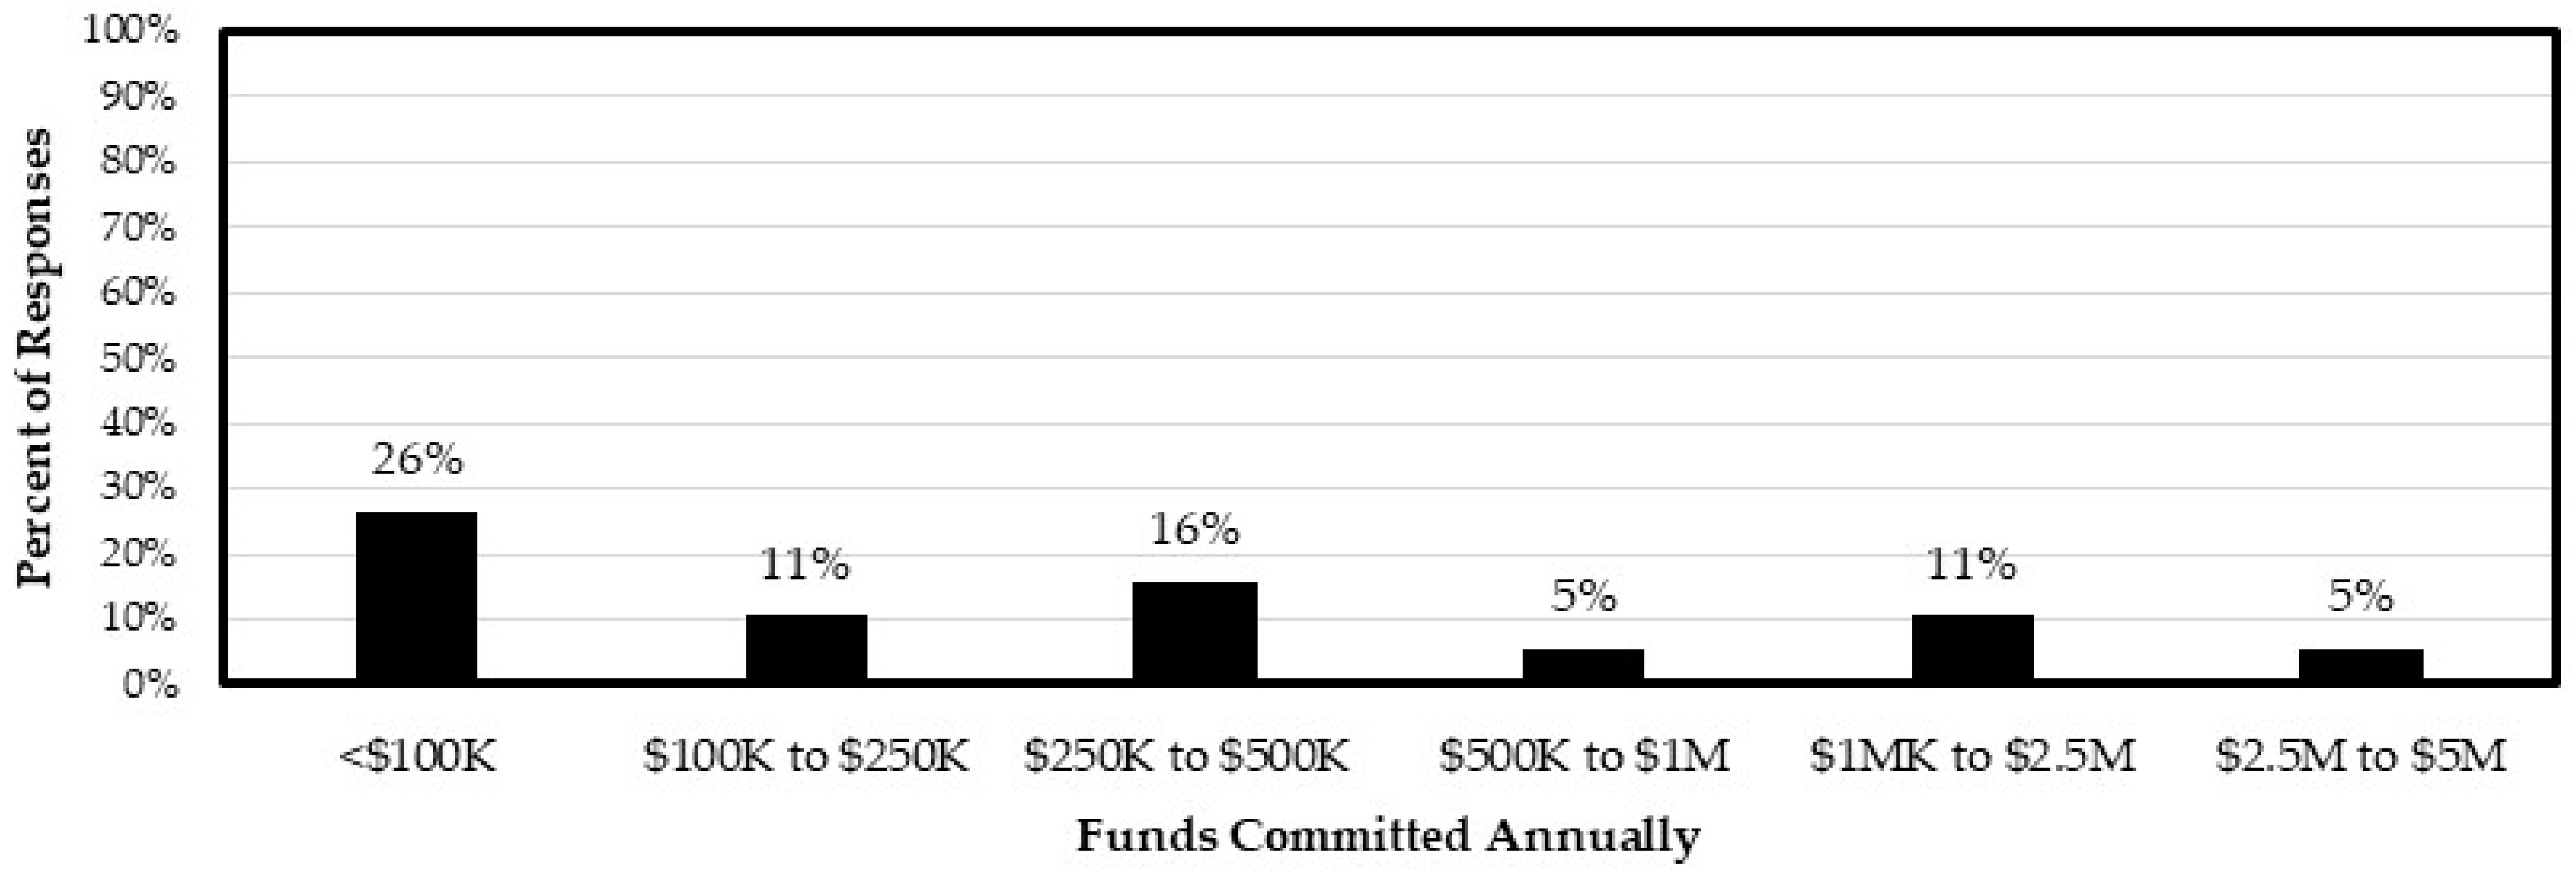
The survey also explored the percentage of DOTs committing funds annually to the successful implementation of a safety program and/or safety initiative(s). In total, 74% of the respondents indicated that their agencies commit funds annually to the implementation of a safety program and/or safety initiative(s). The amount of funds committed annually according to the percent of responses is shown in
Figure 15. The respondents reported to commit USD 2.5 M to USD 5 M had more than 10,000 employees at their agency, with a zero-fatality rate and the lowest reported non-fatal injury rate of 0.94 per 100 FTE.
4. Discussion, Conclusions and Recommendations
According to the responses collected, the size of DOTs (by number of employees) varies greatly; this can be influenced by the lane miles of state highways, the number of bridge structures, the population, passenger trips per year, etc. Nevertheless, over 60% of respondents reported that more than half of their employees work in construction/maintenance operations, which highlights the necessity for DOTs to prioritize worker safety given the inherent hazards associated with these operations.
Agencies who admitted to using no specific format or a paper copy format also did not report near misses and were smaller agencies, with 2000–4000 employees. Additionally, they responded “No” to integrating worker safety data into programmatic decision making in relation to worker safety. The largest state agencies, with 7000–10,000 and more than 10,000 employees, were more likely to use an “Other” type of categorization such as Intelex, and commit USD 250,000 to USD 500,000 towards the implementation of a safety program. Agencies with no specific format also reported that their state committed less than USD 100 K annually towards the implementation of safety programs and/or initiatives. The U.S. National Research Council has stated that the funding for transportation department workers training is inadequate. Research has shown that successful private and federal agencies invest 2% of wages in training, which is four times higher than the amount that DOTs typically spend on training. Investing 2% of wages corresponds to 40 h of training per employee per year [
23].
All responding agencies have records of workplace injuries, which include information provided by third parties (i.e., insurance claims and medical records). These records include essential information that can be utilized for the development of future safety initiatives. Such records are usually mandated by state law and/or OSHA regulations. Therefore, the high level of completeness reported regarding such data is expected. Although these data are available and adequately complete, DOTs are not utilizing the full advantage of this information. According to research published by The National Cooperative Highway Research Program (NCHRP), the available information is insufficiently integrated into administrative decision making as it relates to worker safety. Such a lack of integration can decrease the efficiency of an agency’s risk management plan. Integrating all available information and safety records facilitates the development or enhancement of safety programs and the recognition of injury trends [
10].
Nineteen percent of the respondents indicated that their agencies do not analyze injury trends and more than half of respondents (55%) who work closely with injury claims indicated that they were not aware of the injury or fatality rates at their agency. Incident rates (i.e., near miss, injury, or fatality rates) are collectively known as lagging indicators. Safety programs established based on lagging indicators are more popular in the construction and maintenance sector and can reveal the level of safety performance in an organization [
13]; they can also help to assess the efficiency of implemented safety controls. Many worker safety programs are designed to monitor lagging indicators; however, a modern approach includes analyzing leading indicators. OSHA defines leading indicators as “proactive, preventive, and predictive measures that provide information about the effective performance of safety and health activities” ([
23], p. 2). This approach is currently employed by the Texas DOT, which began collaborating with a third party to fully automate the tracking of leading indicators, and integrate data on training, hazard evaluation, job hazard analysis, near misses, etc., into the incident reporting system. This approach also enables trends to be analyzed and the efficiency of their safety program to be assessed [
24]. However, there are several challenges associated with adopting leading indicators for assessment. One challenge is that the selection of safety indicators is a complex task that is influenced by theoretical perspectives and personal beliefs regarding the definition and explanation of safety. Furthermore, the inconsistent use of leading/lagging terminology in reference to these indicators can be problematic and hinder understanding. The assumption that leading indicators measured at one point in time will accurately predict safety outcomes at a later point in time is also challenging, since the inter-relationships between different safety indicators over time can be complex and difficult to interpret, making it challenging to identify effective safety management actions [
25].
According to the Bureau of Labor Statistics (BLS), Highway Maintenance Workers in all U.S state government agencies had a non-fatal injury and illness rate involving days away from work of 538.9 per 10,000 FTE in the year 2020, three times higher than compared to a rate of 174.5 per 10,000 FTE for all other state government occupations [
26]. Disturbingly, this rate is also 4.5 higher than Highway Maintenance Workers in the private industry (118.5 per 10,000 FTE) [
26].
The BLS further provides statistics regarding the nature, event or cause of injury, and the body part affected by the injury according to occupation. For Highway Maintenance Workers, the highest occurring natures of injuries involving days away from work in 2020 were as follows: (1) sprains, strains or tears; (2) soreness or pain; (3) fractures; (4) cuts, lacerations or punctures; and (5) bruises or contusions [
27]. These natures also recorded the highest number of responses in the survey, reflecting a representative sample of the population. The highest occurring events or exposures according to the BLS were as follows: (1) overexertion and bodily reaction; (2) contact with objects or equipment (e.g., struck by, struck against, caught in or between); (3) falls, slips or trips; (4) transportation incidents; and (5) exposure to harmful substances or environments. The most affected body parts, as published by the BLS, were (1) hand, (2) back, (3) knee, (4) foot, and (5) shoulder [
27].
Transportation maintenance workers carry out a variety of tasks under difficult weather and traffic conditions. This requires acquiring the appropriate expertise, skill, and ability to perform their tasks efficiently and in a safe manner; therefore, proper training is essential to these workers. Respondents reported the various topics of training offered at their agencies, all related to maintenance workers. Synthesis 483, published by the National Cooperative Highway Research Program (NCHRP), reported that nearly all state DOTs offer training to highway maintenance workers, regardless of the number of maintenance staff they employ or whether they hire contract maintenance workers [
28]. The training topics reported by the NCHRP synthesis 483 were as follows: (1) bridges, (2) highway safety and reliability, (3) pavements, (4) roadway/roadside, and (5) general maintenance skills.
The most practiced and effective training methods reported were lectures, seminars, or other presentations, with 84% percent of responses indicating that training is carried out during employee onboarding. The lowest training frequency was reported to be once a year, accounting for 26% of responses. However, the previous NCHRP survey deployed in 2015 indicated that most DOTs offer mandatory training once a year and, in some cases, more than once a year. The synthesis recommended using technology-based training methods, such as web/computer-based training or video conference training, to solve some issues such as time conflicts and travel budgets. The main reason given for the performance of re-training was it being recommended by supervisors to increase worker awareness. Additional recommendations mentioned in the synthesis are the need to report the association between training and performance and the dissemination of information to state DOTs, such as measuring tracking and reporting strategies, and using the information to assess worker improvement [
28].
Finally, the respondents reported other safety and health information that would be valuable to their state DOT and is not currently available. The respondents suggested several possible improvements that they believe their agencies could benefit from. These suggestions included (1) near miss reporting; (2) improving complacency issues for any duty; (3) pre-employment physicals; (4) disseminating and making captured information from the FROI and other sources (e.g., task performed at the time of injury, equipment being used) available to the injury dashboard for deeper analysis; (5) developing better dashboards and widgets to provide live data to agency employees; and (6) tracking property damage costs accurately.
To improve complacency issues, a study was conducted to assess the effectiveness of 26 measures aimed at enhancing productivity and safety in the workplace, specifically in relation to severe occupational accidents. According to the participants, enhancing machinery and equipment, creating more spacious work areas, and implementing better housekeeping practices were identified as the most effective means of improving both productivity and safety. The study also revealed that increasing available work time, implementing additional safety measures for machinery, providing personal protective equipment, and promoting better coordination among work units were all viable methods for enhancing safety [
29].
Safety auditing is a common form of measuring an organization’s safety performance. It involves examining an organization’s safety activities to determine their effectiveness and impact and can take various forms. The goal of safety auditing is to stimulate comprehensive organizational change and improve long-term safety performance [
30]. Huang mentions that workplace audits and assessments can take various forms and have various purposes, and that determining the appropriate dimensions or topics can generate a wide variety of conclusions. It also suggests that in some circumstances, a better option is an audit tailored particularly to a specific purpose, based on the organization’s needs and goals.
OSHA’s “Program Evaluation Profile” (PEP) illustrates three core actions needed to assess and enhance safety programs. These actions are as follows:
Examine performance and development: This involves defining indicators to measure safety performance and development, as well as establishing practices to gather, investigate, and assess performance records. Employers, managers, supervisors, and workers should all be involved in monitoring the program.
Confirm the program is executed and operational: This involves verifying that the core elements of the program are in place and operating as intended. Key processes such as reporting injuries and illnesses, organizing site surveillance and incident investigations, as well as measuring improvements in managing recognized hazards should be in place and operating effectively.
Fix program shortcomings and find prospects for enhancement: When an obstacle is recognized in the program, employers should implement corrections promptly to fix the issue and avert its reoccurrence. Employers should involve supervisors, managers, and workers in identifying opportunities to improve the program and take action to implement those improvements [
1].
Recommendations for state DOTs that may help them in directing their worker safety efforts based on the survey findings can be summarized and listed as follows:
Developing a comprehensive safety program that incorporates management dedication, employee participation, risk identification and control, and training.
Analyzing injury trends consistently to recognize common hazards and implement effective countermeasures.
Collecting and analyzing data on near miss incidents to identify potential hazards and prevent future injuries.
Providing regular and updated training to address new hazards that can arise from adjustments to job tasks or procedures.
Ensuring that safety programs are adequately funded and that resources are available to support program efforts.
Establishing a safety committee or team to oversee the safety program and ensure that the program is effective.
Encouraging employee participation in safety programs and providing incentives for safe behavior.
Conducting regular safety audits and inspections to identify hazards and ensure compliance with safety regulations.
Providing personal protective equipment (PPE) and ensuring that workers are using it properly.
Developing a return-to-work program to help injured workers return to work as soon as possible.
Providing ergonomic assessments and training to prevent musculoskeletal injuries.
Encouraging a culture of safety by recognizing and rewarding safe behavior and promoting open communication about safety concerns.
This report has several implications related to highway worker safety. The report highlights the importance of collecting and analyzing data related to highway worker safety to develop effective safety programs. The report also identifies several data sets that can be used to quantify and describe current issues in highway worker safety, including incident reports, worker insurance claims, and fatality/injury data. Each of the data sets has advantages and limitations, and combining them can be challenging due to differences in the recording methodology and data format. However, analyzing these data sets collectively could lead to more powerful data analysis and more effective safety programs.
Overall, the study emphasizes the importance of ongoing efforts to improve highway worker safety and provides insights into the types of data that can be used to inform these efforts. The implications of this study include the following: (1) Providing guidance to state DOTs to help them in directing their worker safety efforts and implementing effective safety programs. (2) Encouraging near miss reporting, as the survey highlights the importance of documenting and tracing near misses regarding workplace safety in general and the relationship between near misses and injuries. This can encourage the adoption of near miss reporting practices, which can help prevent future accidents. (3) Improving data collection, such as gathering information on the injury classification criteria used by state DOTs, which can help improve data collection and the analysis of worker injuries and illnesses. (4) Enhancing worker safety and reducing the number of work-related injuries and illnesses among transportation maintenance workers.
In addition to the implications for state DOTs, this study can also have wider implications for other organizations and industries. For example:
Other government agencies that employ workers in hazardous environments, such as the military or law enforcement, will find the results of this study useful.
Private sector organizations that employ workers in hazardous environments can also benefit from the recommendations provided in this study.
Occupational safety and health professionals can use the findings of this study to develop and implement effective safety programs and training for workers in hazardous environments.
Researchers can use the data collected in this study to conduct further research on worker safety and injury prevention.
Finally, the data sets analyzed in this study have several strengths and limitations. For example, incident reports provide detailed information on individual incidents, but may not be representative of all incidents due to reporting biases. Worker insurance claims provide a broader picture of injuries sustained by highway workers, but may not capture all incidents due to under-reporting. Fatality/injury data provide a comprehensive view of fatalities and injuries but may not capture all incidents due to differences in the recording methodology across states. Another limitation of this study is the small sample size, which results in several limitations with regard to performing inferential data analysis. Firstly, the probability distribution of where the true value lies will be large, meaning that the confidence intervals are large as well. This makes it difficult to detect statistically significant differences between groups, even if they exist. Secondly, small sample sizes can lead to biased estimates of population parameters, which can result in incorrect conclusions being drawn from the data [
31]. Understanding the strengths and limitations of each data set is important for conducting effective research and developing effective safety programs.


