1. Introduction
The diversification of products and services in the marketplace has generated an unpredictable competitive environment for industries, which has forced service providers and product producers to evolve so that their processes can adjust to the dynamicity of the created environment. Dynamic environments are uncertain and their aspects are varied, not only in their intrinsic parameters but also in how those aspects are affected by externally unpredictable factors [
1]. It is worth noting that the uncertainty of an environment can present both risk and opportunity for developing systems and drive the performance of the embedded processes to provide products and services at higher rates and diversities [
2]. However, two of the repercussions of dynamicity and increasing operational speed are the complication of risk assessment and the shortened timeframe for taking responsive action. Risk assessment is designed to assess the risk involved in workplaces and identify the causes of any actions that negatively affect human health and safety, e.g., actions that result in the leakage of dangerous materials, including explosive, flammable, toxic, radioactive, corrosive, or leachable materials [
3]. There are some established methods, each with its own recommended tools for managing risk at the industrial level. The main risk management methods are provided by the COSO Enterprise Risk Management Framework (ERM) [
2] and ISO 31000 [
4].
According to the COSO ERM, risk management could maximize value if it sets objectives based on an optimum point between progress toward goals and any opposing risks. In this way, the interaction between people and organizations animates events, which could emerge as positive or negative activities with their possible opportunities and risks for the whole system. COSO ERM considers a three-dimensional matrix for the interaction between enterprise parameters and risk. It represents the relation between the goal achievement approach of the system, its structure, and relative risk management configuration [
2]. ISO 31000 proposes three main approaches. One gives insight into the human-organization interrelation, and one provides a framework to implement and execute designs and to then monitor the corresponding improvements. The third approach provides maps of risk assessment and proper treatments [
4].
These standards offer qualitative tools and methods, which help businesses to determine how to reach their goals and targets. Along with these approaches and standards, businesses need quantitative tools to evaluate their programs and corresponding progress toward established goals. Risks should be assessed by an appropriate framework with reliable tools and measures; still a lacuna in the approaches provided by the current standards of risk management [
5,
6]. The interaction between humans and organizations must be quantitively considered; the effect of human error on risk needs to be better understood, measured, and assessed [
7]. The functional resonance analysis method (FRAM) was introduced as a useful tool to identify the parameters underlying operational risk through the interrelation between the functions involved in a process [
8]. However, to evaluate quantitative parameters influenced by the interaction of functions and between possible effects on risk, the FRAM requires associative tools, such as the Monte Carlo simulation. We have addressed this association with the risk frameworks derived in our first study, which investigated the tasks related to the discharge, transportation, and storage of residual hazardous materials (RHMs). RHMs are substances that cause harm to people, property, and the environment [
9]. Our framework, by combining the FRAM and the Monte Carlo simulation, has revealed that, alongside the availability of equipment and safety standards instruction, the dynamic aspects of the executed functions in the studied case’s operation have a significant impact on meeting safety standard requirements due to their effect on increasing the risk of accidents [
10].
Despite the introduction of the above-mentioned tools and methods, dynamic environments bring high uncertainty because of imperfect available information. When the data required to understand events is lacking, there is an inevitable increase in accidents. In addition, imperfect information and the associated limited understanding prevents a system from finding appropriate alternatives, leading to faulty decision-making [
2]. The ability to recognize the pivotal features of information and their interactions is thus key to the success of a daily risk management framework in identifying possible operational risks [
11]. With the ability to recognize risk and make the right decisions, such a system could develop its risk management performance in a dynamic environment.
We, therefore, launched our subsequent study after investigating a risk management case to develop a decision-making system that could perform with imperfect information and still make appropriate decisions. The brain has been identified as the best alternative for decision-making in environments with imperfect information, leading to the field of brain-inspired artificial intelligence (AI). The brain is nature’s best adaptable system to recognize the features of imperfect information received from a dynamic environment and continuously make appropriate decisions thereabout [
12] through a process of sequential evaluation and editing [
13]. It generalizes knowledge based on learning from experienced states by finding (and classifying) similarities between the features of corresponding information [
12]. We, thus, introduced a brain-inspired model to process unpredictable environments and take actions with available imperfect information in our second study [
14]. It mimics brain functions in decision-making by utilizing three levels of recognizing information patterns from vaguely to explicitly similar features, identifying relevant values, evaluating the known alternatives, and correspondingly making decisions. The system continuously reorganizes the available alternatives according to the new values received for the made decisions [
14]. The system, after making a decision, receives that decision’s added value, assigns it to the state that the decision was made for, and revaluates the existing alternatives for information in common with this state.
This paper (the third in this series) aims to verify the performance of our decision-making system on real data from our case study presented in the first paper. We simulated the case’s risk assessment process to produce data for the decision-making system to identify possible risky conditions during the discharge, transportation, and store RHMs in the stocking area and then apply decisions on the process as preventive actions. It is a model for achieving a reliable level of dynamic, daily risk management. This study is a prerequisite step for such a decision-making system before can be applied for risk management in real environments.
We argue that an intelligent decision-making system will help risk management to evaluate imperfect information received from the environment in order to prevent certain events that could result in an accident. It recognizes, on a daily basis, the effective features of detected information and relative variation from a given unpredictable environment, and assigns them values that it can later utilize in making decisions to start or avoid new actions according to [
14]. The continuous improvement of alternatives will produce a more trustworthy operational environment. which in turn will allow for higher levels of operational safety.
The development of our intelligent decision-making model for an adaptable, responsive risk management system for the transportation and storage of hazardous materials is presented in
Section 2. We describe the experiments utilized to verify our model in daily risk management in
Section 3, and then present the results of those experiments in
Section 4. We analyze our results in
Section 5 and present our conclusions and suggestions for future work in
Section 6.
2. A Decision-Making System Model for Dynamic Risk Assessment
We developed a model with which to evaluate a brain-inspired decision-making system for risk management in dynamic environments. The performance of the brain-inspired decision-making system presented in our previous study [
14] is tested for managing the risk involved in the case assessed by our first study [
10]. We developed the model in two distinct operating environments (
Figure 1): a risk assessment framework, based on a Monte Carlo simulation of the realized FRAM model of the chemical products production process in the case studied [
10]; and a decision-making system, based on our work on brain-inspired decision-making [
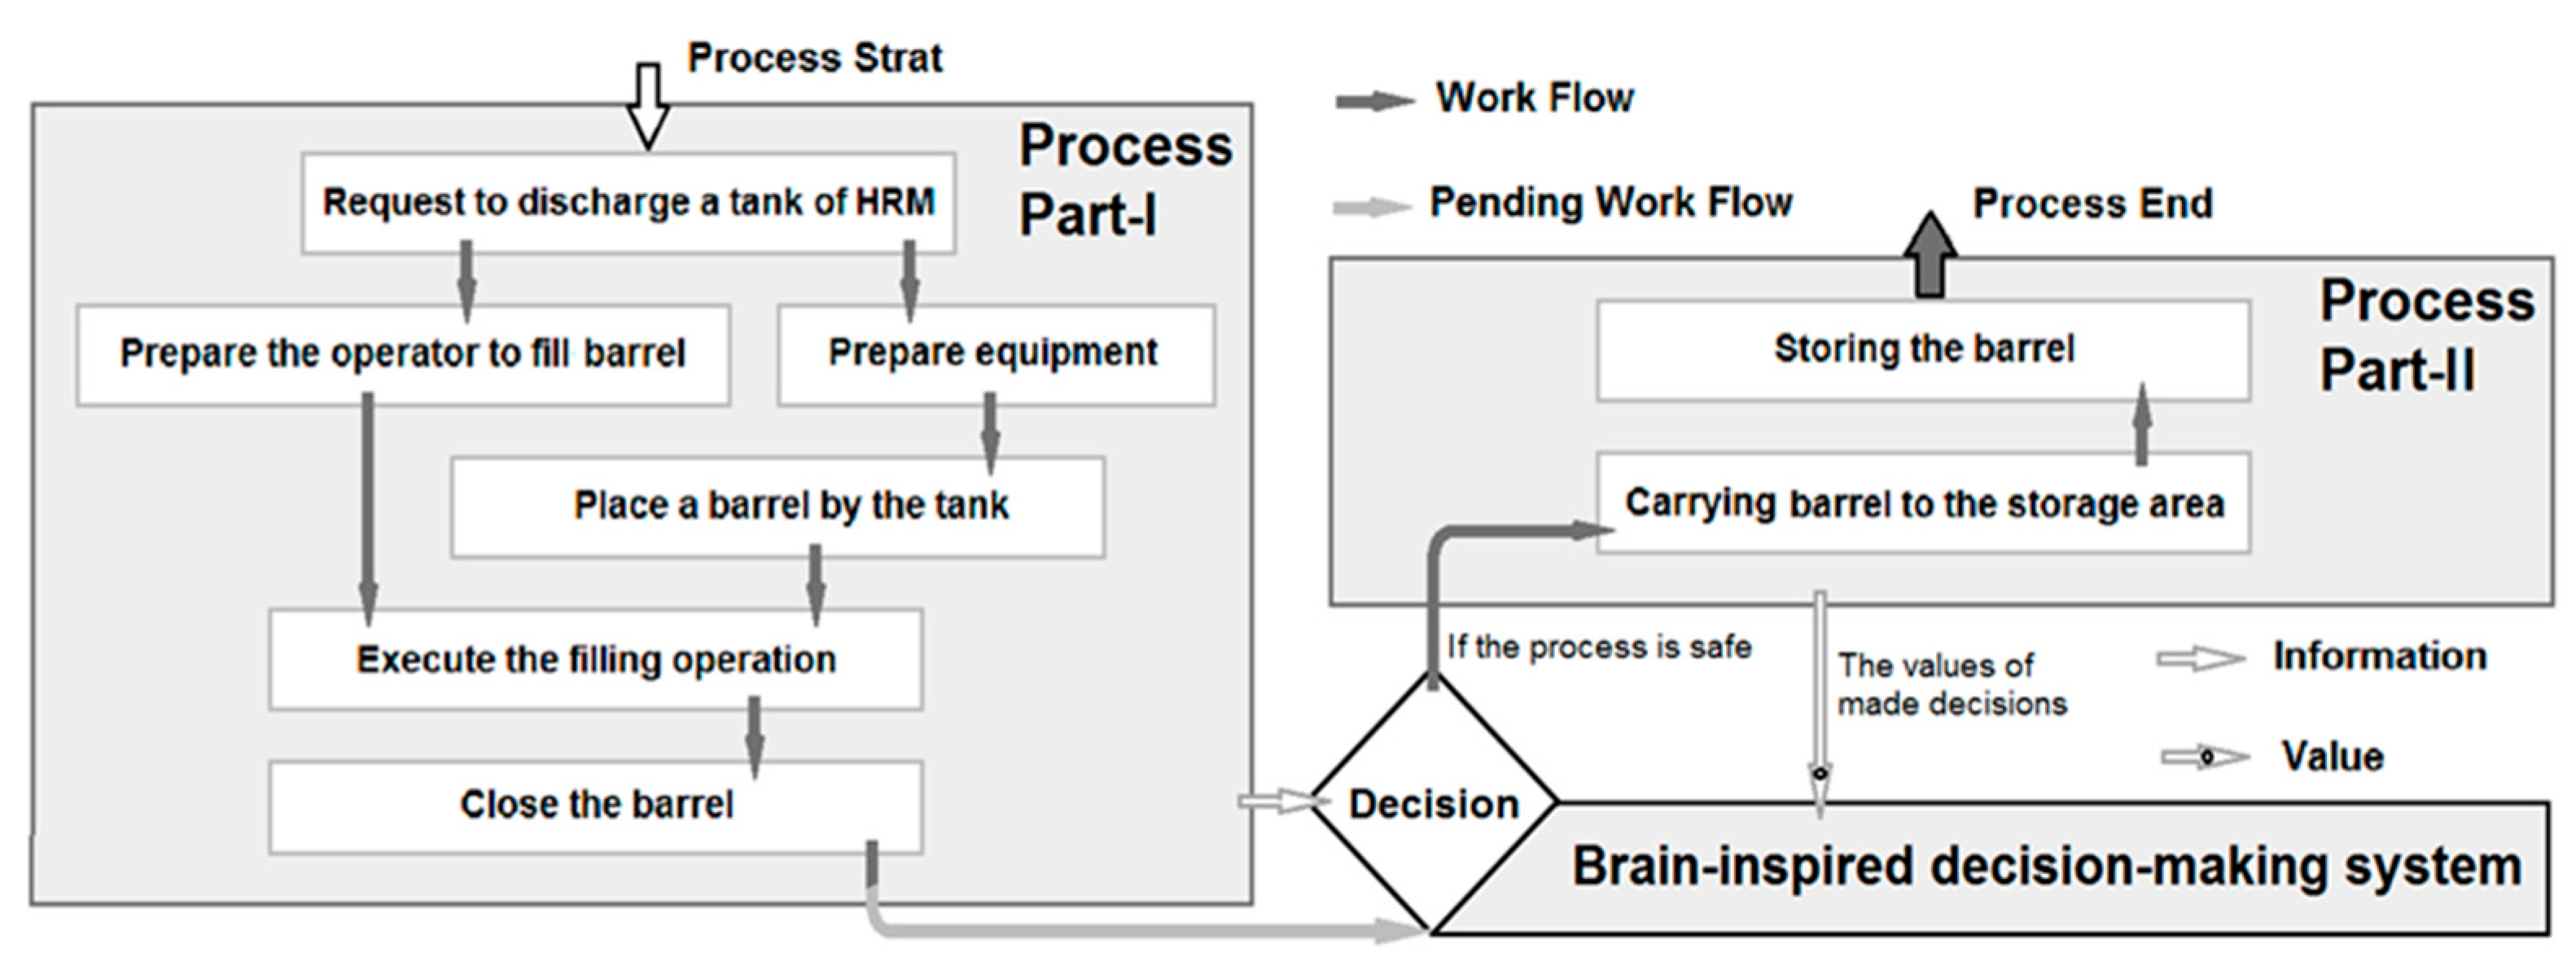
14]. In the first environment, the discharging, transportation, and storage of RHMs are simulated in two distinct parts. The first part (part-I) provides information for decision-making, which is performed in the second environment, according to the potential causes of variations in the discharge-related operations. The information gathered in part-I is thus utilized to decide if the second part (part-II) will proceed or not, based on if the transporting and storage of RHMs are determined to be at risk. The decision-making system determines if the functions in part-I (i.e., requesting a barrel for discharging RHMs, preparing the equipment, and discharging RHMs) offer a safe situation for performing part-II of each simulation state (i.e., transport and storage of RHMs). The information gathered from the simulated part-I was considered as the state of the decision-making system (the second environment). The feedback received from part-II becomes the added value of the action decided upon by the decision-making system.
Information is sent to the decision-making system from the simulation part-I environment via the information sensory gate, while the added values from part-II are sent to the decision-making system through the value-added sensory gate (
Figure 1). The features of the information needed by the decision-making system is derived from the functions’ speed-up ratios and equipment availability. The speed-up ratio defines the squeezed proportion of the time of each function according to the previous functions’ delays [
10]. The decision-making system processes the received information at three recognition levels. Next, a decision is made to either “Stop” or “Let the process continue to part-II”. If the decision is to continue the process, the simulation’s part-II continues the process and provides the feedback of corresponding added value for that decision. Accordingly, the decision-making system then modifies the relative alternatives for similar information patterns to apply to upcoming states.
2.1. Risk Assessment Environment
FRAM was used in [
10] to identify the most important factors of functions that affect risk in a chemical production process, and then used that information to model risk assessment based on functions’ speed-up ratios and equipment availability. Afterward, the model was animated and analyzed in a Monte Carlo simulation. The speed-up ratio of a function in a process is a factor that reduces the relevant scheduled time according to the functional delays applied by precedent functions. Ref. [
10] considered seven parameters as direct accident influencers: unclosed-RHM-barrel, using a dolly instead of a forklift, occupied transportation path, rough floor, lack of storage space, and no available pallet. The speeds of the functions affect and intensify those direct risk influencers.
The simulated process provides the variables representing functional delays, speed-up ratios, and direct accident influencers’ effects at each state. The number of accidents that occurred during a complete assessment of 25,000 states, according to [
10], is the other important variable. Each simulated workday includes a chain of simulated states, and each state is the chronology of collecting, transporting, and storing RHMs barrels, in which the corresponding execution times are interrelated.
We follow the Occupational Health and Safety Regulations (OHS) three parameters [
15]: performance deviation due to human error, the environmental effects on performance deviation, and the preventive actions taken against unexpected consequences, to model the process by FRAM, which has three steps:
- (1)
definition of the factors of each function:
- (a)
input (i);
- (b)
output (o);
- (c)
resources (r) required to fulfill a function;
- (d)
time (t) required to complete a function;
- (e)
controls (c) (procedures, methods, etc.) to constrain and control each function; and
- (f)
preconditions (p) required to operate a function;
- (2)
determination of the potential variability of each function (here, the important variable is the function duration); and
- (3)
establishment of a network of dependencies and coupling between functions.
FRAM evaluated the potential links between function duration and failures and accidents in a chemical product production process with 11 dynamic functions and the operational chronology of functions in [
10]. The following functions then were assessed:
- (1)
Request a barrel to discharge the RHM tank (a temporary container for conserving RHMs during the process).
- (2)
Prepare the transportation equipment and place the RHM barrel in front of the tank.
- (3)
Order the operator to wear PPE and be at in place for discharging the tank.
- (4)
Execute the discharging and filling of the RHM barrel.
- (5)
Request a label for the filled barrel.
- (6)
Carefully close the filled RHM barrel.
- (7)
Deliver and install the label on the closed barrel.
- (8)
Transport the closed barrel.
- (9)
Correctly store the closed barrel in the RHM storage area.
- (10)
Register the barrel.
- (11)
Update the registration.
Among the 11 functions listed above, the 7 that can increase delays and lead to risky conditions were selected for modeling the study’s decision-making system. Those functions are modeled in two parts, as listed below for each simulation state:
Part-I:
Request a barrel to discharge the RHM tank (a temporary container for conserving RHMs).
Prepare the transportation equipment and place an RHM barrel in front of the tank.
Order the operator to wear PPE and be in place for discharging the tank.
Execute the discharging of the RHM tank and the filling of the RHM barrel.
Carefully close the filled RHM barrel.
Part-II:
- 6.
Transport the closed barrel to its assigned storage area.
- 7.
Correctly store the closed barrel in the designated RHMs storage area.
The five functions presented in the first part may delay the process and consequently increase the speed-up ratios of the functions in the second part.
2.2. Decision-Making Environment
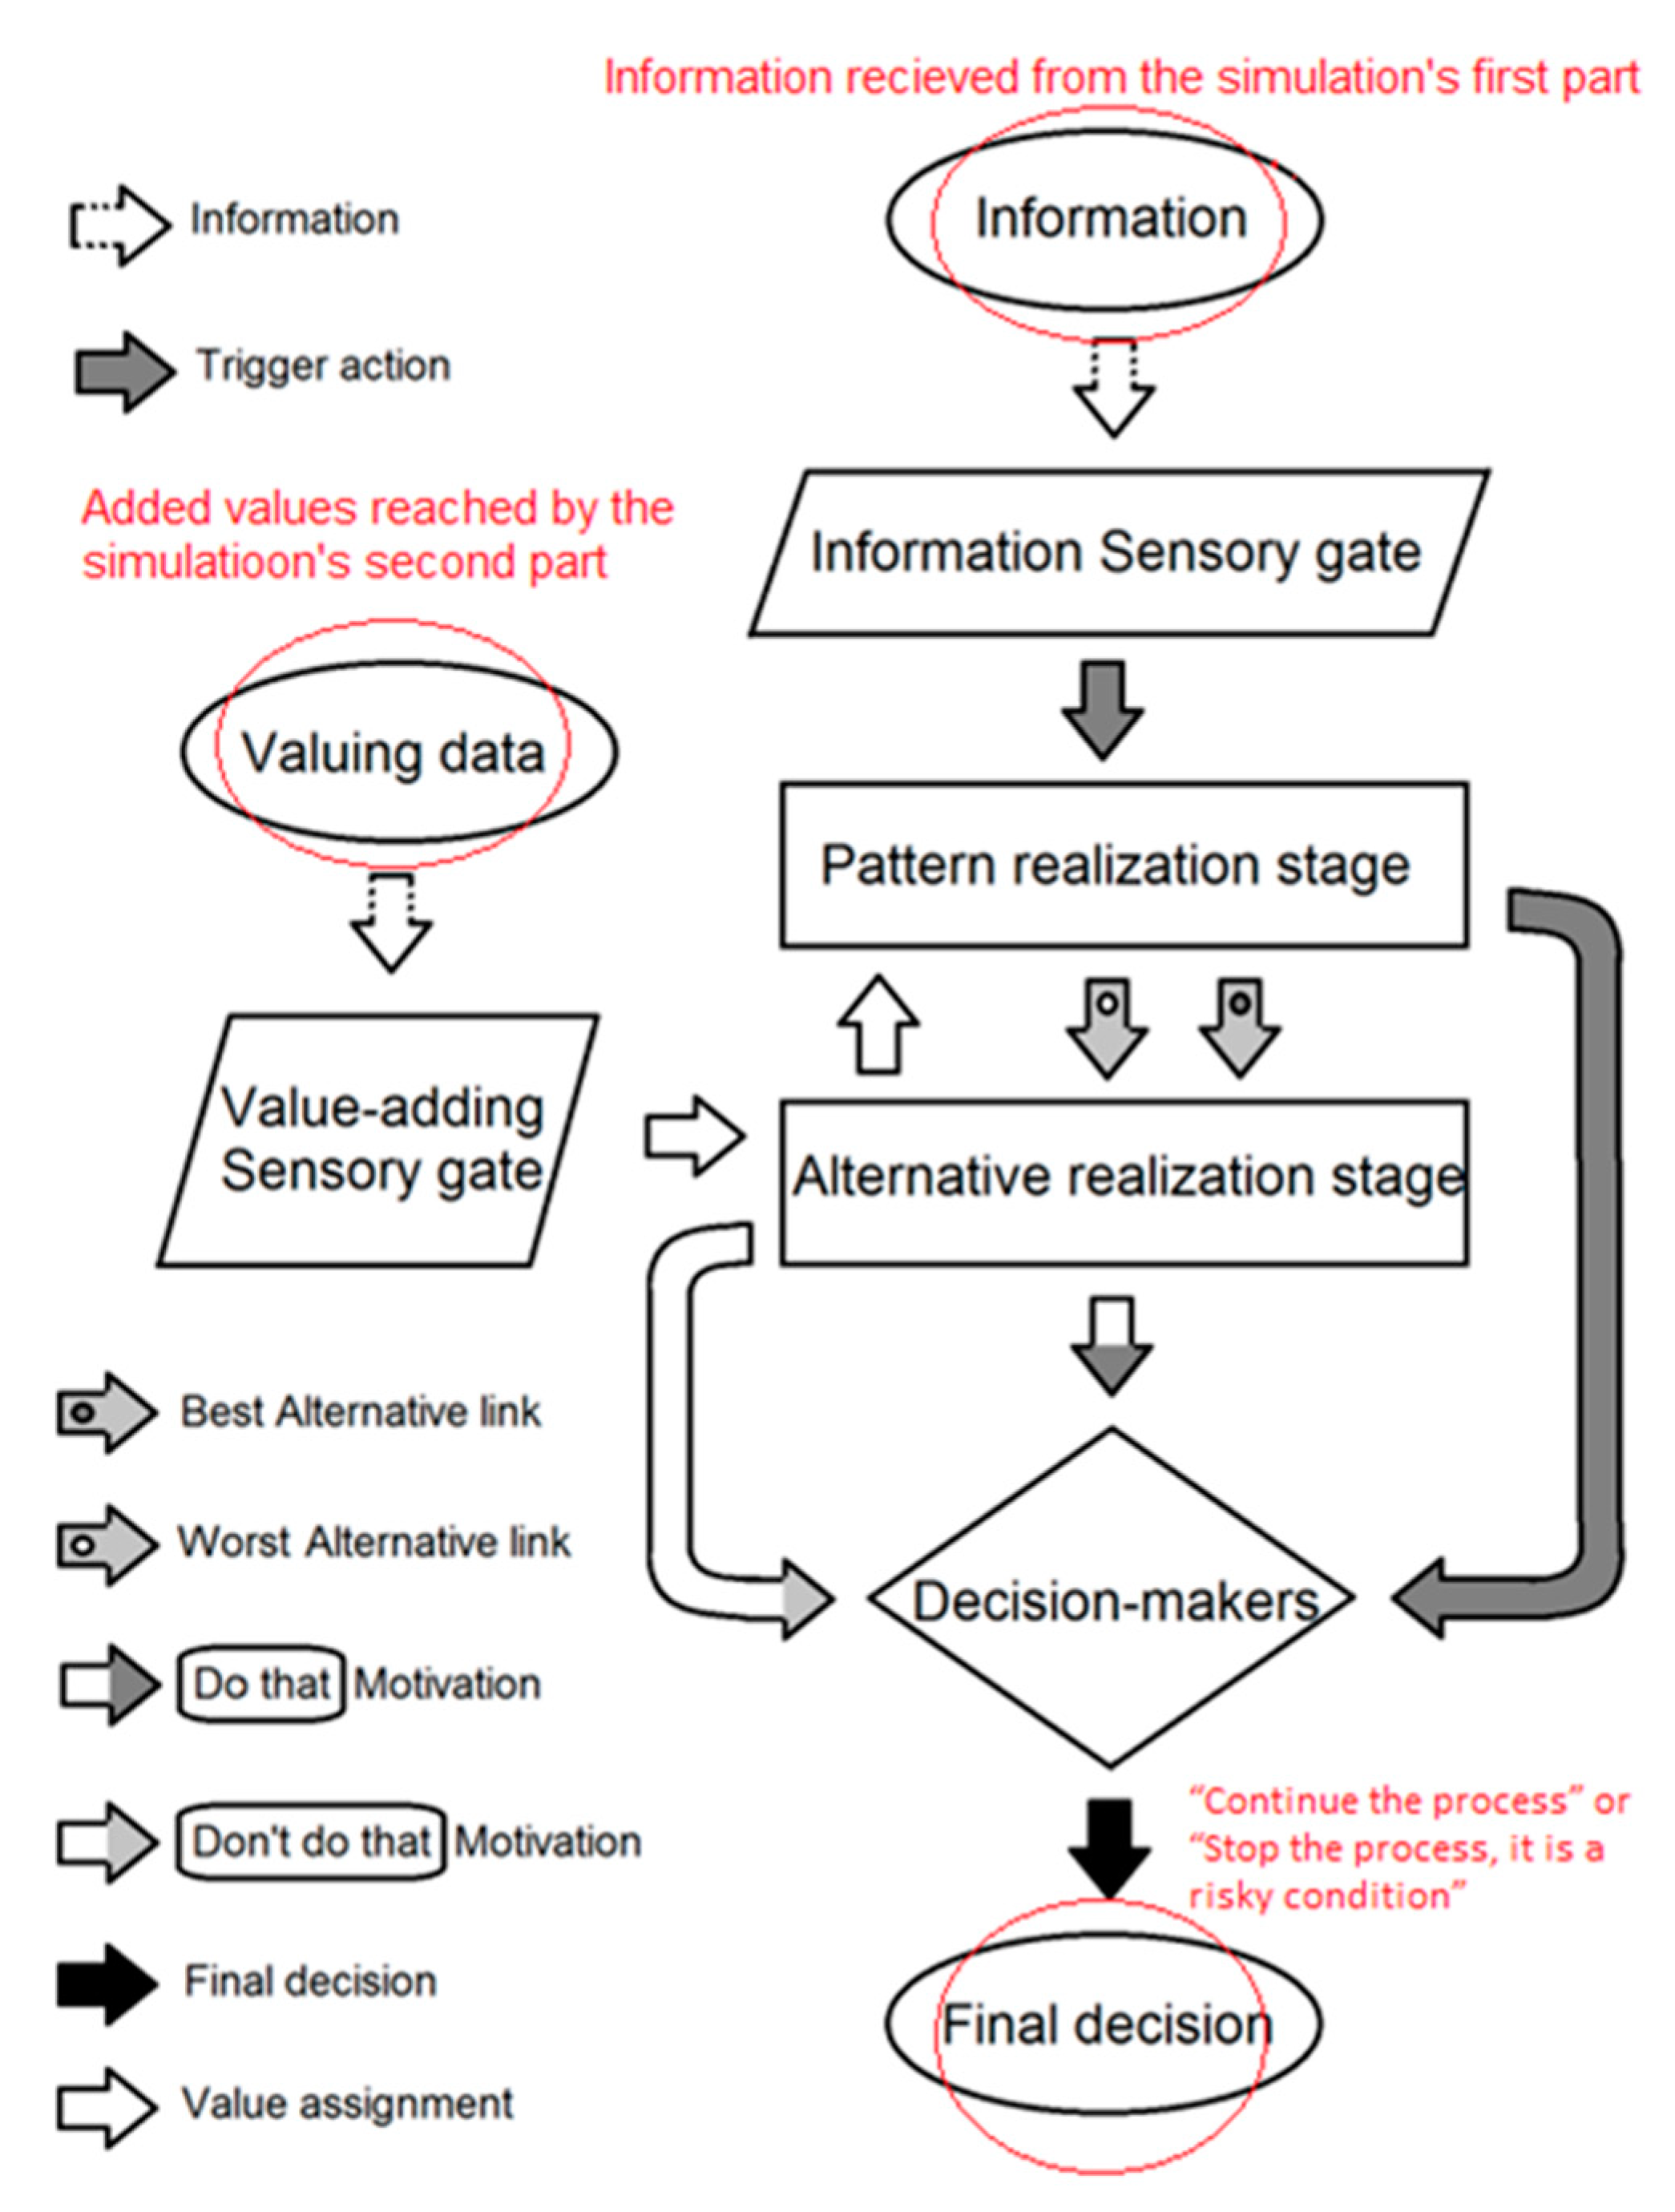
Our brain-inspired decision-making system was designed to identify the effects of the delays incurred during the first part’s functions on increasing the risk of accidents during the second part’s functions (transportation and storage of RHMs). The decision-making system is comprised of four sections: the information sensory gate, pattern labels’ realization, alternative realization, and value-added realization (see
Figure 2) to recognize and classify information through the detection of patterns and value similarities. This system uses these four sections to determine the best and worst decision alternatives decision between “Continue the process” or “Stop the process, it is a risky condition” at three levels of realization (vague, approximate, and explicit similarities). The value-added signal then receives the system’s value-added sensory gate from the simulated transportation and storage of RHM (the simulation’s part-II) to determine the value of the decision and records it with the detected information pattern. Next, a new alternative replaces the best (or worst) linked alternative if the new value has a lower (or higher) score than one of them.
Based on the defined features of a detected state in [
14], information, transmitted as a signal with eight specific frequencies, is received at the information sensory gate of the decision-making system. The signal frequencies are represented by f1, f2, f3, …, f8 showing the weights of each information feature. In this study, speeding-up the ratios in the first part’s functions generates five of the eight information features required. “Unclosed RHM barrel” and “RHM manual transportation” are two of the remaining three features. The first five features are assigned intensities of between one and eight (the least to the highest risks) and applied in frequencies between f4 to f8. “Unclosed RHM barrel” and “RHM manual transportation” are assigned values of one (or two) sitting on f2 and f3. f1 is not assigned a value because there is no accountable feature to link to it in our information.
At each simulation state, the received signal is realized by the decision-making system before it begins the simulation’s part-II so that it can decide if the process is safe to continue or not. The decision-making system decides to continue (or stop) the process based on its knowledge. A default decision is made when there is no alternative recorded or if the difference between the best and worst alternatives is not recognizable.
The value-added achievements are extracted from the simulation’s part-II to determine successful decisions. The speed-up ratios and the problematic conditions of the transportation and storage paths of part-II determine a value between 1 to 100 for a decision; this value is calculated after each “continue the process” decision to evaluate the result of that decision.
3. Experiment to Test the System’s Performance
We built an experiment to test the decision-making system we presented in [
14] using real data of risk management of the case studied in [
10], considering value-added achievements (the higher the value added the higher the risk of accident) to decrease the number of accidents. This case was evaluated because it had had an especially undesirable time variation for the functions involved. Those functions are detailed in
Table 1, where the “Time” feature is defined as the span required to complete a function. This case was restricted by the speed-up ratios (the ratios calculated via the previous functions’ delay load). The “Control” feature shows the scheduled time for the functions.
For each state, the simulation began with running the simulation’s part-I. The necessary information was extracted and applied as an input signal to the information sensory gate. The information features’ values determine the signal shape, e.g., 12147566 (numbers that indicate the intensities of corresponding frequencies). For this pattern, the three levels of the pattern realization receive a vaguely common pattern “1211222”, the approximate common pattern “12124333”, and the identical one “12147566”. According to the patterns received from the first part, the system would decide to continue (or stop) the simulation’s part-II. The process continued in the second part if the decision was “Continue the process”.
The value-added achievements are derived from the multiplication of the rank and the speed-up ratios of two functions in the simulation’s part-II (“Carrying the closed barrel to the storage area” with rank one and “Storing the barrel” with rank two). The maximum value-added risk (the highest value for an accident occurrence) was equal to 100, and the minimum was one, which represents the safest condition. We trained the decision-making system with the first set of the simulation. Each simulation set included 25,000 states based on the case study. Each workday was considered as having an average of 10 consecutive states. In the second set, we evaluated the system’s functioning and its effect on changing the number of accidents in the simulation.
We measured the number of successfully made decisions and compared it with the number of “Continue the process” made decisions during the experiment to verify the performance of the decision-making system. The results of four sets of simulations were collected in order to realize the system’s average performance. The average recorded accidents for each set in the experiment were collected for two scenarios. In the first scenario, we assessed the system with the decision-making system, and in the second we assessed it without the decision-making system. We compared both scenarios in terms of the number of occurred accidents, with and without the decision-making system, to evaluate the utilization of the decision-making system on increasing process safety and decreasing risk.
5. Discussion
Our study investigated an intelligent decision-making system for managing risk in a chemical product production process. We developed a model by executing a brain-inspired decision-making system presented in our previous study [
14] to evaluate the risk in a simulated process based on the information gathered in [
10]. The goal of this risk assessment is to prevent dangerous events and accidents from occurring. We used this model to evaluate a series of consecutive experiments in a simulated environment that explored the detailed functions involved in the discharge, transportation, and storage of RHMs. The simulated process sent information and value-added signals to the decision-making system that allowed the system to determine if the process was safe to continue (or not). At each state, the system detected an information pattern, investigated the risk level of the first part of the simulation activities in terms of their impact on the second part, and decided to order the process to “Continue the process” if it was safe, or to “Stop, the process” if the process was determined to be too high risk. Each time the decision of “Continue the process” was made, a value, calculated from the ranks and values of the second part of the simulation, was applied to the value-adding sensory gate. We then measured the system performance through the results derived from the simulation (of each state). The results shows that the system reduced the number of accidents by 40.91%, which was very significant for the case study, as it often had a high variation in the fulfillment of scheduled tasks and a low level of equipment preparation.
The summary of the analysis of the experimental results shows that the brain-inspired decision-making system can be helpful in risk management and can contribute to the establishment of safer operational environments in dangerous environments involving chemical and radioactive hazardous materials. It also suggests that still broader insights into the utilization of brain-inspired decision-making systems may be possible for operation management in the future, such as industry 4.0 and the automation of industrial product production and service providing processes.
It should be noted that the number of variables for building information investigated here was very limited. To provide more reliable alternatives for decision-making the system needs a minimum of eight realizable features to accumulate the required information.


