
Developing a Fatigue Detection Model for Hospital Nurses Using HRV Measures and Machine Learning

 , , ,
, , ,
Abstract

1. Introduction
2. Materials and Methods
2.1. Participants
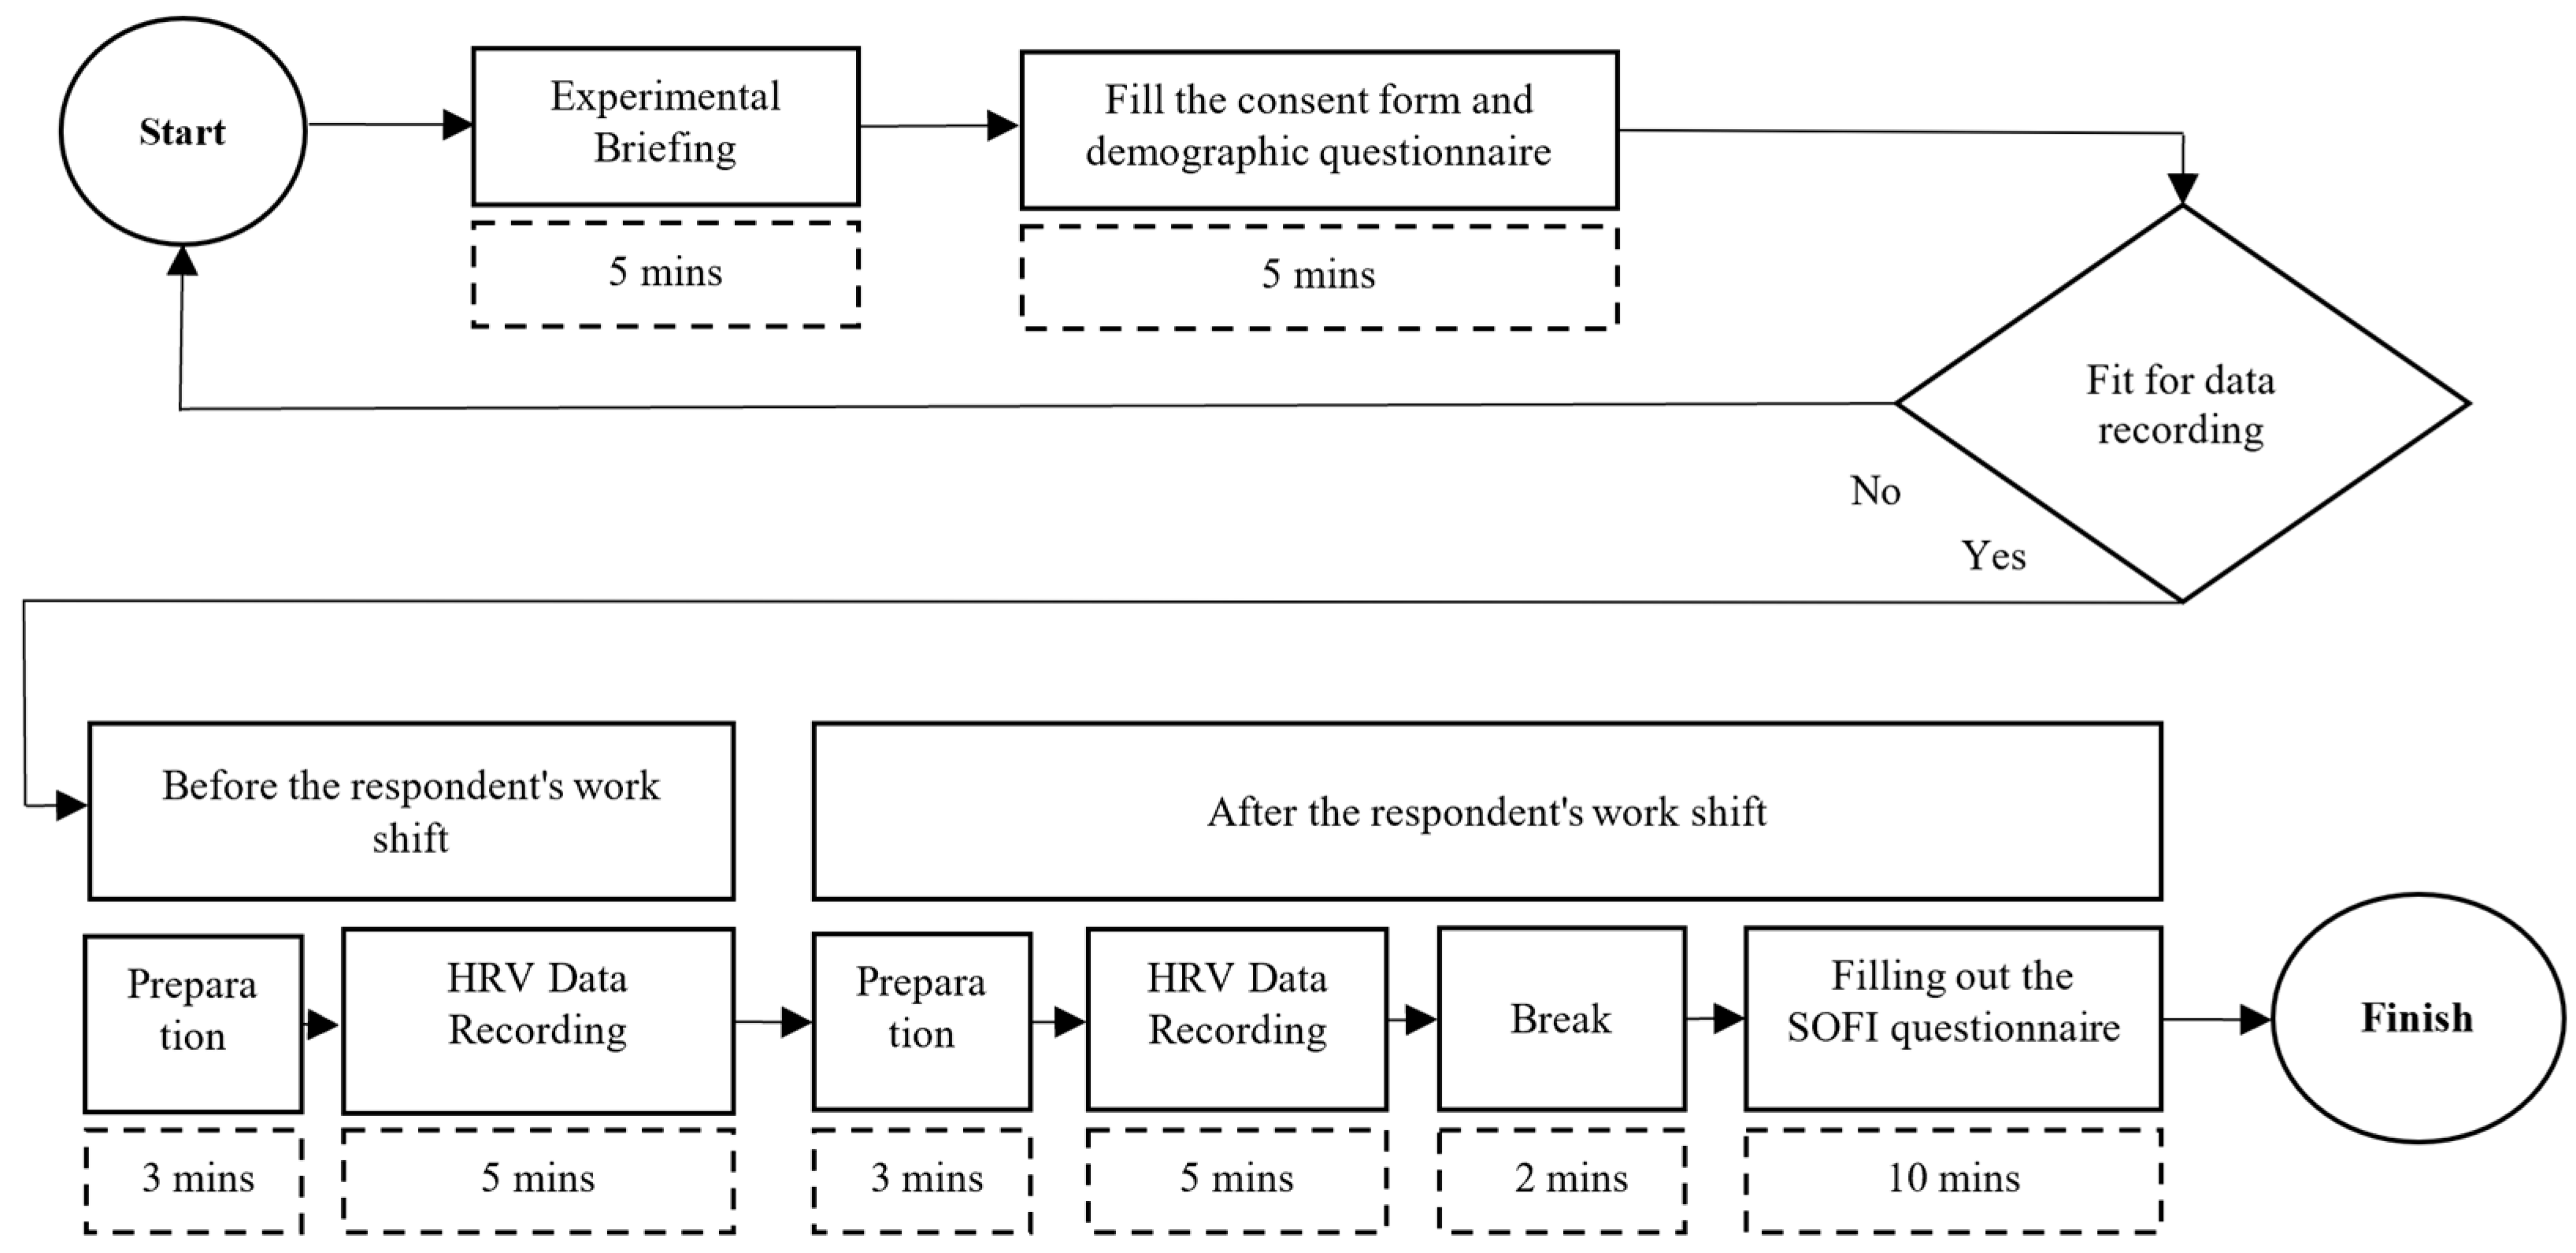
2.2. Procedure
2.3. Data Recording
2.3.1. Heart-Rate Variability
2.3.2. Swedish Occupational Fatigue Inventory
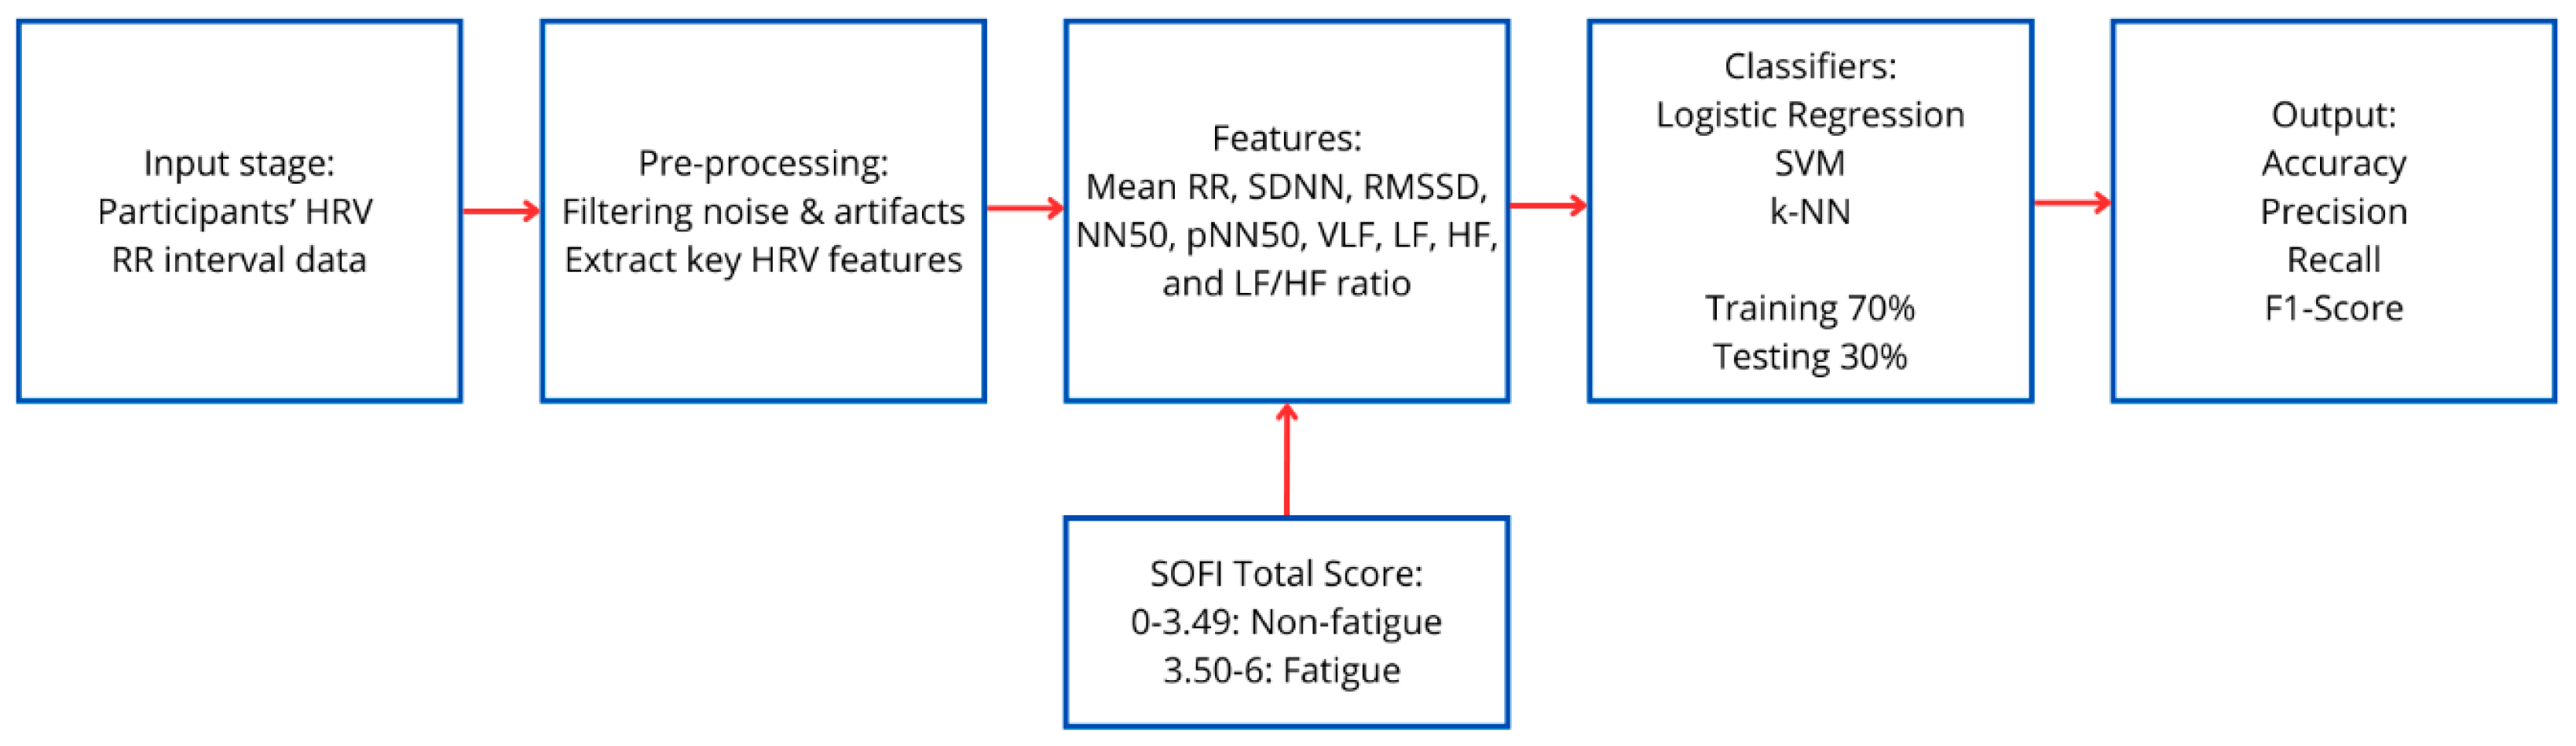
2.4. Data Analysis
3. Results
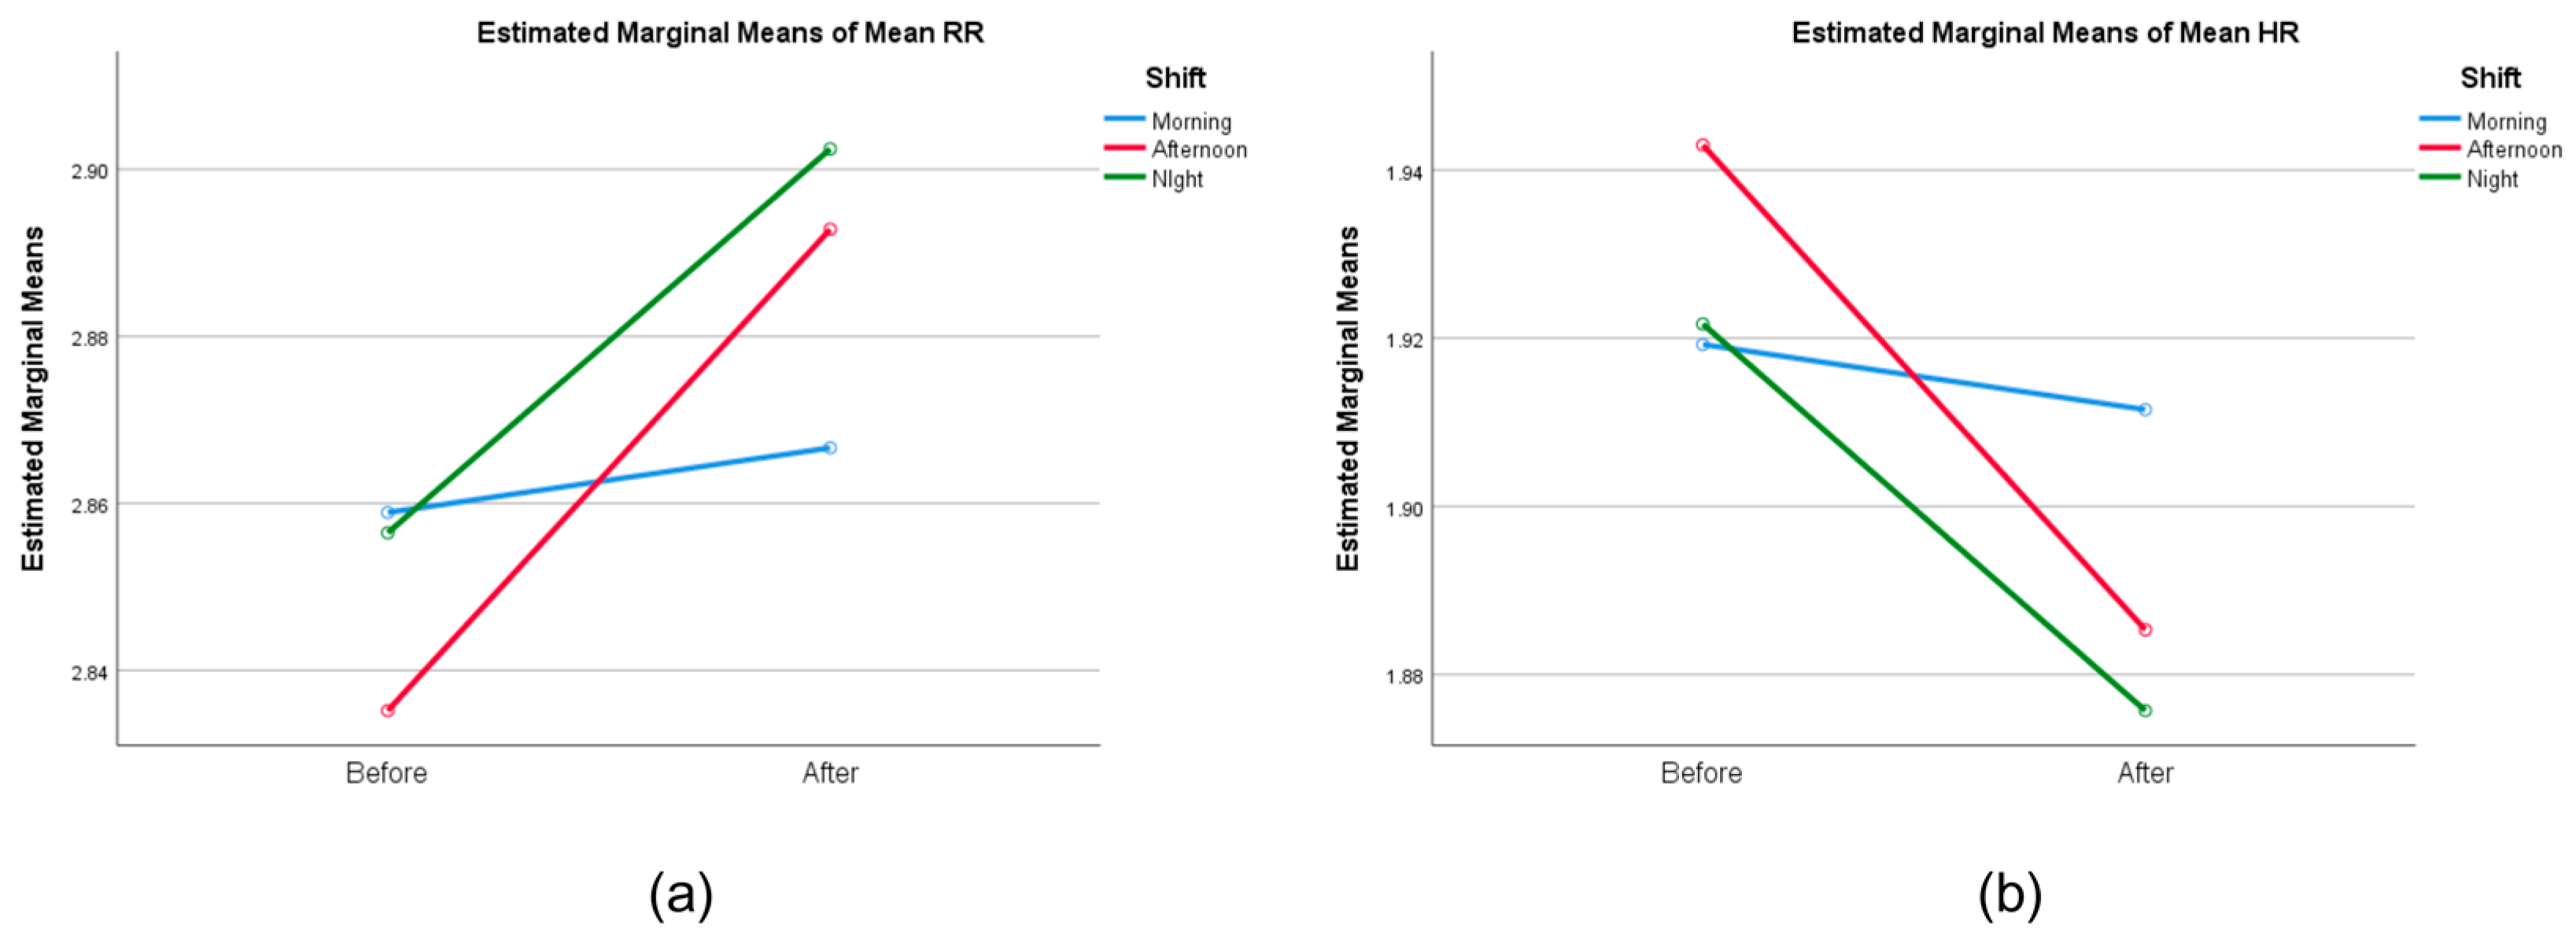
3.1. Statistical Test
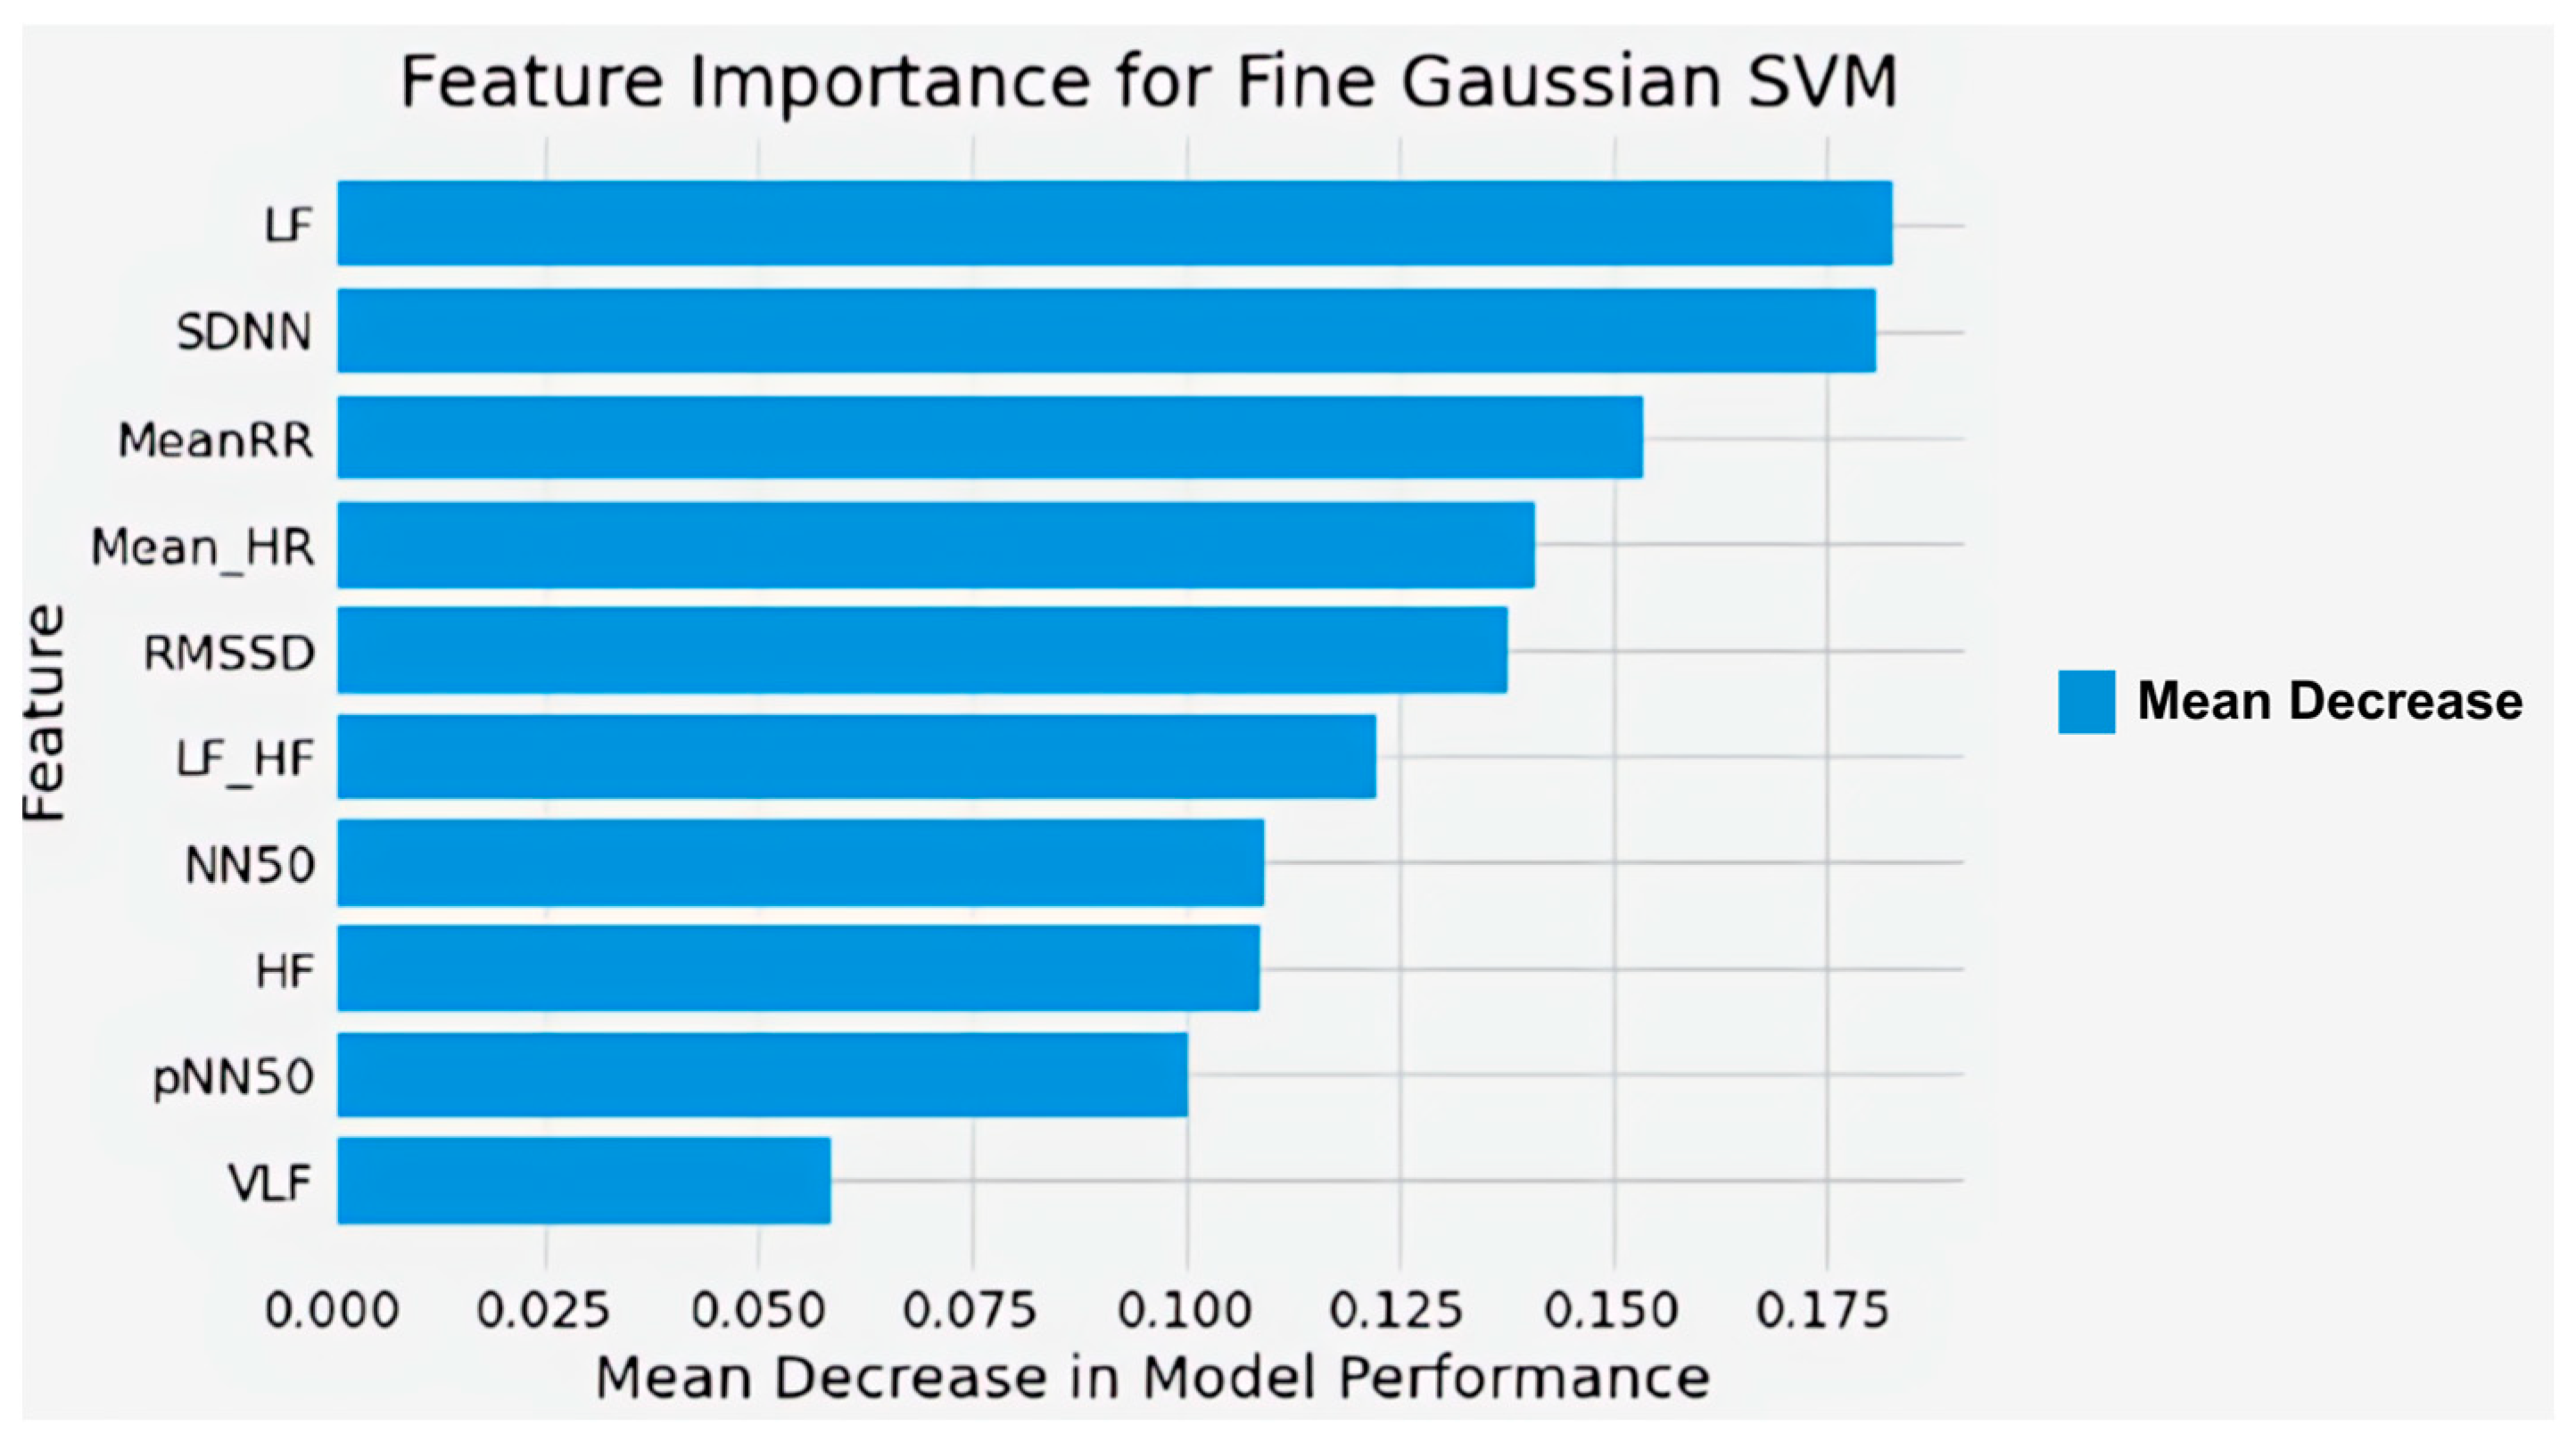
3.2. Fatigue Classification
4. Discussion
4.1. HRV and SOFI Results on Nurses’ Shifts
4.2. Nurses’ Fatigue Classification Modeling
4.3. Limitation
5. Conclusions
Supplementary Materials
Author Contributions
Funding
Institutional Review Board Statement
Informed Consent Statement
Data Availability Statement
Conflicts of Interest
Abbreviations
| HR | Heart rate |
| HRV | Heart-rate variability |
| SOFI | Swedish Occupational Fatigue Inventory |
| ICU | Intensive care unit |
| ER | Emergency room |
| OR | Operating room |
| ANS | Autonomic nervous system |
| SNS | Sympathetic nervous system |
| PNS | Parasympathetic nervous system |
| ML | Machine learning |
| TP | True positive |
| FP | False positive |
| TN | True negative |
| FN | False negative |
| Mean RR | Mean of RR intervals |
| SDNN | Standard deviation of the NN intervals |
| Mean HR | Mean of heart rate |
| RMSSD | Root means square of successive NN intervals differences |
| NN50 | Number of interval differences of successive NN intervals greater than 50 ms |
| pNN50 | Proportion derived by dividing NN50 by the total number of NN intervals |
| VLF | Very low frequency |
| LF | Low frequency |
| HF | High frequency |
| LF/HF | Low Frequency to High-Frequency ratio |
| BMI | Body mass index |
| SVM | Support Vector Machine |
| KNN | K-Nearest Neighbor |
| SMOTE | Synthetic Minority Oversampling Technique |
| RBF | Radial basis function |
References
- WorkSafe Queensland. Preventing and Managing Fatigue-Related Risk in the Workplace. In Workplace Health and Safety Queensland; Queensland Government: Brisbane, Australia, 2020. [Google Scholar]
- Batson, G. Exercise-Induced Central Fatigue: A Review of the Literature with Implications for Dance Science Research. J. Danc. Med. Sci. 2013, 17, 53–62. [Google Scholar] [CrossRef]
- Barlian, B.; Setiawan, Y.; Hurriyati, R. Work-Family Conflict, Workload and Burnout as a Determinant Factor on Employee Performance. In Proceedings of the 6th Global Conference on Business, Management, and Entrepreneurship (GCBME 2021), Bandung, Indonesia/Online, 18 August 2021; Volume 657. [Google Scholar] [CrossRef]
- Artanto, A.; Chairani, L.; Belia, M.N.; Ghiffari, A. The Relationship between Shift Work and Occupational Fatigue on Nurses Working on the Pediatrics and Internal Wards of Muhammadiyah Palembang Hospital. Br. Int. Exact Sci. (BIoEx) J. 2021, 3, 144–150. [Google Scholar] [CrossRef]
- Kementerian Kesehatan RI. Rencana Aksi Kegiatan Direktorat Penyediaan Tenaga Kesehatan TA 2020–2024. Available online: https://repositori-ditjen-nakes.kemkes.go.id/ (accessed on 20 October 2024).
- America Psychological Association. 2023 Work in America™ Survey. Available online: https://www.apa.org/pubs/reports/work-in-america/2023-workplace-health-well-being (accessed on 20 October 2024).
- Cunningham, T.R.; Guerin, R.J.; Ferguson, J.; Cavallari, J. Work-Related Fatigue: A Hazard for Workers Experiencing Disproportionate Occupational Risks. Am. J. Ind. Med. 2022, 65, 913–925. [Google Scholar] [CrossRef] [PubMed]
- National Safety Council. Fatigue in Safety-Critical Industries: Impact, Risks and Recommendations; Final Report; National Safety Council: Itasca, IL, USA, 2018. [Google Scholar]
- National Safety Council. Fatigue in the Workplace: Causes and Consequences of Employee Fatigue; National Safety Council: Itasca, IL, USA, 2017; Volume 302. [Google Scholar]
- Garrick, R.; Sullivan, J.J.; Doran, M.; Keenan, J. The Role of the Hospital in the Healthcare System. In The Modern Hospital: Patients Centered, Disease Based, Research Oriented, Technology Driven; Springer Nature: London, UK, 2019. [Google Scholar] [CrossRef]
- Kementerian Kesehatan. Profil Kesehatan Indonesia 2022. Available online: https://kemkes.go.id/eng/profil-kesehatan-indonesia-2022 (accessed on 20 October 2024).
- Dembe, A.E.; Erickson, J.B.; Delbos, R.G.; Banks, S.M. The Impact of Overtime and Long Work Hours on Occupational Injuries and Illnesses: New Evidence from the United States. Occup. Environ. Med. 2005, 62, 588–597. [Google Scholar] [CrossRef]
- Yuan, S.C.; Chou, M.C.; Chen, C.J.; Lin, Y.J.; Chen, M.C.; Liu, H.H.; Kuo, H.W. Influences of Shift Work on Fatigue among Nurses. J. Nurs. Manag. 2011, 19, 339–345. [Google Scholar] [CrossRef] [PubMed]
- How to create a Healthy Nurse Schedule for Your Team. Available online: https://dropstat.com/blog/employee-scheduling/healthy-nurse-shift-schedule/ (accessed on 20 October 2024).
- Knauth, P.; Hornberger, S. Preventive and compensatory measures for shift workers. Occup. Med. 2003, 53, 109–116. [Google Scholar] [CrossRef] [PubMed]
- Harris, R.; Sims, S.; Parr, J.; Davies, N. Impact of 12h Shift Patterns in Nursing: A Scoping Review. Int. J. Nurs. Stud. 2015, 52, 605–634. [Google Scholar] [CrossRef]
- Rhéaume, A.; Mullen, J. The Impact of Long Work Hours and Shift Work on Cognitive Errors in Nurses. J. Nurs. Manag. 2018, 26, 26–32. [Google Scholar] [CrossRef]
- Perveen, K. Role of Nurses in Intensive Care Unit. NURSEARCHER J. Nurs. Midwifery Sci. 2022, 2, 01. [Google Scholar] [CrossRef]
- Alahmadi, B.; Alharbi, M. Work-Related Fatigue Factors among Hospital Nurses: An Integrative Literature Review. Nurse Media J. Nurs. 2019, 8, 113–133. [Google Scholar] [CrossRef]
- Dall’Ora, C.; Ejebu, O.Z.; Ball, J.; Griffiths, P. Shift work characteristics and burnout among nurses: Cross-sectional survey. Occup. Med. 2023, 73, 199–204. [Google Scholar] [CrossRef]
- Peršolja, M. Effects of nurses’ schedule characteristics on fatigue: An integrative review. Nurs. Manag. 2023, 54, 28–37. [Google Scholar] [CrossRef]
- Cucu; Nuraeni, H.; Muryani, A. Analisis Beban Kerja Perawat Di Ruang Rawat Inap Rumah Sakit Gigi Mulut Universitas Padjadjaran Tahun 2018. J. Sist. Kesehat. 2019, 4, 164–172. [Google Scholar] [CrossRef]
- International Council of Nurses. The COVID-19 Effect: World’s Nurses Facing Mass Trauma, an Immediate Danger to the Profession and Future of Our Health Systems; International Council of Nurses: Geneva, Switzerland, 2021. [Google Scholar]
- Lasebikan, V.O.; Oyetunde, M.O. Burnout among nurses in a Nigerian general hospital: Prevalence and associated factors. Int. Sch. Res. Not. 2012, 2012, 402157. [Google Scholar] [CrossRef]
- Sharplin, G.; Clarke, J.; Eckert, M. Assessing the Global Sustainability of the Nursing Workforce. 2025. Available online: https://www.icn.ch/sites/default/files/2025-04/ICN_NNA-Presidents-Survey-Report_EN_FINAL.pdf (accessed on 20 October 2024).
- Schaffarczyk, M.; Rogers, B.; Reer, R.; Gronwald, T. Validity of the Polar H10 Sensor for Heart Rate Variability Analysis during Resting State and Incremental Exercise in Recreational Men and Women. Sensors 2022, 22, 6536. [Google Scholar] [CrossRef]
- Ni, Z.; Sun, F.; Li, Y. Heart Rate Variability-Based Subjective Physical Fatigue Assessment. Sensors 2022, 22, 3199. [Google Scholar] [CrossRef]
- Li, X.; Zhu, W.; Sui, X.; Zhang, A.; Chi, L.; Lv, L. Assessing Workplace Stress Among Nurses Using Heart Rate Variability Analysis with Wearable ECG Device–A Pilot Study. Front. Public Health 2022, 9, 810577. [Google Scholar] [CrossRef]
- World Health Organization. State of the World’s Nursing 2020: Investing in Education, Jobs and Leadership; World Health Organization: Geneva, Switzerland, 2020. [Google Scholar]
- Sarker, I.H. Machine Learning: Algorithms, Real-World Applications and Research Directions. SN Comput. Sci. 2021, 2, 160. [Google Scholar] [CrossRef]
- Murphy, K.P. Machine Learning: A Probabilistic Perspective (Adaptive Computation and Machine Learning Series); MIT Press: Cambridge, MA, USA, 2012; Volume 621485037. [Google Scholar]
- Xie, W.; Liu, M.; Okoli, C.T.C.; Zeng, L.; Huang, S.; Ye, X.; Liu, F.; Wang, J. Construction and Evaluation of a Predictive Model for Compassion Fatigue among Emergency Department Nurses: A Cross-Sectional Study. Int. J. Nurs. Stud. 2023, 148, 104613. [Google Scholar] [CrossRef]
- Tasnim, A.F.; Rahman, R.; Prabha, M.; Hossain, M.A.; Nilima, S.I.; Mahmud, M.A.A.; Erdei, T.I. Explainable machine learning algorithms to predict cardiovascular strokes. Eng. Technol. Appl. Sci. Res. 2025, 15, 20131–20137. [Google Scholar] [CrossRef]
- Halomoan, J.; Ramli, K.; Sudiana, D.; Gunawan, T.S.; Salman, M. A New ECG Data Processing Approach to Developing an Accurate Driving Fatigue Detection Framework with Heart Rate Variability Analysis and Ensemble Learning. Information 2023, 14, 210. [Google Scholar] [CrossRef]
- Ramos, G.; Vaz, J.R.; Mendonça, G.V.; Pezarat-Correia, P.; Rodrigues, J.; Alfaras, M.; Gamboa, H.; Zou, L. Fatigue Evaluation through Machine Learning and a Global Fatigue Descriptor. J. Healthc. Eng. 2020, 2020, 6484129. [Google Scholar] [CrossRef]
- Liao, L.; Li, J. Research on Effect of Load Stimulation Change on Heart Rate Variability of Women Volleyball Athletes. Comput. Intell. Neurosci. 2022, 2022, 3917415. [Google Scholar] [CrossRef]
- Anwer, S.; Li, H.; Umer, W.; Antwi-Afari, M.F.; Mehmood, I.; Yu, Y.; Haas, C.; Wong, A.Y.L. Identification and Classification of Physical Fatigue in Construction Workers Using Linear and Nonlinear Heart Rate Variability Measurements. J. Constr. Eng. Manag. 2023, 149, 04023057. [Google Scholar] [CrossRef]
- Qin, H.; Zhou, X.; Ou, X.; Liu, Y.; Xue, C. Detection of Mental Fatigue State Using Heart Rate Variability and Eye Metrics during Simulated Flight. Hum. Factors Ergon. Manuf. 2021, 31, 637–651. [Google Scholar] [CrossRef]
- Liu, S.S.H.; Ma, C.J.; Chou, F.Y.; Cheng, M.Y.C.; Wang, C.H.; Tsai, C.L.; Duh, W.J.; Huang, C.H.; Lai, F.; Lu, T.C. Applying a Smartwatch to Predict Work-Related Fatigue for Emergency Healthcare Professionals: Machine Learning Method. West. J. Emerg. Med. 2023, 24, 693–702. [Google Scholar] [CrossRef]
- Faul, F.; Erdfelder, E.; Buchner, A.; Lang, A. Statistical power analyses using G*Power 3.1: Tests for correlation and regression analyses. Behav. Res. Methods 2009, 41, 1149–1160. [Google Scholar] [CrossRef]
- Bujang, M.A.; Adnan, T.H. Requirements for minimum sample size for sensitivity and specificity analysis. J. Clin. Diagn. Res. 2016, 10, YE01–YE06. [Google Scholar] [CrossRef]
- McCraty, R.; Shaffer, F. Heart Rate Variability: New Perspectives on Physiological Mechanisms, Assessment of Self-Regulatory Capacity, and Health Risk. Glob. Adv. Health Med. 2015, 4, 46–61. [Google Scholar] [CrossRef]
- Daskalovska, N.; Hadzi-Nikolova, A.; Alogjozovska, N.J. The use of metacognitive listening strategies by English language learners. Eur. J. Engl. Lang. Teach. 2023, 8. [Google Scholar] [CrossRef]
- Ries, D.; Gabriel Huerta, J. Predicting Fatigue from Heart Rate Signatures Using Functional Logistic Regression. Stat 2023, 12, e595. [Google Scholar] [CrossRef]
- Sanz, H.; Reverter, F.; Valim, C. Enhancing SVM for Survival Data Using Local Invariances and Weighting. BMC Bioinform. 2020, 21, 193. [Google Scholar] [CrossRef]
- Zhang, C.; Yu, X. Estimating Mental Fatigue Based on Electroencephalogram and Heart Rate Variability. Pol. J. Med. Phys. Eng. 2010, 16, 67–84. [Google Scholar] [CrossRef]
- Huang, S.; Li, J.; Zhang, P.; Zhang, W. Detection of Mental Fatigue State with Wearable ECG Devices. Int. J. Med. Inform. 2018, 119, 39–46. [Google Scholar] [CrossRef]
- Wang, J.S.; Lin, C.W.; Yang, Y.T.C. A K-Nearest-Neighbor Classifier with Heart Rate Variability Feature-Based Transformation Algorithm for Driving Stress Recognition. Neurocomputing 2013, 116, 136–143. [Google Scholar] [CrossRef]
- Mi, X.; Zou, B.; Zou, F.; Hu, J. Permutation-Based Identification of Important Biomarkers for Complex Diseases via Machine Learning Models. Nat. Commun. 2021, 12, 3008. [Google Scholar] [CrossRef] [PubMed]
- Järvelin-Pasanen, S.; Sinikallio, S.; Tarvainen, M.P. Heart rate variability and occupational stress—Systematic review. Ind. Health 2018, 56, 500–511. [Google Scholar] [CrossRef]
- Jelmini, J.D.; Ross, J.; Whitehurst, L.N.; Heebner, N.R. The effect of extended shift work on autonomic function in occupational settings: A systematic review and meta-analysis. J. Occup. Health 2023, 65, e12409. [Google Scholar] [CrossRef]
- van Amelsvoort, L.G.; Schouten, E.G.; Maan, A.C.; Swenne, K.A.; Kok, F.J. 24-Hour heart rate variability in shift workers: Impact of shift schedule. J. Occup. Health 2001, 43, 32–38. [Google Scholar] [CrossRef]
- Goffeng, E.M.; Nordby, K.C.; Tarvainen, M.P.; Järvelin-Pasanen, S.; Wagstaff, A.; Goffeng, L.O.; Bugge, M.; Skare, Ø.; Lie, J.A.S. Fluctuations in heart rate variability of health care workers during four consecutive extended work shifts and recovery during rest and sleep. Ind. Health 2018, 56, 122–131. [Google Scholar] [CrossRef]
- Thayer, J.F.; Åhs, F.; Fredrikson, M.; Sollers, J.J.; Wager, T.D. A Meta-Analysis of Heart Rate Variability and Neuroimaging Studies: Implications for Heart Rate Variability as a Marker of Stress and Health. Neurosci. Biobehav. Rev. 2012, 36, 747–756. [Google Scholar] [CrossRef]
- Fredrickson, B.L.; Cohn, M.A.; Coffey, K.A.; Pek, J.; Finkel, S.M. Open hearts build lives: Positive emotions, induced through loving-kindness meditation, build consequential personal resources. J. Personal. Soc. Psychol. 2008, 95, 1045–1062. [Google Scholar] [CrossRef] [PubMed]
- Salmani, S.; Salehpoor Emran, M.; Sadooghiasl, A.; Haghani, S.; Pashaeypoor, S. The Relationship between Mental Fatigue and Social Responsibility among Nurses Who Provided Care to Patients with Coronavirus Disease 2019: A Cross-Sectional Study. BMC Nurs. 2023, 22, 263. [Google Scholar] [CrossRef]
- Chang, H.E.; Cho, S.H. Nurses’ Steps, Distance Traveled, and Perceived Physical Demands in a Three-Shift Schedule. Hum. Resour. Health 2022, 20, 72. [Google Scholar] [CrossRef] [PubMed]
- Finan, P.H.; Quartana, P.J.; Smith, M.T. The Effects of Sleep Continuity Disruption on Positive Mood and Sleep Architecture in Healthy Adults. Sleep 2015, 38, 1735–1742. [Google Scholar] [CrossRef]
- Lehrer, P.M.; Gevirtz, R. Heart Rate Variability Biofeedback: How and Why Does It Work? Front. Psychol. 2014, 5, 756. [Google Scholar] [CrossRef] [PubMed]
- Van Amelsvoort, L.G.P.M.; Schouten, E.G.; Maan, A.C.; Swenne, C.A.; Kok, F.J. Occupational Determinants of Heart Rate Variability. Int. Arch. Occup. Environ. Health 2000, 73, 255–262. [Google Scholar] [CrossRef]
- Jarczok, M.N.; Jarczok, M.; Mauss, D.; Koenig, J.; Li, J.; Herr, R.M.; Thayer, J.F. Autonomic Nervous System Activity and Workplace Stressors—A Systematic Review. Neurosci. Biobehav. Rev. 2013, 37, 1810–1823. [Google Scholar] [CrossRef]
- Ring, M.; Eskofier, B.M. An Approximation of the Gaussian RBF Kernel for Efficient Classification with SVMs. Pattern Recognit. Lett. 2016, 84, 107–113. [Google Scholar] [CrossRef]
- Sagherian, K.; Steege, L.M.; Cobb, S.J.; Cho, H. Insomnia, Fatigue and Psychosocial Well-Being during COVID-19 Pandemic: A Cross-Sectional Survey of Hospital Nursing Staff in the United States. J. Clin. Nurs. 2023, 32, 5382–5395. [Google Scholar] [CrossRef]
- Alsabry, A.; Algabri, M.; Ahsan, A.M.; Mosleh, M.A.A.; Ahmed, A.A.; Qasem, H.A. Enhancing Prediction Models’ Performance for Breast Cancer Using SMOTE Technique. In Proceedings of the 2023 3rd International Conference on Emerging Smart Technologies and Applications, eSmarTA 2023, Taiz, Yemen, 10–11 October 2023. [Google Scholar] [CrossRef]
- Tran, Y.; Wijesuriya, N.; Tarvainen, M.; Karjalainen, P.; Craig, A. The Relationship between Spectral Changes in Heart Rate Variability and Fatigue. J. Psychophysiol. 2009, 23, 143–151. [Google Scholar] [CrossRef]
- Åkerstedt, T.; Folkard, S. The three-process model of alertness and its extension to performance, sleep latency, and sleep length. Chronobiol. Int. 1997, 14, 115–123. [Google Scholar] [CrossRef] [PubMed]
- Kakhi, K.; Jagatheesaperumal, S.K.; Khosravi, A.; Alizadehsani, R.; Acharya, U.R. Fatigue Monitoring Using Wearables and AI: Trends, Challenges, and Future Opportunities. arXiv 2024, arXiv:2412.16847. [Google Scholar] [CrossRef]

| Features | Morning Shift | Afternoon Shift | Night Shift | |||
|---|---|---|---|---|---|---|
| Before | After | Before | After | Before | After | |
| Mean RR | 726.71 ± 78.48 | 739.88 ± 81.52 | 687.84 ± 71.55 | 786.32 ± 87.67 | 721.93 ± 71.74 | 803.31 ± 86.70 |
| SDNN | 29.64 ± 9.53 | 29.81 ± 9.62 | 29.89 ± 13.88 | 35.90 ± 14.26 | 28.22 ± 9.60 | 35.38 ± 15.64 |
| Mean HR | 83.50 ± 9.21 | 82.03 ± 9.00 | 88.18 ± 9.75 | 77.33 ± 9.90 | 83.89 ± 8.40 | 75.54 ± 8.46 |
| RMSSD | 28.71 ± 13.41 | 29.85 ± 12.80 | 26.62 ± 16.07 | 35.69 ± 16.80 | 26.37 ± 10.80 | 37.27 ± 22.34 |
| NN50 | 40.13 ± 45.21 | 41.17 ± 36.89 | 39.75 ± 55.29 | 63.45 ± 56.33 | 30.94 ± 32.04 | 70.52 ± 73.54 |
| pNN50 | 10.65 ± 12.40 | 11.03 ± 10.42 | 9.68 ± 13.75 | 17.51 ± 15.67 | 7.59 ± 7.84 | 20.39 ± 22.13 |
| VLF | 64.62 ± 61.51 | 58.42 ± 49.04 | 51.49 ± 40.74 | 85.40 ± 106.51 | 63.94 ± 82.84 | 130.83 ± 165.2 |
| LF | 342.44 ± 190.8 | 316.73 ± 170.0 | 409.26 ± 333.3 | 560.49 ± 469.9 | 346.9 ± 189.29 | 513.8 ± 362.08 |
| HF | 481.62 ± 428.3 | 501.41 ± 384.07 | 605.48 ± 705.3 | 689.04 ± 626.1 | 392.64 ± 307.1 | 724.81 ± 819.6 |
| LF/HF | 1.07 ± 0.74 | 0.90 ± 0.57 | 1.45 ± 1.50 | 1.32 ± 1.22 | 1.76 ± 2.05 | 1.58 ± 1.61 |
| Summary | Lack of Energy | Lack of Motivation | Sleepiness | Physical Exertion | Physical Discomfort | Total Score |
|---|---|---|---|---|---|---|
| n | 60 | 60 | 60 | 60 | 60 | 60 |
| Mean | 4.8 | 4.6 | 3.0 | 2.8 | 2.8 | 4.6 |
| St Dev | 7.88 | 7.87 | 7.92 | 8.18 | 8.16 | 8.18 |
| Min | 2.0 | 1.0 | 2.0 | 1.0 | 1.0 | 1.0 |
| Max | 6.0 | 5.4 | 5.8 | 5.0 | 5.4 | 5.5 |
| Measure | df | Mean Square (95% CI) | F | Sig. |
|---|---|---|---|---|
| Mean RR | 2 | 0.003 | 0.829 | 0.442 |
| SDNN | 2 | 0.005 | 0.088 | 0.916 |
| Mean HR | 2 | 0.003 | 0.829 | 0.442 |
| RMSSD | 2 | 0.002 | 0.022 | 0.978 |
| NN50 | 2 | 0.019 | 0.020 | 0.980 |
| pNN50 | 2 | 0.032 | 0.043 | 0.958 |
| VLF | 2 | 0.110 | 0.594 | 0.555 |
| LF | 2 | 0.082 | 0.587 | 0.559 |
| HF | 2 | 0.048 | 0.116 | 0.891 |
| LF/HF | 2 | 0.180 | 0.884 | 0.419 |
| Measure | df | Mean Square (95% CI) | F | Sig. |
|---|---|---|---|---|
| Mean RR | 1 | 0.041 | 59.437 | 0.000 ** |
| SDNN | 1 | 0.095 | 7.461 | 0.008 ** |
| Mean HR | 1 | 0.041 | 59.432 | 0.000 ** |
| RMSSD | 1 | 0.254 | 15.734 | 0.000 ** |
| NN50 | 1 | 1.989 | 10.063 | 0.002 ** |
| pNN50 | 1 | 1.723 | 10.807 | 0.002 ** |
| VLF | 1 | 0.678 | 4.379 | 0.041 * |
| LF | 1 | 0.140 | 1.847 | 0.179 |
| HF | 1 | 0.571 | 7.695 | 0.007 ** |
| LF/HF | 1 | 0.146 | 2.710 | 0.105 |
| Pair | Pearson’s R (95% CI) |
|---|---|
| SDNN and Sleepiness | −0.222 |
| SDNN and Physical Exertion | −0.214 |
| SDNN and Physical Discomfort | −0.244 |
| Mean HR and Sleepiness | 0.230 |
| RMSSD and Sleepiness | −0.275 * |
| NN50 and Sleepiness | −0.306 * |
| pNN50 and Sleepiness | −0.306 * |
| VLF and Lack of Motivation | −0.230 |
| VLF and Sleepiness | −0.231 |
| VLF and Physical Exertion | −0.260 * |
| VLF and Physical Discomfort | −0.268 * |
| LF and Physical Exertion | −0.220 |
| LF and Physical Discomfort | −0.225 |
| HF and Sleepiness | −0.230 |
| HF and Physical Discomfort | −0.227 |
| Classifier | Accuracy (Training) | Accuracy (Testing) | Precision | Recall | F1-Score | Computation Time |
|---|---|---|---|---|---|---|
| Logistic Regression | 0.6348 | 0.4722 | 0.6200 | 0.4700 | 0.4800 | 1.13 |
| SVM (Linear) | 0.6011 | 0.6110 | 0.7500 | 0.6100 | 0.6400 | 0.83 |
| SVM (Quadratic) | 0.8790 | 0.5556 | 0.6100 | 0.5600 | 0.5800 | 1.37 |
| SVM (Cubic) | 0.9839 | 0.5556 | 0.6100 | 0.5600 | 0.5800 | 1.45 |
| SVM (Fine Gaussian) | 0.9758 | 0.8148 | 0.8100 | 0.8100 | 0.8100 | 1.60 |
| SVM (Coarse Gaussian) | 0.7581 | 0.6944 | 0.7300 | 0.6900 | 0.7100 | 1.57 |
| k-NN | 0.9609 | 0.5278 | 0.5300 | 0.5200 | 0.5200 | 3.04 |
Disclaimer/Publisher’s Note: The statements, opinions and data contained in all publications are solely those of the individual author(s) and contributor(s) and not of MDPI and/or the editor(s). MDPI and/or the editor(s) disclaim responsibility for any injury to people or property resulting from any ideas, methods, instructions or products referred to in the content. |
© 2025 by the authors. Licensee MDPI, Basel, Switzerland. This article is an open access article distributed under the terms and conditions of the Creative Commons Attribution (CC BY) license (https://creativecommons.org/licenses/by/4.0/).
Share and Cite
Hafiz, W.S.; Puspasari, M.A.; Fitriani, D.Y.; Hanowski, R.J.; Syaifullah, D.H.; Arista, S.A. Developing a Fatigue Detection Model for Hospital Nurses Using HRV Measures and Machine Learning. Safety 2025, 11, 48. https://doi.org/10.3390/safety11020048
Hafiz WS, Puspasari MA, Fitriani DY, Hanowski RJ, Syaifullah DH, Arista SA. Developing a Fatigue Detection Model for Hospital Nurses Using HRV Measures and Machine Learning. Safety. 2025; 11(2):48. https://doi.org/10.3390/safety11020048
Chicago/Turabian StyleHafiz, Wynona Salsabila, Maya Arlini Puspasari, Dewi Yunia Fitriani, Richard Joseph Hanowski, Danu Hadi Syaifullah, and Salsabila Annisa Arista. 2025. "Developing a Fatigue Detection Model for Hospital Nurses Using HRV Measures and Machine Learning" Safety 11, no. 2: 48. https://doi.org/10.3390/safety11020048
APA StyleHafiz, W. S., Puspasari, M. A., Fitriani, D. Y., Hanowski, R. J., Syaifullah, D. H., & Arista, S. A. (2025). Developing a Fatigue Detection Model for Hospital Nurses Using HRV Measures and Machine Learning. Safety, 11(2), 48. https://doi.org/10.3390/safety11020048