1. Introduction
Following the “Global Plan for the Decade of Action for Road Safety 2021–2030”, a publication by the World Health Organization, it was elucidated that the annual global fatality toll resulting from road traffic-related collisions reached nearly 1.25 million [
1]. Tens of millions were injured, solidifying road traffic injuries as a preeminent causal factor for global mortality. Furthermore, vehicular accidents present a substantial predicament, accounting for 90% of fatalities in economies characterised by low- and middle-income countries [
2,
3]. Truck accidents are considered one of the most severe consequences of road transportation, attracting global interest to identify the dominant causal factors [
4,
5,
6]. In the United States, in 2021, 5700 heavy trucks had fatal crashes, marking an 18% and 48% increase since 2020 and over the past ten years, respectively. The engagement rate per 100 million large-truck miles travelled has increased by 7% since 2020 and 22% over the last ten years [
7]. Meanwhile, the data from the National Police showed that 21,463 accidents occurred per year in 2021, incurring a loss of IDR 200 billion [
8].
Truck accidents can be caused by various factors [
4,
9,
10], including driver negligence, such as being unfit or drunk [
11], exceeding the speed limit [
12,
13,
14], and losing control of their vehicle. Other factors include damaged road conditions, potholes, traffic obstacles, and bad weather, such as heavy rain, snow, ice floes, or thick fog, which reduce visibility and vehicle traction [
15,
16,
17,
18] due to sudden braking or extreme manoeuvring to avoid another vehicle that has stopped suddenly, damaged equipment, brake system failure, or other technical problems with the truck itself [
19,
20,
21,
22]. Previous studies also showed factors that caused truck accidents, including overloading [
23,
24,
25], inexperienced drivers [
26], and electronic glitches or problems in modern truck control systems. It also includes other human factors, such as driving behaviours [
27,
28], namely road aggression, non-compliance with traffic rules, or lack of safety awareness.
The percentage of truck accidents caused by human and organisational error can vary depending on many factors, including country, regulations, and the transportation industry. However, human error generally tends to be the leading cause of accidents. According to [
29], organisational error and an unsafe environment can also significantly affect accidents. These errors include setting unrealistic schedules that force drivers to drive when tired, leading to fatigue [
30,
31,
32,
33], pressure to meet tight delivery deadlines, lack of adequate training for drivers [
34], and poor maintenance on truck fleets. Inadequate salary, which is one of the responsibilities of an organisation, also contributes to the adverse mental condition of the drivers [
35]. It is also necessary to analyse the effect of organisational error on the severity and type of truck accidents. Since severity and accident type can lead to fatality regarding various accident conditions [
36,
37,
38,
39], effective management and mitigation of these violations can substantially decrease the frequency of significant road accidents.
Many studies have used safety assessment methods to clarify and determine the factors or elements influencing the occurrence of accidents [
40]. According to [
3], human factors directly caused 57% of road accidents, with 90% of these cases revolving around this critical aspect. A causation model plays a significant role in examining and understanding accidents. Furthermore, the accident causation model offers a detailed examination of accident occurrences, outlining their causes, progression, and consequences. Accidents can be interpreted differently depending on the specific analysis model used. Multiple methods exist for categorising the factors contributing to accidents into essential codes instrumental in trend analysis and preventing human error. In recent times, attention to accident causal models has shifted towards systematic methods, including AcciMap [
41], STAMP [
42], and FRAM [
43]. These systems-based risk methods are increasingly popular because they offer a more thorough analysis of accident causes and establish clear, logical connections. The introduction of the domino theory has led to the widespread acceptance of the linear accident causation model due to its precise categorisation of accident causes, resulting in the recognition of the Swiss cheese model and HFACS. Despite the differences in accident causation models across different periods, they have played a crucial role in minimising accidents.
This study aims to identify numerous risk factors related to human error of truck drivers in Indonesia using HFACS (Human Factor and Classification Error) and Bayesian Network (BN) analysis. More specifically, the primary objectives of this study are as follows:
To develop a human factors failure model in truck accidents that can depict the actual situation despite limited data.
To assess the relationship among factors in HFACS that may influence truck accidents.
To employ both qualitative and quantitative methods to analyse truck accidents.
The remaining part of this study is organised as follows. First, the literature review is explained. Second, the methodology of data collection, HFACS, and BN modelling are carried out. Third, the relation between levels and unsafe acts was provided and analysed. Finally, the discussion is presented, and the conclusions are stated.
2. Theoretical Framework
The accident causation model addresses two key issues: the reasons for its occurrence and the specific process through which it unfolds. This model is a critical foundation in the safety study field and is essential for analysing and preventing accidents. This study used a novel system method to create an alternative methodology for analysing truck accidents. A framework for causal categories rooted in HFACS was initially established, followed by using BN to examine the interplay of contributing factors at different levels within the road traffic system.
Previous studies have consistently emphasised human error as the cause of accidents [
44,
45,
46]. One human error method that has gained significant attention is the Swiss Cheese Model (SCM) proposed by [
47,
48]. The SCM consists of four levels of human failures: unsafe acts, pre-conditions, unsafe supervision, and organisational influences. Unsafe acts are defined as active failures, often likened to “holes” in the proverbial cheese and are generally regarded as the immediate triggers of accidents. In contrast, distinct from their active counterparts, latent failures consist of pre-conditions for unsafe acts, unsafe supervision, and organisational influences. These factors remain dormant or undetected for extended periods, only to surface unexpectedly, causing unforeseen accidents [
49]. The SCM has brought about a paradigm shift in the traditional accident causation model. However, it primarily serves as a theoretical framework and may lack the practical details needed for application.
Based on the SCM concepts, HFACS is a widely recognised system developed to investigate and classify human error in accidents. Accordingly, it systematically analyses contributing factors related to individuals, organisations, technology, and the environment. HFACS categorises the factors contributing to accidents into causal groups, thereby addressing the shortcomings of SCM. In the context of truck accidents, this framework is instrumental in breaking down complex accidents into manageable categories for analysis.
Since its initial development, HFACS has proven to be a powerful tool for identifying and classifying human and organisational factors in accident investigation. Previous studies have used this method to examine and analyse the range of accidents across different areas, including the chemical industry [
50,
51], maritime and shipping [
52], aviation [
53,
54], railways [
46,
55], and road accidents [
3].
HFACS presents a systematic and hierarchical structure organised into four failure levels: unsafe acts, pre-conditions, unsafe supervision, and organisational influences. The first level is active failures, and the others represent latent failures. The four levels and 19 factors of HFACS proved insufficient to capture all causes of accidents, leading to their expansion by studies. The introduction of the fifth highest level, known as “External Factors”, aimed to enhance the consideration of related elements, as suggested by [
56]. These external factors include regulatory supervision and environmental elements, such as economic, political, social, and legal conditions. The application of five levels of HFACS has been applied in the maritime sector [
45,
56] and road accidents [
57].
The HFACS-based classification system includes five failure categories, namely (1) Unsafe Acts, which have been the primary focal points in previous accident inquiries, consisting of errors and violations of the drivers, (2) Pre-conditions for Unsafe Acts, covering driver conditions and practices, (3) Unsafe Supervision, which follows the causal sequence of events up to the supervisory level, including subcategories, such as inadequate oversight, the endorsement of improper procedures, neglecting known issues, and violations of supervisory rules, (4) Organisational influence, describing the decisions of upper-level management that directly influence supervisory practices, driver conditions, and behaviours, and (5) External Factors, including the failure of the government department to manage and oversee operations while also neglecting to enforce relevant laws and regulations, as evidenced by the absence of regular vehicle testing. Previous studies have adapted specific indicators based on the characteristics of road traffic accidents and insights from road safety investigations.
Accidents were regarded as outcomes resulting from unforeseen and uncontrolled interactions among the components of a system, necessitating its comprehensive analysis as cohesive entities [
58]. A crucial aspect of systems theory is the advent of properties stemming from nonlinear interactions across multifaceted socio-technical systems, including multiple components [
59]. Road traffic systems represent intricate socio-technical constructs comprising drivers, vehicles, the road environment, users, laws, and regulations. HFACS-based causal categories provide a clear and precise method for recognising factors that contribute to road traffic accidents. Every level of HFACS frameworks is built upon each other, with factors evolving from active to latent conditions as they transition from unsafe acts to organisational influences. HFACS has a fundamental principle that every level impacts the next level. However, some studies have raised concerns about its step-by-step structure, asserting that it simplifies the comprehension of accidents caused by neglecting the intricate interactions within the components of the system [
60,
61].
HFACS is often combined with other methods to emphasise the complex interaction among system components, thereby overcoming its limitations. This study combined HFACS and BN to model and quantify the data gathered from the analysis. BN is widely used to quantify qualitative data and predict the hazard condition. The combination is a potent instrument for analysing complex systems, identifying causal factors, and making informed decisions. Unlike previous studies [
62,
63] that might have explored factors individually, this study assesses the interdependencies and relationships among various factors contributing to truck accidents. Employing BN to understand conditional dependencies among causal factors identified by HFACS offers a deeper comprehension of the complex interactions leading to accidents. Moreover, its utility extends across various sectors and fields, rendering these invaluable assets for enhancing safety decision-making processes and gaining insights into intricate phenomena. The unique features of BN allow for a more comprehensive understanding of the interaction of various factors and their contribution to the outcome. The method combination of HFACS and BN has been applied in several sectors, including the maritime industry [
64] and the manufacturing industry [
65,
66]. However, to the best of our knowledge, the application of HFACS-BN to analyse road accidents related to trucks has not been conducted yet.
3. Material and Methods
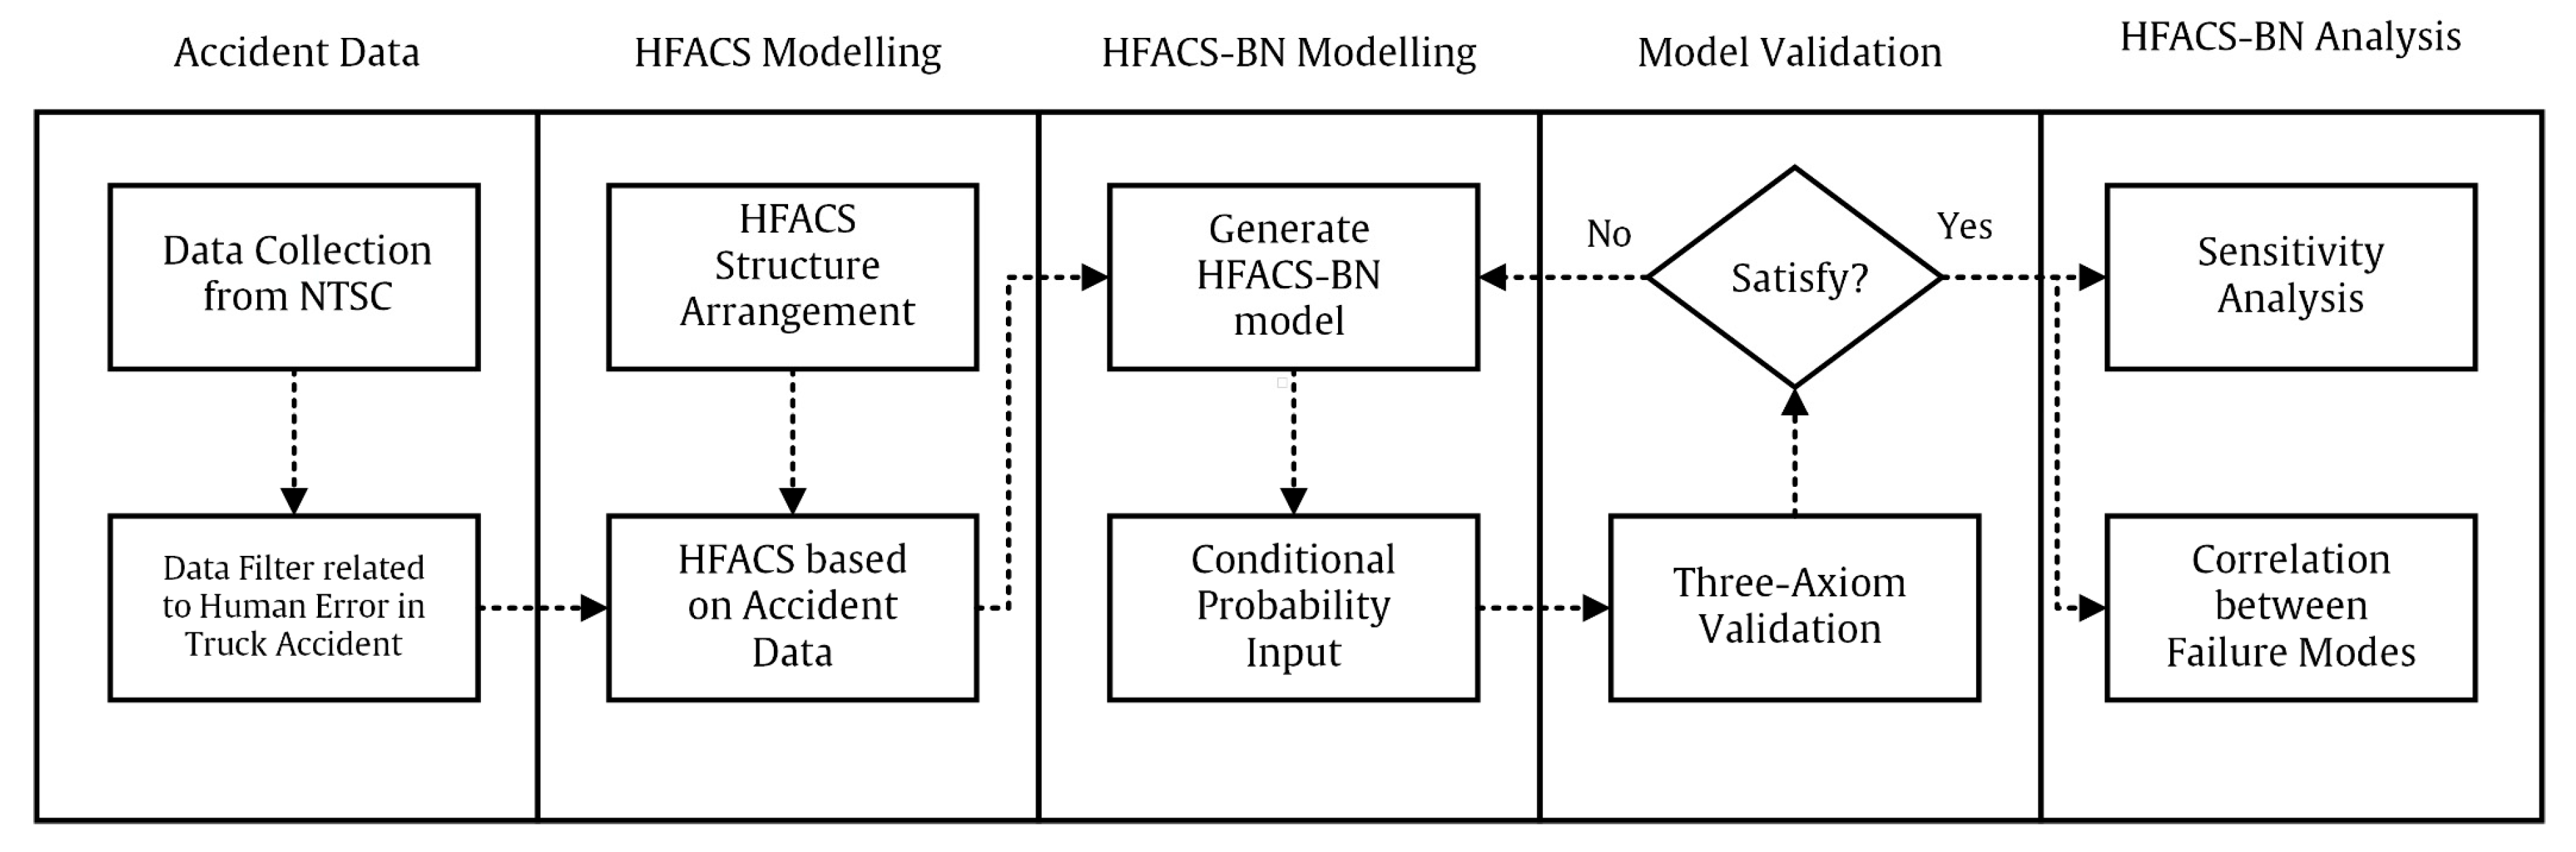
3.1. Study Framework
The methodology used in this study consists of five general steps, as shown in
Figure 1. First, accident data regarding truck accidents in Indonesia were gathered for analysis. Secondly, the HFACS structure was designed and arranged based on several related studies in road and maritime accidents, depending on accident data. Third, HFACS-BN was modelled based on the real-case scenario, and the Conditional Probability (CPT) was also incorporated. Fourth, the model was validated using the three-axiom method [
67,
68,
69] for verification based on natural causes of accidents. The model was able to proceed to the final steps when the axiom requirements were satisfied. Finally, the sensitivity analysis and assessment of the correlation between levels in HFACS-BN were carried out to determine the failure modes with the most significant impact on accidents.
3.2. Data Collection
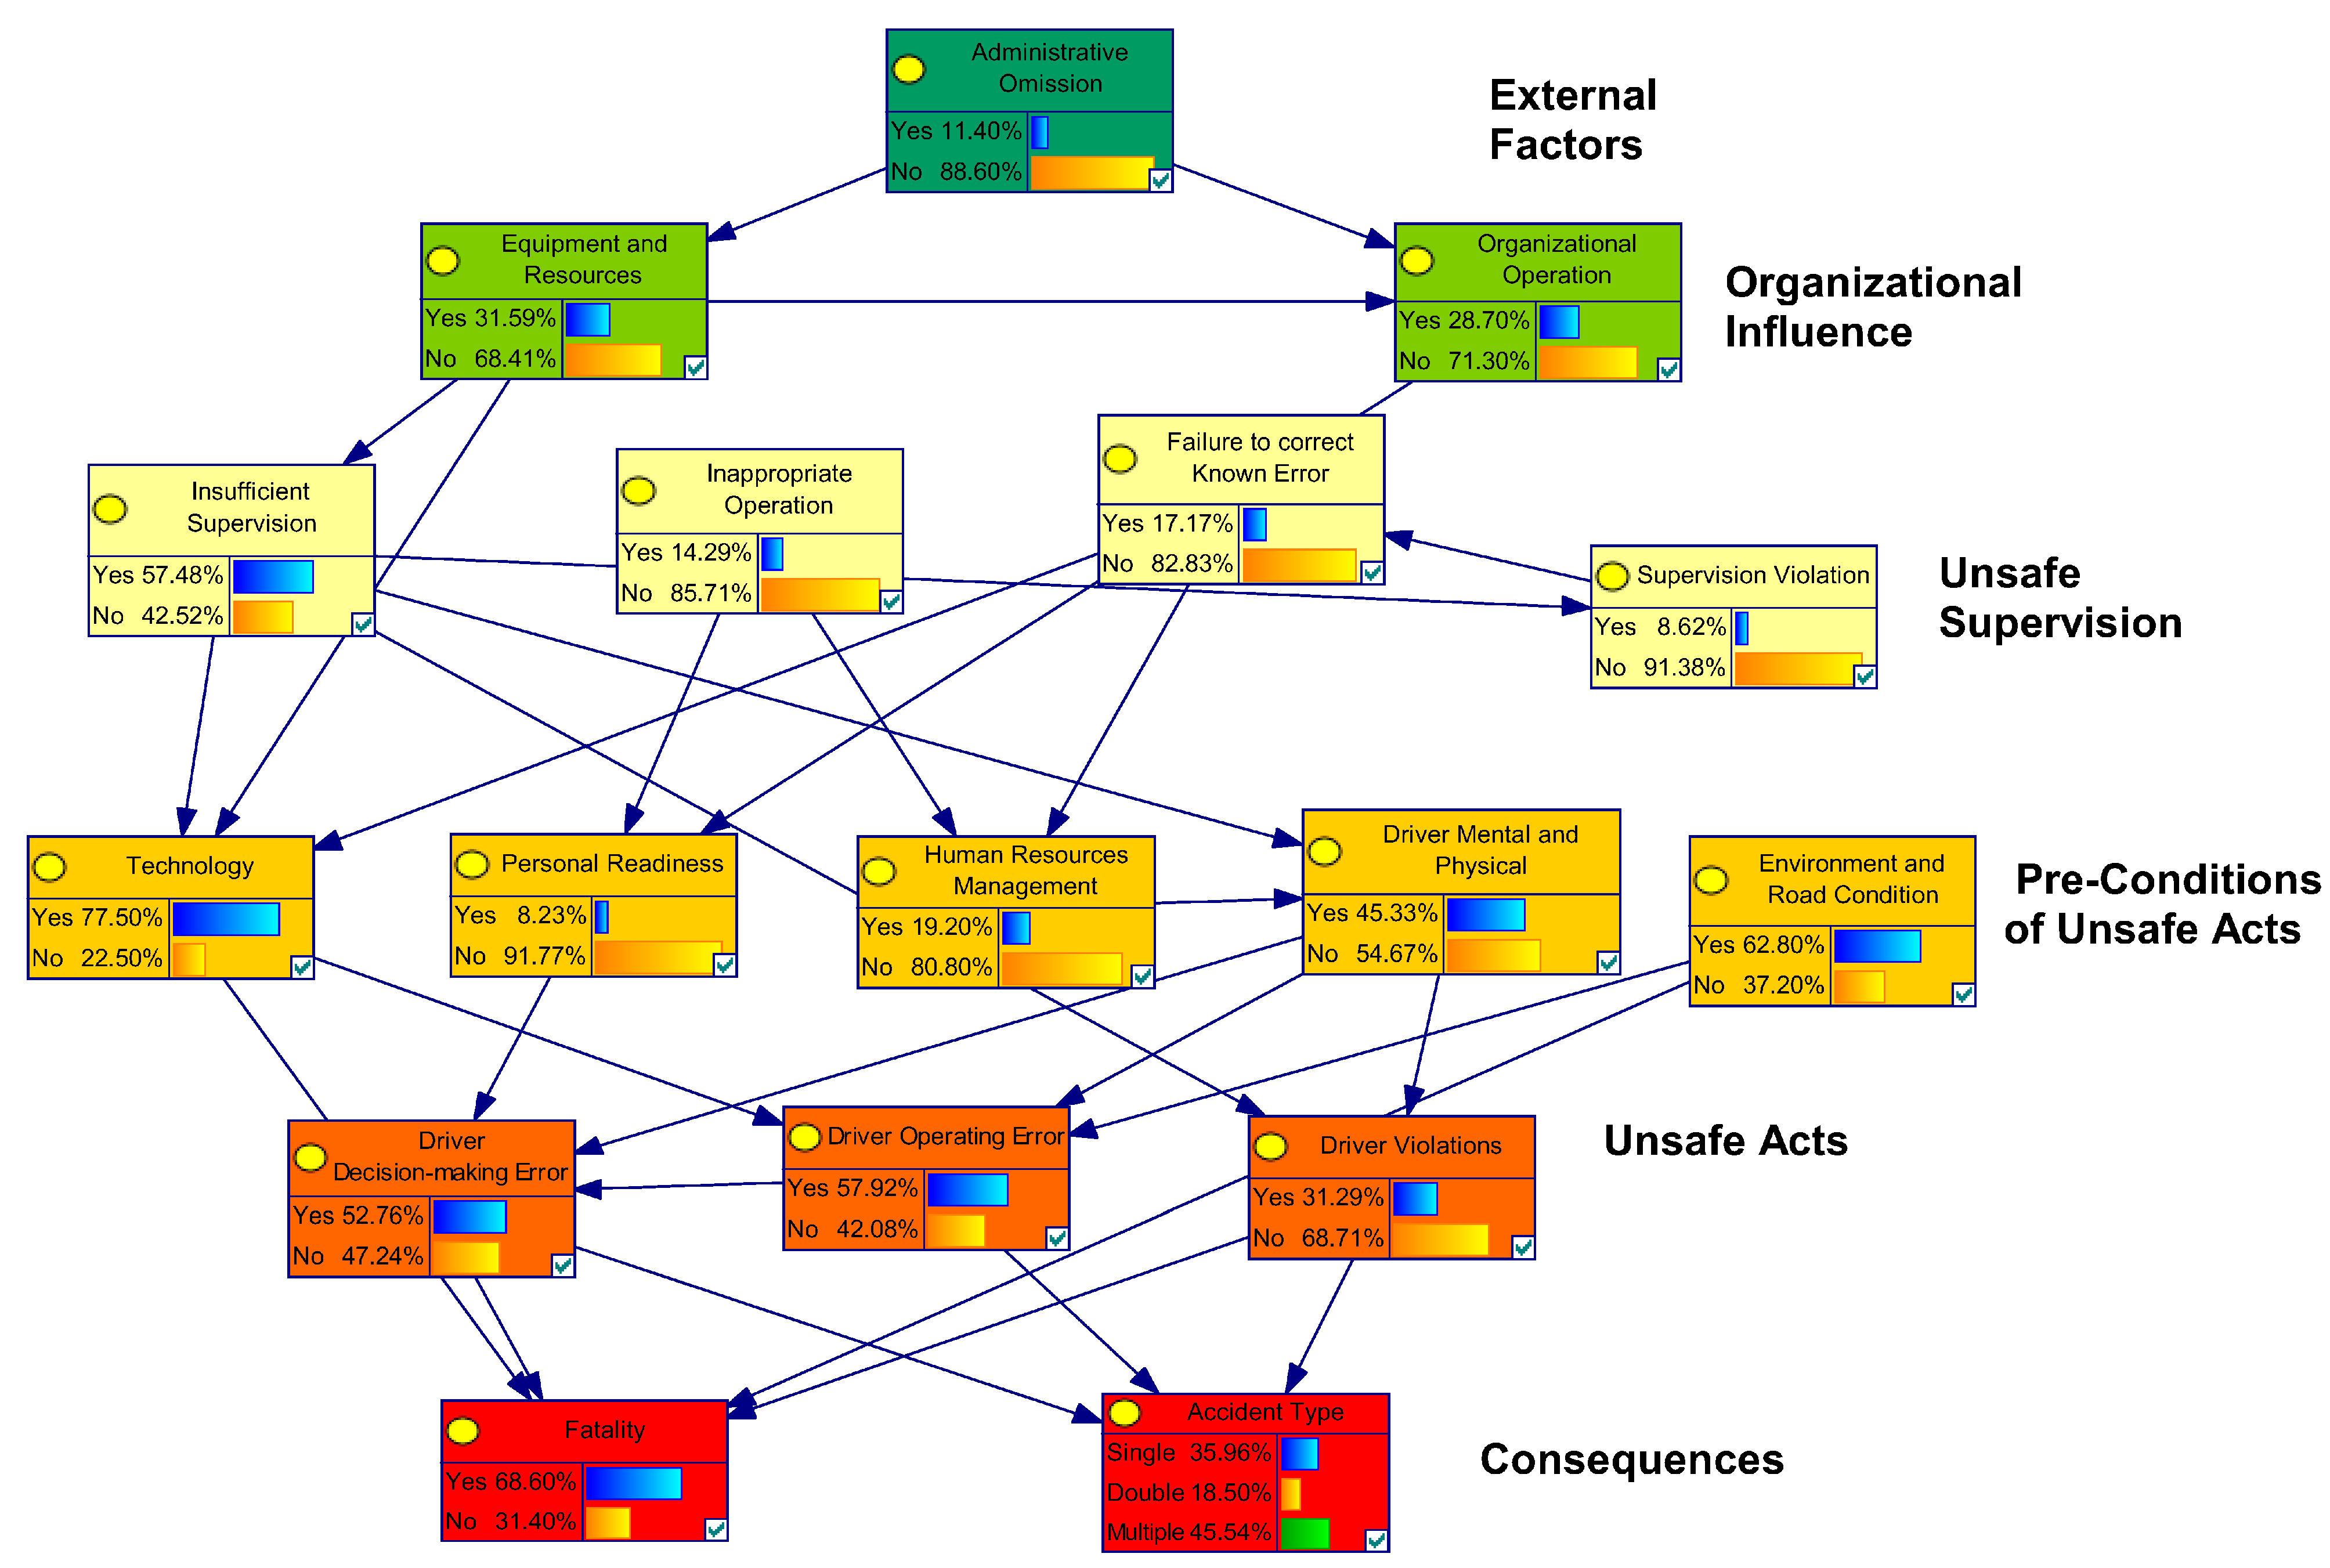
The Indonesia National Transportation Safety Committee (NTSC) is a government agency investigating all modes of transportation accidents. NTSC’s purposes are investigating accidents that are unprecedented, causing fatality, and publishing reports that may provide new lessons and recommendations for stakeholders. From 2008 to 2023, NTSC investigated 48 road accidents involving trucks. Of those 48 accidents, only 35 cases reported the truck as the main object of report investigation. Therefore, only those 35 data reports were further analysed and modelled by BN. The accident data used in this study were fatal accidents. Although the number of data reports in this study is limited, each report underwent a thorough and comprehensive investigation, encompassing various pertinent variables crucial for truck accident analysis. NTSC investigators considered human and organisational factors in their analysis, but HFACS taxonomy was not used for the classification.
3.3. HFACS Modelling
The HFACS model used in this study was based on the original proposal by [
49]. However, external factors were added at the top level since regulatory omission, legislation flaws, and social factors could influence truck driver accidents. Several alterations were also carried out within the sub-level of each HFACS level. The failure modes on each sub-level are based on the data from the accident report. In a case where the failure mode was not stated or occurred in the dataset, it was excluded from the HFACS framework.
Table 1 shows a detailed explanation of each failure mode.
3.3.1. External Factors
Many studies have developed the fifth level of HFACS, namely external factors, which integrate the legal, policy, and social aspects that complement the original taxonomy. Outstanding results have been attained in construction [
70], marine transportation [
71], mining industries [
72], and road accidents [
2]. The only external factors considered in this study are administrative omissions, which include the failure of periodic testing conducted by the government, either during inspection or due to overlooked checks of the components.
3.3.2. Unsafe Supervision
According to [
2,
57], Unsafe Supervision has four failure modes: insufficient supervision, planned inappropriate operation, failure to correct known errors, and violations. A modification was made to describe the negligence to correct known errors, referring to the failure report or fixing the existing problem in the vehicle.
3.3.3. Pre-Conditions of Unsafe Acts
According to [
2], the conditions of the driver in bus accidents were separated into 3 categories, namely the mental, physical condition, and psychological limitations. However, since the frequency of the two latest failure modes was considerably low, they were integrated into the Mental and Physical Condition failure modes. The model used on bus accidents was adapted for truck accidents because it is analogous in terms of working hours, pressure from the company, and driving routes. [
73] also stated several similarities in the contributing factors to bus and truck accidents. Truck drivers’ pressures and risks while travelling vary from thuggery, extortion, overloading, not mastering the route, worrying about obstacles and calamities, and inadequate family time. This is also the case for bus drivers, who feel irritated and infuriated when they cannot meet work targets, cover hundreds or even thousands of kilometres, and suffer from sleep deprivation and lack of rest, causing them to speed and violate traffic regulations, even in tourism transportation. Therefore, at the level of pre-conditions, since there are numerous correspondences, the mental condition model for buses can be adapted for truck accidents.
3.3.4. Unsafe Acts
A slight adjustment was made to the level of Unsafe Acts compared to the original one. The failure mode perception error was integrated into the “Driver Decision-making Error”. The skill-based error is associated with operating error since several accidents occurred due to the inability of the driver to use the brake mechanism properly. In comparison, driver violations consisted of failure to comply with road regulations, use of vehicles exceeding the limit, and inappropriate driving license classification.
3.4. Structure of HFACS-BN
Bayesian Network (BN) analysis was utilised in this study for a robust approach to modelling probabilities and exploring inter-variable relationships in HFACS. BN has the capacity to manage the uncertainty inherent in limited data by depicting probabilistic relationships between variables. BN presents inter-variable relationships graphically to interpret and comprehend how human factors, as analysed by HFACS, interact to cause truck accidents. BN can also enhance the efficiency of utilising available data by better modelling probabilistic relations between variables compared to traditional methods that may require more data to yield equivalent results. Therefore, the use of BN to model the HFACS despite data limitations is suitable.
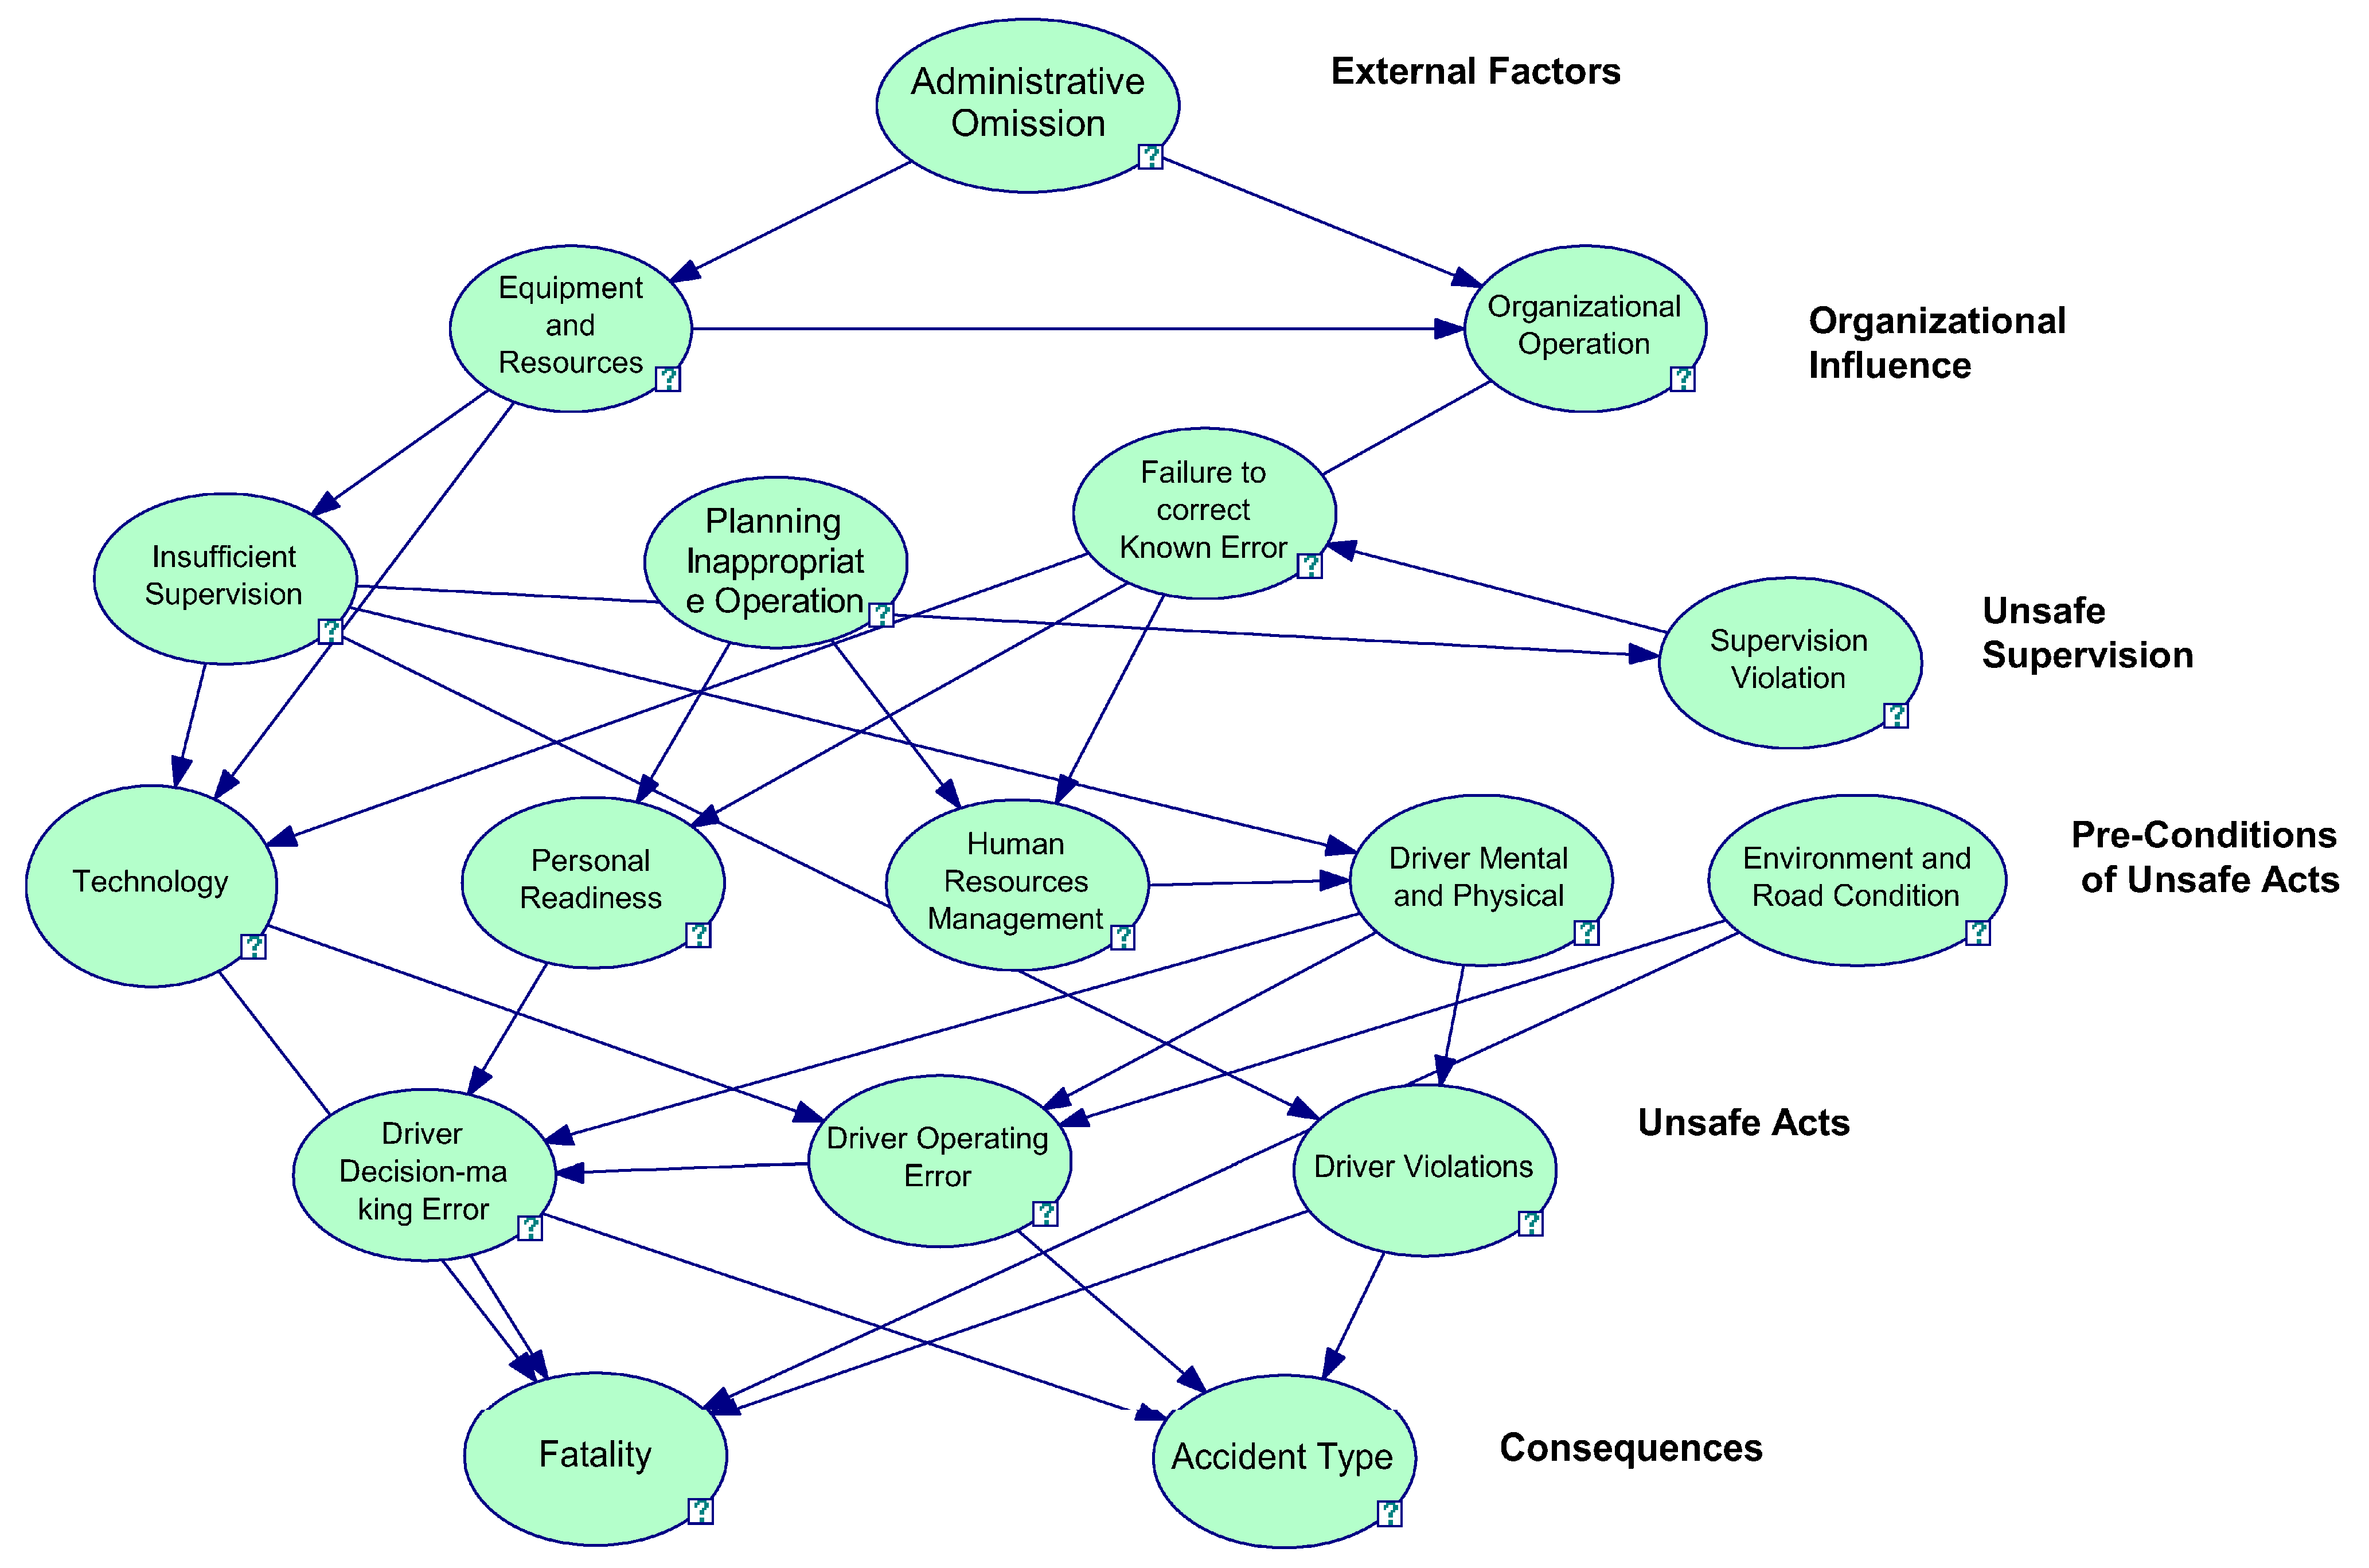
The most crucial part in the phase of HFACS-BN modelling was the definition of DAG from parent to child node, representing a causal relationship. Real-case scenarios influence this determination of the DAG. The BN from each accident was constructed to find the possible relationship between nodes. Furthermore, the parent node of the DAG is mainly at the upper level of HFACS, and the child node is one level below. The DAG sometimes connects to a node surpassing two levels, as shown in
Figure 2. For example, the node “Insufficient supervision”, which is the failure to check driver qualifications, directly causes violations of inappropriate driving license qualifications to occur.
It is also possible that the DAG is connected to analyse the causal relationship at the same level. For instance, the node “Human Resource Management” is connected by DAG to the Driver Mental and Physical Condition node. Since Human Resource Management is responsible for the miscommunication and terrible relationship between the drivers and management, it induces mental pressure on the drivers. The “Technology and Environmental and Road Condition” node is directly related to the “Fatality Consequences” node. According to the proposed HFACS-PV for maritime, the technology and environment are categorised as the operational conditions in accidents. In the model of HFACS-PV and BN, DAG directly connects the node of technology and environmental conditions to the consequences node. Furthermore, the “Technology and Environmental conditions” are connected to “Driver Operating Error” since the failure is affected by the inappropriate skill of the driver and vice versa. The environmental and road conditions also affect the driver’s ability to navigate particular road contours.
Table 2 shows a detailed explanation of the connectivity for each node within the Bayesian network model. There are three root nodes: A1, C2, and D4; according to the investigation data, no failure modes lead to these root nodes. Since “Fatality” is the target node in this study, it has the most significant number of parent nodes, with four failure modes.
3.5. Bayesian Network
3.5.1. Calculation of Posterior Probability
A Bayesian network, also known as a causal model, is a graphical model that depicts the conditional independence of a set of random variables [
74]. The Bayesian network approach uses a Directed Acyclic Graph model to connect the relationship between components (nodes). For example, if an arrow connects nodes
A and
B, this might be understood as
A causing
B to occur. The nodes are made up of states that express the nodes’ current state. Furthermore, Bayesian networks take a qualitative and quantitative approach to problems. The Bayesian Network represents the qualitative method, a causal link between nodes. On the other hand, the quantitative approach is expressed in numerical values of conditional probability tables at each node.
The main output for the Bayesian network is the posterior probability, which can also be translated as the probability of
x if other events occur. Using Bayesian networks necessitates a thorough understanding of conditional probability [
75,
76]. For example, when a parent node
A has a child node
B connected by an arrow, because event
A is known, the likelihood of event
B can be computed as follows:
P(
B|A)
= x. Meanwhile, when event B is known, the likelihood of event
A can be calculated by Equations (1) and (2),
where
P(
Ai|B) is the posterior probability,
P(
B|Ai) is the conditional probability of
B when
Ai is already known,
P(
Ai) is the prior probability of the hypothesis, and
P(
B) is the probability of
B without dependency from
A or the marginal probability.
3.5.2. Sensitivity Analysis
The sensitivity analysis in the scope of the Bayesian network is employed for model validation and analysis of causal relationships between nodes. The purpose is to define which nodes have the most influential factors regarding the target nodes [
77]. Sensitivity analysis of a Bayesian network entails creating a function expressing an output probability in terms of the parameter under consideration for each network’s parameters [
78]. This study conducted a sensitivity analysis on the “Consequences” and “Unsafe Acts” levels. The posterior probability, or the target nodes of the sensitivity analysis, can be denoted by the form
y = P(
a|e), where a is the number of variables A and e expresses the given evidence. The node’s parameter within the model can be formed by
x = P(
bi|π),
bi is a value of variable B, and
pi is the joint probability from the conditional probability. In the sensitivity analysis, adjusting the ratio between probability density left controlled every variation parameter of
x = P(
bi|π) and particular probabilities
P(
bj|π) [
79]. If the parameters
P(
bj|π) are the functions of
x, the sensitivity analysis can be yielded as Equation (3) with
P(
bi|π) < 1.
4. Results
4.1. Posterior Probability Results by HFACS-BN
Based on the posterior probability, it is evident that the likelihood of fatality in the event of human error occurring in accidents is 68.60% as shown in
Figure 3. The posterior probability of accident type is a multiple-vehicle accident with 45.54%. Investigating the contributing factor toward fatality within road accidents is considered a complex relation, dependent on the number of passengers and pedestrian conditions. Therefore, the results shown depend entirely on the data collected from NTSC.
The highest failure modes in Unsafe Acts are the Driver Operating Error, accounting for 57.92%, followed by the Driver Decision Making Error and violations, accounting for 52.76% and 31.29%, respectively. On the other hand, in Pre-Conditions of Unsafe Acts, external and internal factors of the truck, such as environmental and road conditions, are the two highest probability of accident occurrence, with 62.8% and 77.5% probability, respectively, while the physical and mental condition of the driver has a probability of 45.33%. The lack of maintenance and training for trucks and drivers is the main contributor to accidents in the Unsafe Supervision level of HFACS, with a 57.48% probability. These results show that truck accidents are caused by driver error and several other factors, including unmaintained vehicles, lack of regular checks, and driver’s health. Equipment and Resources and Organizational Operation, as part of the Organizational Influence level, contributed similarly to accidents, with 31.59% and 28.70% probability, respectively. Furthermore, the external factor in the form of administrative omission, which is the inability to enforce the rules of government regulations, contributed 11.40%.
4.2. Model Verification Using the Three-Axiom Method
4.2.1. Axiom 1
For axiom 1, it is necessary to analyse the increase and decrease of the prior probability in the parent node, subjective to the posterior probability of the child. In this study, the changes in the posterior probability of Fatality and Multiple Vehicle Accidents nodes are assessed given the alterations in the prior probability of their parent nodes, namely Driver Decision-Making Error, Operating Error, Violations, Technology, and Environment and Road Condition.
Table 3 shows the change in a case where the prior probability occurred. For instance, when the Decision-Making Error did not occur, the probability of fatality is 59%. However, when the driver made an incorrect decision, the possibility increased to 77.2%.
Regarding multiple vehicle accidents, when a driver decision-making error occurred, the probability increased from 30.49% to 59.01%.
Table 3 shows that the posterior probability of consequence increased for every increase of prior probability, thereby satisfying the requirement of axiom 1.
4.2.2. Axiom 2
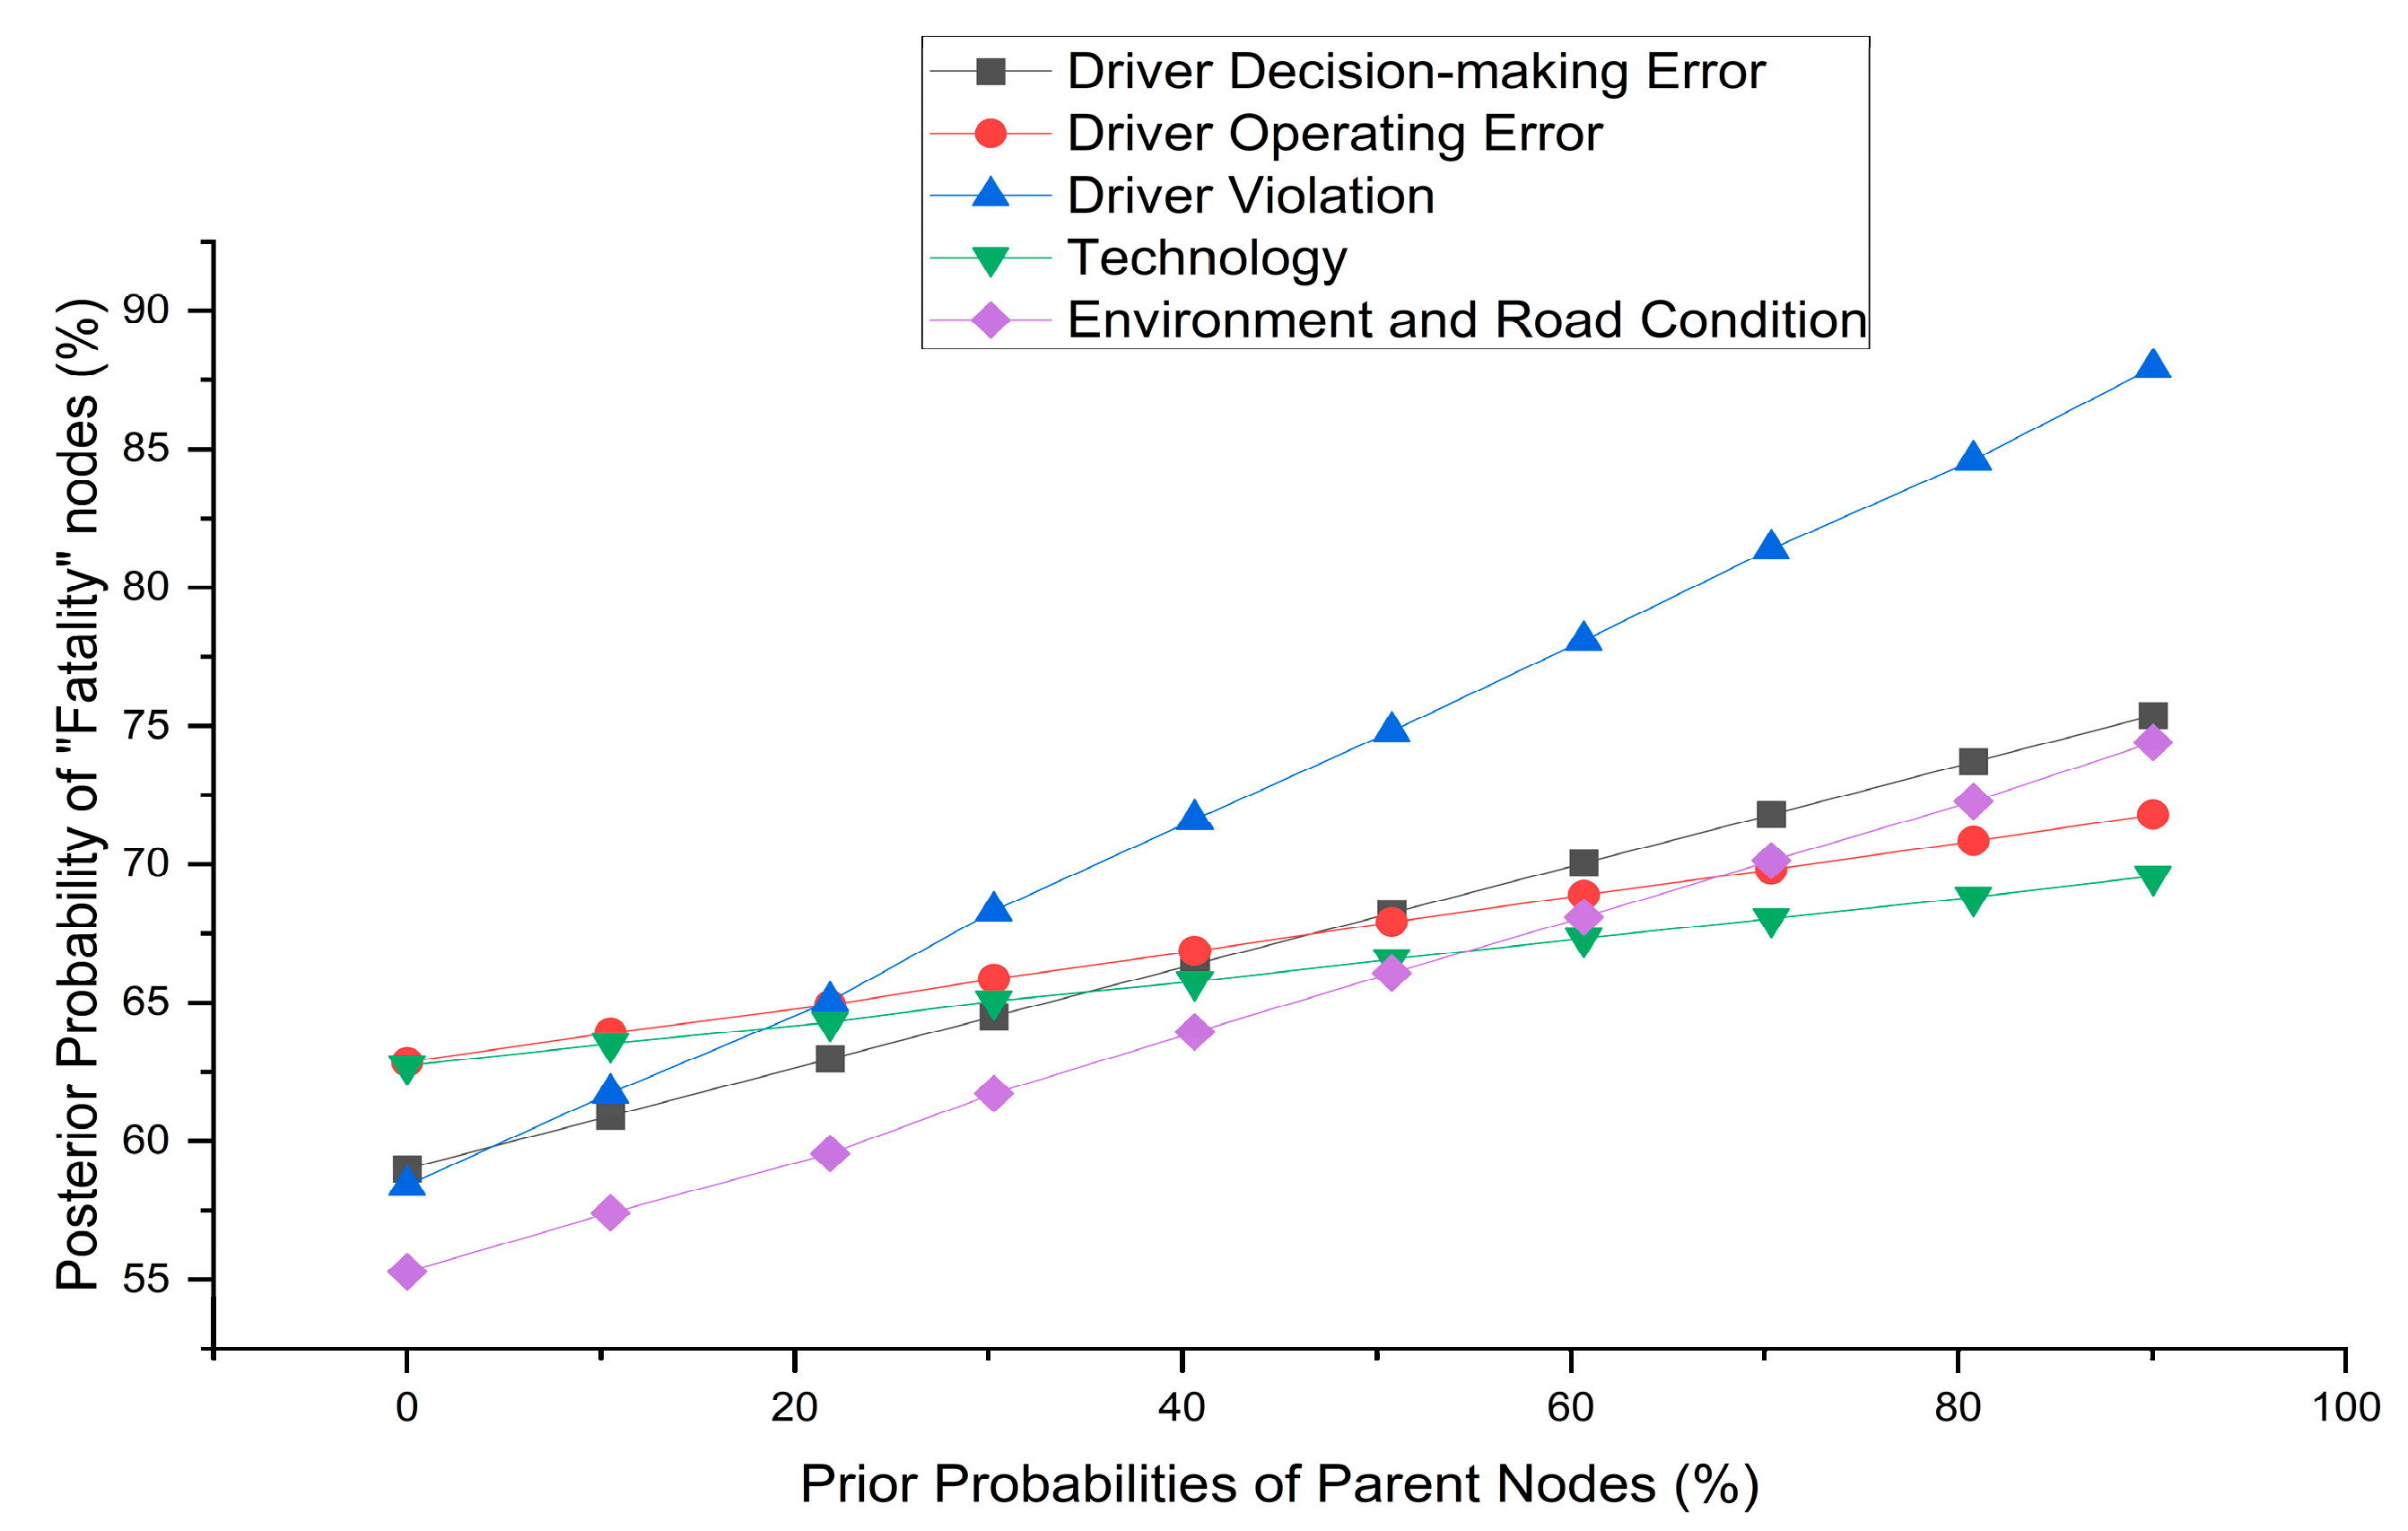
Axiom 2 states that the magnitude of the effect on the child node must be reliably consistent, given the variance of the subjective probability distribution of each parent node.
Figure 4 shows the change in the posterior probability of fatality with the variation of the prior probability of the parent node. The overall pattern of the results is a progressive increase in the posterior probabilities as each prior probability increases. The model is declared to fit the requirements of Axiom 2 based on the provided figure.
4.2.3. Axiom 3
The requirement for axiom 3 is that the cumulative effect of the parent node on the child should be greater than its individual effect.
Table 4 shows that when evidence was entered (100%) for Technology, Driver Decision Making Error, Driver Violation, and Environment and Road Condition individually, the posterior probabilities of fatality were 70.31%, 77.2%, 91%, and 76.49% respectively. However, when the evidence of those child nodes was entered into the model simultaneously, the probability of fatality increased to 100%.
Table 4 also shows the same scenario for the Driver Decision Making Error child node. The same calculation was carried out for every child node in the model, and the results satisfied the Axiom 3 requirements.
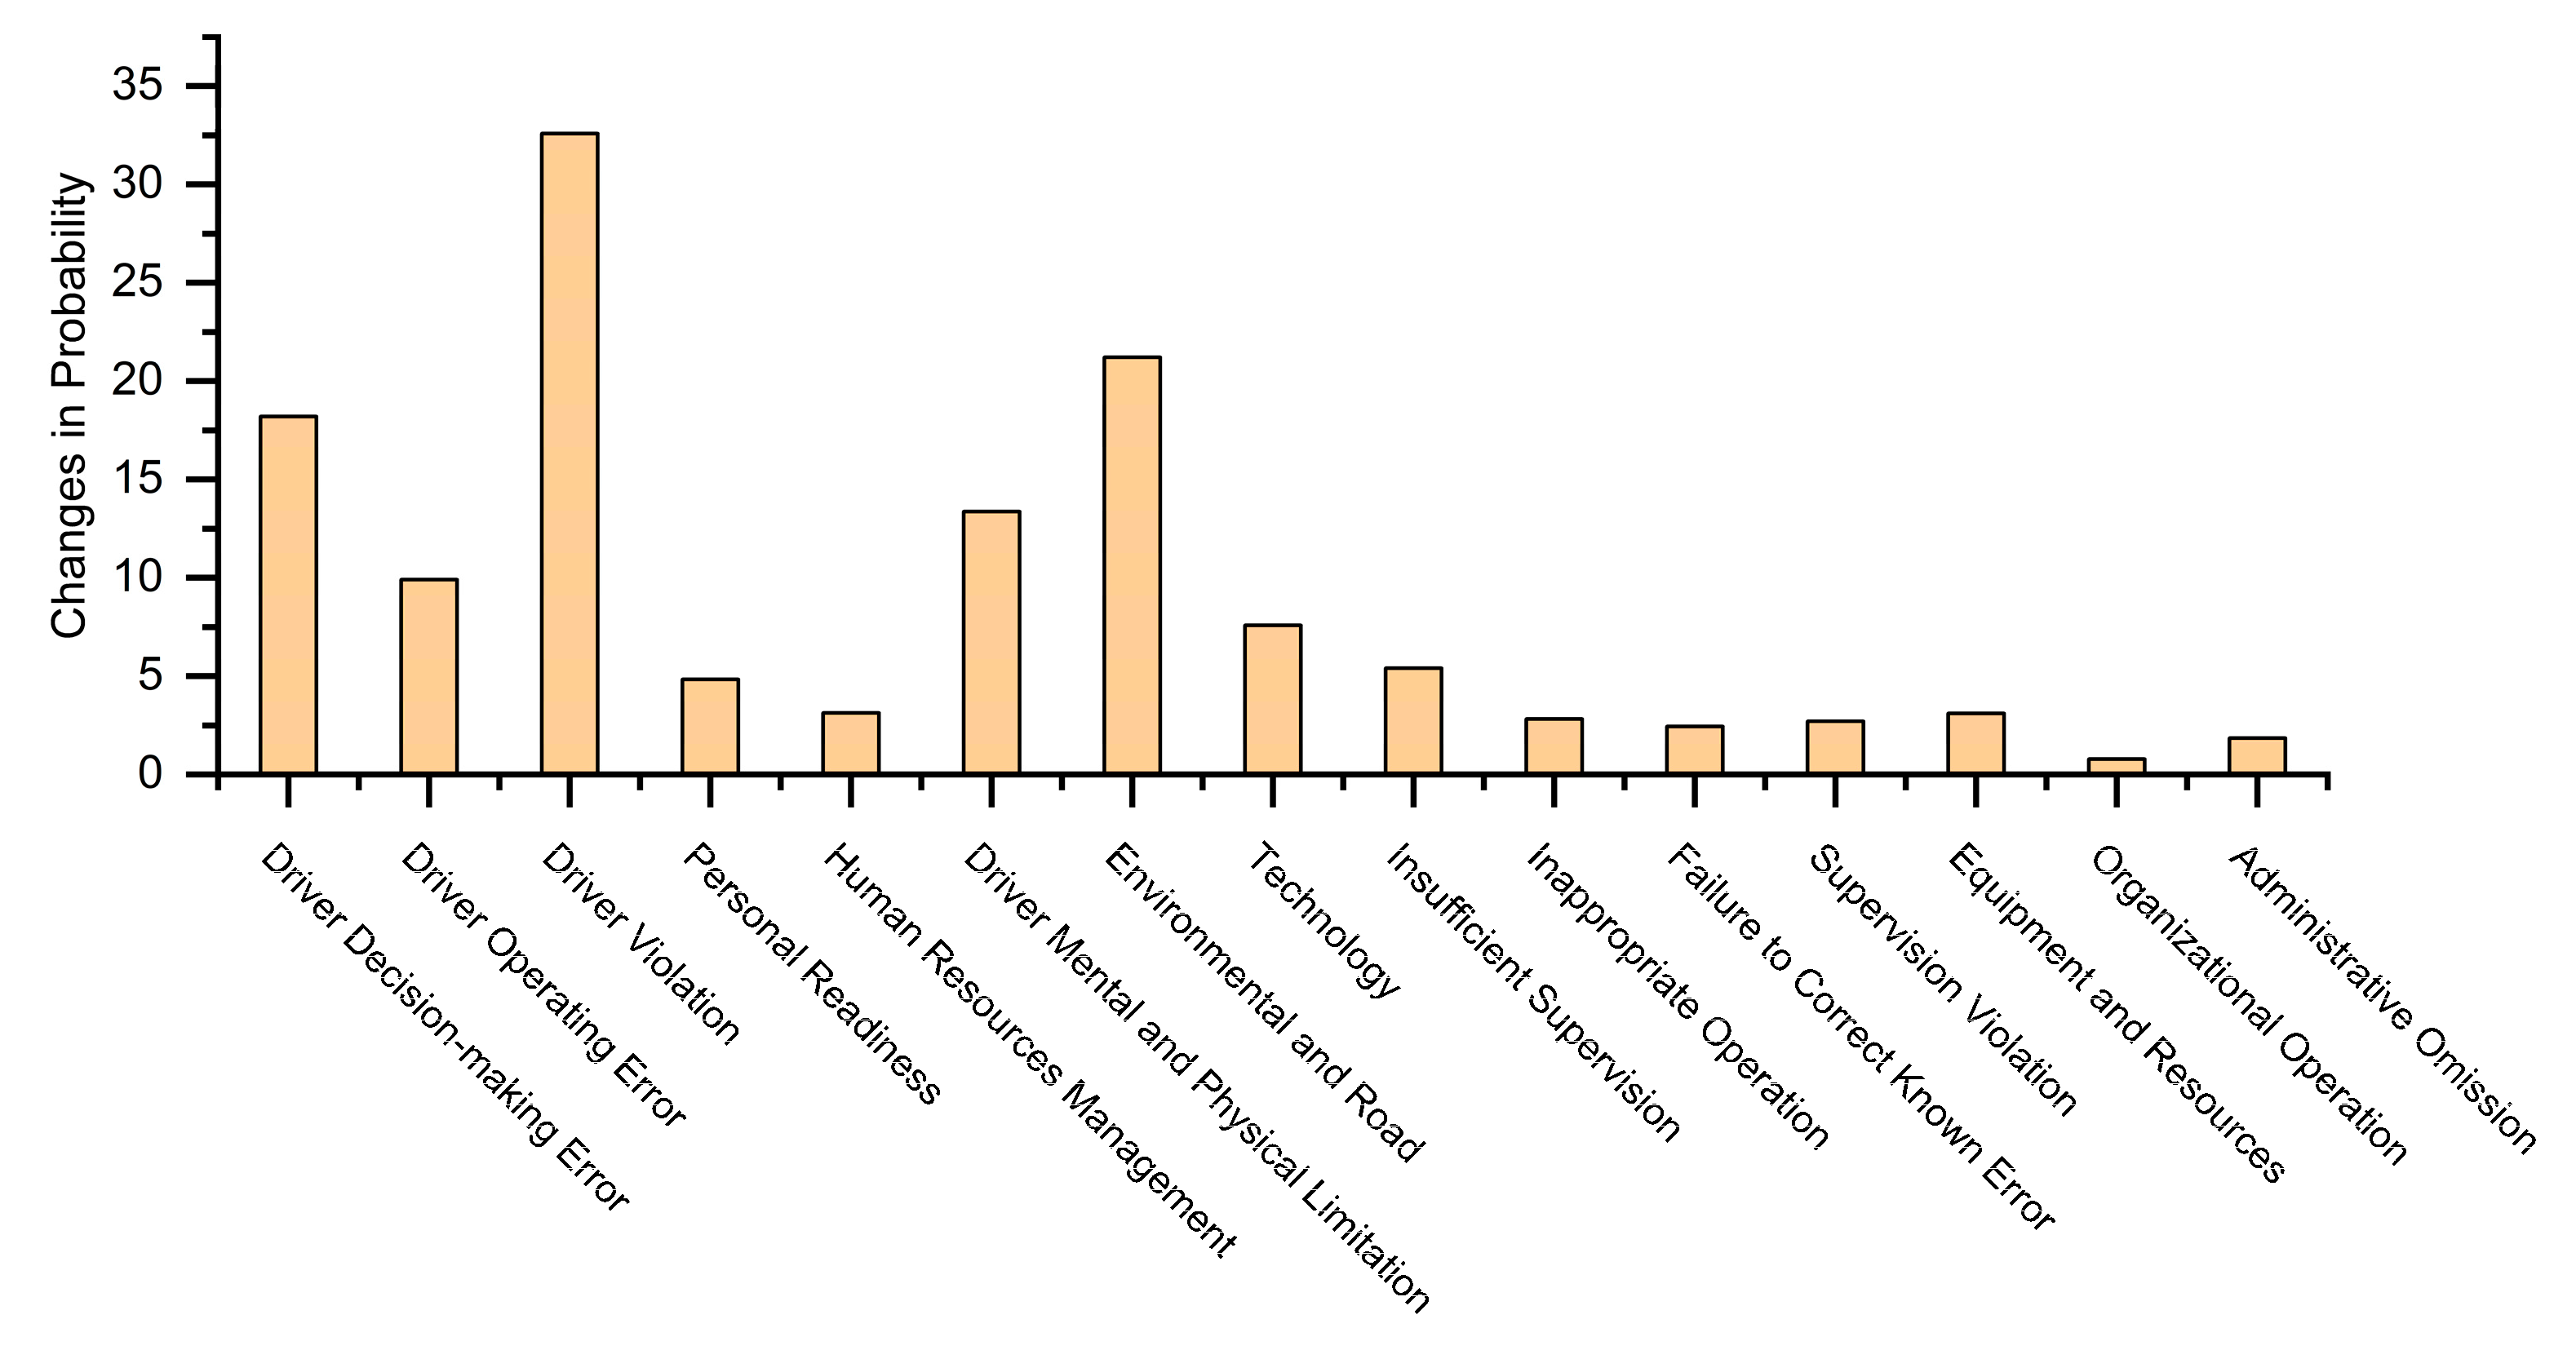
4.3. Sensitivity Analysis of Fatality and Accident Type
The sensitivity analysis was conducted by varying the likelihood of the “Fatality” and “Accidents Type” nodes. It was assumed that the probabilities of the consequences nodes were set at 0% and 100%, and the remaining nodes were constant. The changes in the probability of each parent node were then examined, as shown in
Figure 5 and
Figure 6.
According to
Figure 5, Driver Violation was the most sensitive factor contributing to fatality, followed by Environmental and Road Conditions and Driver-Decision Making Error. The second most sensitive factor influencing fatality was Environmental and road conditions.
The most sensitive failure mode for multiple vehicle accidents was Driver Violation, followed by Operating Error and Mental and Physical Limitation, as shown in
Figure 6. In the process of multiple vehicle accidents, one of the causal factors was the speed that exceeded the regulatory limit and the influence of braking failure, causing successive accidents. Surprisingly, the driver’s Mental and Physical Limitation failure, part of the pre-condition of unsafe acts, was the third most sensitive factor to Multiple Vehicle accidents.
4.4. Influence of Upper-Level Factor in Unsafe Acts
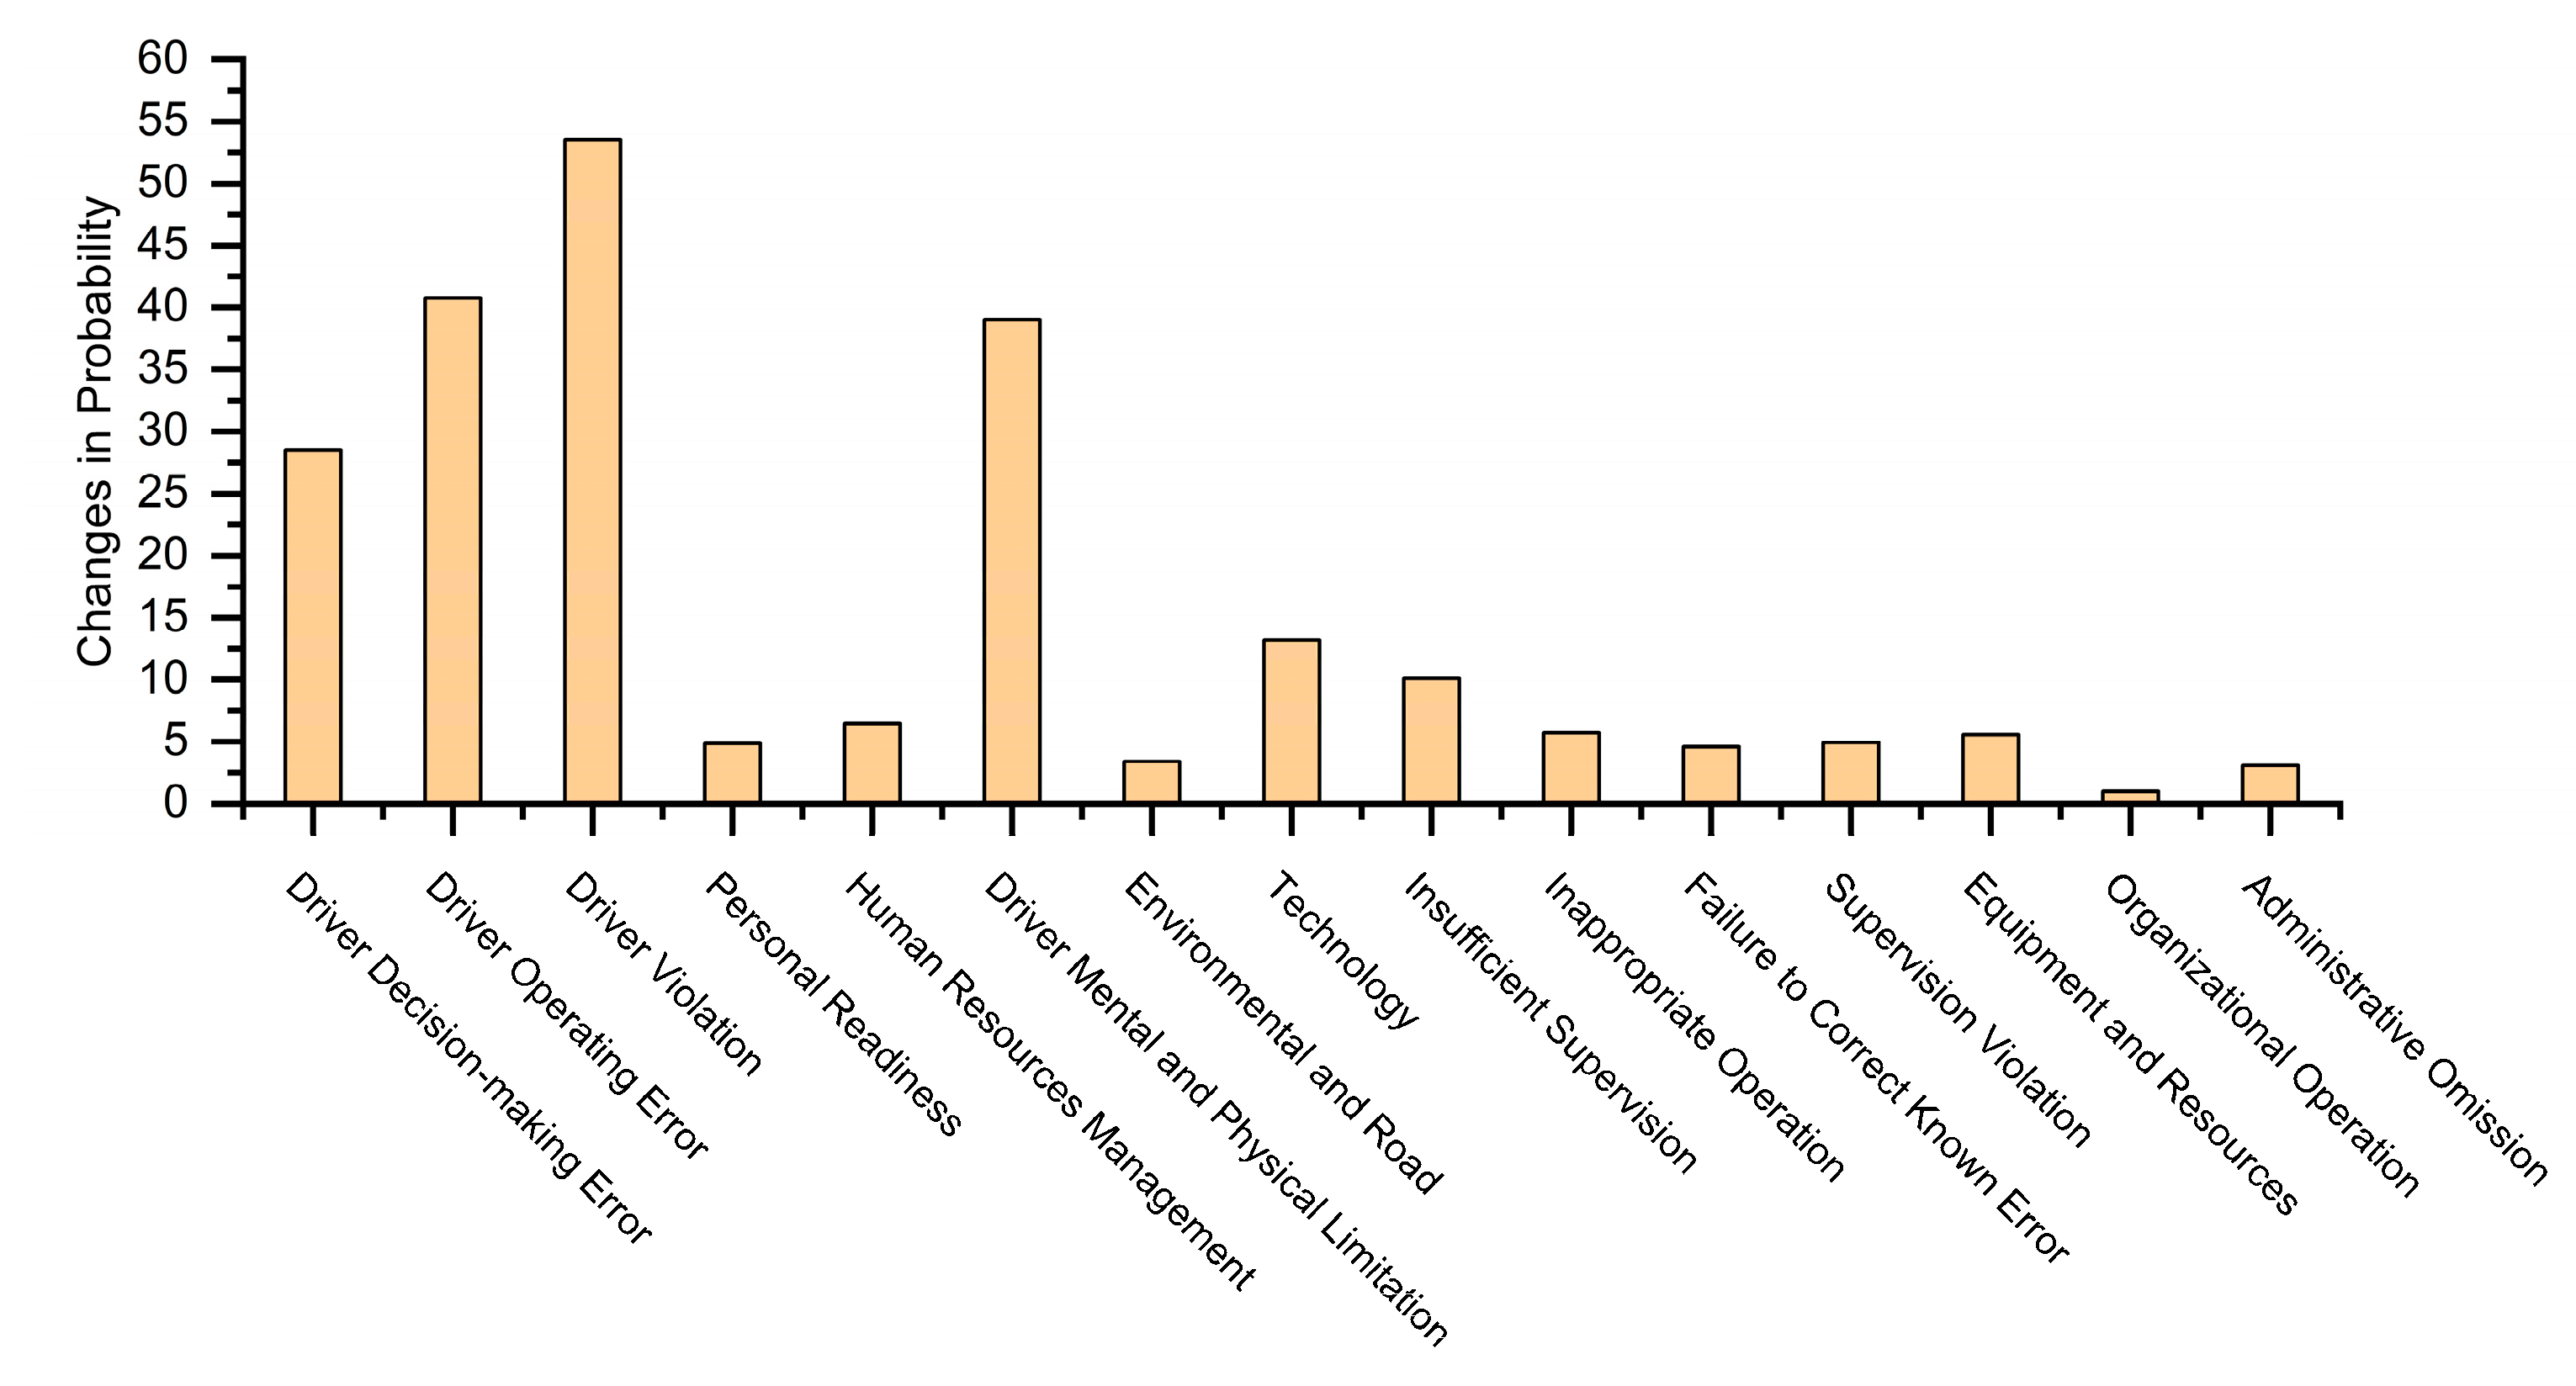
According to the sensitivity analysis results, the Unsafe Acts level was the most significant factor contributing to the consequences of fatality and multiple vehicle accidents. Therefore, it is necessary to investigate the scenario that can cause failure mode in the Unsafe Acts level. Backward inference was carried out for a more in-depth analysis of upper-level conditions in HFACS on the Unsafe Acts condition. This included modifying the condition of each Unsafe Act, such as Driver Decision-Making Error, Operating Error, and Violations, to a 100% occurrence (Yes) condition. Afterward, the probability difference in each failure mode was analysed to assess their contribution level to the Unsafe Acts.
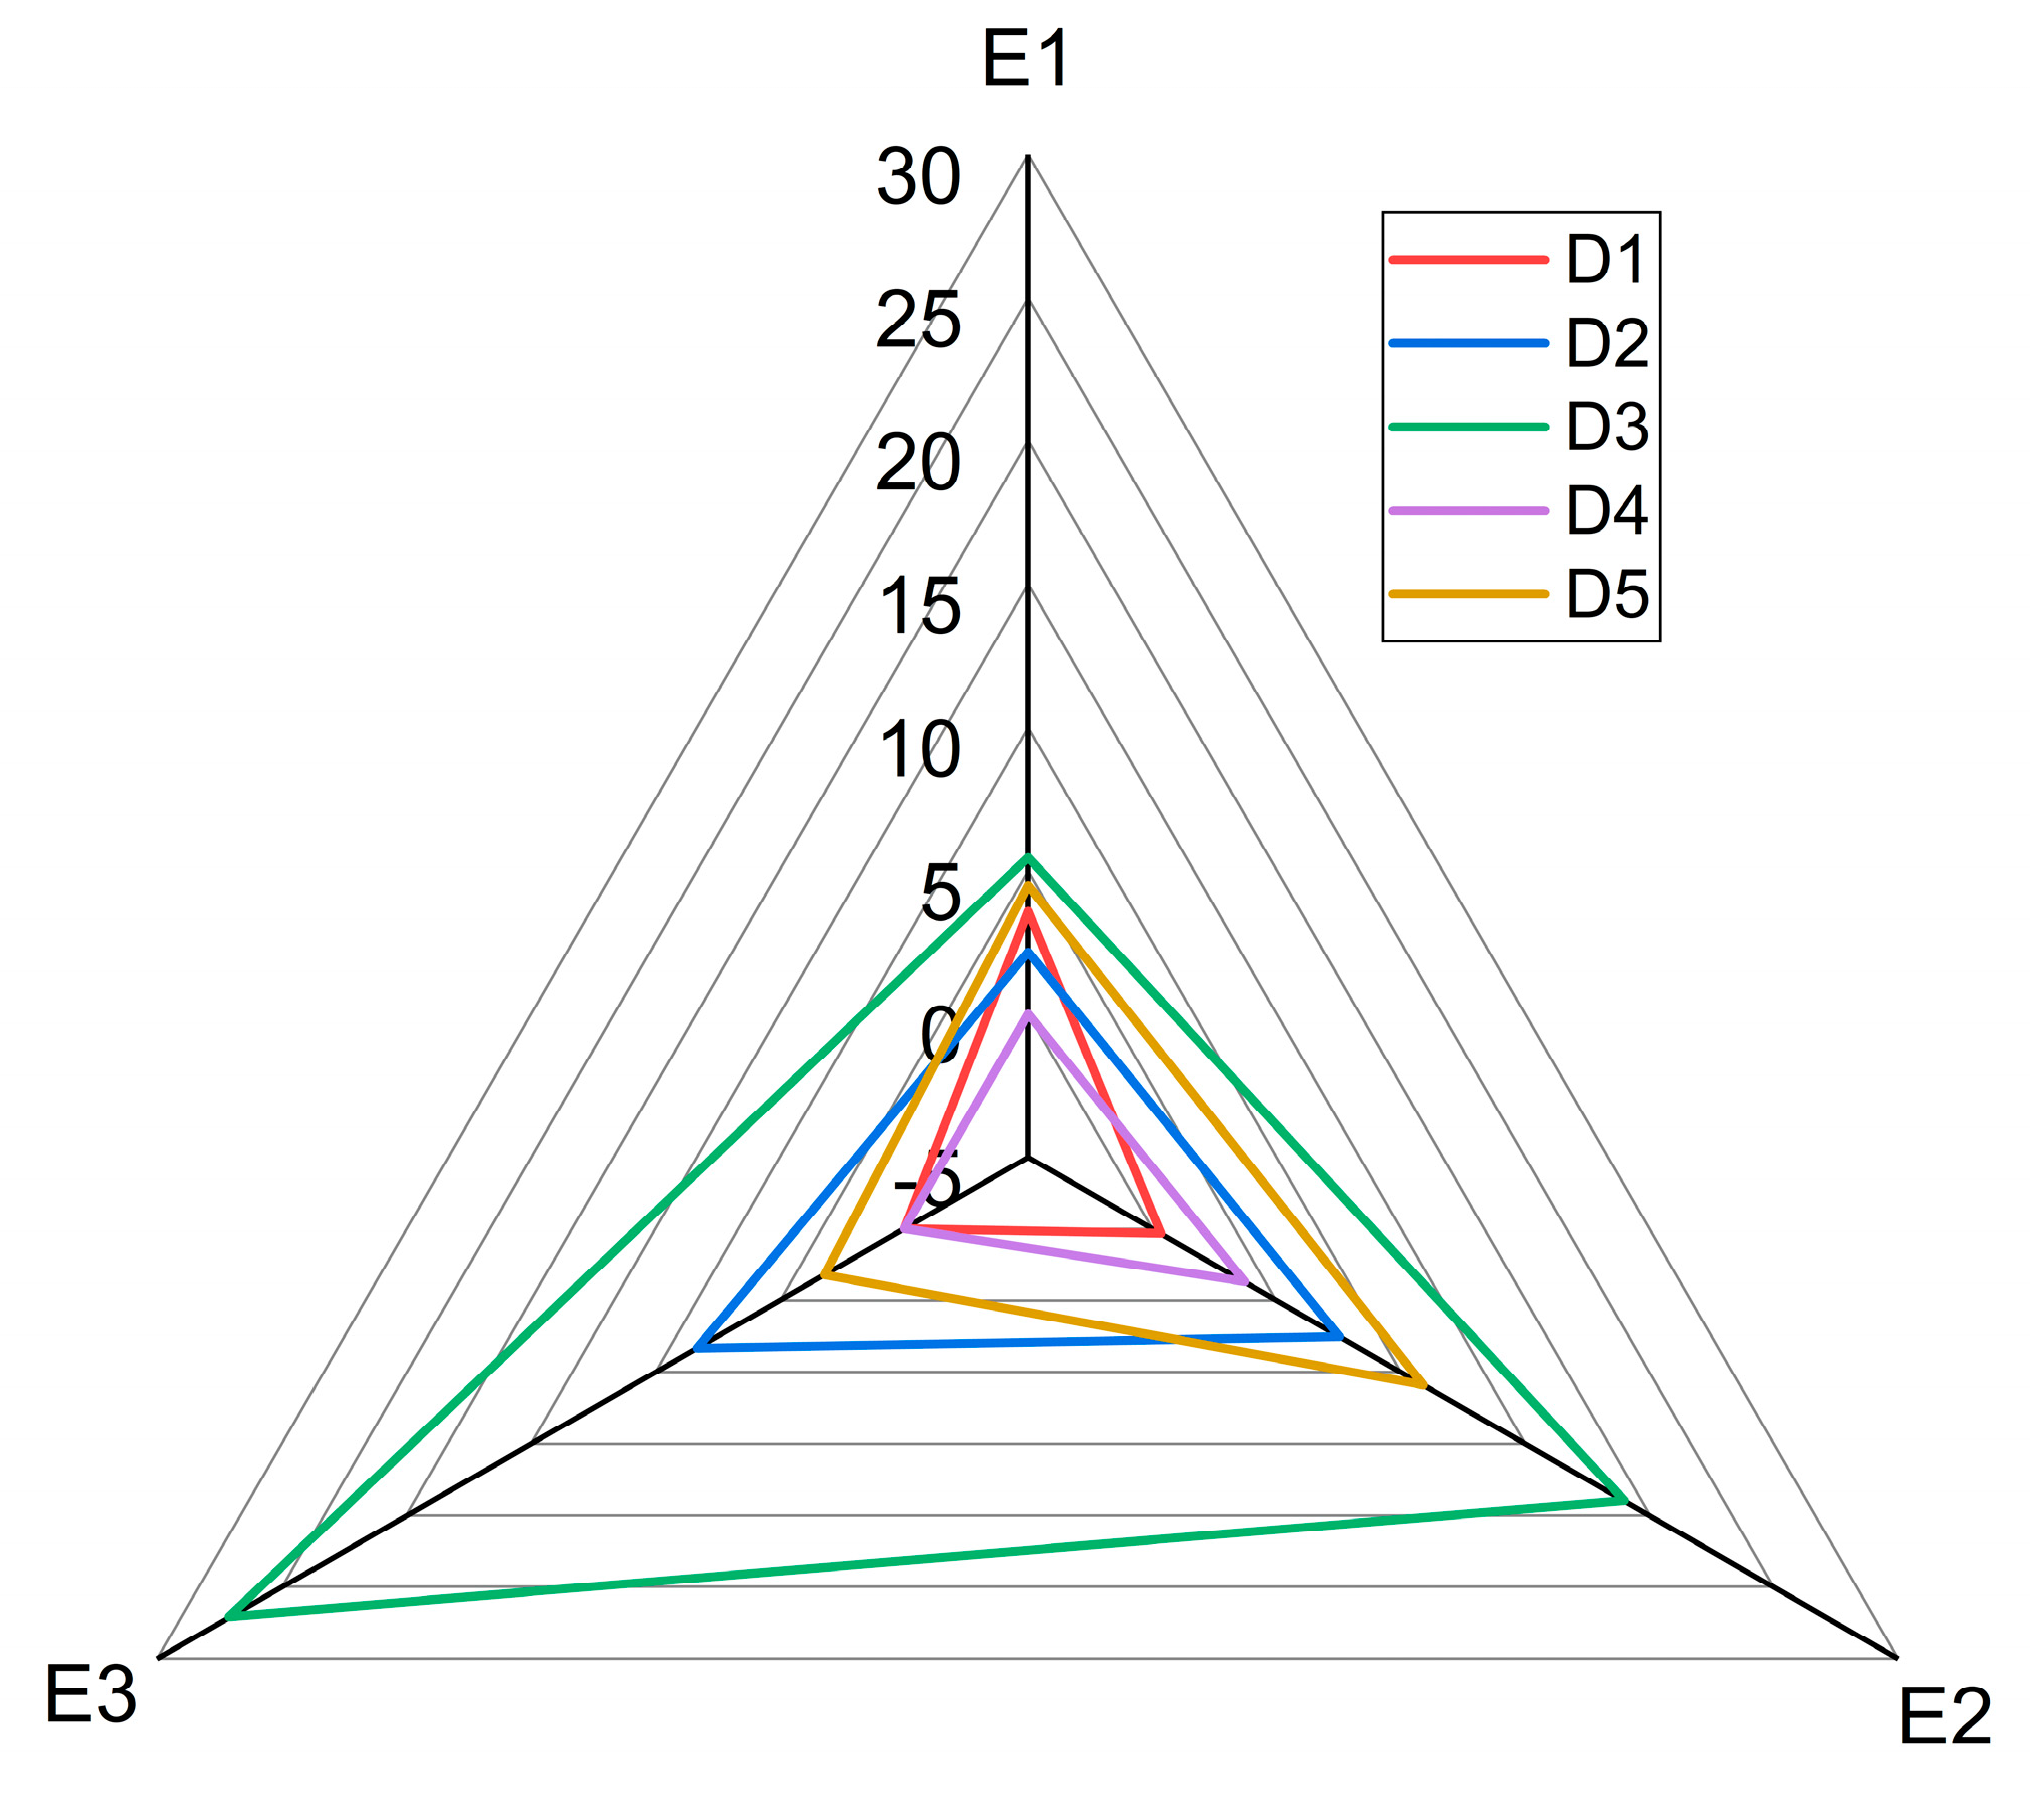
4.4.1. Influence of Pre-Conditions of Unsafe Acts to Unsafe Acts
Figure 7 shows that D3 (Driver Mental and Physical Condition) significantly impacted all Unsafe Acts Failure modes. The highest impact of D3 was on E3 (Driver Violations), showing that a terrible mental condition, such as impatience and fatigue, influences the driver to violate the rules, such as speeding and lack of compliance with the road traffic regulations. Technology (D5) was also significantly correlated to E2 (Driver Operating Error) and E1 (Driver Decision Error), specifically the braking system of the truck. Occasionally, accidents occurred when the compressor that produces air to actuate the brake shoe was improperly maintained. Therefore, the driver tended to repeatedly press the brake, which can cause the vapour lock phenomenon. The relationship between truck conditions and driver’s ability should be carefully maintained. The result also showed that the Environment and Road Condition (D4) was highly influenced by E2 rather than two other Unsafe Acts failure modes. Human Resources and Management (D2) had the highest impact on E3 (Driver violations). With the pressure from the company, the drivers tended to violate specific rules, such as overspeeding or carrying overloaded cargo. The personal readiness of the driver (D1) had the most significant impact on the Driver Decision Making Error (E1). Furthermore, the baseline condition of the driver related to their physical condition, road knowledge, and driver familiarity with the truck determined their decision-making ability in emergencies.
4.4.2. Influence of Unsafe Supervision to Unsafe Acts
The failure mode in “Insufficient Supervision (C1)” had the highest significant impact on the Unsafe Supervision level compared to others, as shown in
Figure 8. C1 includes the inappropriate maintenance of the truck, and these results are in accordance with the observation that Technology (D5) has the most effect on Driver Operating Error compared to two other unsafe acts conditions. The Planned Inappropriate Operations (C2) had the most significant impact on Driver Violations (E3), while the failure of the correct known error (C3) had a significant effect on the Driver Operating Error (E2), which is consistent with the results on the effect of C1 and D5 on E2. The supervision violation (C4) impacted the Driver Operating Error (E2). From these results, it can be shown that the failure modes in Unsafe Supervision, which include the disruption of checking truck condition, have the most significant impact on the Driver Operating Error (E2) related to vehicle mechanical failure.
4.4.3. Influence of Operational Organization and External Factors on Unsafe Acts
Organisational Influence and External Conditions also played an important role in influencing the Unsafe Acts failure modes to occur. Although the change in probability was not higher than the lower-level failure mode in HFACS, the Organisational Influence and External Conditions were considered the first barriers to preventing unsafe acts, even in the event of potential accidents.
The failure mode Equipment and Resources (B1) had a significant impact compared to other factors, with a higher influence on the Driver Operating Error (E2), as shown in
Figure 9. Therefore, the truck company needs to prepare the truck properly. The Organizational Operation (B2), such as scheduling and safety plan, had the highest impact on Driver Decision making Error (E1). When the company lacks a regular schedule, the drivers are forced to do overtime, impacting their readiness and physical condition. In terms of external conditions, the Administrative Omission (A1), such as the failure of the government body to apply the regulations, had a significant impact on Driver Operating Error (E2).
5. Discussion
As mentioned in the literature review, the application of HFACS has limitations for analysing causal factors due to the lack of organisational influence and supervision since most traffic accidents involve private vehicles. This study found that implementing HFACS is feasible for truck-related accidents. In the context of truck accidents, there is an influence from the company or the organisation that relates to the causal factors, as shown in the Swiss Cheese model. Implementing HFACS–BN to analyse truck accidents provides insights into the study of safety in this area. The HFACS method explained the contributory factors to truck accidents at five levels, and the utilisation of BN aimed to enhance HFACS by offering a quantitative evaluation and comprehending the conditional interdependencies among causal factors. By integrating HFACS and BN, this study pioneered a methodology combining qualitative and quantitative methods to analyse truck accidents. This sets a precedent for future research within and beyond the field of transportation safety, encouraging the adoption of integrated approaches to address complex issues where data limitations exist. It contributes a versatile methodology, enriches interdisciplinary collaboration, and offers insights that can be applied across diverse research domains concerned with human error-related incidents and accident analysis.
The most prominent result from the analysis is that the level of the unsafe act is one of the most impactful factors since it is the level preceding the occurrence of accidents. Accordingly, it is necessary to examine the significant impact of the failure modes on the level of the unsafe act performed by BN. In this study, the highest impact affecting the unsafe acts in pre-conditions of unsafe acts is the mental condition of the driver, which is consistent with the results of other studies [
57,
80]. Furthermore, the result for the unsafe supervision level is consistent with the report by [
57], that insufficient supervision is the most significant impact. In the organisational influence and external factors, lack of equipment and administrative omission is the most significant influence, consistent with the result from [
57].
Unsafe acts generally consist of two significant sub-levels: skill-related and violation error. This study was divided into driver decision-making, operating, and violation error. The highest probability of unsafe acts was the Driver Operating Error, which is supported by the results of other studies [
2]. On the other hand, these results differ from several studies of HFACS in road accidents for multi-vehicle by [
3,
57,
80,
81], which reported speeding as the highest frequency of unsafe acts level.
Another interesting result is the placement of the Technology, Environmental, and Road Conditions failure modes. According to the original HFACS model, it is assigned in the pre-condition of unsafe acts level. However, [
82] suggested that the technology and environmental conditions under the HFACS model are excluded from the pre-condition of unsafe acts level. Another level of Operational Condition was suggested below the unsafe act and directly correlated with the accident level. This study proposed the hybrid method to accommodate two different assumptions. From the Technology and Environmental failure modes, the DAG was connected to both unsafe acts and accident levels. The sensitivity analysis showed that environmental and road accidents are the second most sensitive to fatality. Both technology and the environment considerably impact the Unsafe Acts.
The fundamental concept of HFACS is that each level impacts the subsequent level. However, this study analysed the influence within the same level connected by DAG. In the relevant studies of HFACS in road conditions [
80], it is rare to observe that DAG is connected to two levels below. This is because of the fluent and complex correlation between failure since the model of HFACS-BN is based on the sequence of accidents. HFACS is one of the most used accident models, but by ignoring the interconnections between complex system components, the sequential HFACS method oversimplifies the causation, according to the report by [
83,
84].
The HFACS–BN model constructed in this study may benefit policymakers, transportation authorities, and stakeholders in implementing targeted preventive measures, training protocols, or policy changes to reduce truck accidents in Indonesia. This study explained the definition of every HFACS classification of failure modes in detail for truck accident cases. This classification may be beneficial to analyse the case-by-case study regarding the human factors in truck accidents. Moreover, integrating HFACS and BN can provide a more nuanced understanding of truck accidents, shedding light on the intricate web of human errors and contributing factors that lead to these incidents. The HFACS-BN method demonstrates effectiveness despite limited data and can encourage further exploration and application of these methodologies in similar contexts or other fields facing similar data constraints.
The application to model HFACS depends on the quality and the quantity of the data provided. In this study, the most significant limitation was the insufficient number of accident investigation report data. The NTSC, the primary data source, only conducts an accident investigation if the accident is considered a national catastrophic issue. Consequently, there are other accidents involving trucks that can influence and enhance the quality of the BN model. Although the dataset used in this study generally represents truck accidents in Indonesia, a higher quantity of data leads to a more accurate prediction of accident factors. Another limitation of this study is that the determination of the DAG is based on chronological scenarios. Nevertheless, there is a possibility that some failure modes are not connected, which can lead to model inaccuracy. Introducing expert judgment with fuzzy logic will overcome the hindrance. Further studies are needed to obtain and analyse a broader dataset of truck accidents to enhance the HFACS-BN model’s precision. Furthermore, in practical scenarios, variables often exhibit interdependence. Nevertheless, Bayesian Networks (BNs) are represented as directed acyclic graphs, which demonstrates their inability to account for reciprocal relationships among variables simultaneously.
6. Conclusions
In conclusion, truck accidents are considered one of the most severe accidents in road transportation. In several cases, accidents are primarily caused by human error. Therefore, this study aimed to identify the significant factors leading to the unsafe acts of the driver and the consequences of accidents and explored their causal relationship using a hybrid HFACS-BN model. First, the HFACS framework was modified, which comprised 15 failure modes classified at five causation levels, namely “External factors”, “Organisational Influence”, “Unsafe Supervision”, “Pre-Condition of Unsafe Acts”, and “Unsafe Acts”. After the modification of the framework, the HFACS-BN model was developed. BN was used to improve the ability of HFACS by providing quantitative assessment and understanding the conditional dependencies among causal factors.
The proposed model successfully quantified the failures and met the three-axiom method verification. Furthermore, the model was used to perform a sensitivity analysis, and the following results were found: (1) Driver Violation was the most sensitive factor that contributed to the fatality, followed by Environmental and Road Conditions and Driver-Decision Making Error, (2) Driver Violation was the most sensitive factor that contributed to multiple vehicle accidents, followed by Driver Operating Error and Driver Mental and Physical Limitation, (3) Driver mental and physical condition, insufficient supervision, and equipment and resources had the most significant impact on Unsafe Acts compared to other factors, and (4) from the backward inference of BN against the unsafe acts, it was found that the malfunctioning of the mechanical system significantly impacted the Operating Error of Drivers.
Policy Recommendations
Our results showed that driver violations were the most sensitive factor contributing to fatalities and multiple vehicle accidents. Based on the information from
Table 1, driver violations included driving distraction (using a mobile phone or tablet while operating a vehicle), overspeeding, and inappropriate driving license classification. Therefore, this study offers five recommendations for policymakers.
Implement policies that prohibit overspeeding and mobile phone use while driving. To enhance compliance with these policies, policymakers should increase fines and penalties for drivers caught using mobile phones or tablets while operating a vehicle. Stricter penalties can discourage distracted driving.
Expand the real-time speed detection system by installing speed cameras on major roads and highways prone to accidents. The speed camera helps to identify and enforce penalties on truck drivers who surpass speed limits.
Perform spot checks or random inspections on the road to verify the legitimacy of the licenses. Policymakers could also enforce penalties for companies and individuals with incorrect driving licenses.
Initiate awareness campaigns and training programs to educate truck drivers about safe practices and potential risks while driving a truck. Emphasise the dangers associated with distracted driving and overspeeding, highlighting the potential consequences, including accidents, injuries, and fatalities.
Includes the requirements for an operational license to provide two drivers for a fleet that travels more than eight hours.
Invest in research and data collection to understand the truck driver’s behaviour and the causes of overspeeding and distracted driving. This information can help policymakers revise and adapt regulations to address recent issues.
Author Contributions
Conceptualisation, L.P.B.; methodology, D.H.W.; software, D.H.W.; formal analysis, D.H.W. and S.H.M.K.; resources, I.K.; data curation, I.K., S.N., N.I., M., T.S.M. and S.; writing—original draft preparation, I.K., S.N., N.I., M., T.S.M. and S.; writing—review and editing, L.P.B.; visualisation, I.K.; supervision, L.P.B.; project administration, S.N. and S.H.M.K.; funding acquisition, L.P.B. All authors have read and agreed to the published version of the manuscript.
Funding
This research was funded by the Indonesian Ministry of Finance’s LPDP and the National Research and Innovation Agency through the Research and Innovation for Advanced Indonesia Program, grant number B-839/II.7.5/FR.06/5/2023.
Institutional Review Board Statement
This study was conducted in accordance with the ethical guidelines and regulations applicable and approved by the Ethics Commission for Social Humanities–National Research and Innovation Agency [Number: 223/KE.01/SK/05/2023, Date of Approval: 12 May 2023].
Informed Consent Statement
Not available.
Data Availability Statement
Data are available upon request.
Acknowledgments
The authors would like to thank the National Transportation Safety Committee for supporting the accident investigation data.
Conflicts of Interest
The authors declare no conflicts of interest.
References
- World Health Organization. Global Plan for the Decade of Action for Road Safety 2021–2030; WHO Regional Office for the Western Pacific: Manila, Phillipines, 2022. [Google Scholar]
- Liou, J.J.H.; Liu, P.C.Y.; Luo, S.S.; Lo, H.W.; Wu, Y.Z. A Hybrid Model Integrating FMEA and HFACS to Assess the Risk of Inter-City Bus Accidents. Complex Intell. Syst. 2022, 8, 2451–2470. [Google Scholar] [CrossRef]
- Zhang, Y.; Jing, L.; Sun, C.; Fang, J.; Feng, Y. Human Factors Related to Major Road Traffic Accidents in China. Traffic Inj. Prev. 2019, 20, 796–800. [Google Scholar] [CrossRef] [PubMed]
- Ahmed, M.M.; Franke, R.; Ksaibati, K.; Shinstine, D.S. Effects of Truck Traffic on Crash Injury Severity on Rural Highways in Wyoming Using Bayesian Binary Logit Models. Accid. Anal. Prev. 2018, 117, 106–113. [Google Scholar] [CrossRef] [PubMed]
- Al-Bdairi, N.S.S.; Hernandez, S.; Anderson, J. Contributing Factors to Run-Off-Road Crashes Involving Large Trucks under Lighted and Dark Conditions. J. Transp. Eng. Part A Syst. 2018, 144, 1–9. [Google Scholar] [CrossRef]
- Cerwick, D.M.; Gkritza, K.; Shaheed, M.S.; Hans, Z. A Comparison of the Mixed Logit and Latent Class Methods for Crash Severity Analysis. Anal. Methods Accid. Res. 2014, 3–4, 11–27. [Google Scholar] [CrossRef]
- National Safety Council. Large Truck Injury Facts. Available online: https://injuryfacts.nsc.org/motor-vehicle/road-users/large-trucks/ (accessed on 14 October 2023).
- National Traffic Police. Traffic Police in Numbers 2021; National Traffic Police of National Police of Republic of Indonesia: Jakarta, Indonesia, 2021. [Google Scholar]
- Moomen, M.; Rezapour, M.; Ksaibati, K. An Investigation of Influential Factors of Downgrade Truck Crashes: A Logistic Regression Approach. J. Traffic Transp. Eng. (Engl. Ed.) 2019, 6, 185–195. [Google Scholar] [CrossRef]
- Hickman, J.S.; Hanowski, R.J.; Bocanegra, J. A Synthetic Approach to Compare the Large Truck Crash Causation Study and Naturalistic Driving Data. Accid. Anal. Prev. 2018, 112, 11–14. [Google Scholar] [CrossRef] [PubMed]
- Smailović, E.; Lipovac, K.; Pešić, D.; Antić, B. Factors Associated with Driving under the Influence of Alcohol. Traffic Inj. Prev. 2019, 20, 343–347. [Google Scholar] [CrossRef]
- Tseng, C.M.; Yeh, M.S.; Tseng, L.Y.; Liu, H.H.; Lee, M.C. A Comprehensive Analysis of Factors Leading to Speeding Offenses among Large-Truck Drivers. Transp. Res. Part F Traffic Psychol. Behav. 2016, 38, 171–181. [Google Scholar] [CrossRef]
- Malyshkina, N.V.; Mannering, F. Effect of Increases in Speed Limits on Severities of Injuries in Accidents. Transp. Res. Rec. 2008, 2083, 122–127. [Google Scholar] [CrossRef]
- Miskam, Z.; Abdul, S.A.; Mahmud, N.; Wahab, S. Exploring Safety Culture and Speeding among Truck Drivers: A Study in Johor. J. Soc. Sci. 2020, 23, 74–83. [Google Scholar]
- Uddin, M.; Huynh, N. Factors Influencing Injury Severity of Crashes Involving HAZMAT Trucks. Int. J. Transp. Sci. Technol. 2018, 7, 1–9. [Google Scholar] [CrossRef]
- Osman, M.; Paleti, R.; Mishra, S.; Golias, M.M. Analysis of Injury Severity of Large Truck Crashes in Work Zones. Accid. Anal. Prev. 2016, 97, 261–273. [Google Scholar] [CrossRef] [PubMed]
- Anderson, J.; Hernandez, S. Roadway Classifications and the Accident Injury Severities of Heavy-Vehicle Drivers. Anal. Methods Accid. Res. 2017, 15, 17–28. [Google Scholar] [CrossRef]
- Li, L.; Hasnine, M.S.; Nurul Habib, K.M.; Persaud, B.; Shalaby, A. Investigating the Interplay between the Attributes of At-Fault and Not-at-Fault Drivers and the Associated Impacts on Crash Injury Occurrence and Severity Level. J. Transp. Saf. Secur. 2017, 9, 439–456. [Google Scholar] [CrossRef]
- Lemp, J.D.; Kockelman, K.M.; Unnikrishnan, A. Analysis of Large Truck Crash Severity Using Heteroskedastic Ordered Probit Models. Accid. Anal. Prev. 2011, 43, 370–380. [Google Scholar] [CrossRef] [PubMed]
- Dong, C.; Richards, S.H.; Huang, B.; Jiang, X. Identifying the Factors Contributing to the Severity of Truck-Involved Crashes. Int. J. Inj. Contr. Saf. Promot. 2015, 22, 116–126. [Google Scholar] [CrossRef] [PubMed]
- Chang, L.Y.; Mannering, F. Analysis of Injury Severity and Vehicle Occupancy in Truck- and Non-Truck-Involved Accidents. Accid. Anal. Prev. 1999, 31, 579–592. [Google Scholar] [CrossRef]
- Chang, L.Y.; Chien, J.T. Analysis of Driver Injury Severity in Truck-Involved Accidents Using a Non-Parametric Classification Tree Model. Saf. Sci. 2013, 51, 17–22. [Google Scholar] [CrossRef]
- Jacob, B.; Feypell-de La Beaumelle, V. Improving Truck Safety: Potential of Weigh-in-Motion Technology. IATSS Res. 2010, 34, 9–15. [Google Scholar] [CrossRef]
- Shah, R.; Sharma, Y.; Mathew, B.; Kateshiya, V.; Parmar, J. Review Paper on Overloading Effect. Int. J. Adv. Sci. Res. Manag. 2016, 1, 131–134. [Google Scholar]
- Kharvi, A.; Prabhu, S.; Gond, L.; Devadiga, M.; Basavaraj, M.V. Intelligent Overloading Prevention System in Trucks. Int. Res. J. Eng. Technol. 2019, 6, 4924–4927. [Google Scholar]
- Girotto, E.; de Andrade, S.M.; González, A.D.; Mesas, A.E. Professional Experience and Traffic Accidents/near-Miss Accidents among Truck Drivers. Accid. Anal. Prev. 2016, 95, 299–304. [Google Scholar] [CrossRef] [PubMed]
- Zhou, T.; Zhang, J. Analysis of Commercial Truck Drivers’ Potentially Dangerous Driving Behaviors Based on 11-Month Digital Tachograph Data and Multilevel Modeling Approach. Accid. Anal. Prev. 2019, 132, 105256. [Google Scholar] [CrossRef] [PubMed]
- Paleti, R.; Eluru, N.; Bhat, C.R. Examining the Influence of Aggressive Driving Behavior on Driver Injury Severity in Traffic Crashes. Accid. Anal. Prev. 2010, 42, 1839–1854. [Google Scholar] [CrossRef]
- Sullman, M.J.M.; Stephens, A.N.; Pajo, K. Transport Company Safety Climate—The Impact on Truck Driver Behavior and Crash Involvement. Traffic Inj. Prev. 2017, 18, 306–311. [Google Scholar] [CrossRef] [PubMed]
- Wise, J.M.; Heaton, K.; Patrician, P. Fatigue in Long-Haul Truck Drivers: A Concept Analysis. Work. Health Saf. 2019, 67, 68–77. [Google Scholar] [CrossRef] [PubMed]
- Williamson, A.; Friswell, R. The Effect of External Non-Driving Factors, Payment Type and Waiting and Queuing on Fatigue in Long Distance Trucking. Accid. Anal. Prev. 2013, 58, 26–34. [Google Scholar] [CrossRef] [PubMed]
- Arnold, P.K.; Hartley, L.R.; Corry, A.; Hochstadt, D.; Penna, F.; Feyer, A.M. Hours of Work, and Perceptions of Fatigue among Truck Drivers. Accid. Anal. Prev. 1997, 29, 471–477. [Google Scholar] [CrossRef]
- Mizuno, K.; Ojiro, D.; Tanaka, T.; Minusa, S.; Kuriyama, H.; Yamano, E.; Kuratsune, H.; Watanabe, Y. Relationship between Truck Driver Fatigue and Rear-End Collision Risk. PLoS ONE 2020, 15, e0238738. [Google Scholar] [CrossRef]
- Pylkkönen, M.; Tolvanen, A.; Hublin, C.; Kaartinen, J.; Karhula, K.; Puttonen, S.; Sihvola, M.; Sallinen, M. Effects of Alertness Management Training on Sleepiness among Long-Haul Truck Drivers: A Randomized Controlled Trial. Accid. Anal. Prev. 2018, 121, 301–313. [Google Scholar] [CrossRef] [PubMed]
- Rodríguez, D.A.; Targa, F.; Belzer, M.H. Pay Incentives and Truck Driver Safety: A Case Study. Ind. Labor Relations Rev. 2006, 59, 205–225. [Google Scholar] [CrossRef]
- Yuan, Y.; Yang, M.; Guo, Y.; Rasouli, S.; Gan, Z.; Ren, Y. Risk Factors Associated with Truck-Involved Fatal Crash Severity: Analyzing Their Impact for Different Groups of Truck Drivers. J. Safety Res. 2021, 76, 154–165. [Google Scholar] [CrossRef] [PubMed]
- Wei, F.; Dong, D.; Liu, P.; Guo, Y.; Wang, Z.; Li, Q. Quarterly Instability Analysis of Injury Severities in Truck Crashes. Sustainability 2022, 14, 14055. [Google Scholar] [CrossRef]
- Rahimi, E.; Shamshiripour, A.; Samimi, A.; Mohammadian, A. Investigating the Injury Severity of Single-Vehicle Truck Crashes in a Developing Country. Accid. Anal. Prev. 2020, 137, 105444. [Google Scholar] [CrossRef] [PubMed]
- Uddin, M.; Huynh, N. Injury Severity Analysis of Truck-Involved Crashes under Different Weather Conditions. Accid. Anal. Prev. 2020, 141, 105529. [Google Scholar] [CrossRef] [PubMed]
- Zhang, Y.; Shao, W.; Zhang, M.; Li, H.; Yin, S.; Xu, Y. Analysis 320 Coal Mine Accidents Using Structural Equation Modeling with Unsafe Conditions of the Rules and Regulations as Exogenous Variables. Accid. Anal. Prev. 2016, 92, 189–201. [Google Scholar] [CrossRef]
- Stanton, N.A.; Box, E.; Butler, M.; Dale, M.; Tomlinson, E.M.; Stanton, M. Using Actor Maps and AcciMaps for Road Safety Investigations: Development of Taxonomies and Meta-Analyses. Saf. Sci. 2023, 158, 105975. [Google Scholar] [CrossRef]
- Ceylan, B.O.; Akyuz, E.; Arslan, O. Systems-Theoretic Accident Model and Processes (STAMP) Approach to Analyse Socio-Technical Systems of Ship Allision in Narrow Waters. Ocean Eng. 2021, 239, 109804. [Google Scholar] [CrossRef]
- Salihoglu, E.; Bal Beşikçi, E. The Use of Functional Resonance Analysis Method (FRAM) in a Maritime Accident: A Case Study of Prestige. Ocean Eng. 2021, 219, 108223. [Google Scholar] [CrossRef]
- Bowo, L.P.; Prilana, R.E.; Furusho, M. A Modified Heart-4m Method with Topsis for Analyzing Indonesia Collision Accidents. TransNav 2020, 14, 751–759. [Google Scholar] [CrossRef]
- Chen, S.; Wall, A.; Davies, P.; Yang, Z.; Wang, J.; Chou, Y. A Human and Organisational Factors (HOFs) Analysis Method for Marine Casualties Using HFACS-Maritime Accidents (HFACS-MA). Saf. Sci. 2013, 60, 105–114. [Google Scholar] [CrossRef]
- Reinach, S.; Viale, A. Application of a Human Error Framework to Conduct Train Accident/Incident Investigations. Accid. Anal. Prev. 2006, 38, 396–406. [Google Scholar] [CrossRef] [PubMed]
- Reason, J. Human Error; Cambridge University Press: Manchester, UK, 1990. [Google Scholar]
- Reason, J. Human Error: Models and Management. BMJ 2000, 320, 768–770. [Google Scholar] [CrossRef]
- Shappell, S.A.; Wiegmann, D.A. The Human Factors Analysis and Classification System–HFACS. 2000. Available online: https://commons.erau.edu/publication/737/ (accessed on 6 November 2023).
- Wang, J.; Fan, Y.; Niu, Y. Routes to Failure: Analysis of Chemical Accidents Using the HFACS. J. Loss Prev. Process Ind. 2022, 75, 104695. [Google Scholar] [CrossRef]
- Ghasemi, F.; Gholamizadeh, K.; Farjadnia, A.; Sedighizadeh, A.; Kalatpour, O. Human and Organizational Failures Analysis in Process Industries Using FBN-HFACS Model: Learning from a Toxic Gas Leakage Accident. J. Loss Prev. Process Ind. 2022, 78, 104823. [Google Scholar] [CrossRef]
- Ung, S.-T. A Weighted CREAM Model for Maritime Human Reliability Analysis. Saf. Sci. 2015, 72, 144–152. [Google Scholar] [CrossRef]
- Dambier, M.; Hinkelbein, J. Analysis of 2004 German General Aviation Aircraft Accidents According to the HFACS Model. Air Med. J. 2006, 25, 265–269. [Google Scholar] [CrossRef]
- Wu, Y.; Zhang, S.; Zhang, X.; Lu, Y.; Xiong, Z. Analysis on Coupling Dynamic Effect of Human Errors in Aviation Safety. Accid. Anal. Prev. 2023, 192, 107277. [Google Scholar] [CrossRef]
- Zhan, Q.; Zheng, W.; Zhao, B. A Hybrid Human and Organizational Analysis Method for Railway Accidents Based on HFACS-Railway Accidents (HFACS-RAs). Saf. Sci. 2017, 91, 232–250. [Google Scholar] [CrossRef]
- Chauvin, C.; Lardjane, S.; Morel, G.; Clostermann, J.P.; Langard, B. Human and Organisational Factors in Maritime Accidents: Analysis of Collisions at Sea Using the HFACS. Accid. Anal. Prev. 2013, 59, 26–37. [Google Scholar] [CrossRef]
- Zhang, Y.; Liu, T.; Bai, Q.; Shao, W.; Wang, Q. New Systems-Based Method to Conduct Analysis of Road Traffic Accidents. Transp. Res. Part F Traffic Psychol. Behav. 2018, 54, 96–109. [Google Scholar] [CrossRef]
- Underwood, P.; Waterson, P. Accident Analysis Models and Methods: Guidance for Safety Professionals; Loughborough University: Loughborough, UK, 2013; Volume 28. [Google Scholar]
- Zarei, E.; Khan, F.; Abbassi, R. An Advanced Approach to the System Safety in Sociotechnical Systems. Saf. Sci. 2023, 158, 105961. [Google Scholar] [CrossRef]
- Schröder-Hinrichs, J.-U.; Hollnagel, E.; Baldauf, M. From Titanic to Costa Concordia—A Century of Lessons Not Learned. WMU J. Marit. Aff. 2012, 11, 151–167. [Google Scholar] [CrossRef]
- Dekker, S. The Field Guide to Understanding ‘Human Error’; CRC Press: Boca Raton, FL, USA, 2017. [Google Scholar]
- Wang, K.; Ming, Y.; Zhao, H.; Jiao, Y.; Shi, T.; Zhang, Q. Effect of Shock-Flame Interactions on Initial Damage Characteristics in Highway Tunnel under Hazmat Tanker Truck Accident. Tunn. Undergr. Sp. Technol. 2022, 130, 104763. [Google Scholar] [CrossRef]
- Lyu, S.; Zhang, S.; Huang, X.; Peng, S.; Li, J. Investigation and Modeling of the LPG Tank Truck Accident in Wenling, China. Process Saf. Environ. Prot. 2022, 157, 493–508. [Google Scholar] [CrossRef]
- Adumene, S.; Afenyo, M.; Salehi, V.; William, P. An Adaptive Model for Human Factors Assessment in Maritime Operations. Int. J. Ind. Ergon. 2022, 89, 103293. [Google Scholar] [CrossRef]
- Ma, L.; Ma, X.; Xing, P.; Yu, F. A Hybrid Approach Based on the HFACS-FBN for Identifying and Analysing Human Factors for Fire and Explosion Accidents in the Laboratory. J. Loss Prev. Process Ind. 2022, 75, 104675. [Google Scholar] [CrossRef]
- Rostamabadi, A.; Jahangiri, M.; Zarei, E.; Kamalinia, M.; Alimohammadlou, M. A Novel Fuzzy Bayesian Network Approach for Safety Analysis of Process Systems; An Application of HFACS and SHIPP Methodology. J. Clean. Prod. 2020, 244, 118761. [Google Scholar] [CrossRef]
- Pristrom, S.; Yang, Z.; Wang, J.; Yan, X. A Novel Flexible Model for Piracy and Robbery Assessment of Merchant Ship Operations. Reliab. Eng. Syst. Saf. 2016, 155, 196–211. [Google Scholar] [CrossRef]
- Sharma, P.; Kulkarni, M.S. Bayesian Belief Network for Assessing Impact of Factors on Army’s Lean--Agile Replenishment System. J. Mil. Stud. 2016, 7, 11–23. [Google Scholar] [CrossRef]
- Jones, B.; Jenkinson, I.; Yang, Z.; Wang, J. The Use of Bayesian Network Modelling for Maintenance Planning in a Manufacturing Industry. Reliab. Eng. Syst. Saf. 2010, 95, 267–277. [Google Scholar] [CrossRef]
- Xia, N.; Zou, P.X.W.; Liu, X.; Wang, X.; Zhu, R. A Hybrid BN-HFACS Model for Predicting Safety Performance in Construction Projects. Saf. Sci. 2018, 101, 332–343. [Google Scholar] [CrossRef]
- Zhang, M.; Zhang, D.; Goerlandt, F.; Yan, X.; Kujala, P. Use of HFACS and Fault Tree Model for Collision Risk Factors Analysis of Icebreaker Assistance in Ice-Covered Waters. Saf. Sci. 2019, 111, 128–143. [Google Scholar] [CrossRef]
- Liu, R.; Cheng, W.; Yu, Y.; Xu, Q.; Jiang, A.; Lv, T. An Impacting Factors Analysis of Miners’ Unsafe Acts Based on HFACS-CM and SEM. Process Saf. Environ. Prot. 2019, 122, 221–231. [Google Scholar] [CrossRef]
- Karacasu, M.; Ergül, B.; Yavuz, A.A. Estimating the Causes of Traffic Accidents Using Logistic Regression and Discriminant Analysis. Int. J. Inj. Contr. Saf. Promot. 2014, 21, 305–313. [Google Scholar] [CrossRef]
- Pearl, J. Probabilistic Reasoning in Intelligent Systems: Networks of Plausible Inference; Morgan Kaufmann: Burlington, MA, USA, 1988. [Google Scholar]
- Li, K.X.; Yin, J.; Bang, H.S.; Yang, Z.; Wang, J. Bayesian Network with Quantitative Input for Maritime Risk Analysis. Transp. A Transp. Sci. 2014, 10, 89–118. [Google Scholar] [CrossRef]
- John, A.; Yang, Z.; Riahi, R.; Wang, J. A Risk Assessment Approach to Improve the Resilience of a Seaport System Using Bayesian Networks. Ocean Eng. 2016, 111, 136–147. [Google Scholar] [CrossRef]
- Jiang, M.; Lu, J.; Yang, Z.; Li, J.; Jiang, M. Risk Analysis of Maritime Accidents along the Main Route of the Maritime Silk Road: A Bayesian Network Approach. Marit. Policy Manag. 2020, 47, 1–18. [Google Scholar] [CrossRef]
- Xiao, S.; Lu, Z.; Wang, P. Multivariate Global Sensitivity Analysis for Dynamic Models Based on Wavelet Analysis. Reliab. Eng. Syst. Saf. 2018, 170, 20–30. [Google Scholar] [CrossRef]
- Kjærulff, U.; Van Der Gaag, L.C. Making Sensitivity Analysis Computationally Efficient. arXiv 2013, arXiv:1301.3868. [Google Scholar]
- Zhang, X.; Hu, W.; Zhou, J.; Zuo, Q.; Wu, R.; Tang, Z. The Failure Route between Active and Latent Error in Bus Accident. IEEE Access 2019, 7, 164941–164951. [Google Scholar] [CrossRef]
- Wang, X.; Qu, Z.; Song, X.; Bai, Q.; Pan, Z.; Li, H. Incorporating Accident Liability into Crash Risk Analysis: A Multidimensional Risk Source Approach. Accid. Anal. Prev. 2021, 153, 106035. [Google Scholar] [CrossRef]
- Yildiz, S.; Uğurlu, Ö.; Wang, J.; Loughney, S. Application of the HFACS-PV Approach for Identification of Human and Organizational Factors (HOFs) Influencing Marine Accidents. Reliab. Eng. Syst. Saf. 2021, 208, 107395. [Google Scholar] [CrossRef]
- Hollnagel, E. FRAM, the Functional Resonance Analysis Method: Modelling Complex Socio-Technical Systems; Ashgate Publishing, Ltd.: Farnham, UK, 2012. [Google Scholar]
- Abrecht, B.; Leveson, N. Systems Theoretic Process Analysis (STPA) of an Offshore Supply Vessel Dynamic Positioning System; Massachusetts Institute of Technology Lincoln Laboratory: Lexington, MA, USA, 2016; p. 79. [Google Scholar]
| Disclaimer/Publisher’s Note: The statements, opinions and data contained in all publications are solely those of the individual author(s) and contributor(s) and not of MDPI and/or the editor(s). MDPI and/or the editor(s) disclaim responsibility for any injury to people or property resulting from any ideas, methods, instructions or products referred to in the content. |
© 2024 by the authors. Licensee MDPI, Basel, Switzerland. This article is an open access article distributed under the terms and conditions of the Creative Commons Attribution (CC BY) license (https://creativecommons.org/licenses/by/4.0/).


 ,
, 


