
Bayesian Reconstruction Algorithms for Low-Dose Computed Tomography Are Not Yet Suitable in Clinical Context

 , ,
, ,
Abstract
:1. Introduction
2. Material and Methods
2.1. Post Mortem Computed Tomography
2.2. Data Collection
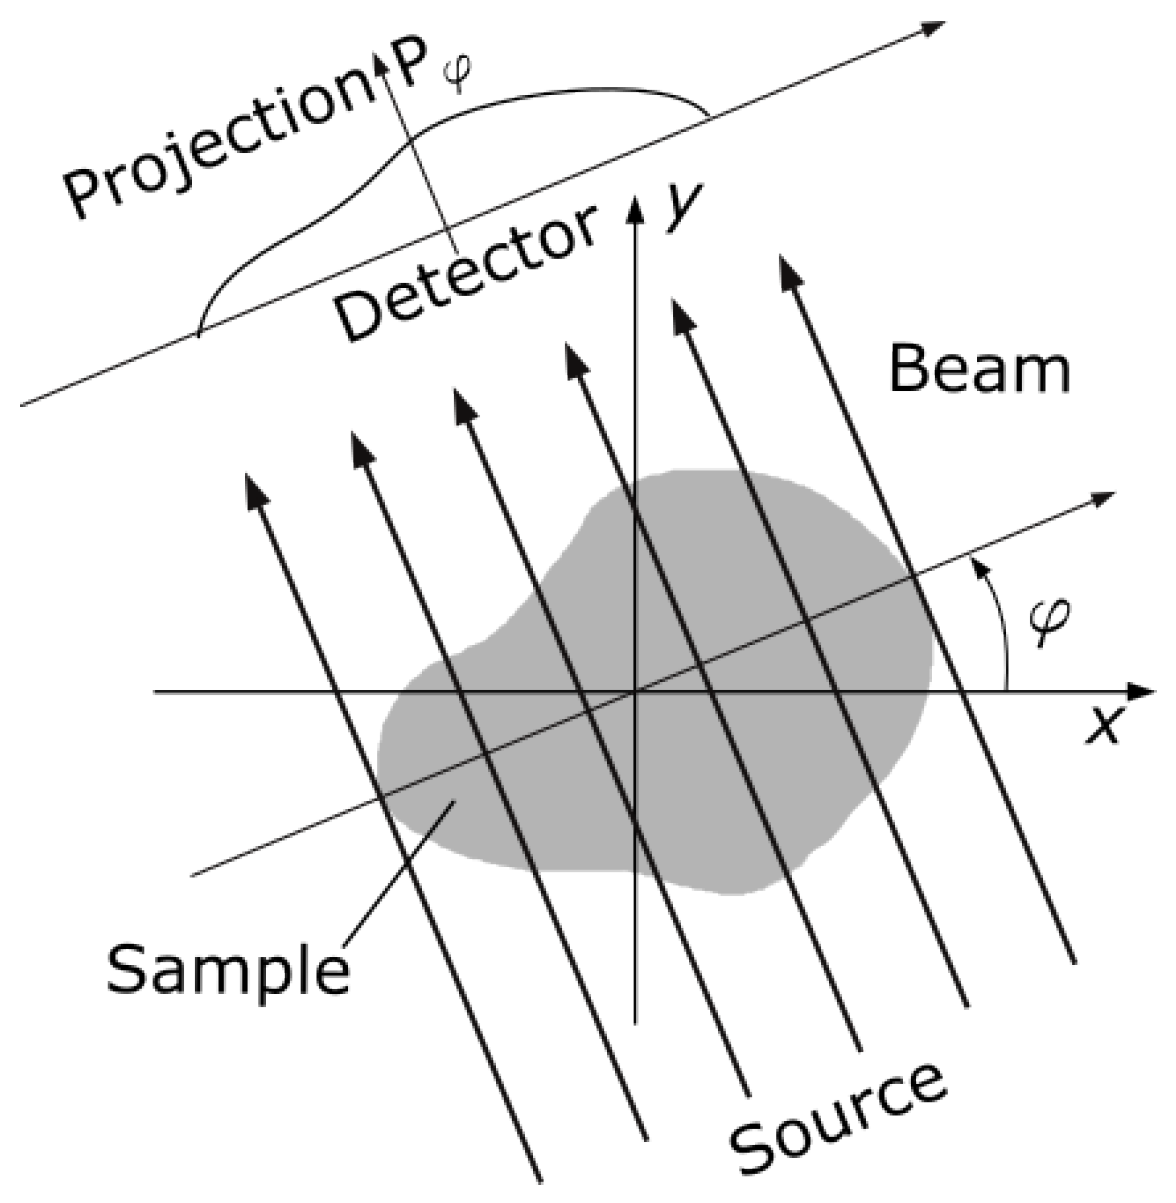
2.3. Sparse-View Reconstruction
2.4. Quantitative and Qualitative Evaluation
- 1—test image clearly better than reference image
- 2—test image slightly better than reference image
- 3—test image equal to reference image
- 4—test image slightly worse than reference image
- 5—test image clearly worse than reference image
2.5. Statistical Analysis
3. Results
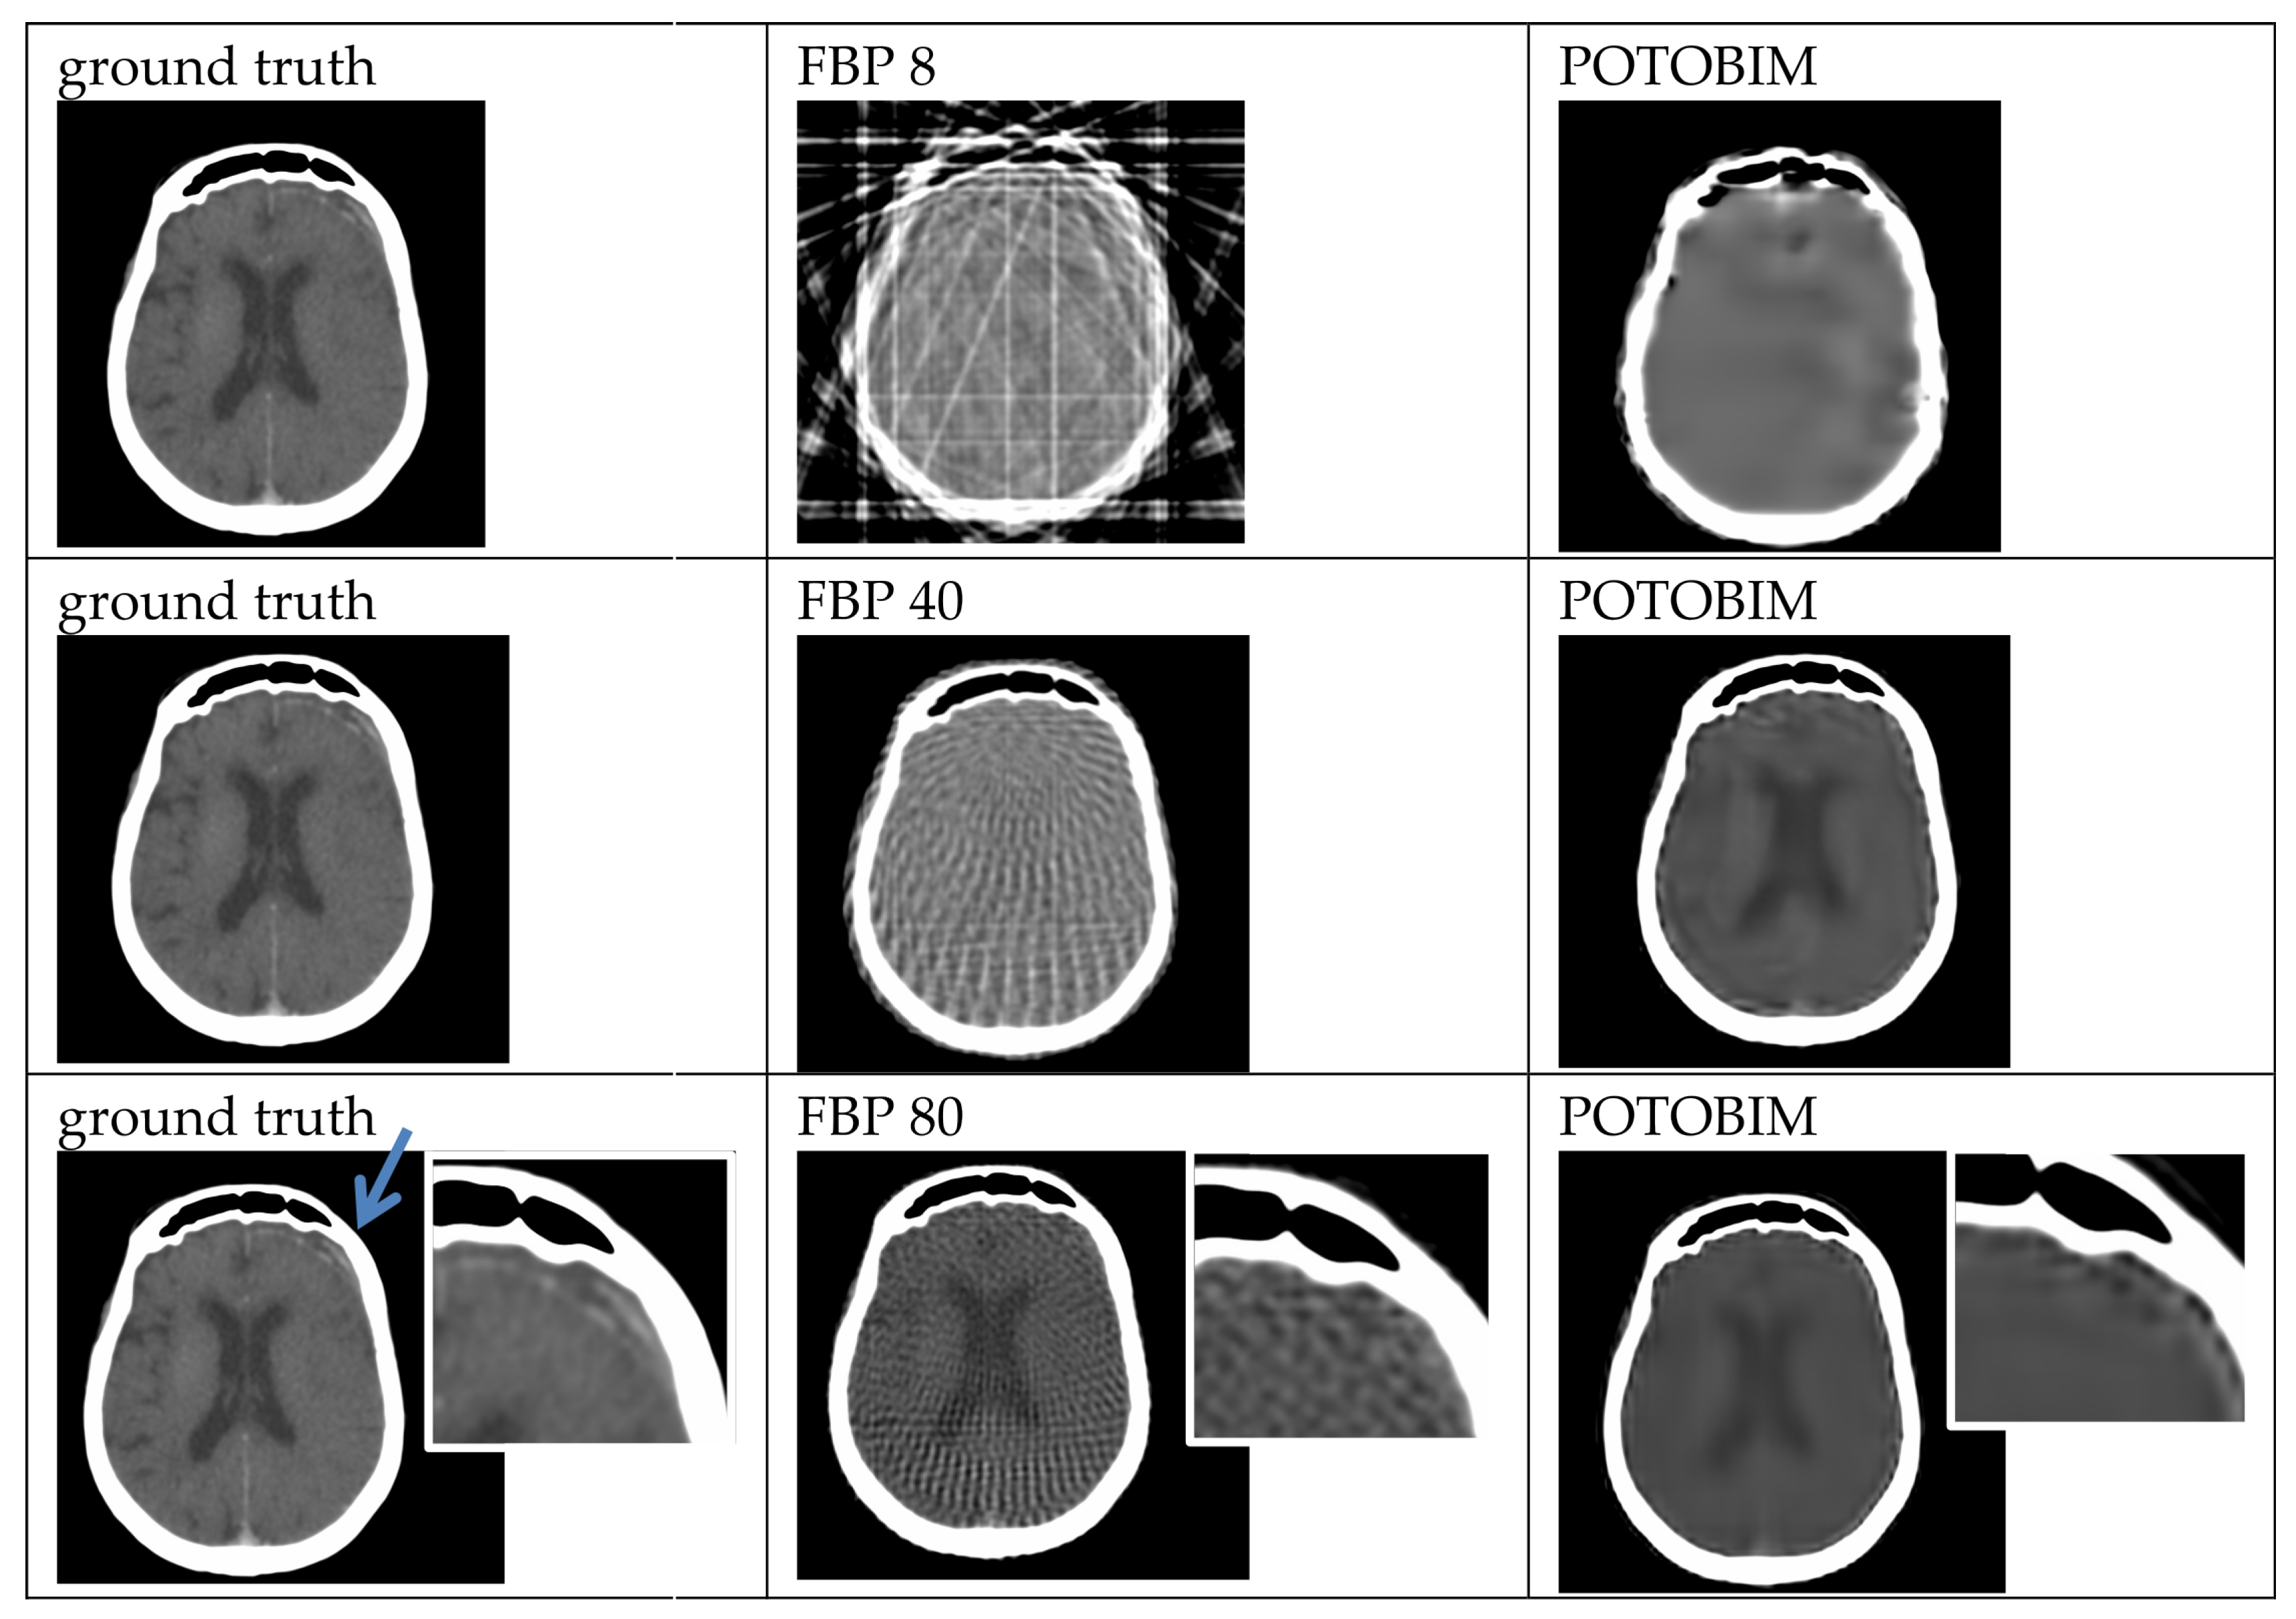
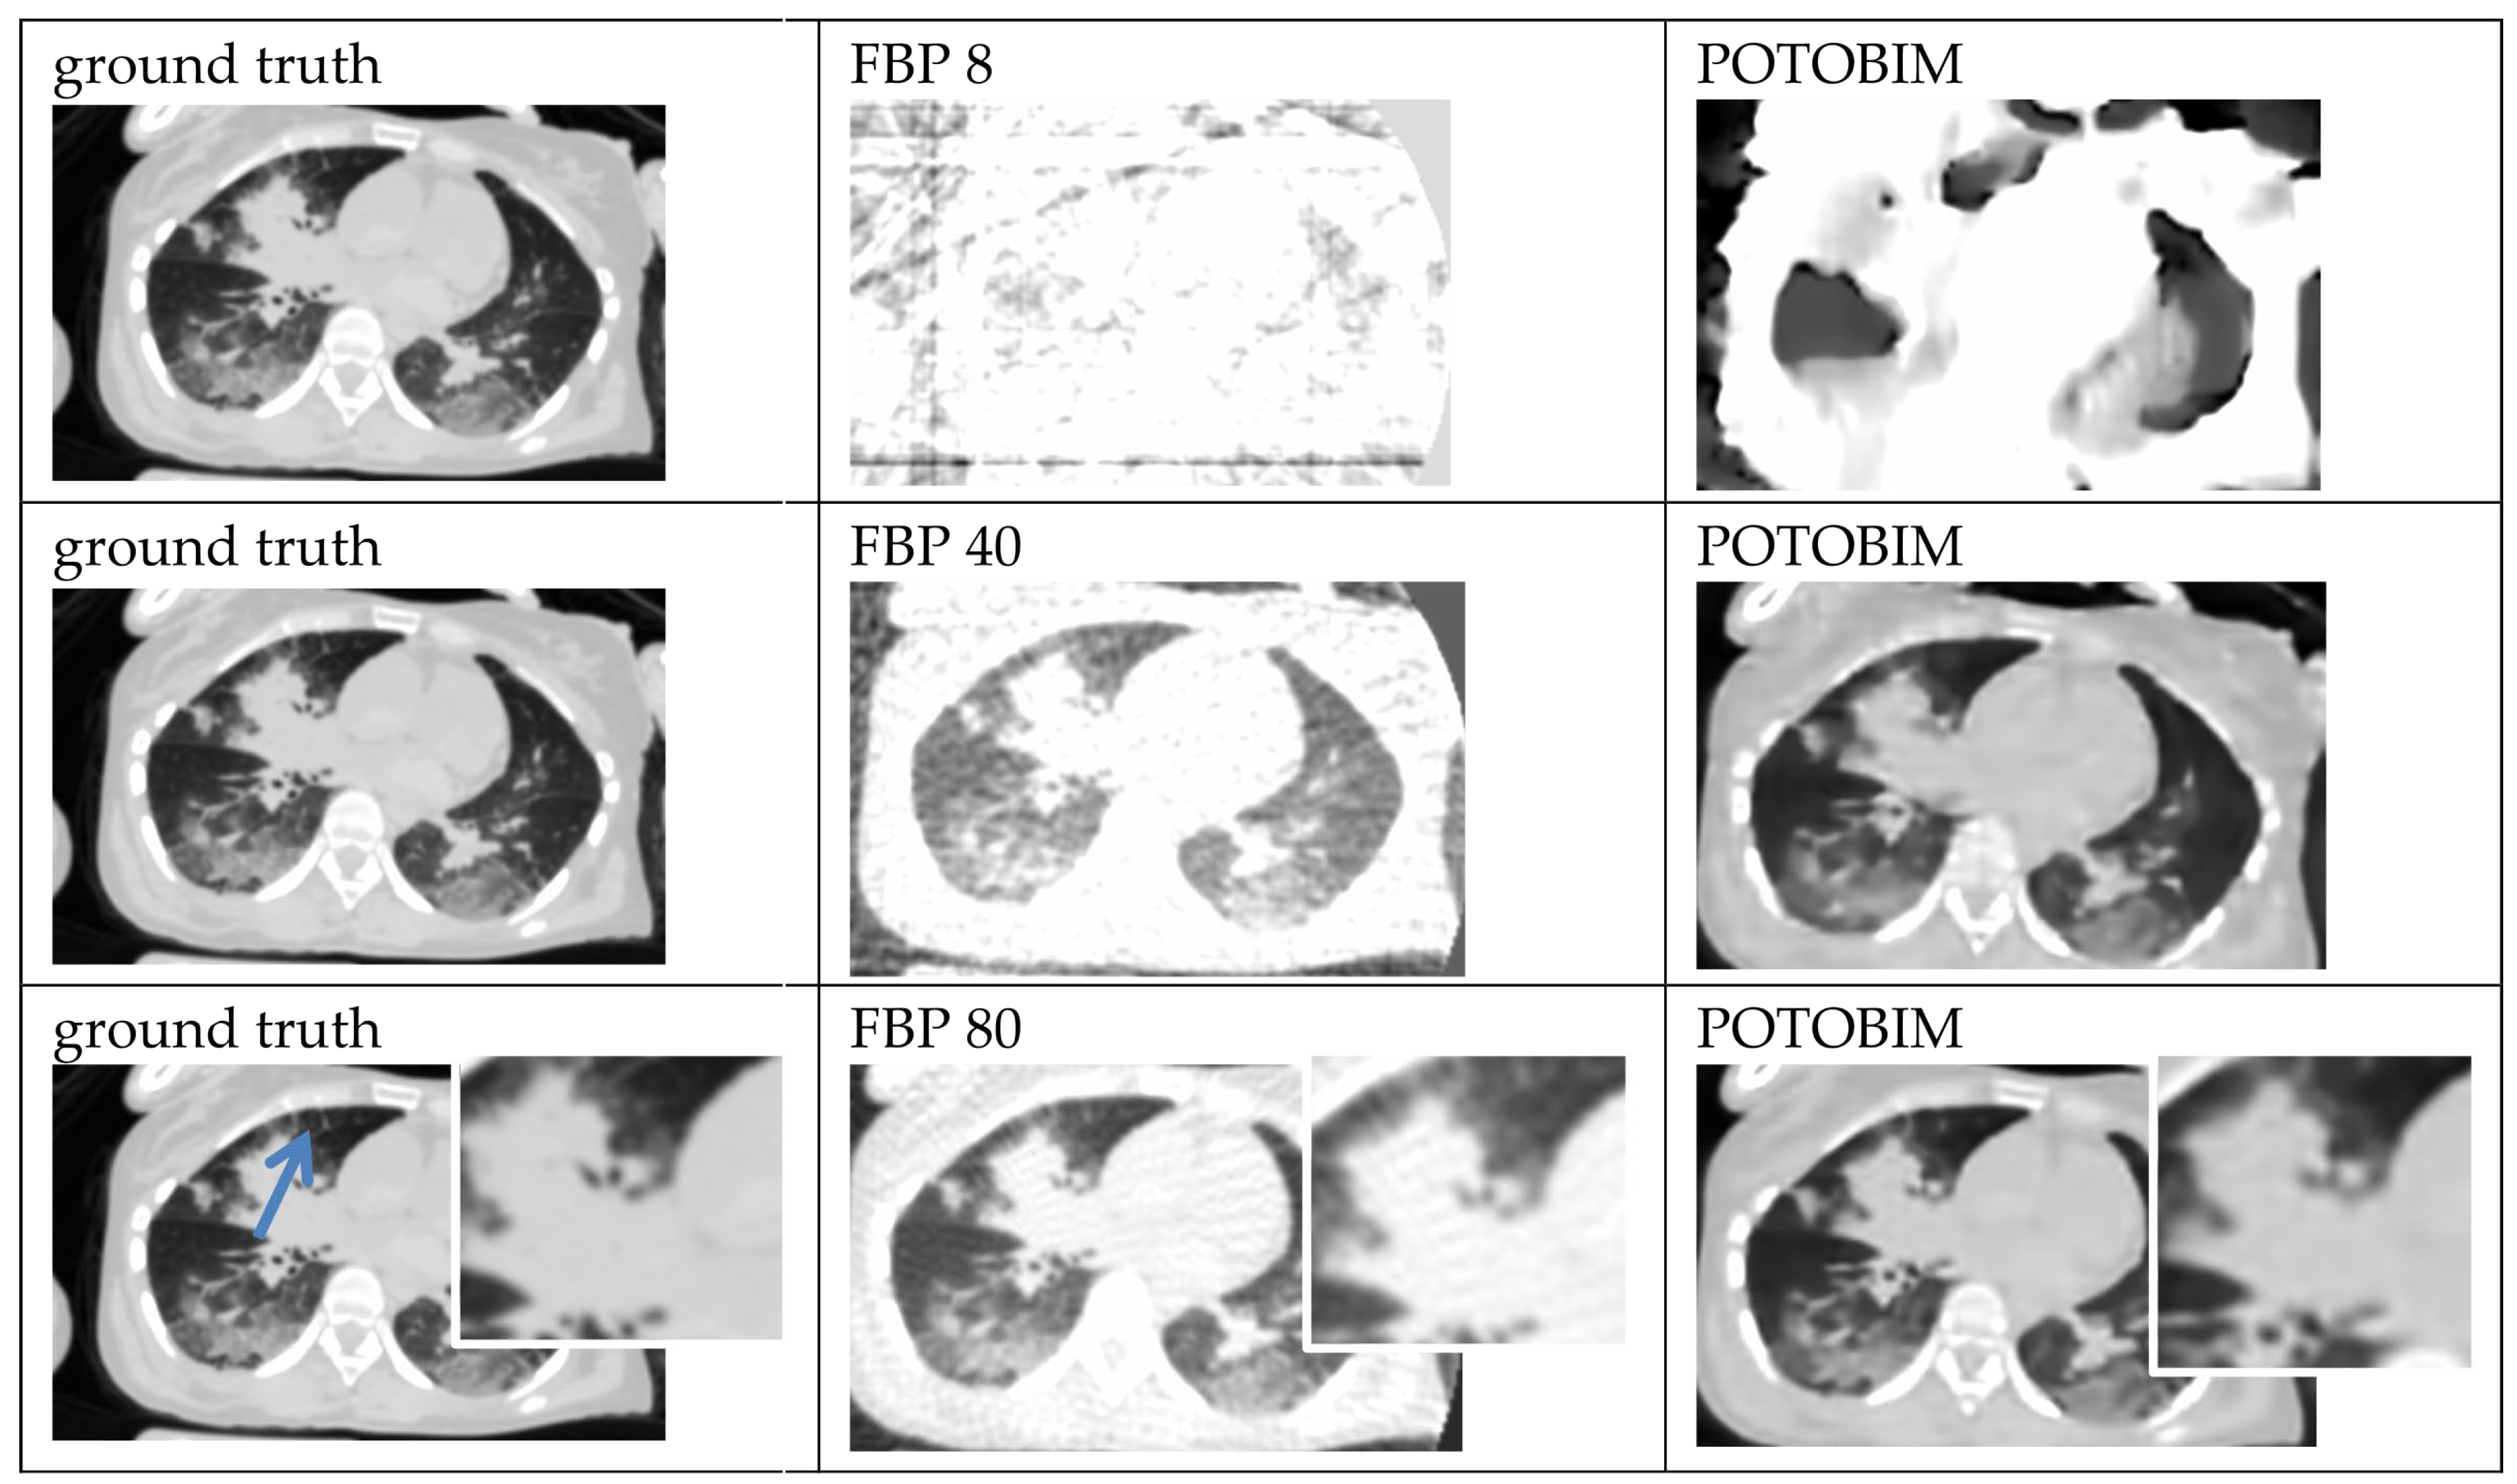
3.1. Visual Grading
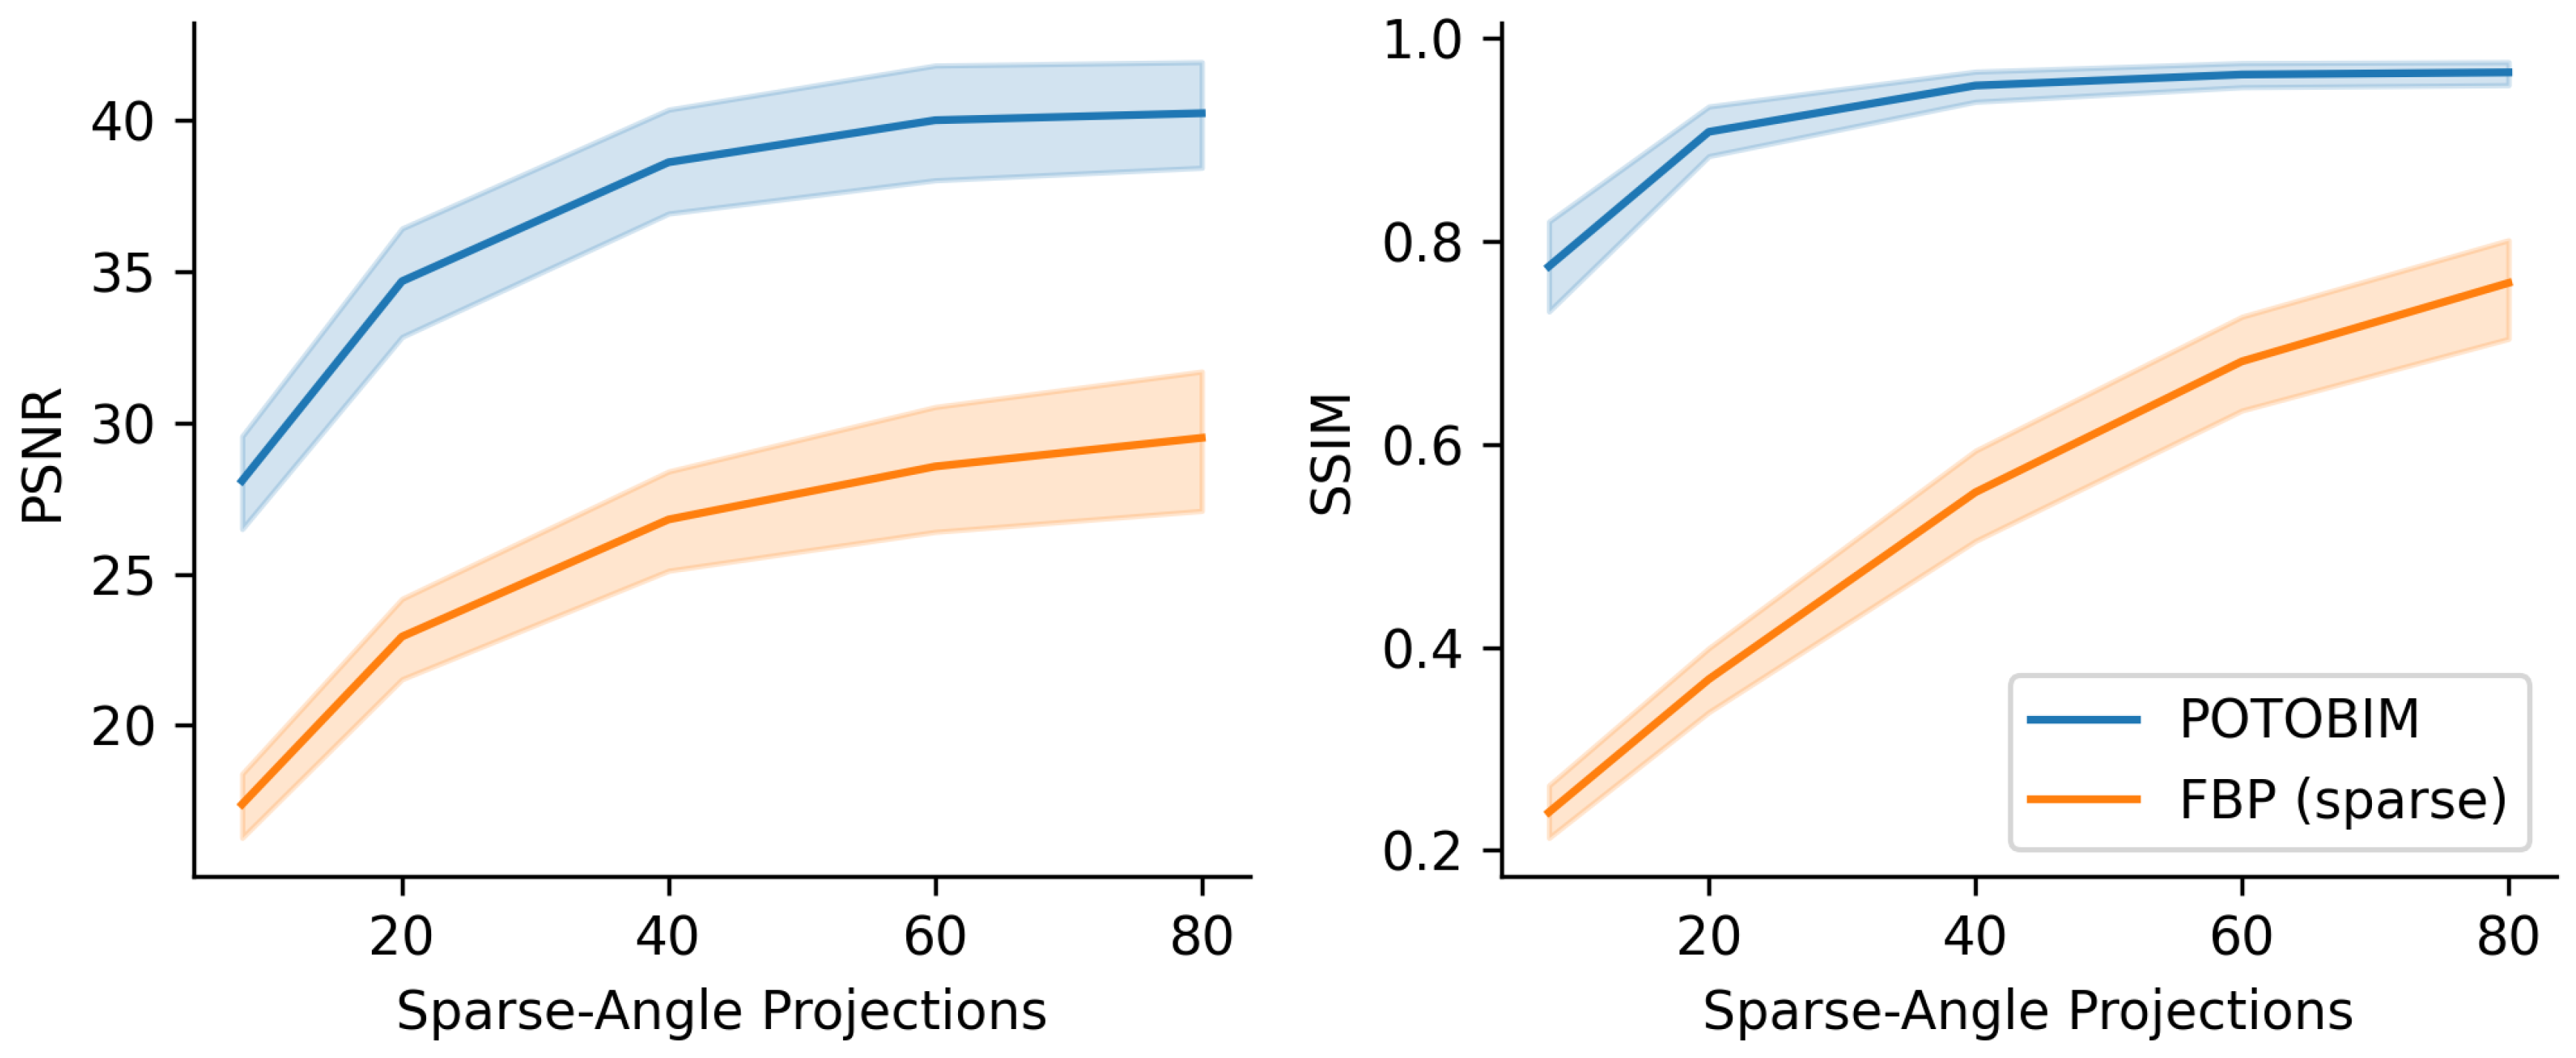
3.2. Quantitative Evaluation
4. Discussion and Conclusions
Author Contributions
Funding
Institutional Review Board Statement
Informed Consent Statement
Data Availability Statement
Conflicts of Interest
Appendix A

References
- Brenner, D.J.; Hall, E.J. Computed tomography—An increasing source of radiation exposure. New Engl. J. Med. 2007, 357, 2277–2284. [Google Scholar] [CrossRef]
- Rogers, L.F. Radiation exposure in CT—Why so high? Am. J. Roentgenol. 2001, 177, 277. [Google Scholar] [CrossRef]
- Bundesamt für Strahlenschutz BfU, Naturschutz, Bau und Reaktorsicherheit. Umweltradioaktivität und Strahlenbelastung: Jahresbericht 2019. Available online: https://nbn-resolving.de/urn:nbn:de:0221-2022041232235 (accessed on 8 November 2022).
- Bundesamt für Strahlenschutz BfU. Welche Strahlenschutz-Prinzipien gibt es—Was Ist ALARA? 2019. Available online: https://www.bfs.de/SharedDocs/FAQs/BfS/DE/ion/ion/alara.html (accessed on 8 November 2022).
- Kudo, H.; Suzuki, T.; Rashed, E.A. Image reconstruction for sparse-view CT and interior CT—Introduction to compressed sensing and differentiated back projection. Quant. Imaging Med. Surg. 2013, 3, 147. [Google Scholar]
- Li, W.; Buzzard, G.T.; Bouman, C.A. Sparse-View CT Reconstruction Using Recurrent Stacked Back Projection. In Proceedings of the 55th Asilomar Conference on Signals, Systems, and Computers, Pacific Grove, CA, USA, 31 October–3 November 2021. [Google Scholar]
- Pleszczyński, M.; Zielonka, A.; Polap, D.; Woźniak, M.; Mańdziuk, J. Polar bear optimization for industrial computed tomography with incomplete data. In Proceedings of the IEEE Congress on Evolutionary Computation (CEC), Kraków, Poland, 28 June–1 July 2021. [Google Scholar]
- Buratti, A.; Achour, S.B.; Isenberg, C.; Schmitt, R. Frequency-Based Method to Optimize the Number of Projections for Industrial Computed Tomography. In Proceedings of the 6th Conference on Industrial Computed Tomography, Wels, Austria, 9–12 February 2016. [Google Scholar]
- Geyer, L.L.; Schoepf, U.J.; Meinel, F.G.; Nance, J.W.; Bastarrika, G.; Leipsic, J.A.; Paul, N.S.; Rengo, M.; Laghi, A.; De Cecco, C.N. State of the art: Iterative CT reconstruction techniques. Radiology 2015, 276, 339–357. [Google Scholar] [CrossRef]
- Zinsser, D.; Marcus, R.; Othman, A.E.; Bamberg, F.; Nikolaou, K.; Flohr, T.; Notohamiprodjo, M. Dose Reduction and Dose Management in Computed Tomography—State of the Art. Rofo 2018, 190, 531–541. [Google Scholar] [CrossRef]
- Arndt, C.; Güttler, F.; Heinrich, A.; Bürckenmeyer, F.; Diamantis, I.; Teichgräber, U. Deep learning CT image reconstruction in clinical practice. Rofo 2021, 193, 252–261. [Google Scholar] [CrossRef] [PubMed]
- Gordon, R.; Bender, R.; Herman, G.T. Algebraic reconstruction techniques (ART) for three-dimensional electron microscopy and X-ray photography. J. Theor. Biol. 1970, 29, 471–481. [Google Scholar] [CrossRef] [PubMed]
- Thibault, J.B.; Sauer, K.D.; Bouman, C.A.; Hsieh, J. A three-dimensional statistical approach to improved image quality for multislice helical CT. Med. Phys. 2007, 34, 4526–4544. [Google Scholar] [CrossRef]
- Beister, M.; Kolditz, D.; Kalender, W.A. Iterative reconstruction methods in X-ray CT. Phys. Med. 2012, 28, 94–108. [Google Scholar] [CrossRef] [PubMed]
- Qi, H.; Chen, Z.; Wu, S.; Xu, Y.; Zhou, L. Iterative image reconstruction using modified non-local means filtering for limited-angle computed tomography. Phys. Med. 2016, 32, 1041–1051. [Google Scholar] [CrossRef]
- Pleszczyński, M.; Zielonka, A.; Woźniak, M. Application of Nature-Inspired Algorithms to Computed Tomography with Incomplete Data. Symmetry 2022, 14, 2256. [Google Scholar] [CrossRef]
- Yang, F.; Zhang, D.; Huang, K.; Gao, Z.; Yang, Y. Incomplete projection reconstruction of computed tomography based on the modified discrete algebraic reconstruction technique. Meas. Sci. Technol. 2018, 29, 025405. [Google Scholar] [CrossRef]
- Zhu, B.; Liu, J.Z.; Cauley, S.F.; Rosen, B.R.; Rosen, M.S. Image reconstruction by domain-transform manifold learning. Nature 2018, 555, 487–492. [Google Scholar] [CrossRef]
- Antun, V.; Renna, F.; Poon, C.; Adcock, B.; Hansen, A.C. On instabilities of deep learning in image reconstruction and the potential costs of AI. Proc. Natl. Acad. Sci. USA 2020, 117, 30088–30095. [Google Scholar] [CrossRef] [PubMed]
- Bhadra, S.; Kelkar, V.A.; Brooks, F.J.; Anastasio, M.A. On hallucinations in tomographic image reconstruction. IEEE Trans. Med. Imaging 2021, 40, 3249–3260. [Google Scholar] [CrossRef] [PubMed]
- Baguer, D.O.; Leuschner, J.; Schmidt, M. Computed tomography reconstruction using deep image prior and learned reconstruction methods. Inverse Probl. 2020, 36, 094004. [Google Scholar] [CrossRef]
- Carrillo, H.; Millardet, M.; Carlier, T.; Mateus, D. Low-count PET image reconstruction with Bayesian inference over a Deep Prior. SPIE Med. Imaging 2021, 11596, 227–235. [Google Scholar]
- Cheng, Z.; Gadelha, M.; Maji, S.; Sheldon, D. A Bayesian Perspective on the Deep Image Prior. In Proceedings of the IEEE/CVF Conference on Computer Vision and Pattern Recognition, Long Beach, CA, USA, 15–19 June 2019. [Google Scholar]
- Laves, M.H.; Tölle, M.; Schlaefer, A.; Engelhardt, S. Posterior temperature optimized Bayesian models for inverse problems in medical imaging. Med. Image Anal. 2022, 78, 102382. [Google Scholar] [CrossRef]
- Wang, Z.; Bovik, A.C.; Sheikh, H.R.; Simoncelli, E.P. Image quality assessment: From error visibility to structural similarity. IEEE Trans. Image Process. 2004, 13, 600–612. [Google Scholar] [CrossRef]
- Van der Walt, S.; Schönberger, J.L.; Nunez-Iglesias, J.; Boulogne, F.; Warner, J.D.; Yager, N.; Gouillart, E.; Yu, T. scikit-image: Image processing in Python. PeerJ 2014, 2, e453. [Google Scholar] [CrossRef]
- Ludewig, E.; Richter, A.; Frame, M. Diagnostic imaging—Evaluating image quality using visual grading characteristic (VGC) analysis. Vet. Res. Commun. 2010, 34, 473–479. [Google Scholar] [CrossRef] [PubMed]
- Yamashita, R.; Nishio, M.; Do, R.K.G.; Togashi, K. Convolutional neural networks: An overview and application in radiology. Insights Imaging 2018, 9, 611–629. [Google Scholar] [CrossRef] [PubMed]
- Akagi, M.; Nakamura, Y.; Higaki, T.; Narita, K.; Honda, Y.; Zhou, J.; Awai, K. Deep learning reconstruction improves image quality of abdominal ultra-high-resolution CT. Eur. Radiol. 2019, 29, 6163–6171. [Google Scholar] [CrossRef] [PubMed]
- Hsieh, J.; Liu, E.; Nett, B.; Tang, J.; Thibault, J.B.; Sahney, S. A New Era of Image Reconstruction: TrueFidelity™. Technical White Paper on Deep Learning Image Reconstruction (JB68676XX) 2019, GE Healthcare. Available online: https://www.gehealthcare.com.br/-/jssmedia/040dd213fa89463287155151fdb01922.pdf (accessed on 29 June 2023).
- Mason, A.; Rioux, J.; Clarke, S.E.; Costa, A.; Schmidt, M.; Keough, V.; Beyea, S. Comparison of objective image quality metrics to expert radiologists’ scoring of diagnostic quality of MR images. IEEE Trans. Med. Imaging 2019, 39, 1064–1072. [Google Scholar] [CrossRef]


| Region/Structure | 8× | 40× | 80× |
|---|---|---|---|
| Femur (both sides) | 5 | 4 | 4 |
| Heart-lung | 5 | 4 | 3 |
| Brain tissue | 5 | 5 | 5 |
| Total hip endoprosthesis left | 5 | 4 | 3 |
| Total hip endoprosthesis right | 5 | 4 | 3 |
| Lung | 5 | 5 | 4 |
| Lumbar vertebral body 5 | 5 | 4 | 4 |
| Rectus abdominis muscle | 5 | 5 | 4 |
| Dental crone | 5 | 4 | 3 |
| Spleen | 5 | 5 | 5 |
| Kidney left | 5 | 5 | 5 |
| Pancreas | 5 | 5 | 5 |
| Subcutaneous adipose tissue | 5 | 4 | 4 |
| Thyroid gland | 5 | 5 | 4 |
| Hematoma right frontal | 5 | 4 | 4 |
| Subdural bleeding right | 5 | 5 | 5 |
| Subdural hematoma left | 5 | 5 | 5 |
| Region/Structure | 8× | 40× | 80× |
|---|---|---|---|
| Femur | 5 | 4 | 4 |
| Heart-lung | 5 | 5 | 4 |
| Brain tissue | 5 | 5 | 5 |
| Total hip endoprothesis left | 5 | 4 | 4 |
| Total hip endoprothesis right | 5 | 4 | 4 |
| Lung | 5 | 5 | 4 |
| Lumbar vertebral body 5 | 5 | 4 | 4 |
| M. rectus abdominis | 5 | 5 | 4 |
| Dental crone | 5 | 4 | 3 |
| Spleen | 5 | 5 | 4 |
| Kidney left | 5 | 5 | 4 |
| Pancreas | 5 | 5 | 4 |
| Subcutaneous adipose tissue | 5 | 5 | 4 |
| Thyroid gland | 5 | 5 | 4 |
| Hematoma right frontal | 5 | 4 | 3 |
| Subdural bleeding right | 5 | 5 | 4 |
| Subdural hematoma left | 5 | 5 | 5 |
Disclaimer/Publisher’s Note: The statements, opinions and data contained in all publications are solely those of the individual author(s) and contributor(s) and not of MDPI and/or the editor(s). MDPI and/or the editor(s) disclaim responsibility for any injury to people or property resulting from any ideas, methods, instructions or products referred to in the content. |
© 2023 by the authors. Licensee MDPI, Basel, Switzerland. This article is an open access article distributed under the terms and conditions of the Creative Commons Attribution (CC BY) license (https://creativecommons.org/licenses/by/4.0/).
Share and Cite
Kniep, I.; Mieling, R.; Gerling, M.; Schlaefer, A.; Heinemann, A.; Ondruschka, B. Bayesian Reconstruction Algorithms for Low-Dose Computed Tomography Are Not Yet Suitable in Clinical Context. J. Imaging 2023, 9, 170. https://doi.org/10.3390/jimaging9090170
Kniep I, Mieling R, Gerling M, Schlaefer A, Heinemann A, Ondruschka B. Bayesian Reconstruction Algorithms for Low-Dose Computed Tomography Are Not Yet Suitable in Clinical Context. Journal of Imaging. 2023; 9(9):170. https://doi.org/10.3390/jimaging9090170
Chicago/Turabian StyleKniep, Inga, Robin Mieling, Moritz Gerling, Alexander Schlaefer, Axel Heinemann, and Benjamin Ondruschka. 2023. "Bayesian Reconstruction Algorithms for Low-Dose Computed Tomography Are Not Yet Suitable in Clinical Context" Journal of Imaging 9, no. 9: 170. https://doi.org/10.3390/jimaging9090170
APA StyleKniep, I., Mieling, R., Gerling, M., Schlaefer, A., Heinemann, A., & Ondruschka, B. (2023). Bayesian Reconstruction Algorithms for Low-Dose Computed Tomography Are Not Yet Suitable in Clinical Context. Journal of Imaging, 9(9), 170. https://doi.org/10.3390/jimaging9090170