
HEROHE Challenge: Predicting HER2 Status in Breast Cancer from Hematoxylin–Eosin Whole-Slide Imaging

 ,
,  , ,
, ,  , , , , , , , ,
Abstract
:1. Introduction
1.1. Breast Cancer Diagnosis
1.2. HER2 Assessment
1.3. Digital Pathology
1.4. Computer-Aided Diagnosis
1.5. HER2 on HE (HEROHE) Challenge
2. Materials and Methods
2.1. HEROHE Challenge Organization
2.2. Evaluation
2.3. Competing Solutions
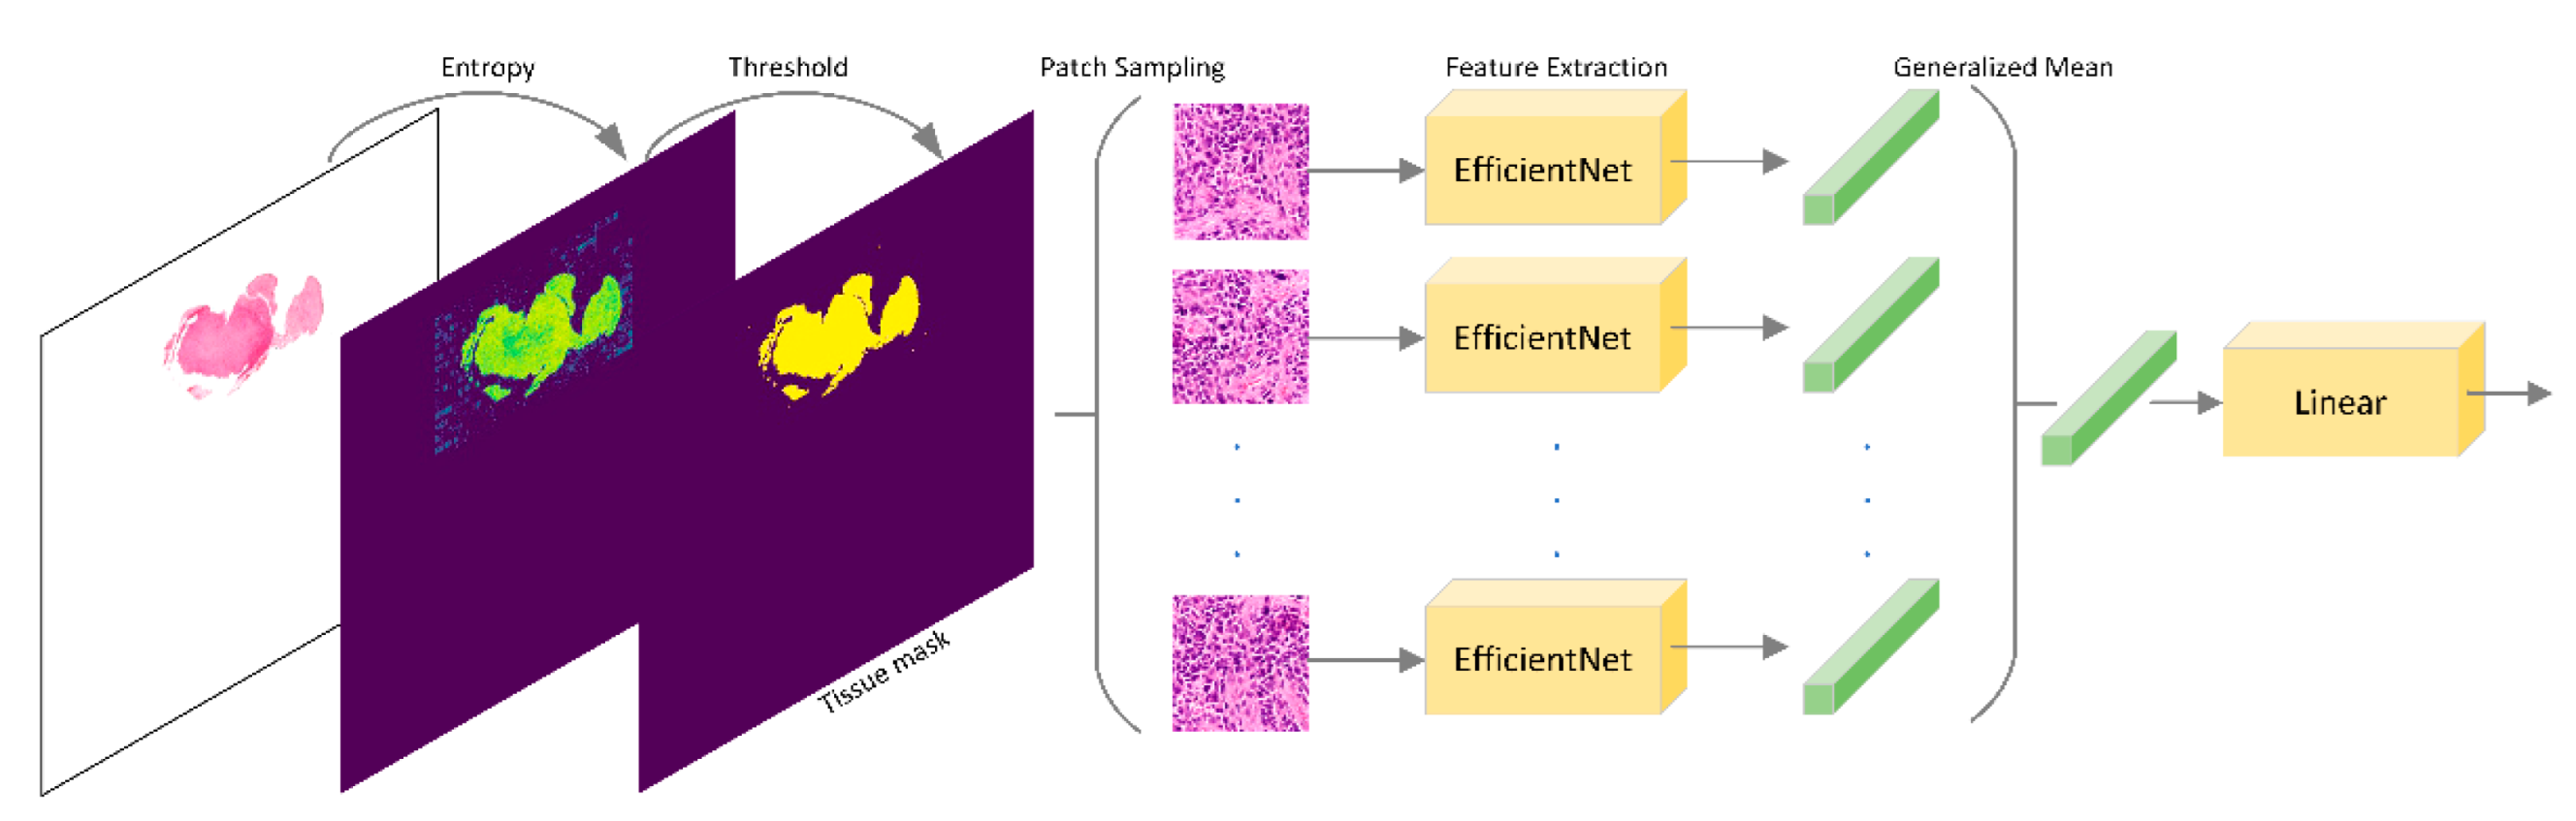
2.3.1. Team Macaroon
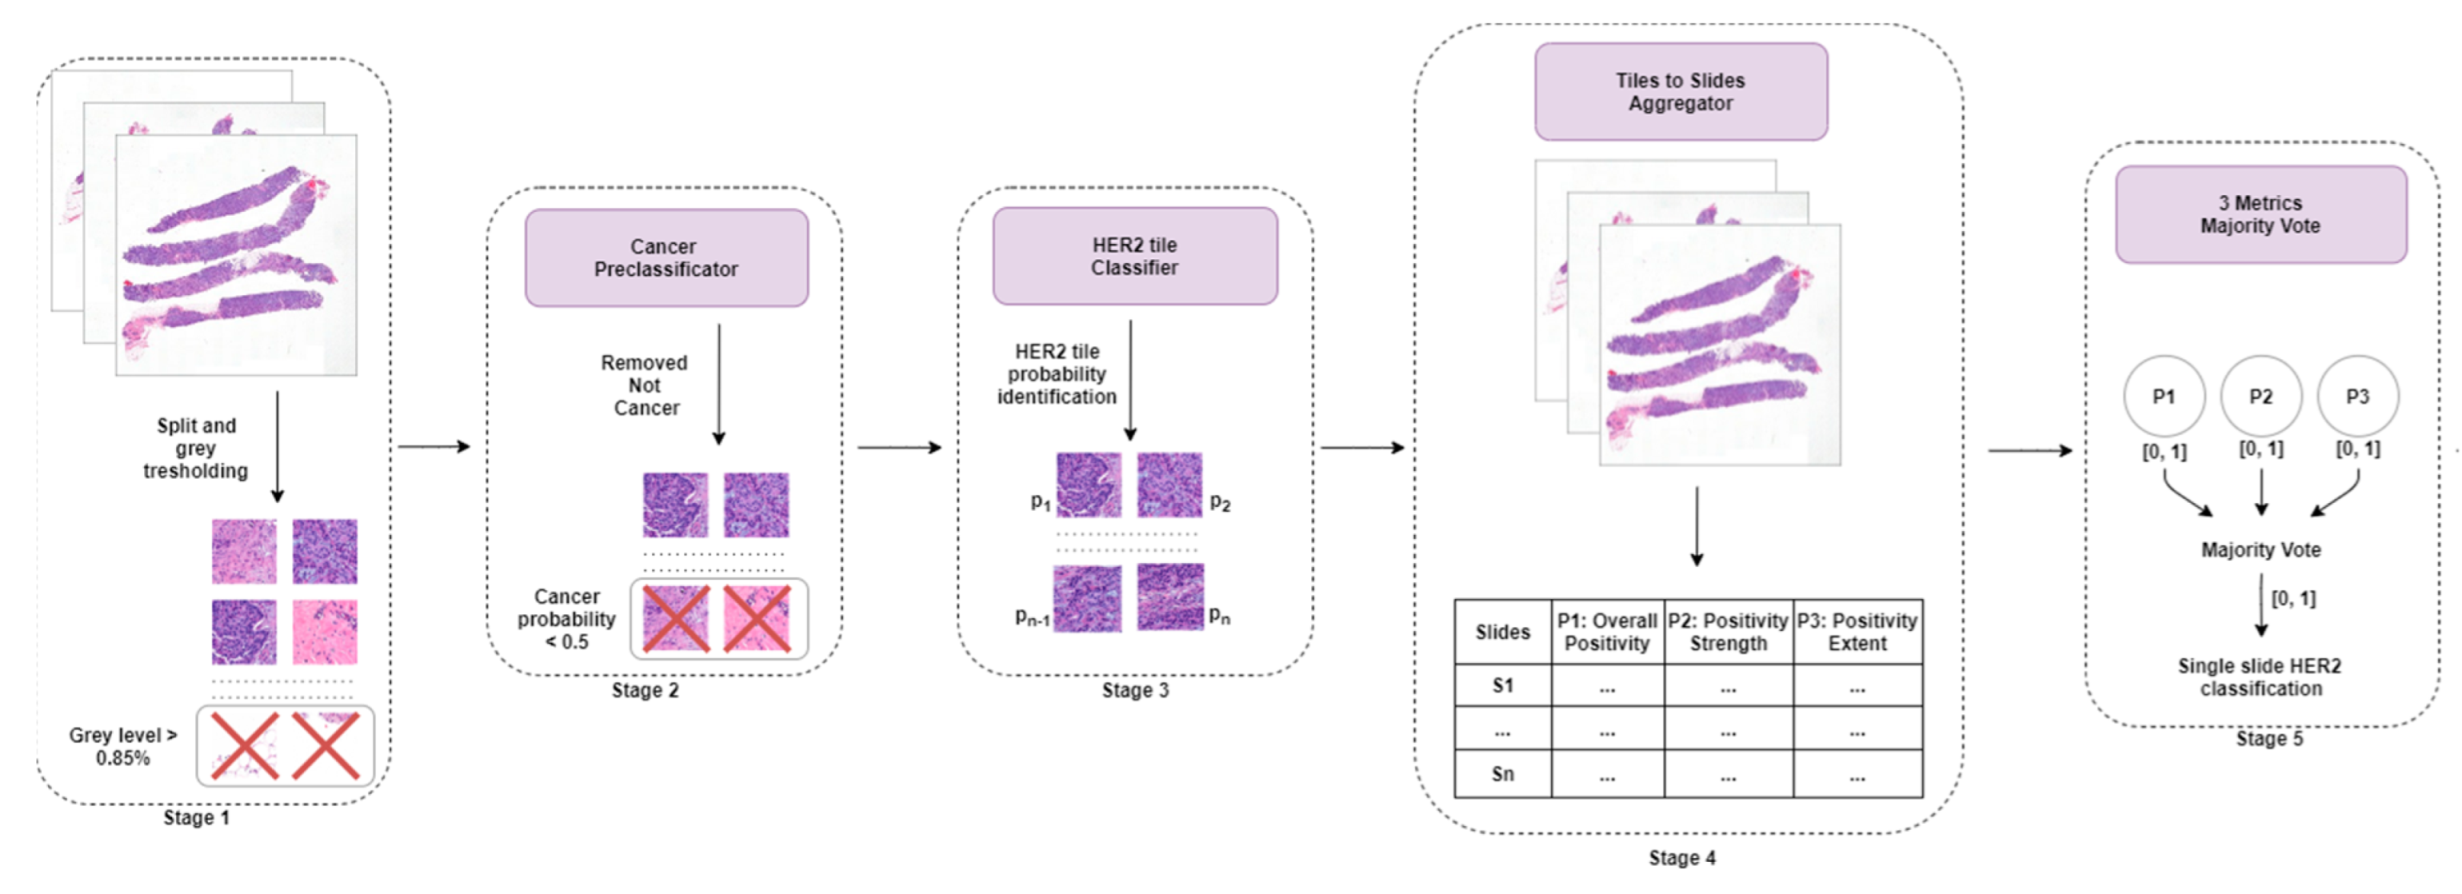
2.3.2. Team MITEL
- Overall positivity: mean positivity probability for all tiles in a WSI. If above 0.5, the slide is positive for HER2;
- Strength of positivity: mean positivity probability of positive tiles only. If above 0.66, the slide is positive;
- Extent of positivity: percentage of positive tiles. If 35% of the tiles for each slide are positive, then the slide is positive.
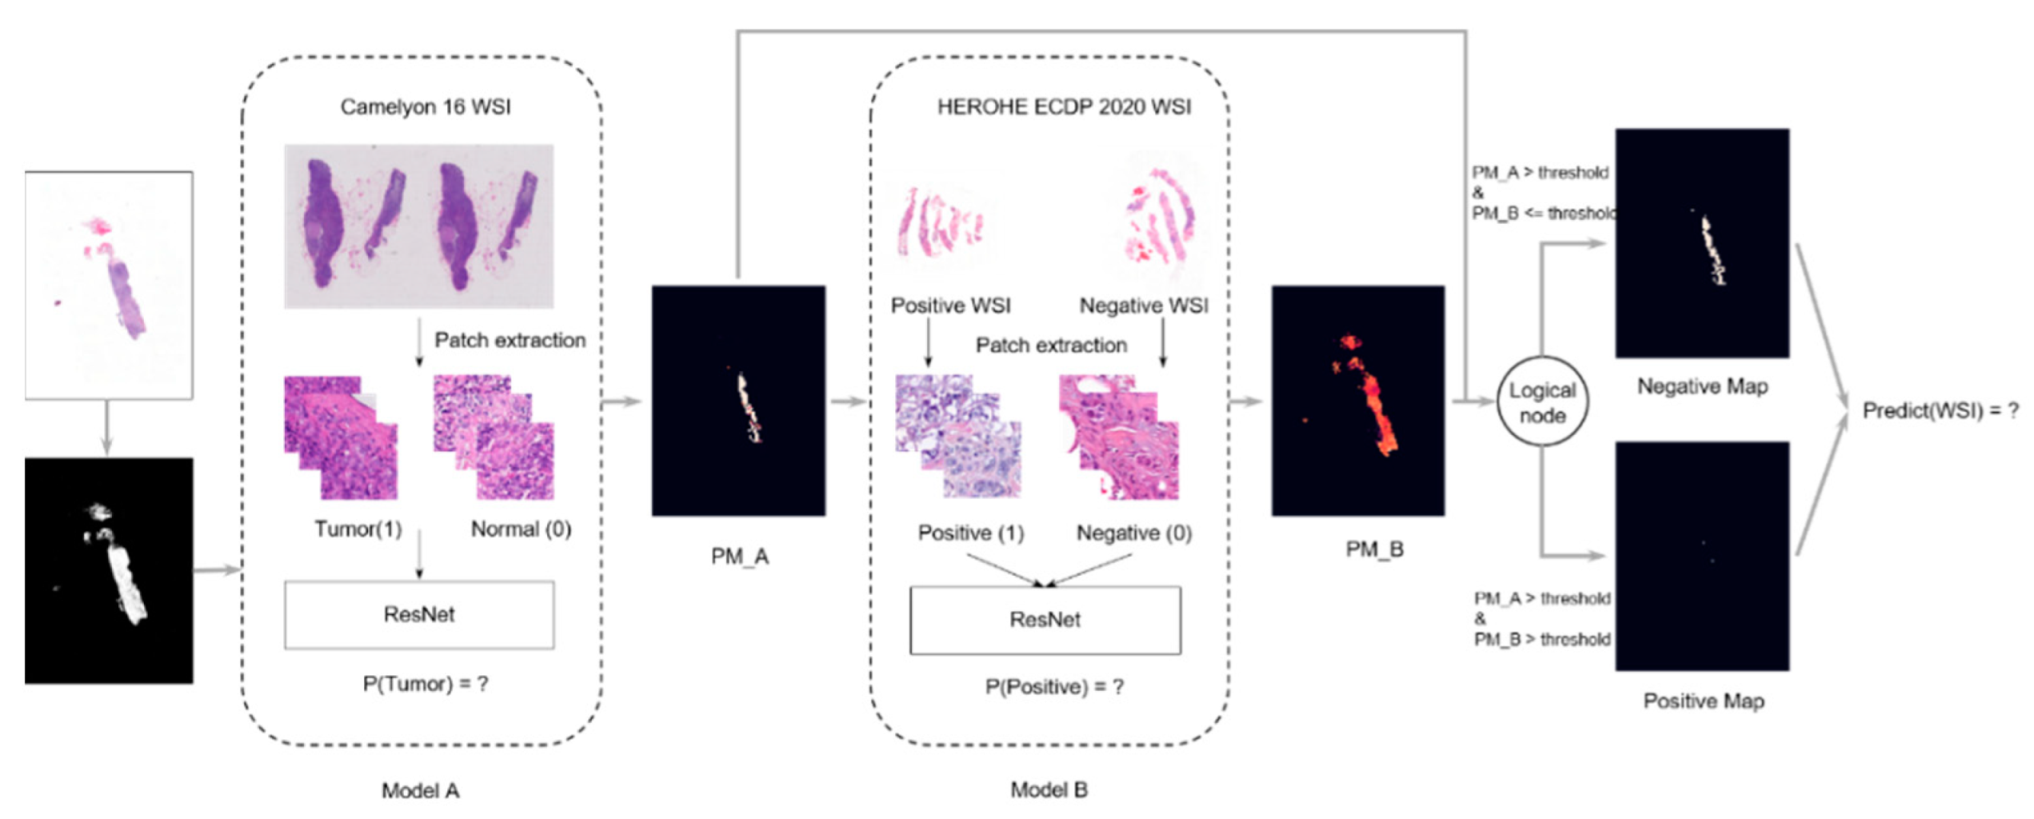
2.3.3. Team Piaz
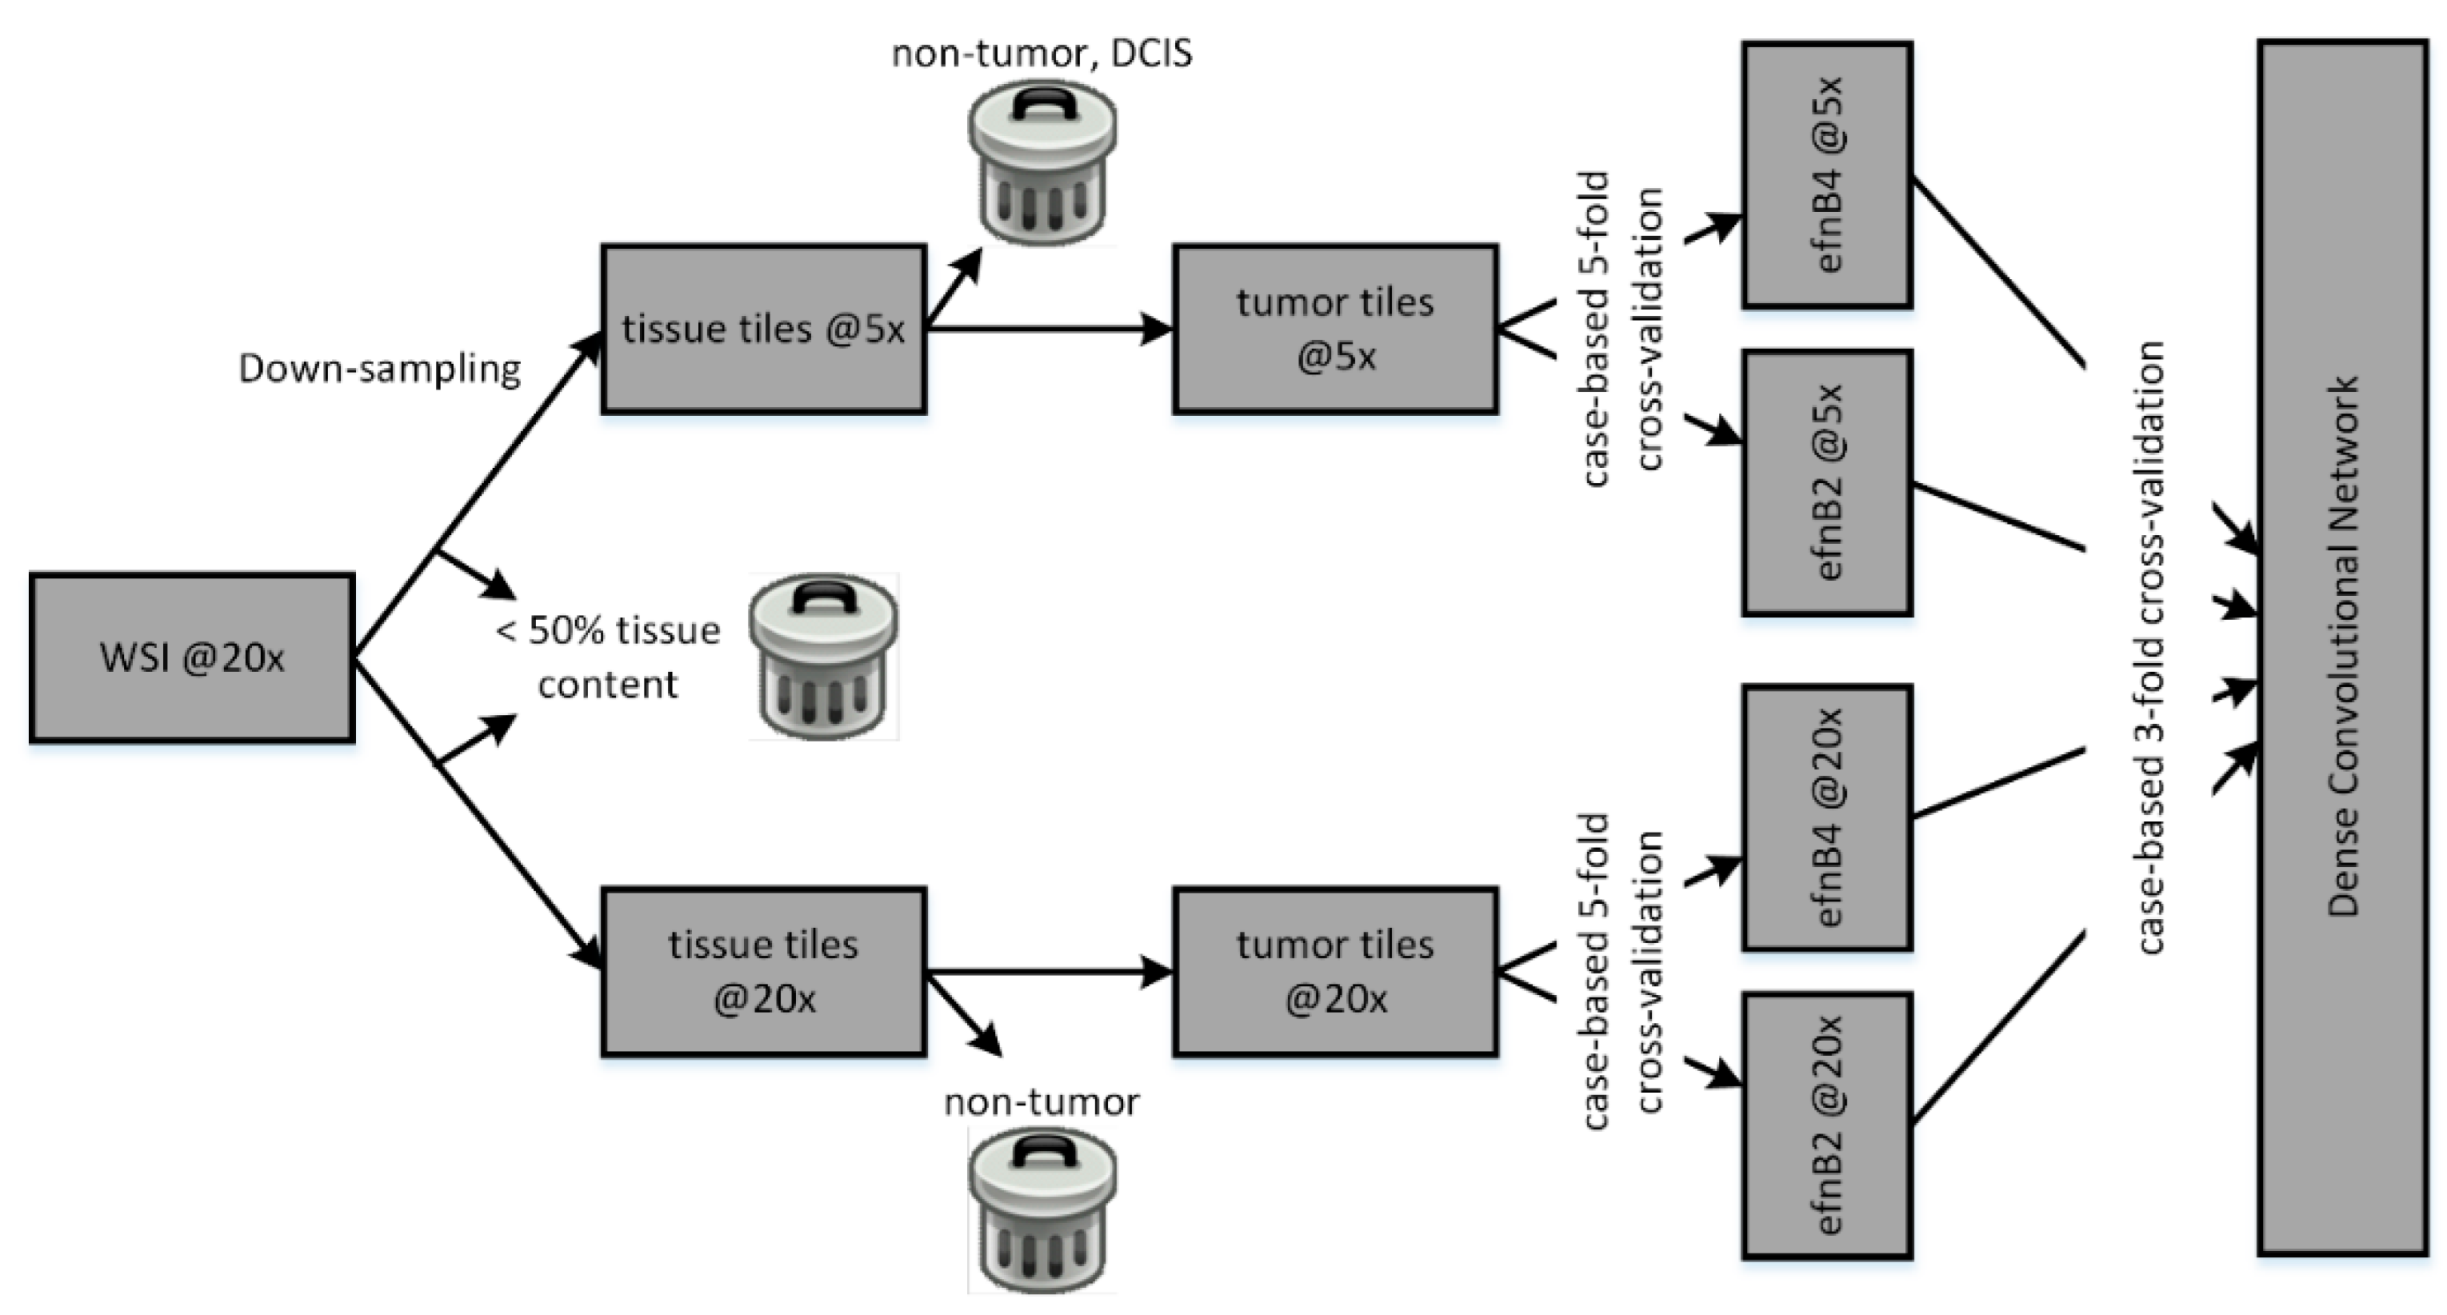
2.3.4. Team Dratur
2.3.5. Team IRISAI
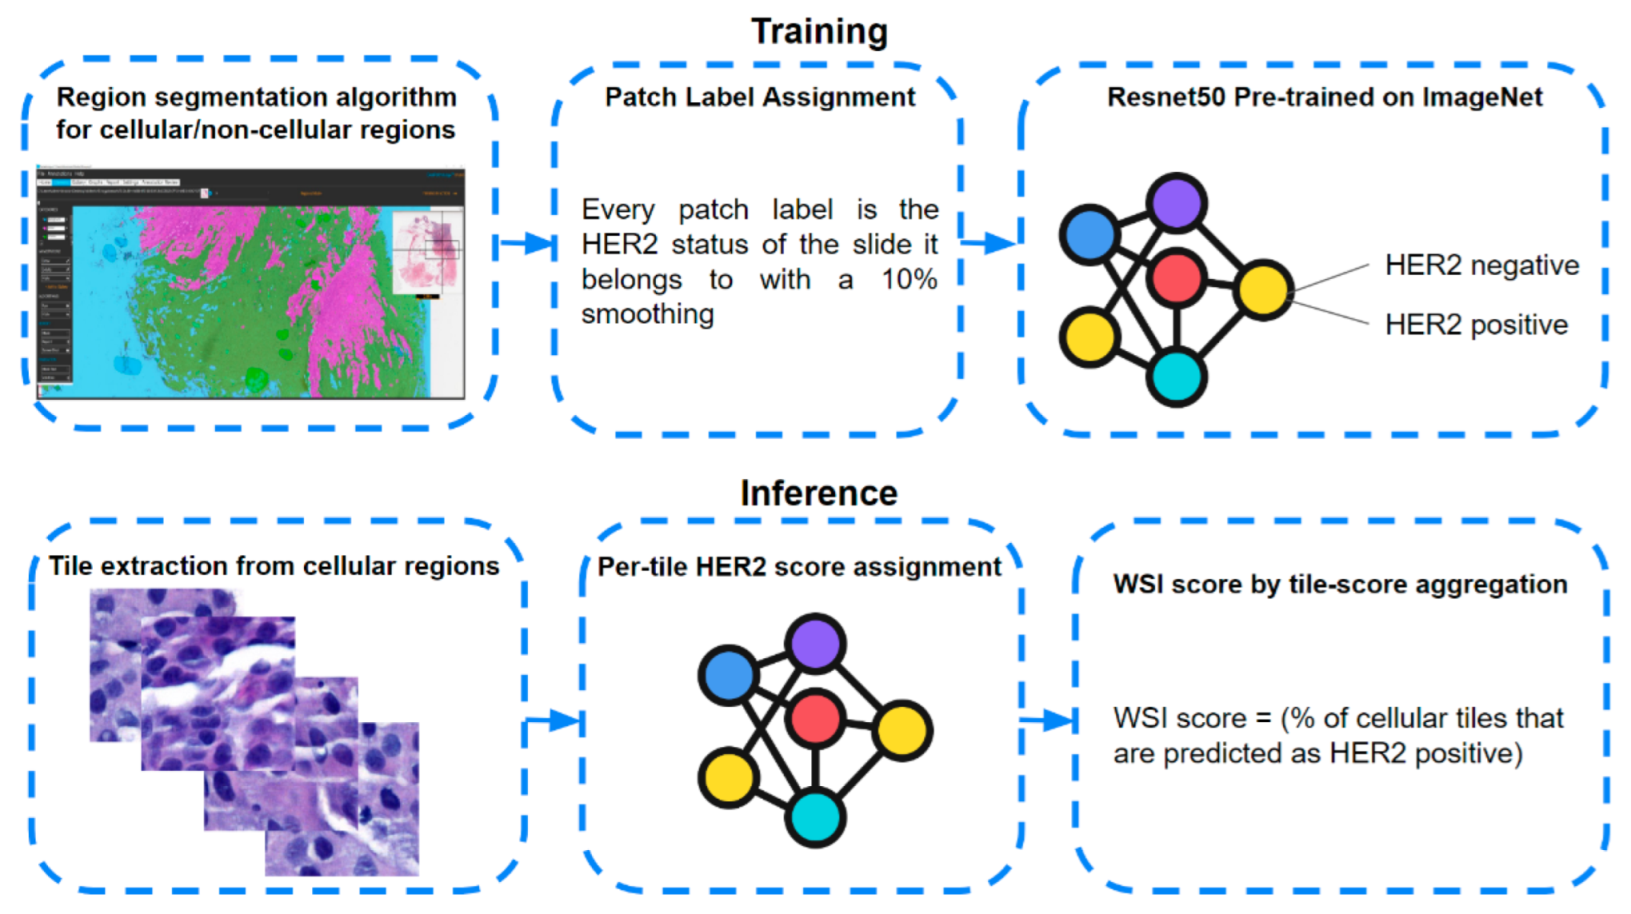
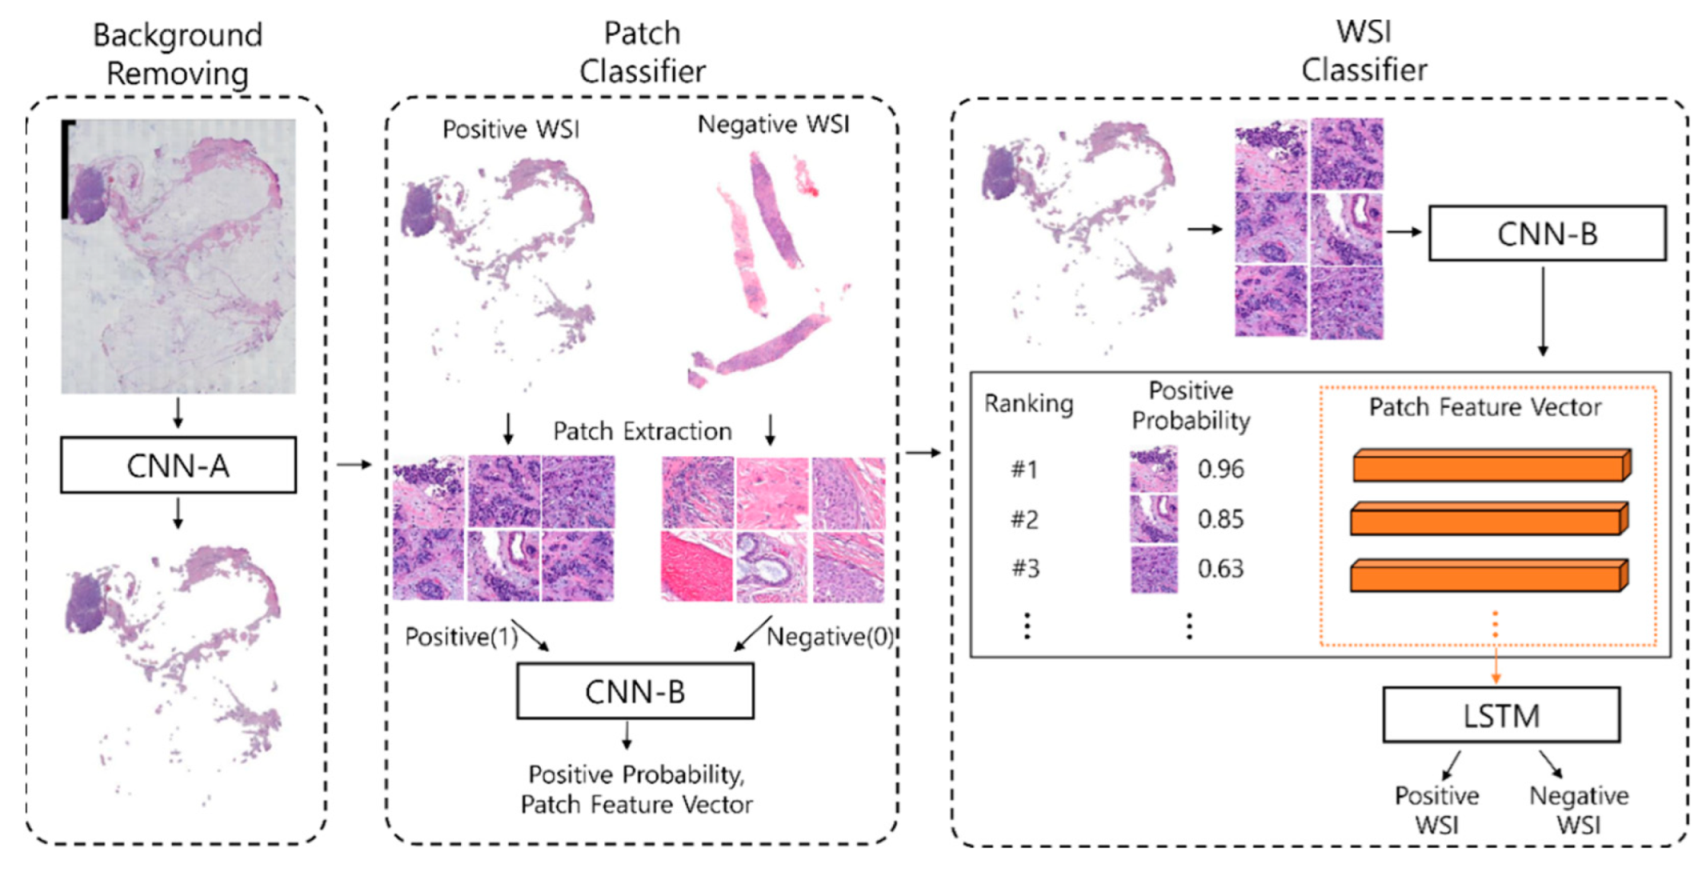
2.3.6. Team Arontier_HYY
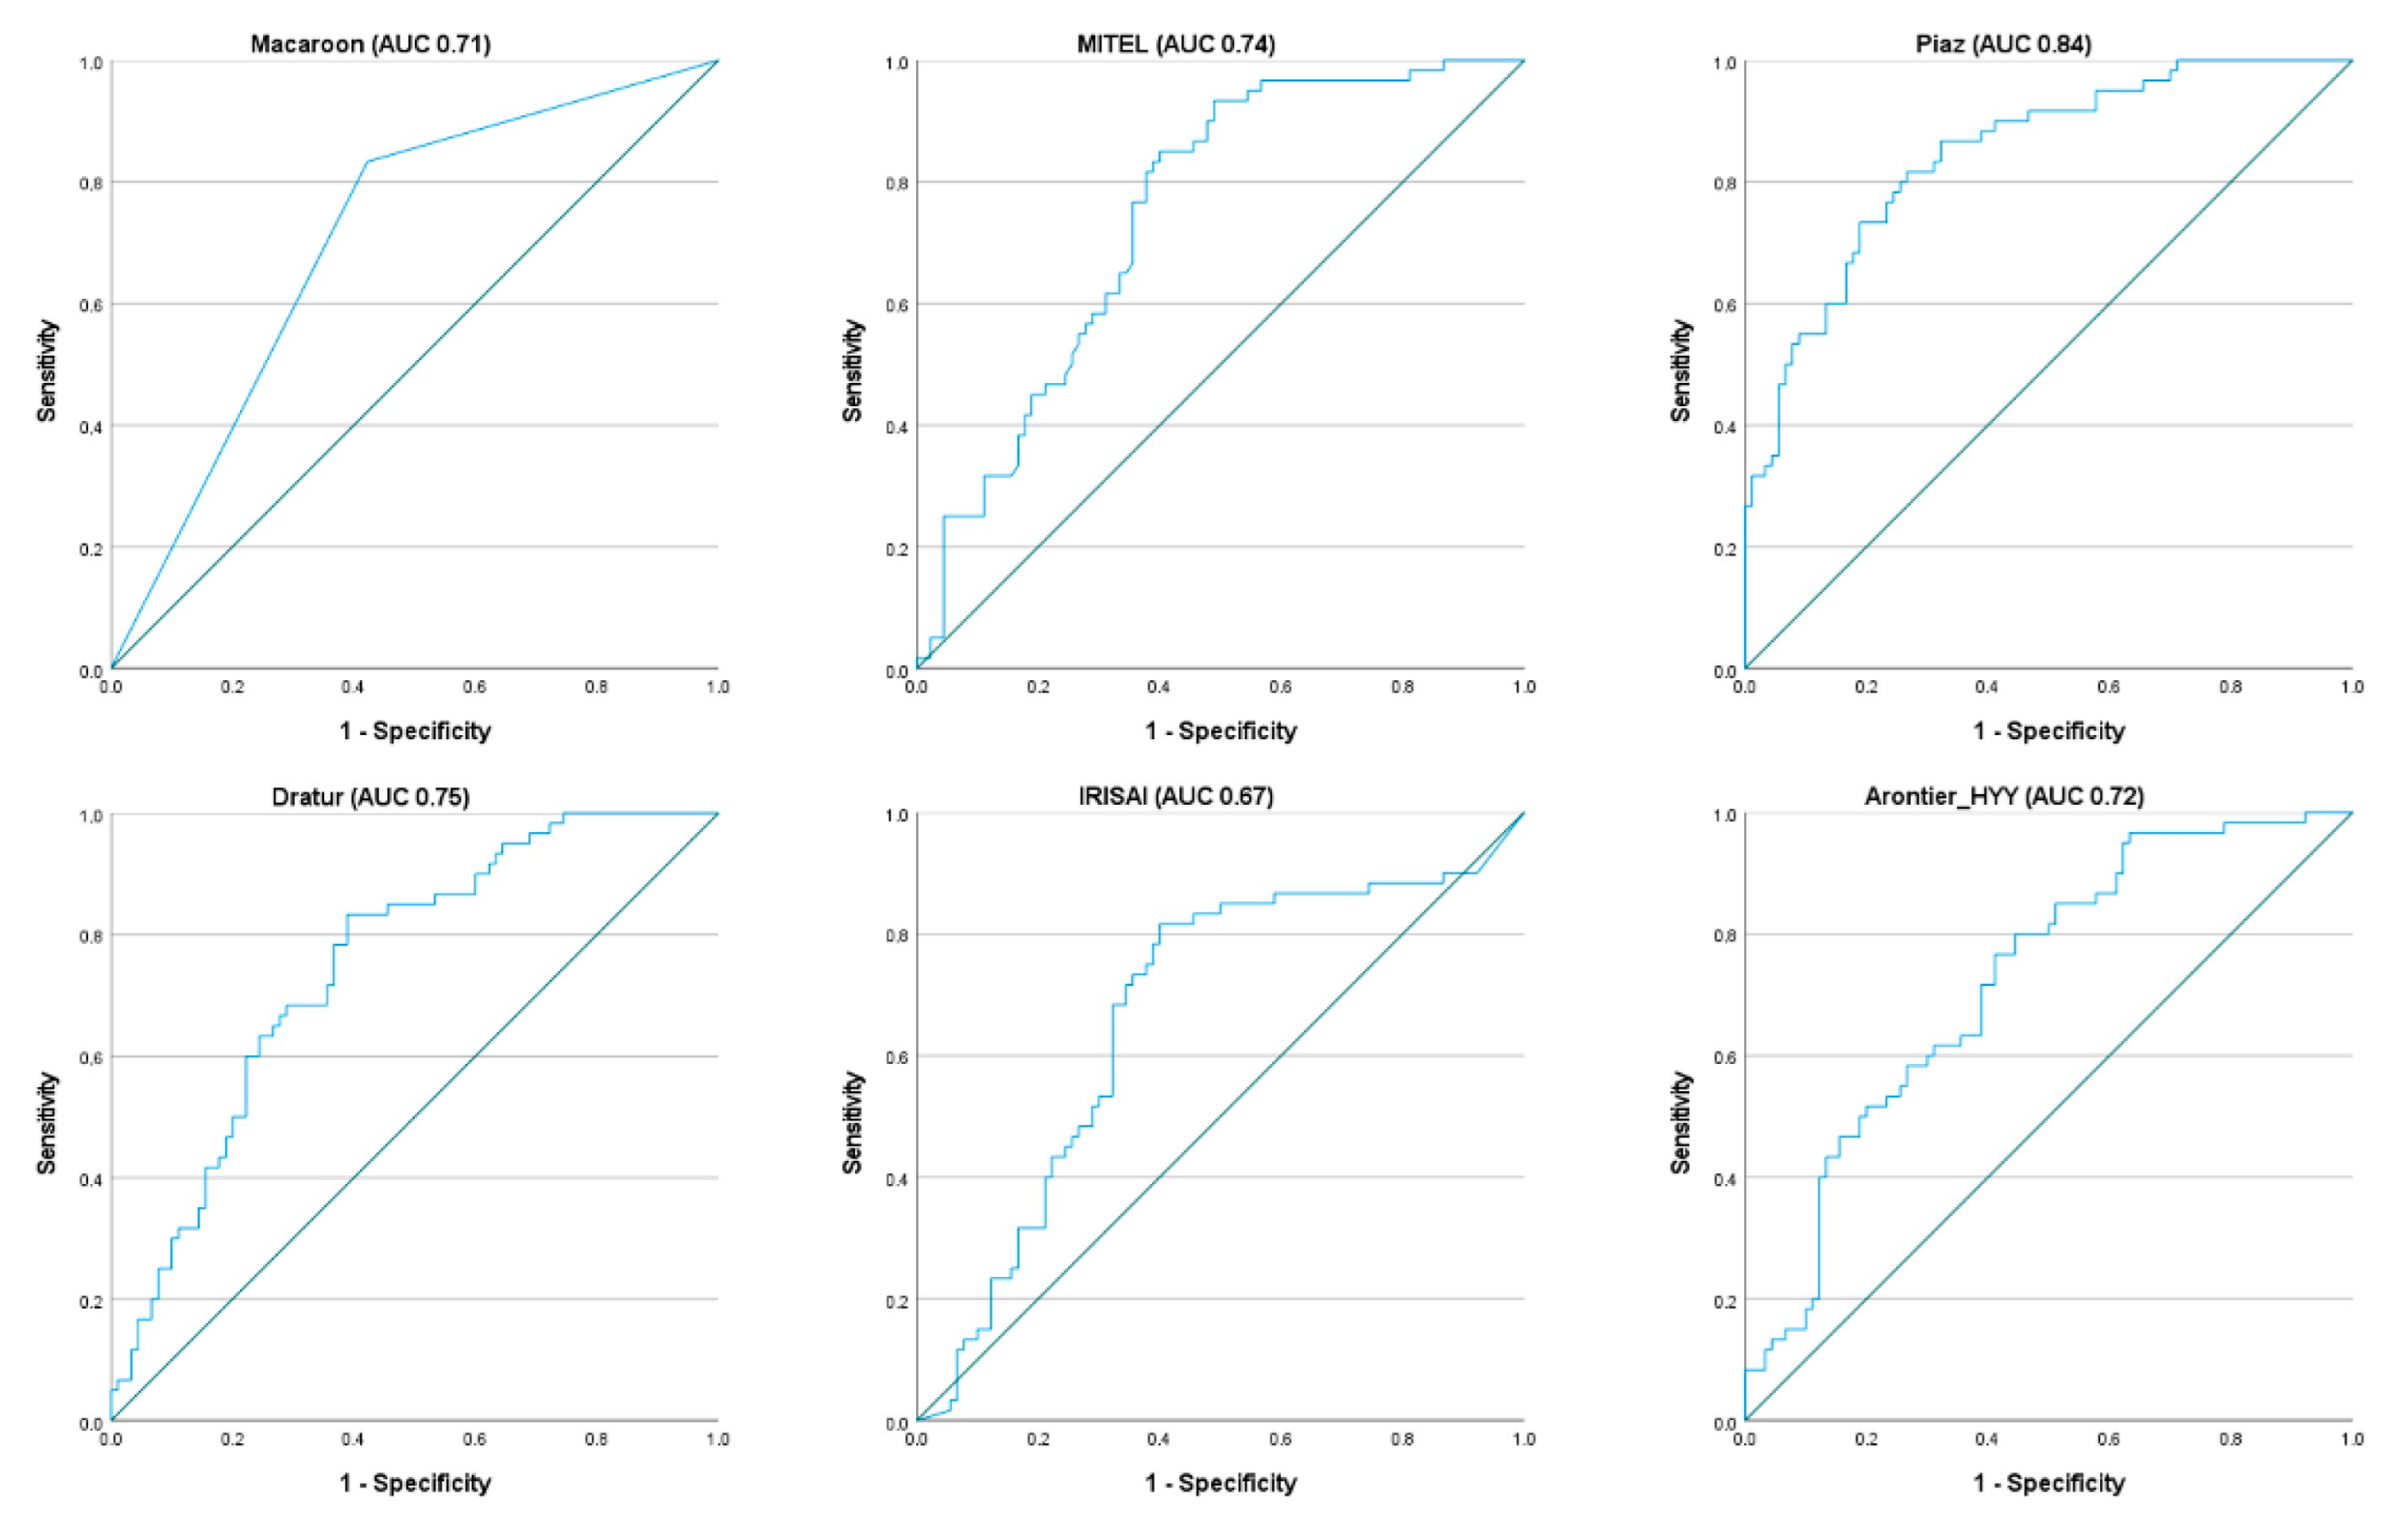
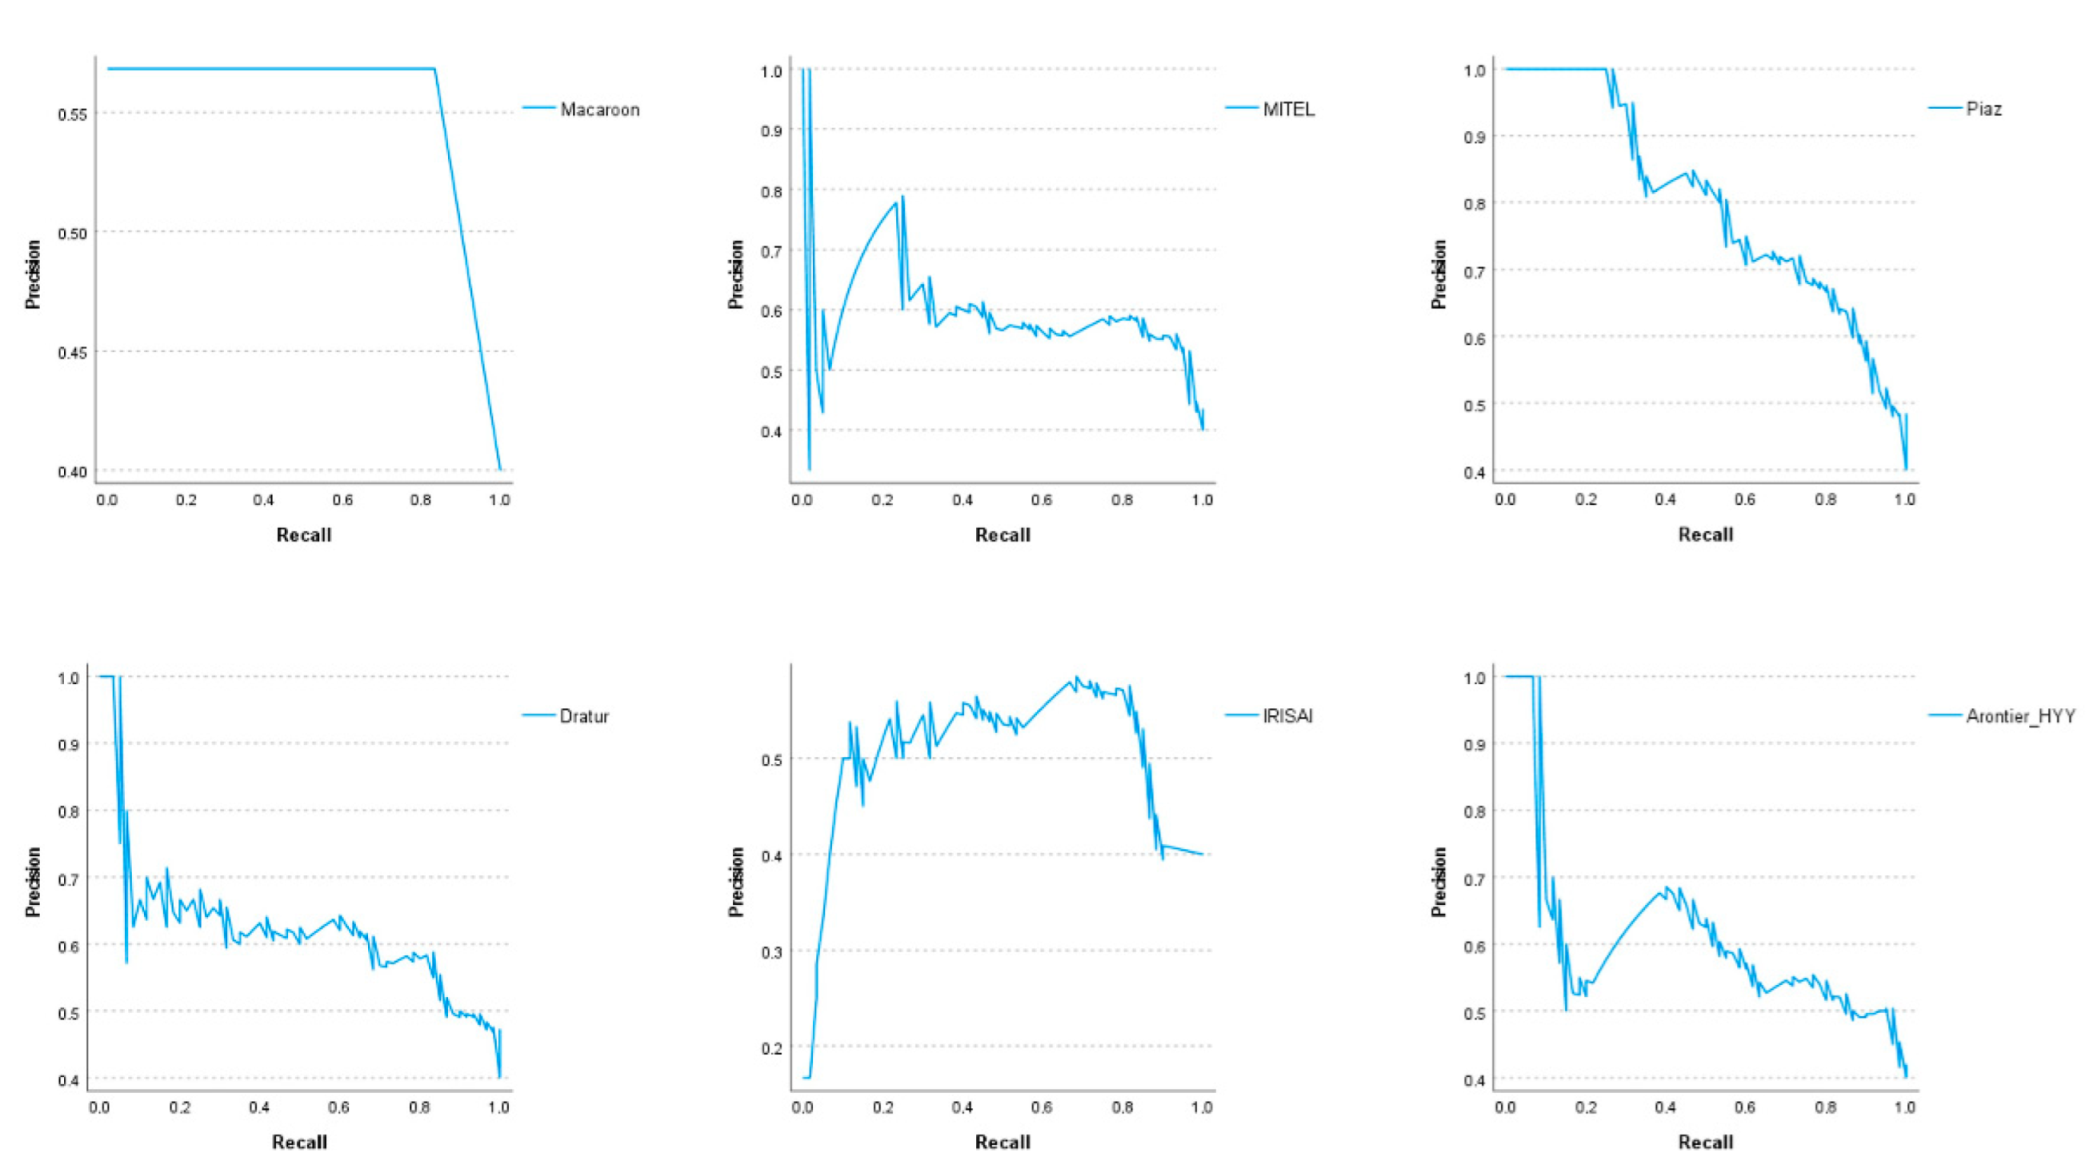
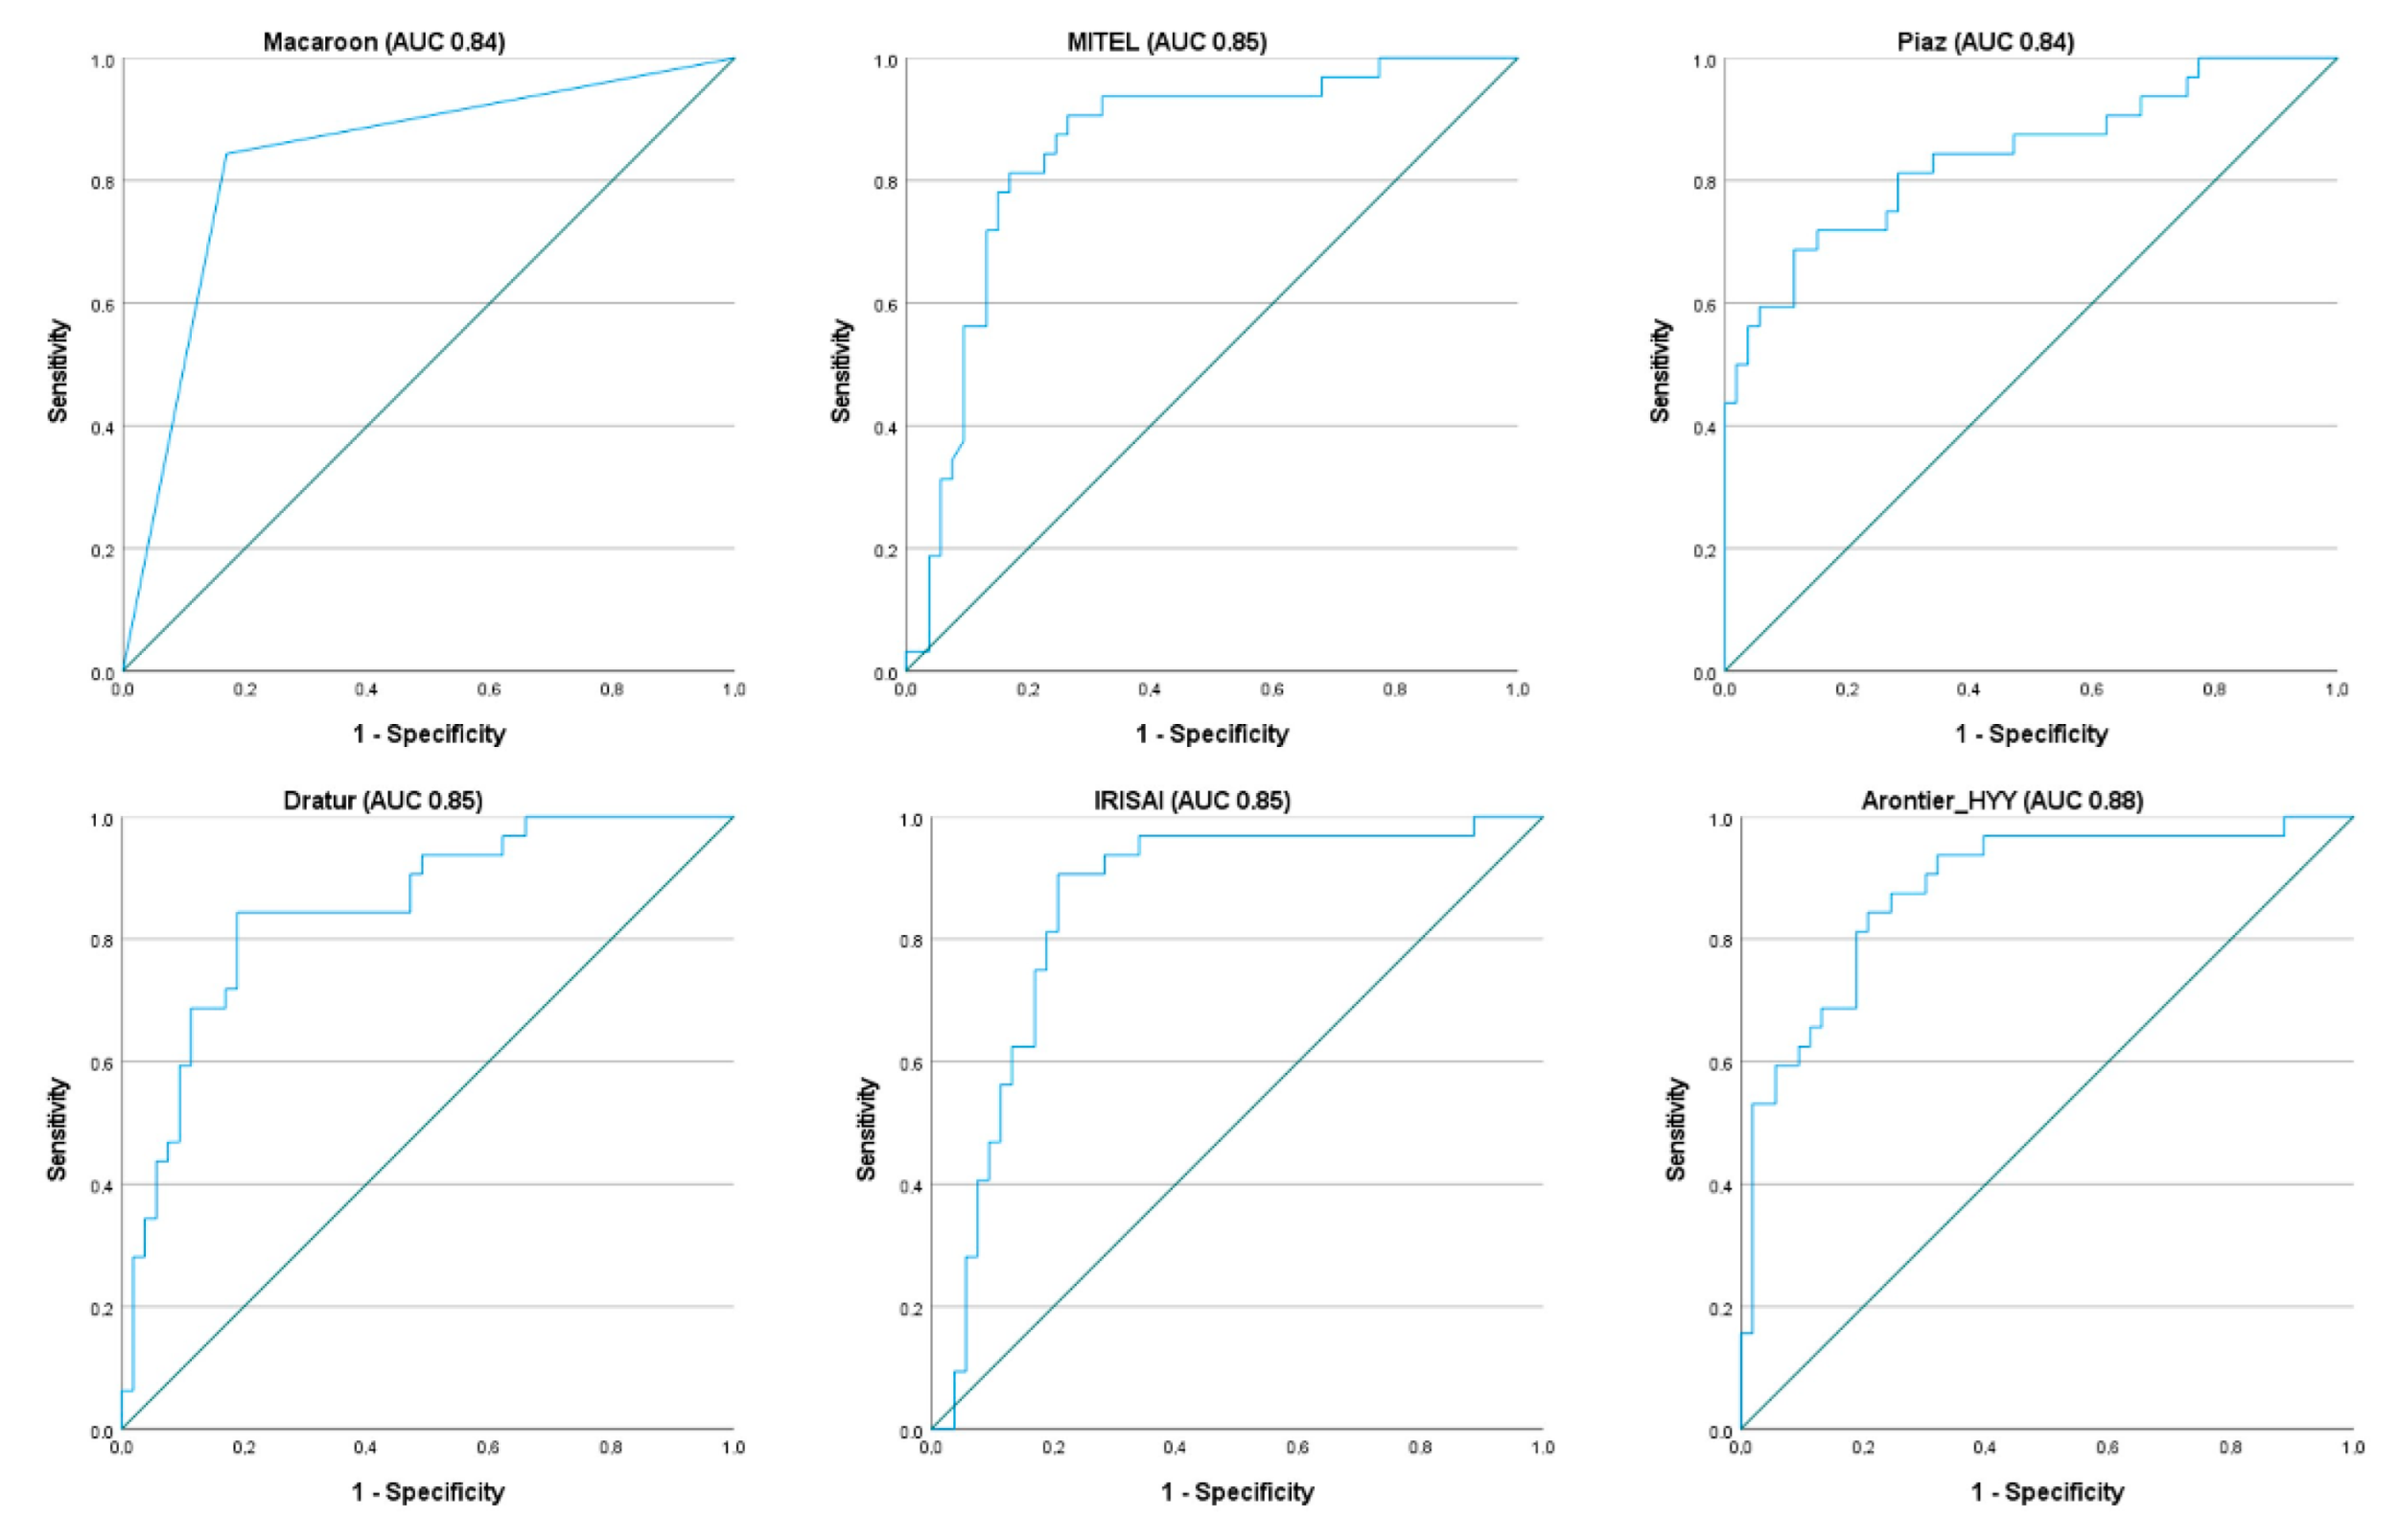
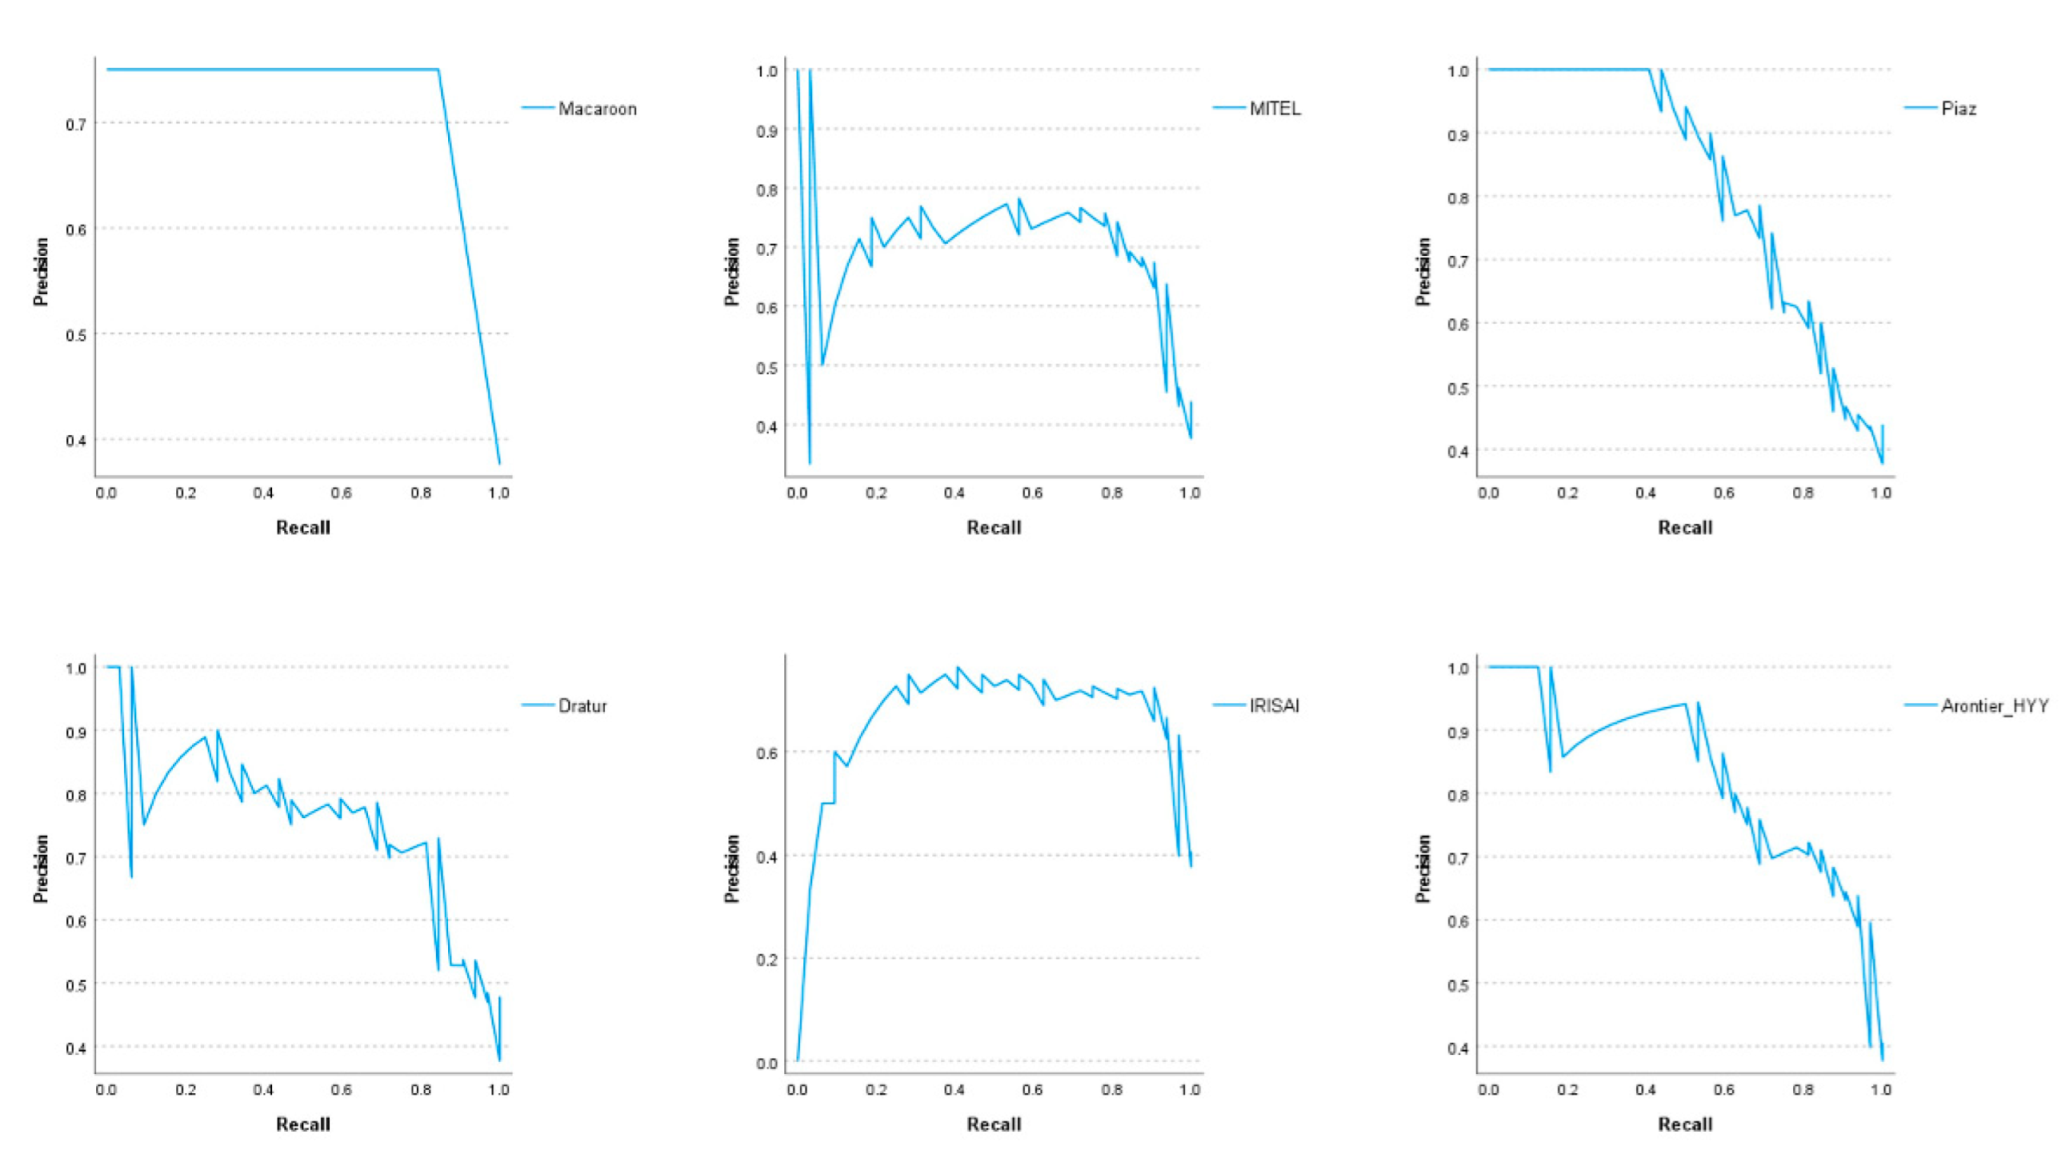
3. Results
4. Discussion
5. Conclusions
Author Contributions
Funding
Institutional Review Board Statement
Informed Consent Statement
Data Availability Statement
Acknowledgments
Conflicts of Interest
References
- Sung, H.; Ferlay, J.; Siegel, R.L.; Laversanne, M.; Soerjomataram, I.; Jemal, A.; Bray, F. Global Cancer Statistics 2020: GLOBOCAN Estimates of Incidence and Mortality Worldwide for 36 Cancers in 185 Countries. CA Cancer J. Clin. 2021, 71, 209–249. [Google Scholar] [CrossRef]
- Creyten, D.; Flucke, U. WHO Classification of Tumours: Breast Tumours; International Agency for Research on Cancer (IARC): Lyon, France, 2020; Volume 2. [Google Scholar]
- Ellis, I.O.; Galea, M.; Broughton, N.; Locker, A.; Blamey, R.W.; Elston, C.W. Pathological prognostic factors in breast cancer. II. Histological type. Relationship with survival in a large study with long-term follow-up. Histopathology 1992, 20, 479–489. [Google Scholar] [CrossRef] [PubMed]
- Elston, C.W.; Ellis, I.O. Pathological prognostic factors in breast cancer. I. The value of histological grade in breast cancer: Experience from a large study with long-term follow-up. Histopathology 1991, 19, 403–410. [Google Scholar] [CrossRef] [PubMed]
- Galea, M.H.; Blamey, R.W.; Elston, C.E.; Ellis, I.O. The Nottingham Prognostic Index in primary breast cancer. Breast Cancer Res. Treat. 1992, 22, 207–219. [Google Scholar] [CrossRef] [PubMed]
- Allison, K.H.; Hammond, M.E.H.; Dowsett, M.; McKernin, S.E.; Carey, L.A.; Fitzgibbons, P.L.; Hayes, D.F.; Lakhani, S.R.; Chavez-MacGregor, M.; Perlmutter, J.; et al. Estrogen and Progesterone Receptor Testing in Breast Cancer: American Society of Clinical Oncology/College of American Pathologists Guideline Update. Arch. Pathol. Lab. Med. 2020, 144, 545–563. [Google Scholar] [CrossRef] [PubMed] [Green Version]
- Wolff, A.C.; Hammond, M.E.H.; Allison, K.H.; Harvey, B.E.; Mangu, P.B.; Bartlett, J.M.S.; Bilous, M.; Ellis, I.O.; Fitzgibbons, P.; Hanna, W.; et al. Human Epidermal Growth Factor Receptor 2 Testing in Breast Cancer: American Society of Clinical Oncology/College of American Pathologists Clinical Practice Guideline Focused Update. Arch. Pathol. Lab. Med. 2018, 142, 1364–1382. [Google Scholar] [CrossRef] [Green Version]
- Slamon, D.J.; Leyland-Jones, B.; Shak, S.; Fuchs, H.; Paton, V.; Bajamonde, A.; Fleming, T.; Eiermann, W.; Wolter, J.; Pegram, M.; et al. Use of chemotherapy plus a monoclonal antibody against HER2 for metastatic breast cancer that overexpresses HER2. N. Engl. J. Med. 2001, 344, 783–792. [Google Scholar] [CrossRef]
- Vogel, C.L.; Cobleigh, M.A.; Tripathy, D.; Gutheil, J.C.; Harris, L.N.; Fehrenbacher, L.; Slamon, D.J.; Murphy, M.; Novotny, W.F.; Burchmore, M.; et al. Efficacy and safety of trastuzumab as a single agent in first-line treatment of HER2-overexpressing metastatic breast cancer. J. Clin. Oncol. 2002, 20, 719–726. [Google Scholar] [CrossRef]
- Piccart-Gebhart, M.J.; Procter, M.; Leyland-Jones, B.; Goldhirsch, A.; Untch, M.; Smith, I.; Gianni, L.; Baselga, J.; Bell, R.; Jackisch, C.; et al. Trastuzumab after adjuvant chemotherapy in HER2-positive breast cancer. N. Engl. J. Med. 2005, 353, 1659–1672. [Google Scholar] [CrossRef] [Green Version]
- Hariri, N.; Zare, S.; Murphy, J.; Fadare, O. Cost-effectiveness of a Dual (Immunohistochemistry and Fluorescence In Situ Hybridization) HER2/neu Testing Strategy on Invasive Breast Cancers. Appl. Immunohistochem. Mol. Morphol. 2020, 29, 42–48. [Google Scholar] [CrossRef]
- Araujo, A.L.D.; Arboleda, L.P.A.; Palmier, N.R.; Fonseca, J.M.; de Pauli Paglioni, M.; Gomes-Silva, W.; Ribeiro, A.C.P.; Brandao, T.B.; Simonato, L.E.; Speight, P.M.; et al. The performance of digital microscopy for primary diagnosis in human pathology: A systematic review. Virchows Arch. 2019, 474, 269–287. [Google Scholar] [CrossRef] [PubMed]
- Hartman, D.J.; Pantanowitz, L.; McHugh, J.S.; Piccoli, A.L.; MJ, O.L.; Lauro, G.R. Enterprise Implementation of Digital Pathology: Feasibility, Challenges, and Opportunities. J. Digit. Imaging 2017, 30, 555–560. [Google Scholar] [CrossRef] [PubMed]
- Litjens, G.; Sanchez, C.I.; Timofeeva, N.; Hermsen, M.; Nagtegaal, I.; Kovacs, I.; Hulsbergen-van de Kaa, C.; Bult, P.; van Ginneken, B.; van der Laak, J. Deep learning as a tool for increased accuracy and efficiency of histopathological diagnosis. Sci. Rep. 2016, 6, 26286. [Google Scholar] [CrossRef] [PubMed] [Green Version]
- Polonia, A.; Campelos, S.; Ribeiro, A.; Aymore, I.; Pinto, D.; Biskup-Fruzynska, M.; Veiga, R.S.; Canas-Marques, R.; Aresta, G.; Araujo, T.; et al. Artificial Intelligence Improves the Accuracy in Histologic Classification of Breast Lesions. Am. J. Clin. Pathol. 2021, 155, 527–536. [Google Scholar] [CrossRef] [PubMed]
- Harrison, J.H.; Gilbertson, J.R.; Hanna, M.G.; Olson, N.H.; Seheult, J.N.; Sorace, J.M.; Stram, M.N. Introduction to Artificial Intelligence and Machine Learning for Pathology. Arch. Pathol. Lab. Med. 2021, 145, 1228–1254. [Google Scholar] [CrossRef] [PubMed]
- Araújo, T.; Aresta, G.; Castro, E.; Rouco, J.; Aguiar, P.; Eloy, C.; Polónia, A.; Campilho, A. Classification of breast cancer histology images using Convolutional Neural Networks. PLoS ONE 2017, 12, e0177544. [Google Scholar] [CrossRef] [PubMed]
- Aresta, G.; Araujo, T.; Kwok, S.; Chennamsetty, S.S.; Safwan, M.; Alex, V.; Marami, B.; Prastawa, M.; Chan, M.; Donovan, M.; et al. BACH: Grand challenge on breast cancer histology images. Med. Image Anal. 2019, 56, 122–139. [Google Scholar] [CrossRef] [PubMed]
- Ehteshami Bejnordi, B.; Veta, M.; Johannes van Diest, P.; van Ginneken, B.; Karssemeijer, N.; Litjens, G.; van der Laak, J.; The CAMELYON16 Consortium. Diagnostic Assessment of Deep Learning Algorithms for Detection of Lymph Node Metastases in Women With Breast Cancer. JAMA 2017, 318, 2199–2210. [Google Scholar] [CrossRef]
- Litjens, G.; Bandi, P.; Ehteshami Bejnordi, B.; Geessink, O.; Balkenhol, M.; Bult, P.; Halilovic, A.; Hermsen, M.; van de Loo, R.; Vogels, R.; et al. 1399 H&E-stained sentinel lymph node sections of breast cancer patients: The CAMELYON dataset. Gigascience 2018, 7, giy065. [Google Scholar] [CrossRef]
- Ciresan, D.C.; Giusti, A.; Gambardella, L.M.; Schmidhuber, J. Mitosis detection in breast cancer histology images with deep neural networks. Med. Image Comput. Comput. Assist. Interv. 2013, 16, 411–418. [Google Scholar] [CrossRef] [Green Version]
- Kowal, M.; Filipczuk, P.; Obuchowicz, A.; Korbicz, J.; Monczak, R. Computer-aided diagnosis of breast cancer based on fine needle biopsy microscopic images. Comput. Biol. Med. 2013, 43, 1563–1572. [Google Scholar] [CrossRef] [PubMed]
- George, Y.M.; Zayed, H.H.; Roushdy, M.I.; Elbagoury, B.M. Remote Computer-Aided Breast Cancer Detection and Diagnosis System Based on Cytological Images. IEEE Syst. J. 2014, 8, 949–964. [Google Scholar] [CrossRef]
- Zhang, B. Breast Cancer Diagnosis from Biopsy Images by Serial Fusion of Random Subspace Ensembles. In Proceedings of the 2011 4th International Conference on Biomedical Engineering and Informatics (BMEI), Shanghai, China, 15–17 October 2011; pp. 180–186. [Google Scholar]
- Fondon, I.; Sarmiento, A.; Garcia, A.I.; Silvestre, M.; Eloy, C.; Polonia, A.; Aguiar, P. Automatic classification of tissue malignancy for breast carcinoma diagnosis. Comput. Biol. Med. 2018, 96, 41–51. [Google Scholar] [CrossRef] [PubMed]
- Hofener, H.; Homeyer, A.; Forster, M.; Drieschner, N.; Schildhaus, H.U.; Hahn, H.K. Automated density-based counting of FISH amplification signals for HER2 status assessment. Comput. Methods Programs Biomed. 2019, 173, 77–85. [Google Scholar] [CrossRef] [PubMed]
- Vandenberghe, M.E.; Scott, M.L.; Scorer, P.W.; Soderberg, M.; Balcerzak, D.; Barker, C. Relevance of deep learning to facilitate the diagnosis of HER2 status in breast cancer. Sci. Rep. 2017, 7, 45938. [Google Scholar] [CrossRef] [PubMed] [Green Version]
- Khameneh, F.D.; Razavi, S.; Kamasak, M. Automated segmentation of cell membranes to evaluate HER2 status in whole slide images using a modified deep learning network. Comput. Biol. Med. 2019, 110, 164–174. [Google Scholar] [CrossRef]
- Qaiser, T.; Mukherjee, A.; Reddy Pb, C.; Munugoti, S.D.; Tallam, V.; Pitkäaho, T.; Lehtimäki, T.; Naughton, T.; Berseth, M.; Pedraza, A.; et al. HER2 challenge contest: A detailed assessment of automated HER2 scoring algorithms in whole slide images of breast cancer tissues. Histopathology 2018, 72, 227–238. [Google Scholar] [CrossRef] [PubMed] [Green Version]
- Couture, H.D.; Williams, L.A.; Geradts, J.; Nyante, S.J.; Butler, E.N.; Marron, J.S.; Perou, C.M.; Troester, M.A.; Niethammer, M. Image analysis with deep learning to predict breast cancer grade, ER status, histologic subtype, and intrinsic subtype. NPJ Breast Cancer 2018, 4, 30. [Google Scholar] [CrossRef] [PubMed] [Green Version]
- Shamai, G.; Binenbaum, Y.; Slossberg, R.; Duek, I.; Gil, Z.; Kimmel, R. Artificial Intelligence Algorithms to Assess Hormonal Status From Tissue Microarrays in Patients With Breast Cancer. JAMA Netw. Open 2019, 2, e197700. [Google Scholar] [CrossRef]
- He, K.; Zhang, X.; Ren, S.; Sun, J. Deep Residual Learning for Image Recognition. In Proceedings of the 2016 IEEE Conference on Computer Vision and Pattern Recognition (CVPR), Las Vegas, NV, USA, 27–30 June 2016; pp. 770–778. [Google Scholar]
- Naik, N.; Madani, A.; Esteva, A.; Keskar, N.S.; Press, M.F.; Ruderman, D.; Agus, D.B.; Socher, R. Deep learning-enabled breast cancer hormonal receptor status determination from base-level H&E stains. Nat. Commun. 2020, 11, 5727. [Google Scholar] [CrossRef]
- Kather, J.N.; Heij, L.R.; Grabsch, H.I.; Loeffler, C.; Echle, A.; Muti, H.S.; Krause, J.; Niehues, J.M.; Sommer, K.A.J.; Bankhead, P.; et al. Pan-cancer image-based detection of clinically actionable genetic alterations. Nat. Cancer 2020, 1, 789–799. [Google Scholar] [CrossRef] [PubMed]
- Zhang, X.; Zhou, X.; Lin, M.; Sun, J. Shufflenet: An extremely efficient convolutional neural network for mobile devices. In Proceedings of the IEEE Conference on Computer Vision and Pattern Recognition, Salt Lake City, UT, USA, 18–23 June 2018; pp. 6848–6856. [Google Scholar]
- Farahmand, S.; Fernandez, A.I.; Ahmed, F.S.; Rimm, D.L.; Chuang, J.H.; Reisenbichler, E.; Zarringhalam, K. Deep learning trained on hematoxylin and eosin tumor region of Interest predicts HER2 status and trastuzumab treatment response in HER2+breast cancer. Modern Pathol. 2022, 35, 44–51. [Google Scholar] [CrossRef] [PubMed]
- Jackson, C.R.; Sriharan, A.; Vaickus, L.J. A machine learning algorithm for simulating immunohistochemistry: Development of SOX10 virtual IHC and evaluation on primarily melanocytic neoplasms. Mod. Pathol. 2020, 33, 1638–1648. [Google Scholar] [CrossRef] [PubMed]
- Lahiani, A.; Klaman, I.; Navab, N.; Albarqouni, S.; Klaiman, E. Seamless Virtual Whole Slide Image Synthesis and Validation Using Perceptual Embedding Consistency. IEEE J. Biomed. Health Inform. 2021, 25, 403–411. [Google Scholar] [CrossRef]
- Xu, Z.; Moro, C.F.; Bozóky, B.; Zhang, Q. GAN-based virtual re-staining: A promising solution for whole slide image analysis. arXiv 2019, arXiv:1901.04059, preprint. [Google Scholar]
- Fawcett, T. An introduction to ROC analysis. Pattern Recognit. Lett. 2006, 27, 861–874. [Google Scholar] [CrossRef]
- Tian, Y.; Yang, L.; Wang, W.; Zhang, J.; Tang, Q.; Ji, M.; Yu, Y.; Li, Y.; Yang, H.; Qian, A. Computer-aided Detection of Squamous Carcinoma of the Cervix in Whole Slide Images. arXiv 2019, arXiv:1905.10959. [Google Scholar]
- La Barbera, D.; Polónia, A.; Roitero, K.; Conde-Sousa, E.; Della Mea, V. Detection of HER2 from Haematoxylin-Eosin Slides Through a Cascade of Deep Learning Classifiers via Multi-Instance Learning. J. Imaging 2020, 6, 82. [Google Scholar] [CrossRef]
- Huang, G.; Liu, Z.; Van Der Maaten, L.; Weinberger, K.Q. Densely Connected Convolutional Networks. In Proceedings of the IEEE conference on computer vision and pattern recognition, Honolulu, HI, USA, 21–26 July 2017; pp. 2261–2269. [Google Scholar]
- Deng, J.; Dong, W.; Socher, R.; Li, L.; Kai, L.; Li, F.-F. ImageNet: A large-scale hierarchical image database. In Proceedings of the 2009 IEEE Conference on Computer Vision and Pattern Recognition, Miami, FL, USA, 20–25 June 2009; pp. 248–255. [Google Scholar]
- Glasbey, C.A. An Analysis of Histogram-Based Thresholding Algorithms. CVGIP Graph. Models Image Process. 1993, 55, 532–537. [Google Scholar] [CrossRef]
- Tan, M.; Le, Q. EfficientNet: Rethinking Model Scaling for Convolutional Neural Networks. In Proceedings of the 36th International Conference on Machine Learning, Proceedings of Machine Learning Research, Long Beach, CA, USA, 9–15 June 2019; pp. 6105–6114. [Google Scholar]
- Ronneberger, O.; Fischer, P.; Brox, T. U-Net: Convolutional Networks for Biomedical Image Segmentation; Springer: Cham, Switzerland, 2015; pp. 234–241. [Google Scholar]
- Bankhead, P.; Loughrey, M.B.; Fernandez, J.A.; Dombrowski, Y.; McArt, D.G.; Dunne, P.D.; McQuaid, S.; Gray, R.T.; Murray, L.J.; Coleman, H.G.; et al. QuPath: Open source software for digital pathology image analysis. Sci. Rep. 2017, 7, 16878. [Google Scholar] [CrossRef] [Green Version]
- Campanella, G.; Hanna, M.G.; Geneslaw, L.; Miraflor, A.; Werneck Krauss Silva, V.; Busam, K.J.; Brogi, E.; Reuter, V.E.; Klimstra, D.S.; Fuchs, T.J. Clinical-grade computational pathology using weakly supervised deep learning on whole slide images. Nat. Med. 2019, 25, 1301–1309. [Google Scholar] [CrossRef]
- Krizhevsky, A. Learning Multiple Layers of Features from Tiny Images; University of Toronto: Toronto, Canada, 2012. [Google Scholar]
- Xie, S.; Girshick, R.; Dollár, P.; Tu, Z.; He, K. Aggregated residual transformations for deep neural networks. In Proceedings of the IEEE conference on computer vision and pattern recognition, Honolulu, HI, USA, 21–26 July 2017; pp. 1492–1500. [Google Scholar]
- Chollet, F. Xception: Deep learning with depthwise separable convolutions. In Proceedings of the IEEE conference on computer vision and pattern recognition, Honolulu, HI, USA, 21–26 July 2017; pp. 1251–1258. [Google Scholar]
- Krystel-Whittemore, M.; Xu, J.; Brogi, E.; Ventura, K.; Patil, S.; Ross, D.S.; Dang, C.; Robson, M.; Norton, L.; Morrow, M.; et al. Pathologic complete response rate according to HER2 detection methods in HER2-positive breast cancer treated with neoadjuvant systemic therapy. Breast Cancer Res. Treat. 2019, 177, 61–66. [Google Scholar] [CrossRef] [PubMed]
- Zhao, J.; Krishnamurti, U.; Zhang, C.; Meisel, J.; Wei, Z.; Suo, A.; Aneja, R.; Li, Z.; Li, X. HER2 immunohistochemistry staining positivity is strongly predictive of tumor response to neoadjuvant chemotherapy in HER2 positive breast cancer. Pathol. Res. Pract. 2020, 216, 153155. [Google Scholar] [CrossRef] [PubMed]
- Katayama, A.; Miligy, I.M.; Shiino, S.; Toss, M.S.; Eldib, K.; Kurozumi, S.; Quinn, C.M.; Badr, N.; Murray, C.; Provenzano, E.; et al. Predictors of pathological complete response to neoadjuvant treatment and changes to post-neoadjuvant HER2 status in HER2-positive invasive breast cancer. Mod. Pathol. 2021, 34, 1271–1281. [Google Scholar] [CrossRef] [PubMed]
- Polonia, A.; Canelas, C.; Caramelo, A. The spectrum of HER2 expression in breast cancer: Linking immunohistochemistry quantification with in situ hybridization assay. Virchows Arch. 2022, 480, 1171–1179. [Google Scholar] [CrossRef] [PubMed]
- Lee, H.J.; Kim, J.Y.; Park, I.A.; Song, I.H.; Yu, J.H.; Ahn, J.H.; Gong, G. Prognostic Significance of Tumor-Infiltrating Lymphocytes and the Tertiary Lymphoid Structures in HER2-Positive Breast Cancer Treated With Adjuvant Trastuzumab. Am. J. Clin. Pathol. 2015, 144, 278–288. [Google Scholar] [CrossRef] [Green Version]
- Salgado, R.; Denkert, C.; Campbell, C.; Savas, P.; Nuciforo, P.; Aura, C.; de Azambuja, E.; Eidtmann, H.; Ellis, C.E.; Baselga, J.; et al. Tumor-Infiltrating Lymphocytes and Associations With Pathological Complete Response and Event-Free Survival in HER2-Positive Early-Stage Breast Cancer Treated With Lapatinib and Trastuzumab: A Secondary Analysis of the NeoALTTO Trial. JAMA Oncol. 2015, 1, 448–454. [Google Scholar] [CrossRef]
- Harris, L.N.; Ismaila, N.; McShane, L.M.; Andre, F.; Collyar, D.E.; Gonzalez-Angulo, A.M.; Hammond, E.H.; Kuderer, N.M.; Liu, M.C.; Mennel, R.G.; et al. Use of Biomarkers to Guide Decisions on Adjuvant Systemic Therapy for Women With Early-Stage Invasive Breast Cancer: American Society of Clinical Oncology Clinical Practice Guideline. J. Clin. Oncol. 2016, 34, 1134–1150. [Google Scholar] [CrossRef] [Green Version]
- Krop, I.; Ismaila, N.; Andre, F.; Bast, R.C.; Barlow, W.; Collyar, D.E.; Hammond, M.E.; Kuderer, N.M.; Liu, M.C.; Mennel, R.G.; et al. Use of Biomarkers to Guide Decisions on Adjuvant Systemic Therapy for Women With Early-Stage Invasive Breast Cancer: American Society of Clinical Oncology Clinical Practice Guideline Focused Update. J. Clin. Oncol. 2017, 35, 2838–2847. [Google Scholar] [CrossRef]
- Whitney, J.; Corredor, G.; Janowczyk, A.; Ganesan, S.; Doyle, S.; Tomaszewski, J.; Feldman, M.; Gilmore, H.; Madabhushi, A. Quantitative nuclear histomorphometry predicts oncotype DX risk categories for early stage ER+ breast cancer. BMC Cancer 2018, 18, 610. [Google Scholar] [CrossRef] [PubMed] [Green Version]
- Yang, J.; Ju, J.; Guo, L.; Ji, B.; Shi, S.; Yang, Z.; Gao, S.; Yuan, X.; Tian, G.; Liang, Y.; et al. Prediction of HER2-positive breast cancer recurrence and metastasis risk from histopathological images and clinical information via multimodal deep learning. Comput. Struct. Biotechnol. J. 2022, 20, 333–342. [Google Scholar] [CrossRef] [PubMed]
- Joshi, G.; Walambe, R.; Kotecha, K. A Review on Explainability in Multimodal Deep Neural Nets. IEEE Access 2021, 9, 59800–59821. [Google Scholar] [CrossRef]
- Adadi, A.; Berrada, M. Peeking Inside the Black-Box: A Survey on Explainable Artificial Intelligence (XAI). IEEE Access 2018, 6, 52138–52160. [Google Scholar] [CrossRef]
- Polonia, A.; Caramelo, A. HER2 in situ hybridization test in breast cancer: Quantifying margins of error and genetic heterogeneity. Mod. Pathol. 2021, 34, 1478–1486. [Google Scholar] [CrossRef] [PubMed]


| IHC Score | HER2-Negative | HER2-Positive | Total |
|---|---|---|---|
| 0 | 43 (12%) | 0 (0%) | 43 (12%) |
| 1+ | 46 (13%) | 1 (0%) | 47 (13%) |
| 2+ | 126 (35%) | 104 (29%) | 230 (64%) |
| 3+ | 0 (0%) | 39 (11%) | 39 (11%) |
| Total | 215 (60%) | 144 (40%) | 359 (100%) |
| IHC Score | HER2-Negative | HER2-Positive | Total |
|---|---|---|---|
| 0 | 19 (13%) | 0 (0%) | 19 (13%) |
| 1+ | 18 (12%) | 0 (0%) | 18 (12%) |
| 2+ | 53 (35%) | 32 (21%) | 85 (57%) |
| 3+ | 0 (0%) | 27 (18%) | 27 (18%) |
| Not Tested | 0 (0%) | 1 (1%) | 1 (1%) |
| Total | 90 (60%) | 60 (40%) | 150 (100%) |
| Rank | Team | AUC | Precision | Recall | F1 Score |
|---|---|---|---|---|---|
| 1 | Macaroon | 0.71 | 0.57 | 0.83 | 0.68 |
| 2 | MITEL | 0.74 | 0.58 | 0.78 | 0.67 |
| 3 | Piaz | 0.84 | 0.77 | 0.55 | 0.64 |
| 4 | Dratur | 0.75 | 0.57 | 0.70 | 0.63 |
| 5 | IRISAI | 0.67 | 0.58 | 0.67 | 0.62 |
| 6 | Arontier_HYY | 0.72 | 0.52 | 0.73 | 0.61 |
| 7 | KDE | 0.62 | 0.51 | 0.75 | 0.61 |
| 8 | joangibert14 | 0.66 | 0.48 | 0.78 | 0.60 |
| 9 | VISILAB | 0.63 | 0.51 | 0.73 | 0.60 |
| 10 | MIRL | 0.50 | 0.40 | 1.00 | 0.57 |
| 11 | aetherAI | 0.66 | 0.49 | 0.67 | 0.57 |
| 12 | NCIC | 0.63 | 0.52 | 0.62 | 0.56 |
| 13 | biocenas | 0.57 | 0.46 | 0.53 | 0.50 |
| 14 | HEROH | 0.59 | 0.46 | 0.53 | 0.49 |
| 15 | Reza Mohebbian | 0.61 | 0.51 | 0.43 | 0.47 |
| 16 | mindmork | 0.63 | 0.53 | 0.38 | 0.45 |
| 17 | Institute of Pathology Graz | 0.63 | 0.50 | 0.38 | 0.43 |
| 18 | katherandco | 0.44 | 0.44 | 0.40 | 0.42 |
| 19 | QUILL | 0.63 | 0.50 | 0.33 | 0.40 |
| 20 | HEROHE_Challenge | 0.48 | 0.37 | 0.27 | 0.31 |
| 21 | UC-CSSE | 0.47 | 0.31 | 0.27 | 0.29 |
| Rank | Team | Threshold | F1 Score |
|---|---|---|---|
| 1 | Piaz | 0.39 | 0.73 |
| 2 | MITEL | 0.37 | 0.7 |
| 3 | Dratur | 0.34 | 0.69 |
| 4 | irisai | 0.39 | 0.68 |
| 5 | Macaroon | 0.01 | 0.68 |
| 6 | Arontier_HYY | 0.17 | 0.66 |
| 7 | visilab | 0.1 | 0.65 |
| 8 | KDE | 0.26 | 0.63 |
| 9 | katherandco | 0.83 | 0.62 |
| 10 | QUILL | 0.23 | 0.62 |
| 11 | aetherAI | 0.17 | 0.6 |
| 12 | HEROH | 0.12 | 0.6 |
| 13 | joangibert14 | 0.5 | 0.6 |
| 14 | biocenas | 0.23 | 0.59 |
| 15 | Institute_of_Pathology_Graz | 0.42 | 0.59 |
| 16 | mindmork | 0.07 | 0.59 |
| 17 | NCIC | 0.49 | 0.59 |
| 18 | Reza_Mohebbian | 0.01 | 0.58 |
| 19 | uc_csse | 0.02 | 0.58 |
| 20 | HEROHE_Challenge | 0 | 0.57 |
| 21 | MIRL | 0 | 0.57 |
| Team | AUC | Precision | Recall | F1 Score |
|---|---|---|---|---|
| Macaroon | 0.84 | 0.75 | 0.84 | 0.79 |
| Arontier_HYY | 0.88 | 0.67 | 0.81 | 0.73 |
| MITEL | 0.85 | 0.74 | 0.72 | 0.73 |
| Dratur | 0.85 | 0.71 | 0.75 | 0.73 |
| IRISAI | 0.85 | 0.72 | 0.72 | 0.72 |
| KDE | 0.77 | 0.67 | 0.75 | 0.71 |
| Piaz | 0.84 | 0.79 | 0.59 | 0.68 |
| VISILAB | 0.77 | 0.64 | 0.66 | 0.65 |
| NCIC | 0.70 | 0.58 | 0.69 | 0.63 |
| Biocenas | 0.71 | 0.61 | 0.63 | 0.62 |
| AetherAI | 0.77 | 0.53 | 0.72 | 0.61 |
| QUILL | 0.78 | 0.79 | 0.47 | 0.59 |
| Joangibert14 | 0.70 | 0.46 | 0.72 | 0.56 |
| MIRL | 0.50 | 0.38 | 1.00 | 0.55 |
| Reza Mohebbian | 0.64 | 0.52 | 0.47 | 0.49 |
| Institute of Pathology Graz | 0.70 | 0.50 | 0.47 | 0.48 |
| HEROH | 0.63 | 0.46 | 0.50 | 0.48 |
| Mindmork | 0.61 | 0.43 | 0.31 | 0.36 |
| Katherandco | 0.32 | 0.67 | 0.25 | 0.36 |
| UC-CSSE | 0.61 | 0.42 | 0.31 | 0.36 |
| HEROHE_Challenge | 0.50 | 0.37 | 0.22 | 0.27 |
| Rank | Team | Approach | Pre-Trained | Ensemble | External Sets | Input Size |
|---|---|---|---|---|---|---|
| 1 | Macaroon | ResNet34 | yes | 2 | CAMELYON16 | 256 × 256 |
| 2 | MITEL | DenseNet201 + ResNet152 | yes | 2 | ImageNet + BACH | 512 × 512 |
| 3 | Piaz | EfficientNetB0 | yes | x | BACH | 222 × 222 |
| 4 | Dratur | EfficientNetB2 + EfficientNetB4 + Custom dense model | yes | 5 | ImageNet | 256 × 256 |
| 5 | IRISAI | U-Net + ResNet50 | no + yes | 2 | ImageNet | 256 × 256 |
| 6 | Arontier_HYY | EfficientNetB1 + EfficientNetB3 + EfficientNetB5 + LSTM | no | 4 | x | 1024 × 1024 + 480 × 840 + 912 × 912 |
| 7 | KDE | Custom + InceptionV3 | no | 3 | x | 128 × 128 |
| 8 | joangibert14 | ResNet101 | yes | x | [49] | 224 × 224 |
| 9 | VISILAB | SE-ResNet50 | no | x | x | 299 × 299 |
| 10 | MIRL | DenseNet201 | yes | x | ImageNet | 9192 × 9192 |
| 11 | aetherAI | Custom based on ResNet 50 v2 | no | x | x | WSI re-scaled to 10,000 × 10,000 |
| 12 | NCIC | ResNet101 + ResNet50 [51] | yes | 2 | ImageNet | 1024 × 1024 |
| 13 | biocenas | Custom CNN model | no | 3 | x | 32 × 32 |
| 14 | HEROH | ResNet18 + ResNet50 | yes | 2 | ImageNet | 128 × 128 |
| 15 | Reza Mohebbian | Custom (non-Deep Learning) | no | x | x | WSI |
| 16 | mindmork | Kmeans + U-Net + Xception [52] | no | 3 | x | 256 × 256 |
| 17 | Institute of Pathology Graz | QuPath for color deconvolution and feature extractor + Custom CNN | no | 2 | x | WSI |
| 18 | katherandco | QuPath for tumor segmentation + ResNet50 | no | x | ImageNet | 512 × 512 |
| 19 | QUILL | SuperPixel patch splitting + DenseNet + Mean Shift Clustering | no | 2 | x | WSI |
| 20 | HEROHE_Challenge | Custom CNN + Kmeans + XGBoost | yes | 3 | CIFAR-10 dataset | 200 × 200 |
| 21 | UC-CSSE | Xception + DenseNet169 + ResNet34 + ResNet101 + random forest + extra trees + gradient boosting | yes | 7 | CAMELYON16 + Data Science Bowl 2018 | 299 × 299 |
Publisher’s Note: MDPI stays neutral with regard to jurisdictional claims in published maps and institutional affiliations. |
© 2022 by the authors. Licensee MDPI, Basel, Switzerland. This article is an open access article distributed under the terms and conditions of the Creative Commons Attribution (CC BY) license (https://creativecommons.org/licenses/by/4.0/).
Share and Cite
Conde-Sousa, E.; Vale, J.; Feng, M.; Xu, K.; Wang, Y.; Della Mea, V.; La Barbera, D.; Montahaei, E.; Baghshah, M.; Turzynski, A.; et al. HEROHE Challenge: Predicting HER2 Status in Breast Cancer from Hematoxylin–Eosin Whole-Slide Imaging. J. Imaging 2022, 8, 213. https://doi.org/10.3390/jimaging8080213
Conde-Sousa E, Vale J, Feng M, Xu K, Wang Y, Della Mea V, La Barbera D, Montahaei E, Baghshah M, Turzynski A, et al. HEROHE Challenge: Predicting HER2 Status in Breast Cancer from Hematoxylin–Eosin Whole-Slide Imaging. Journal of Imaging. 2022; 8(8):213. https://doi.org/10.3390/jimaging8080213
Chicago/Turabian StyleConde-Sousa, Eduardo, João Vale, Ming Feng, Kele Xu, Yin Wang, Vincenzo Della Mea, David La Barbera, Ehsan Montahaei, Mahdieh Baghshah, Andreas Turzynski, and et al. 2022. "HEROHE Challenge: Predicting HER2 Status in Breast Cancer from Hematoxylin–Eosin Whole-Slide Imaging" Journal of Imaging 8, no. 8: 213. https://doi.org/10.3390/jimaging8080213
APA StyleConde-Sousa, E., Vale, J., Feng, M., Xu, K., Wang, Y., Della Mea, V., La Barbera, D., Montahaei, E., Baghshah, M., Turzynski, A., Gildenblat, J., Klaiman, E., Hong, Y., Aresta, G., Araújo, T., Aguiar, P., Eloy, C., & Polónia, A. (2022). HEROHE Challenge: Predicting HER2 Status in Breast Cancer from Hematoxylin–Eosin Whole-Slide Imaging. Journal of Imaging, 8(8), 213. https://doi.org/10.3390/jimaging8080213