
A Novel Deep-Learning-Based Framework for the Classification of Cardiac Arrhythmia


Abstract
:1. Introduction
2. Related Work
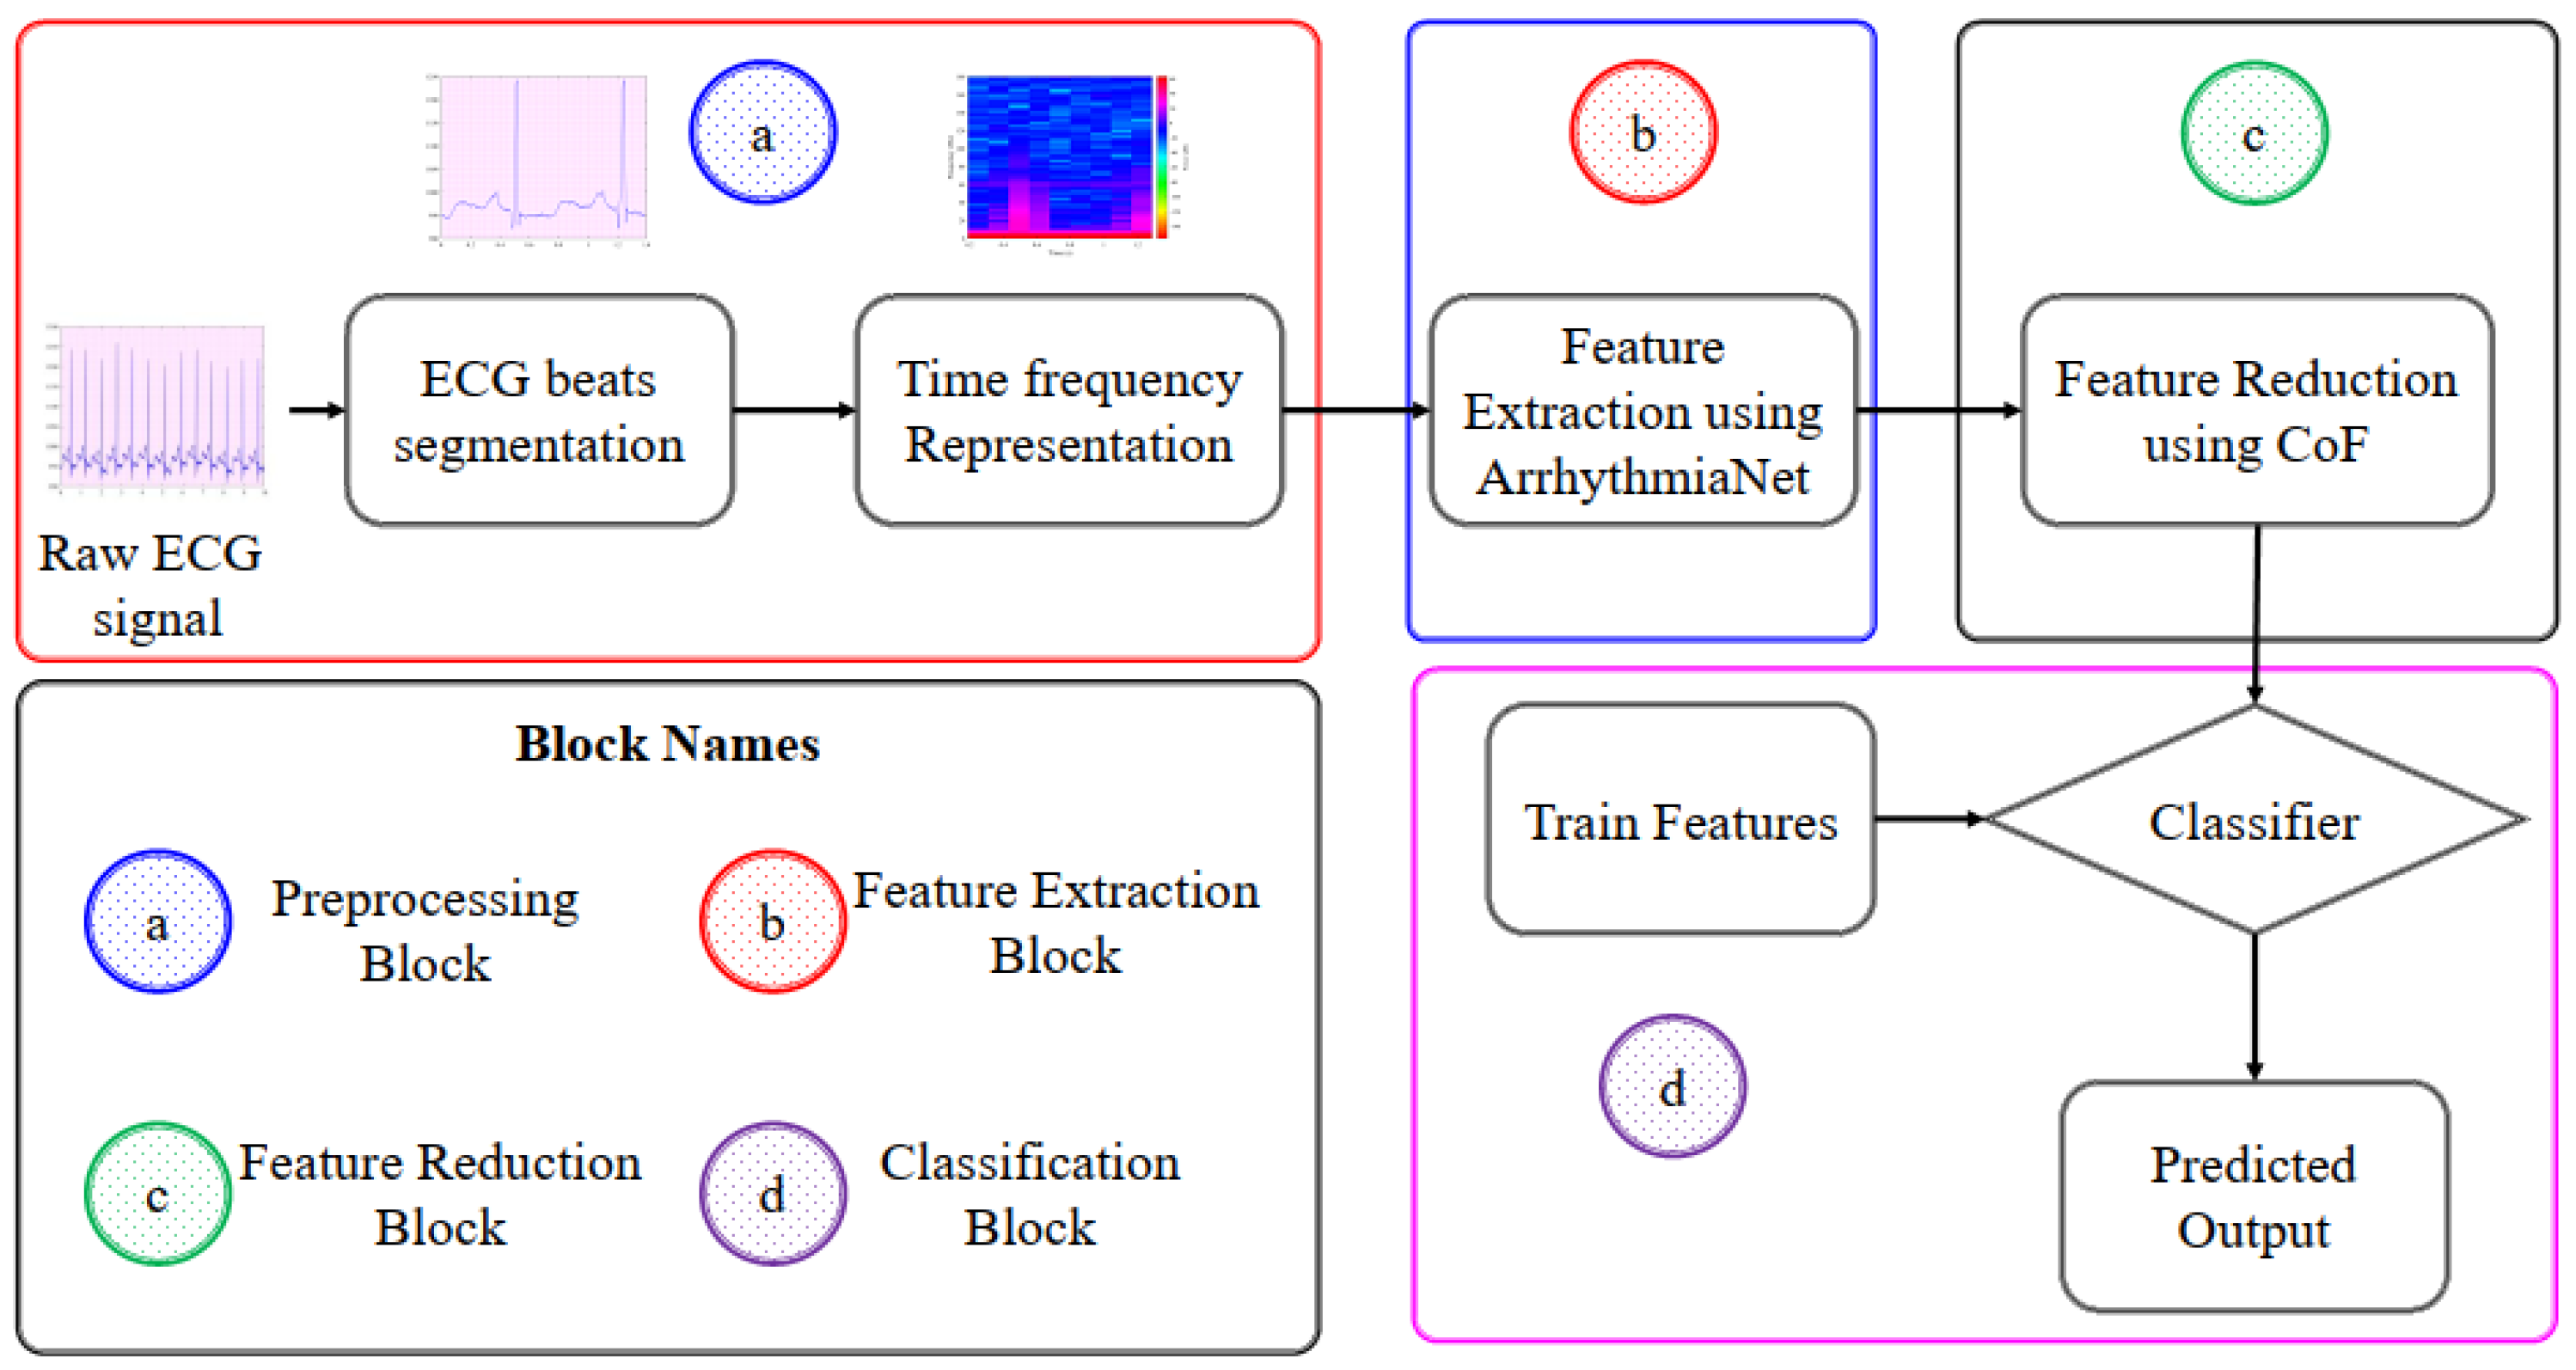
3. Proposed Methodology
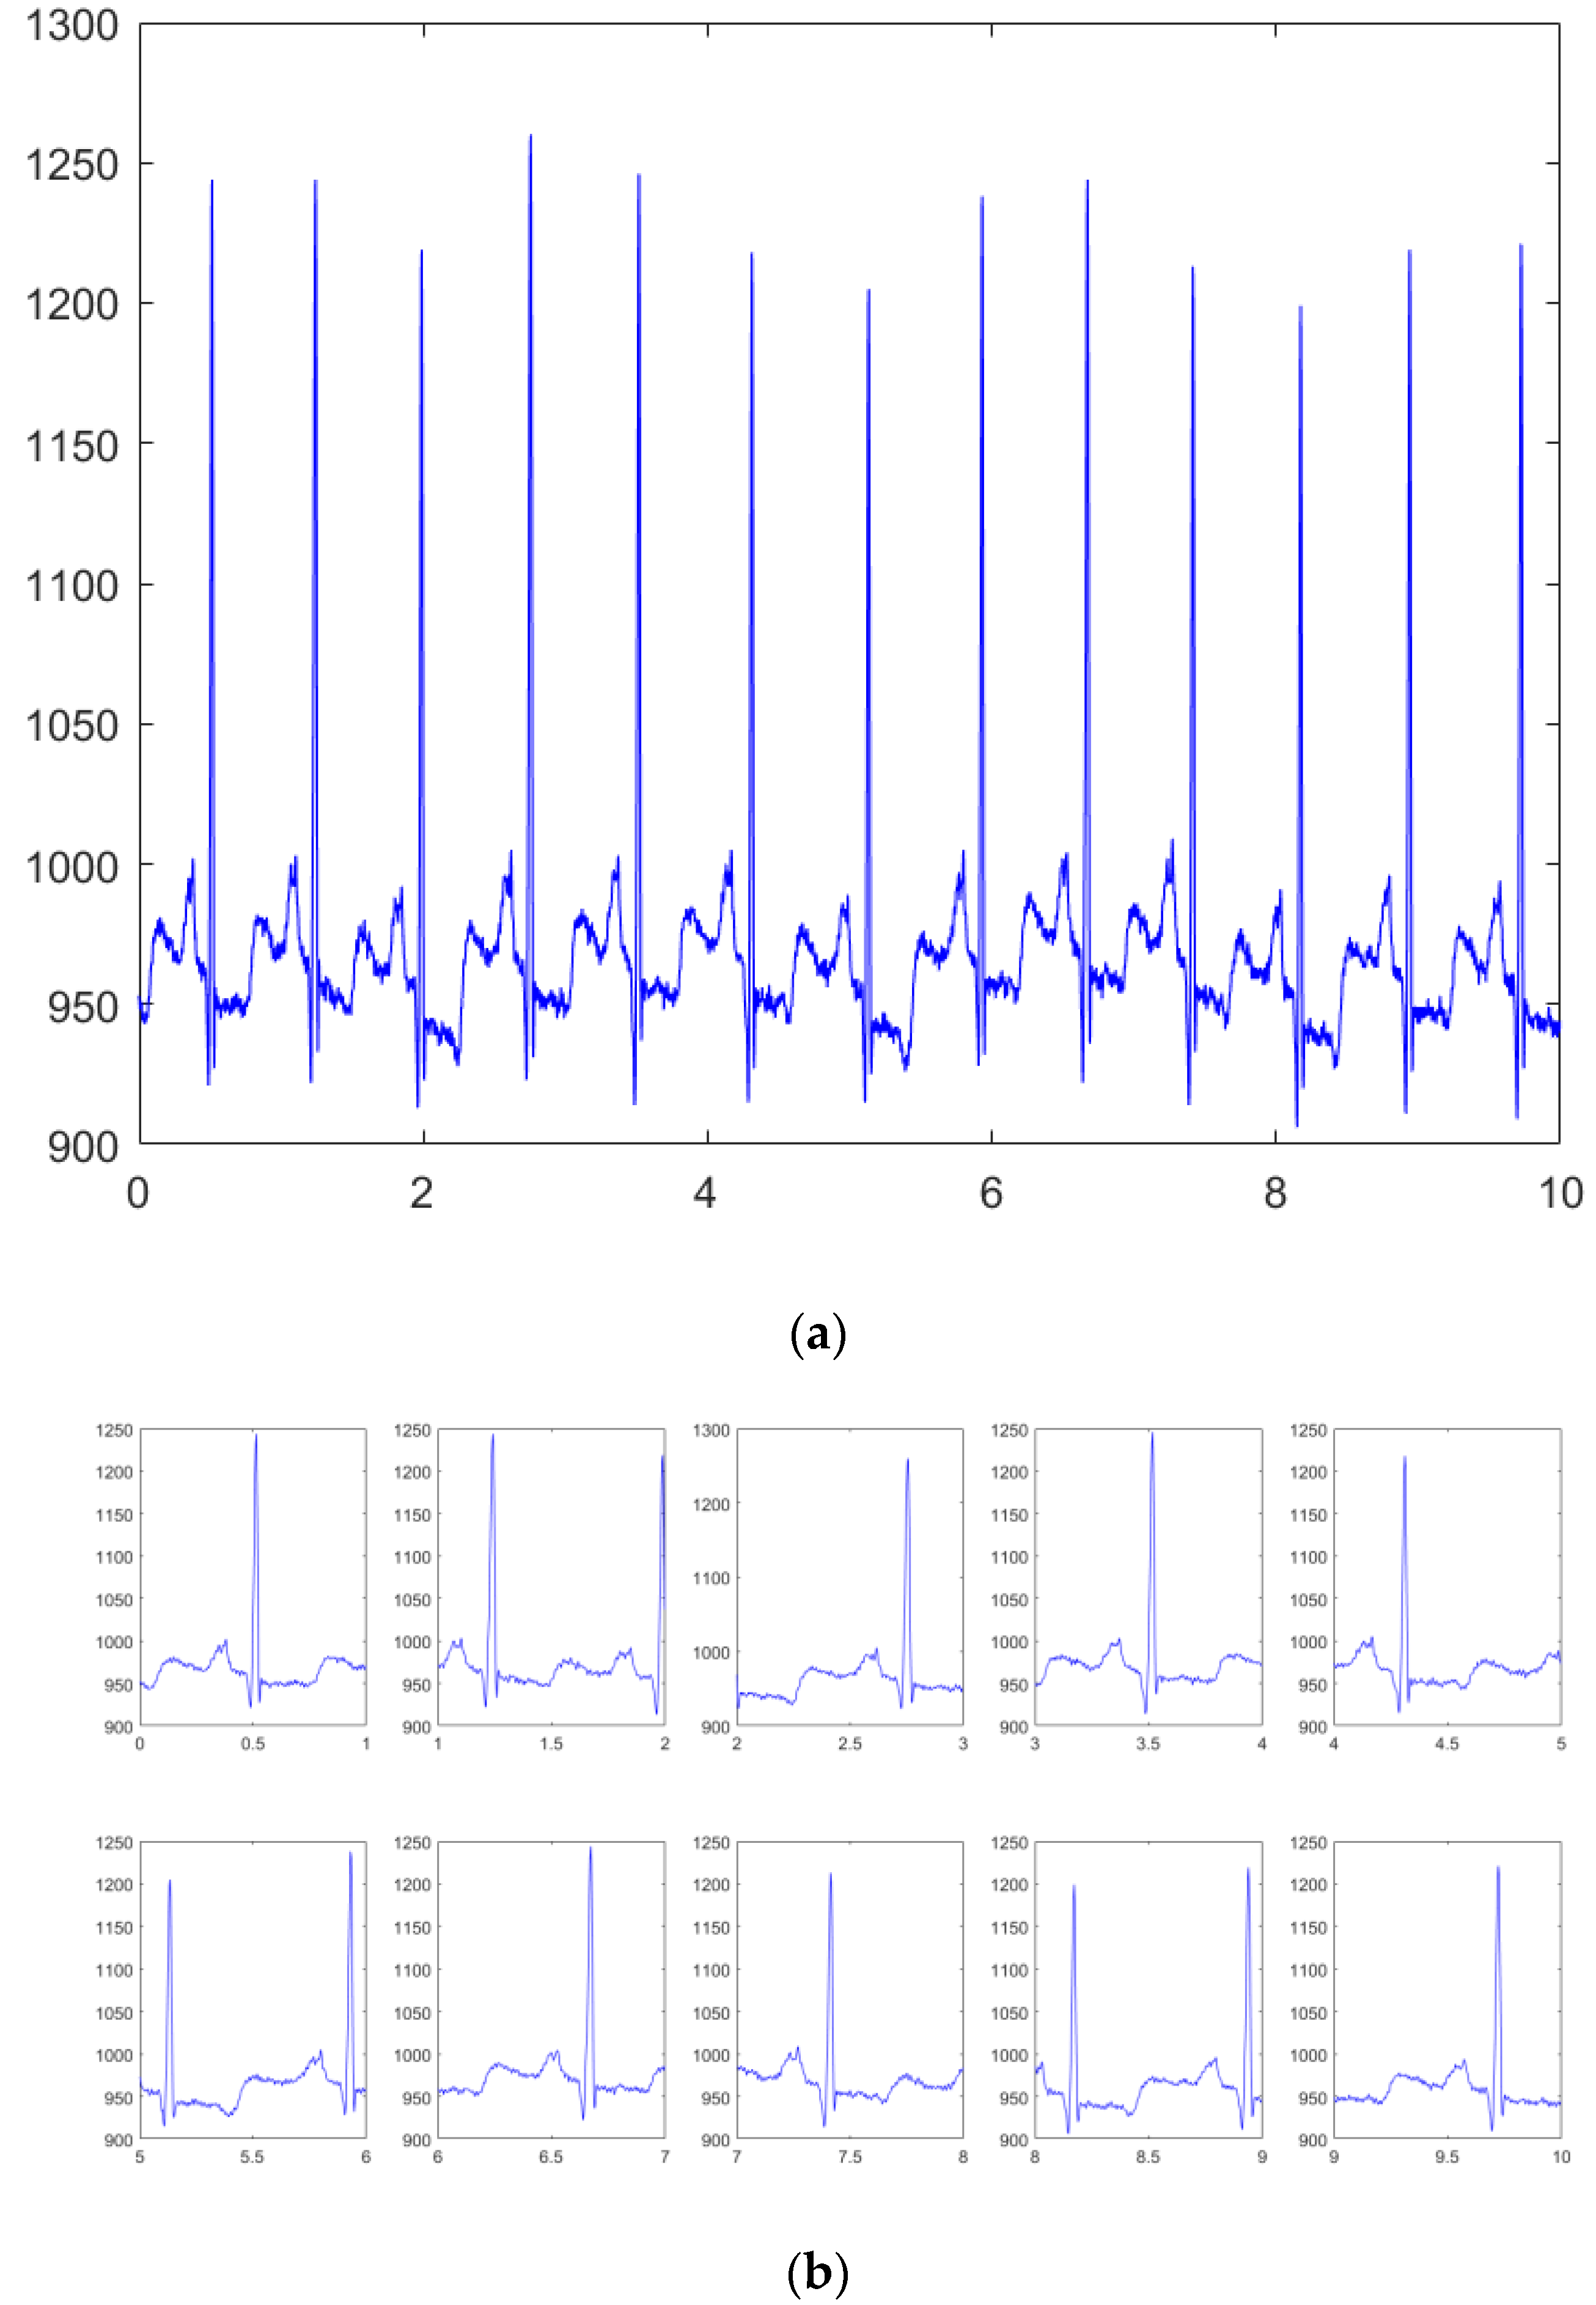
3.1. Preprocessing
Continuous Wavelet Transform (CWT)
3.2. Train Test Dataset Split
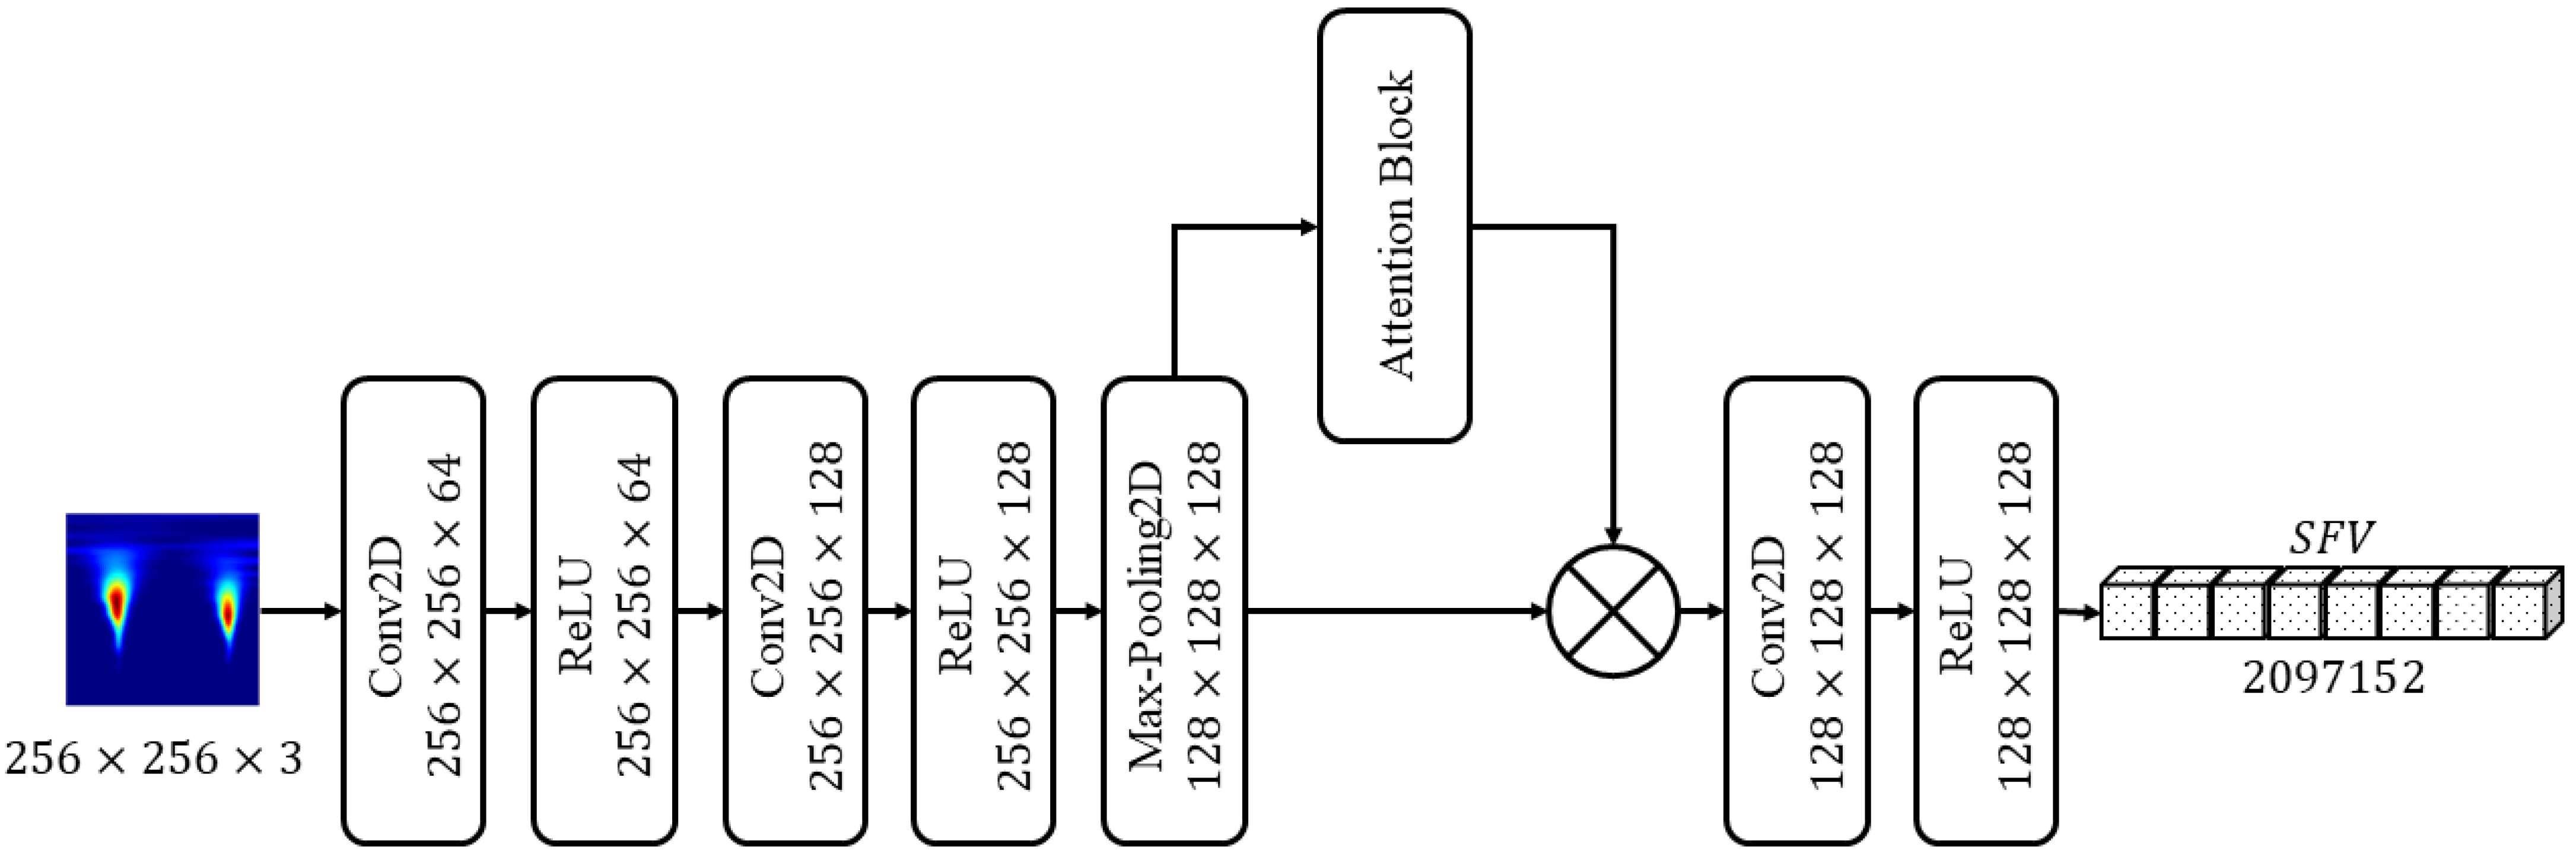
3.3. Features Extraction Using ArrhythmiaNet
3.3.1. Attention Block
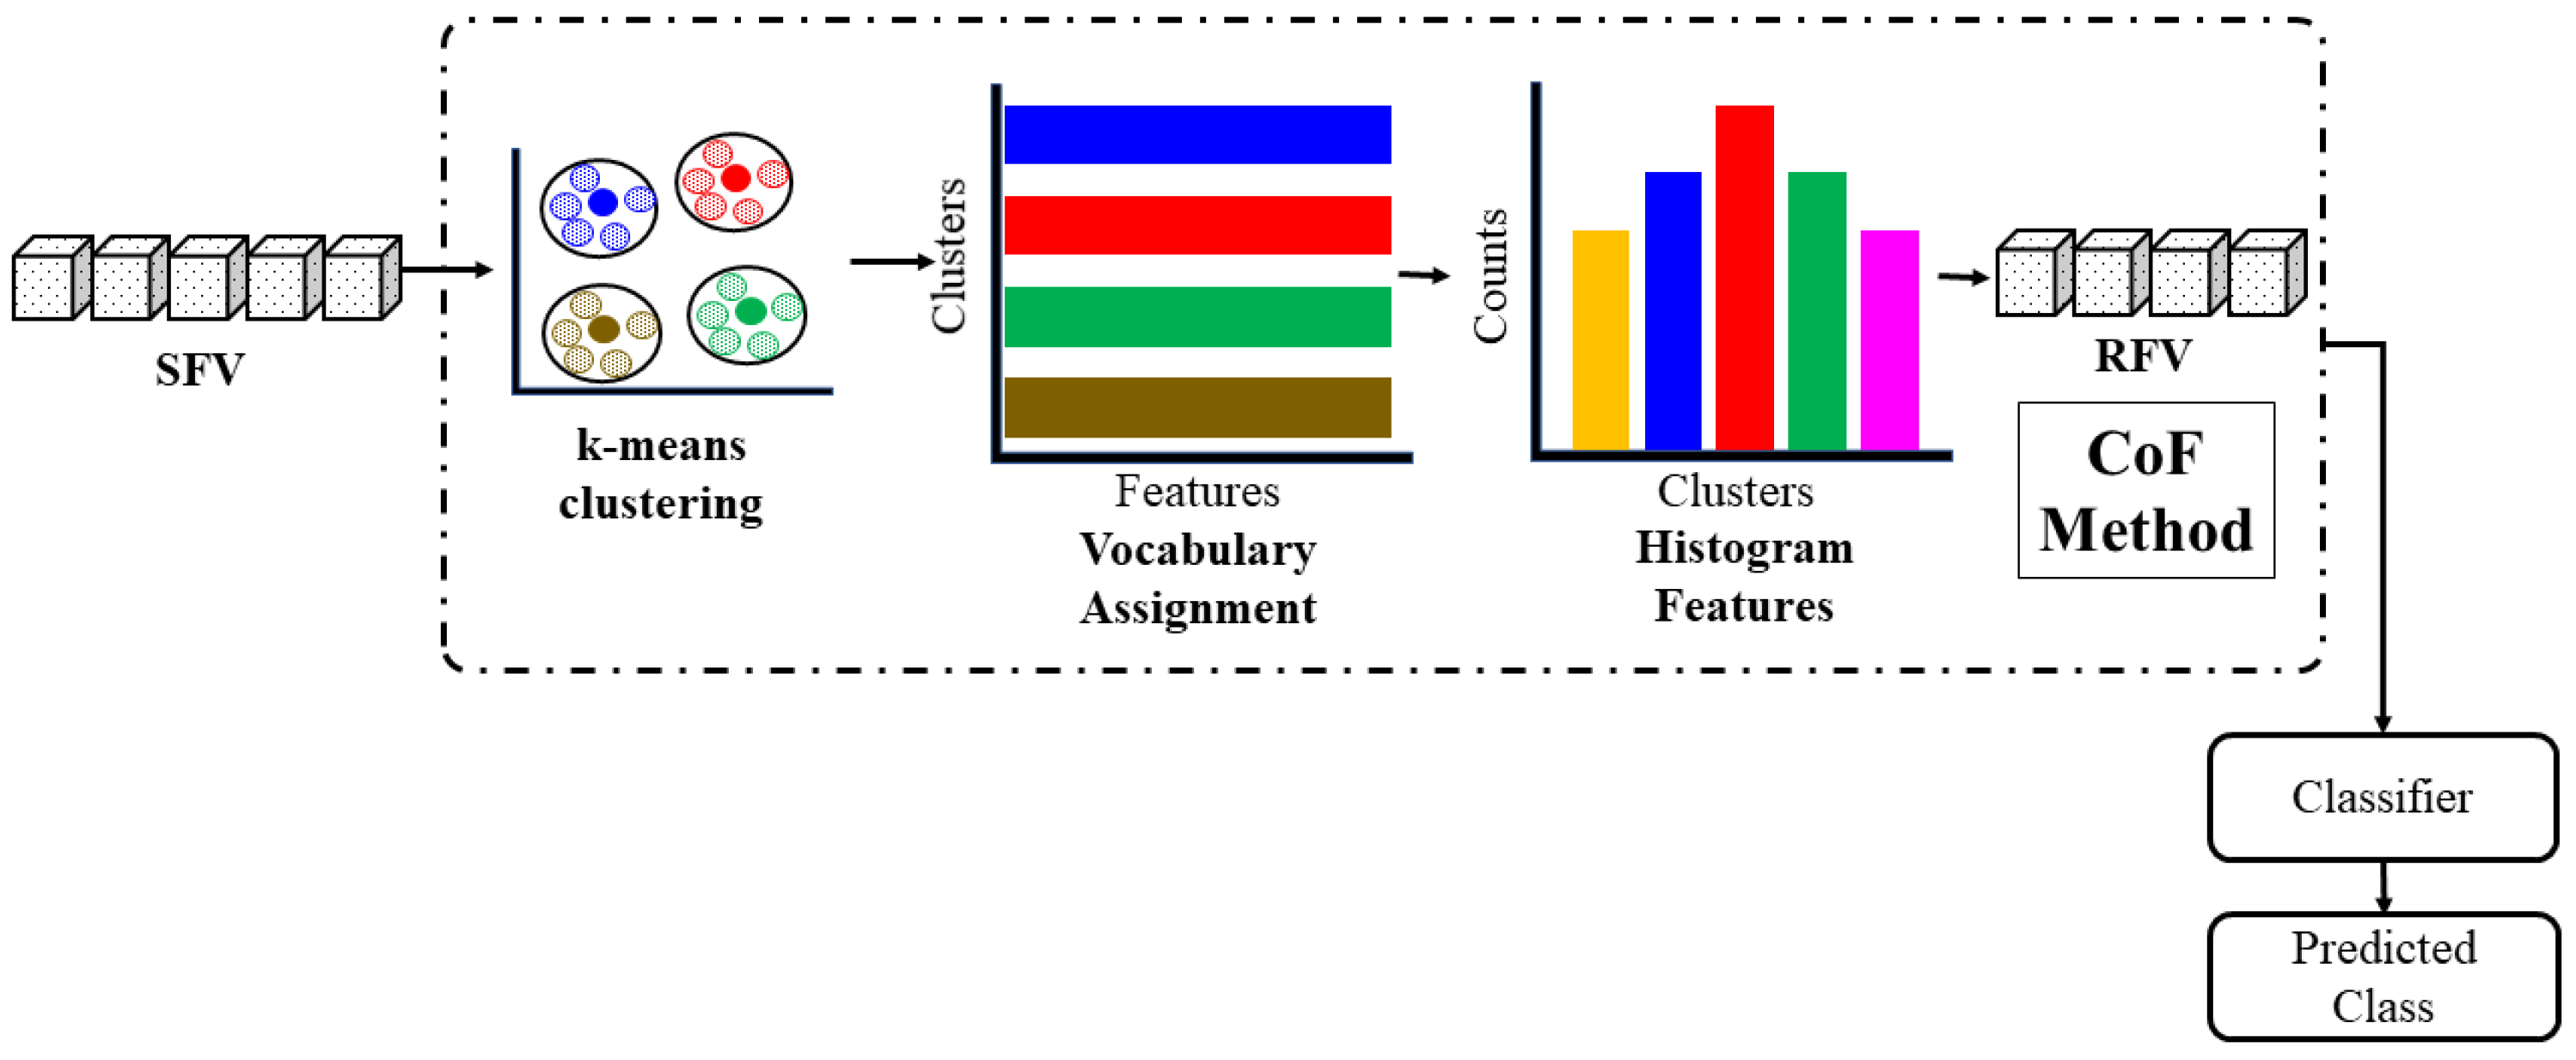
3.4. Feature Reduction Using CoF
| Algorithm 1: Silhouette Analysis (SA) |
For every sample
|
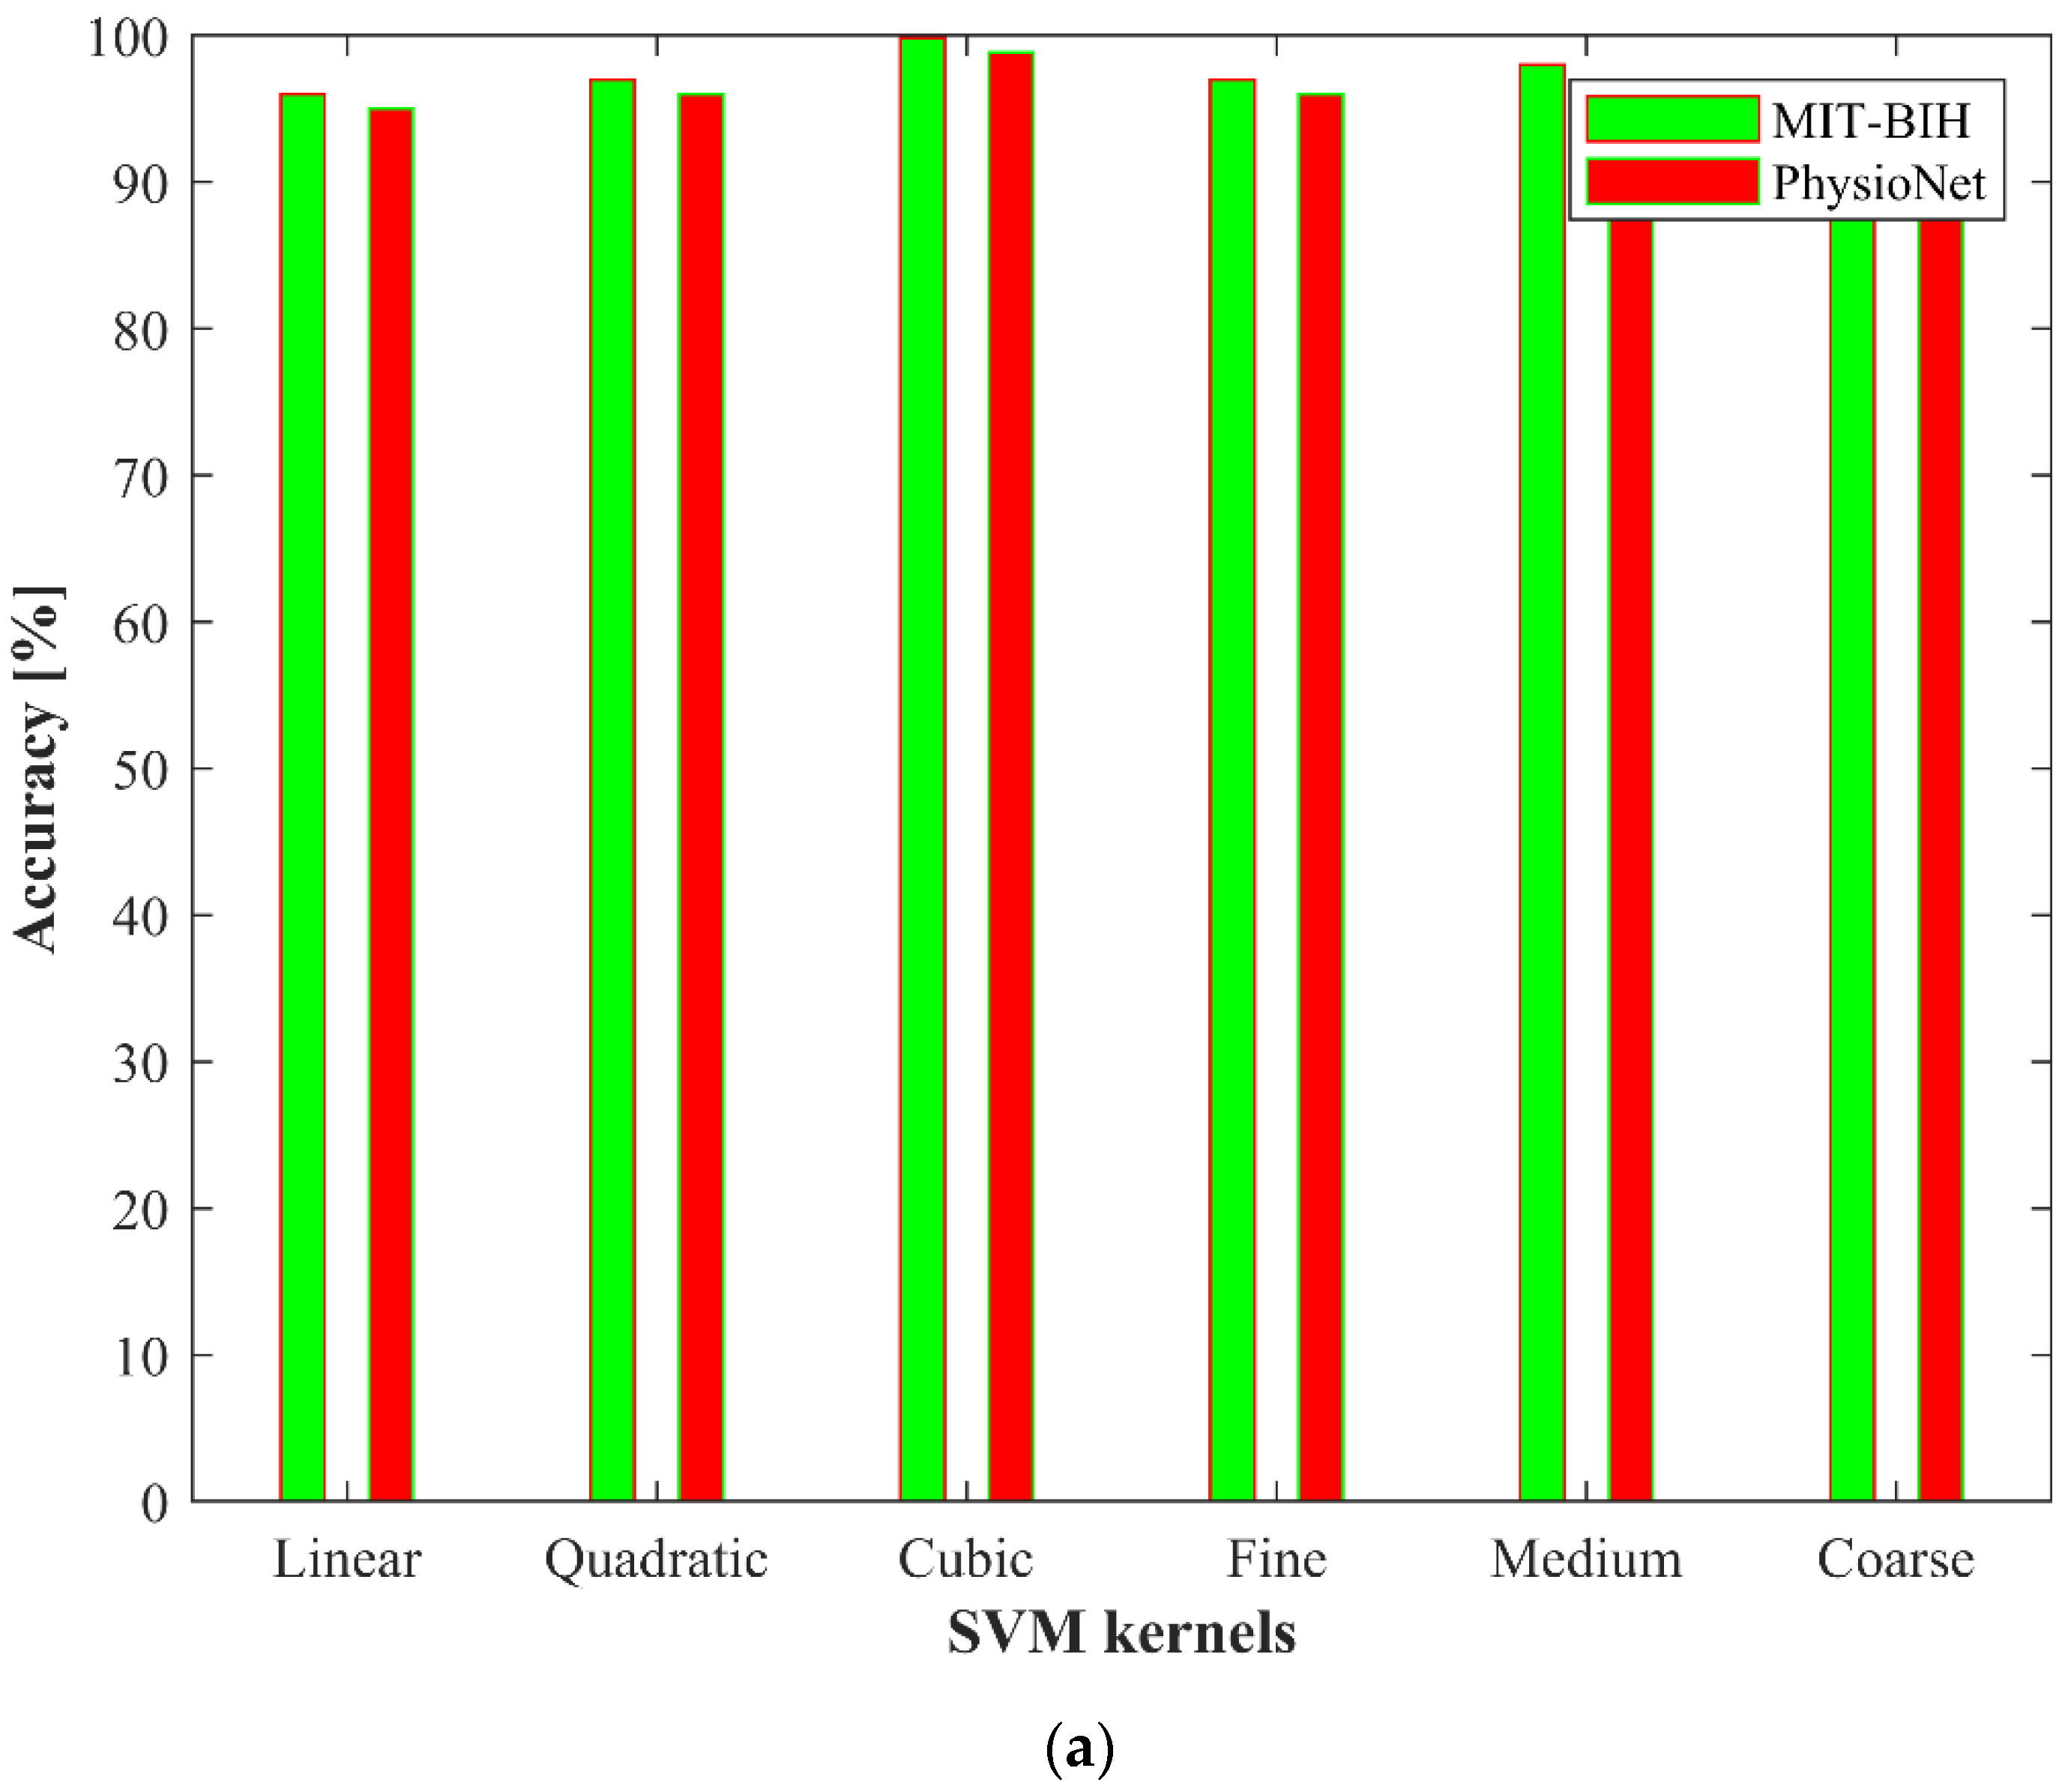
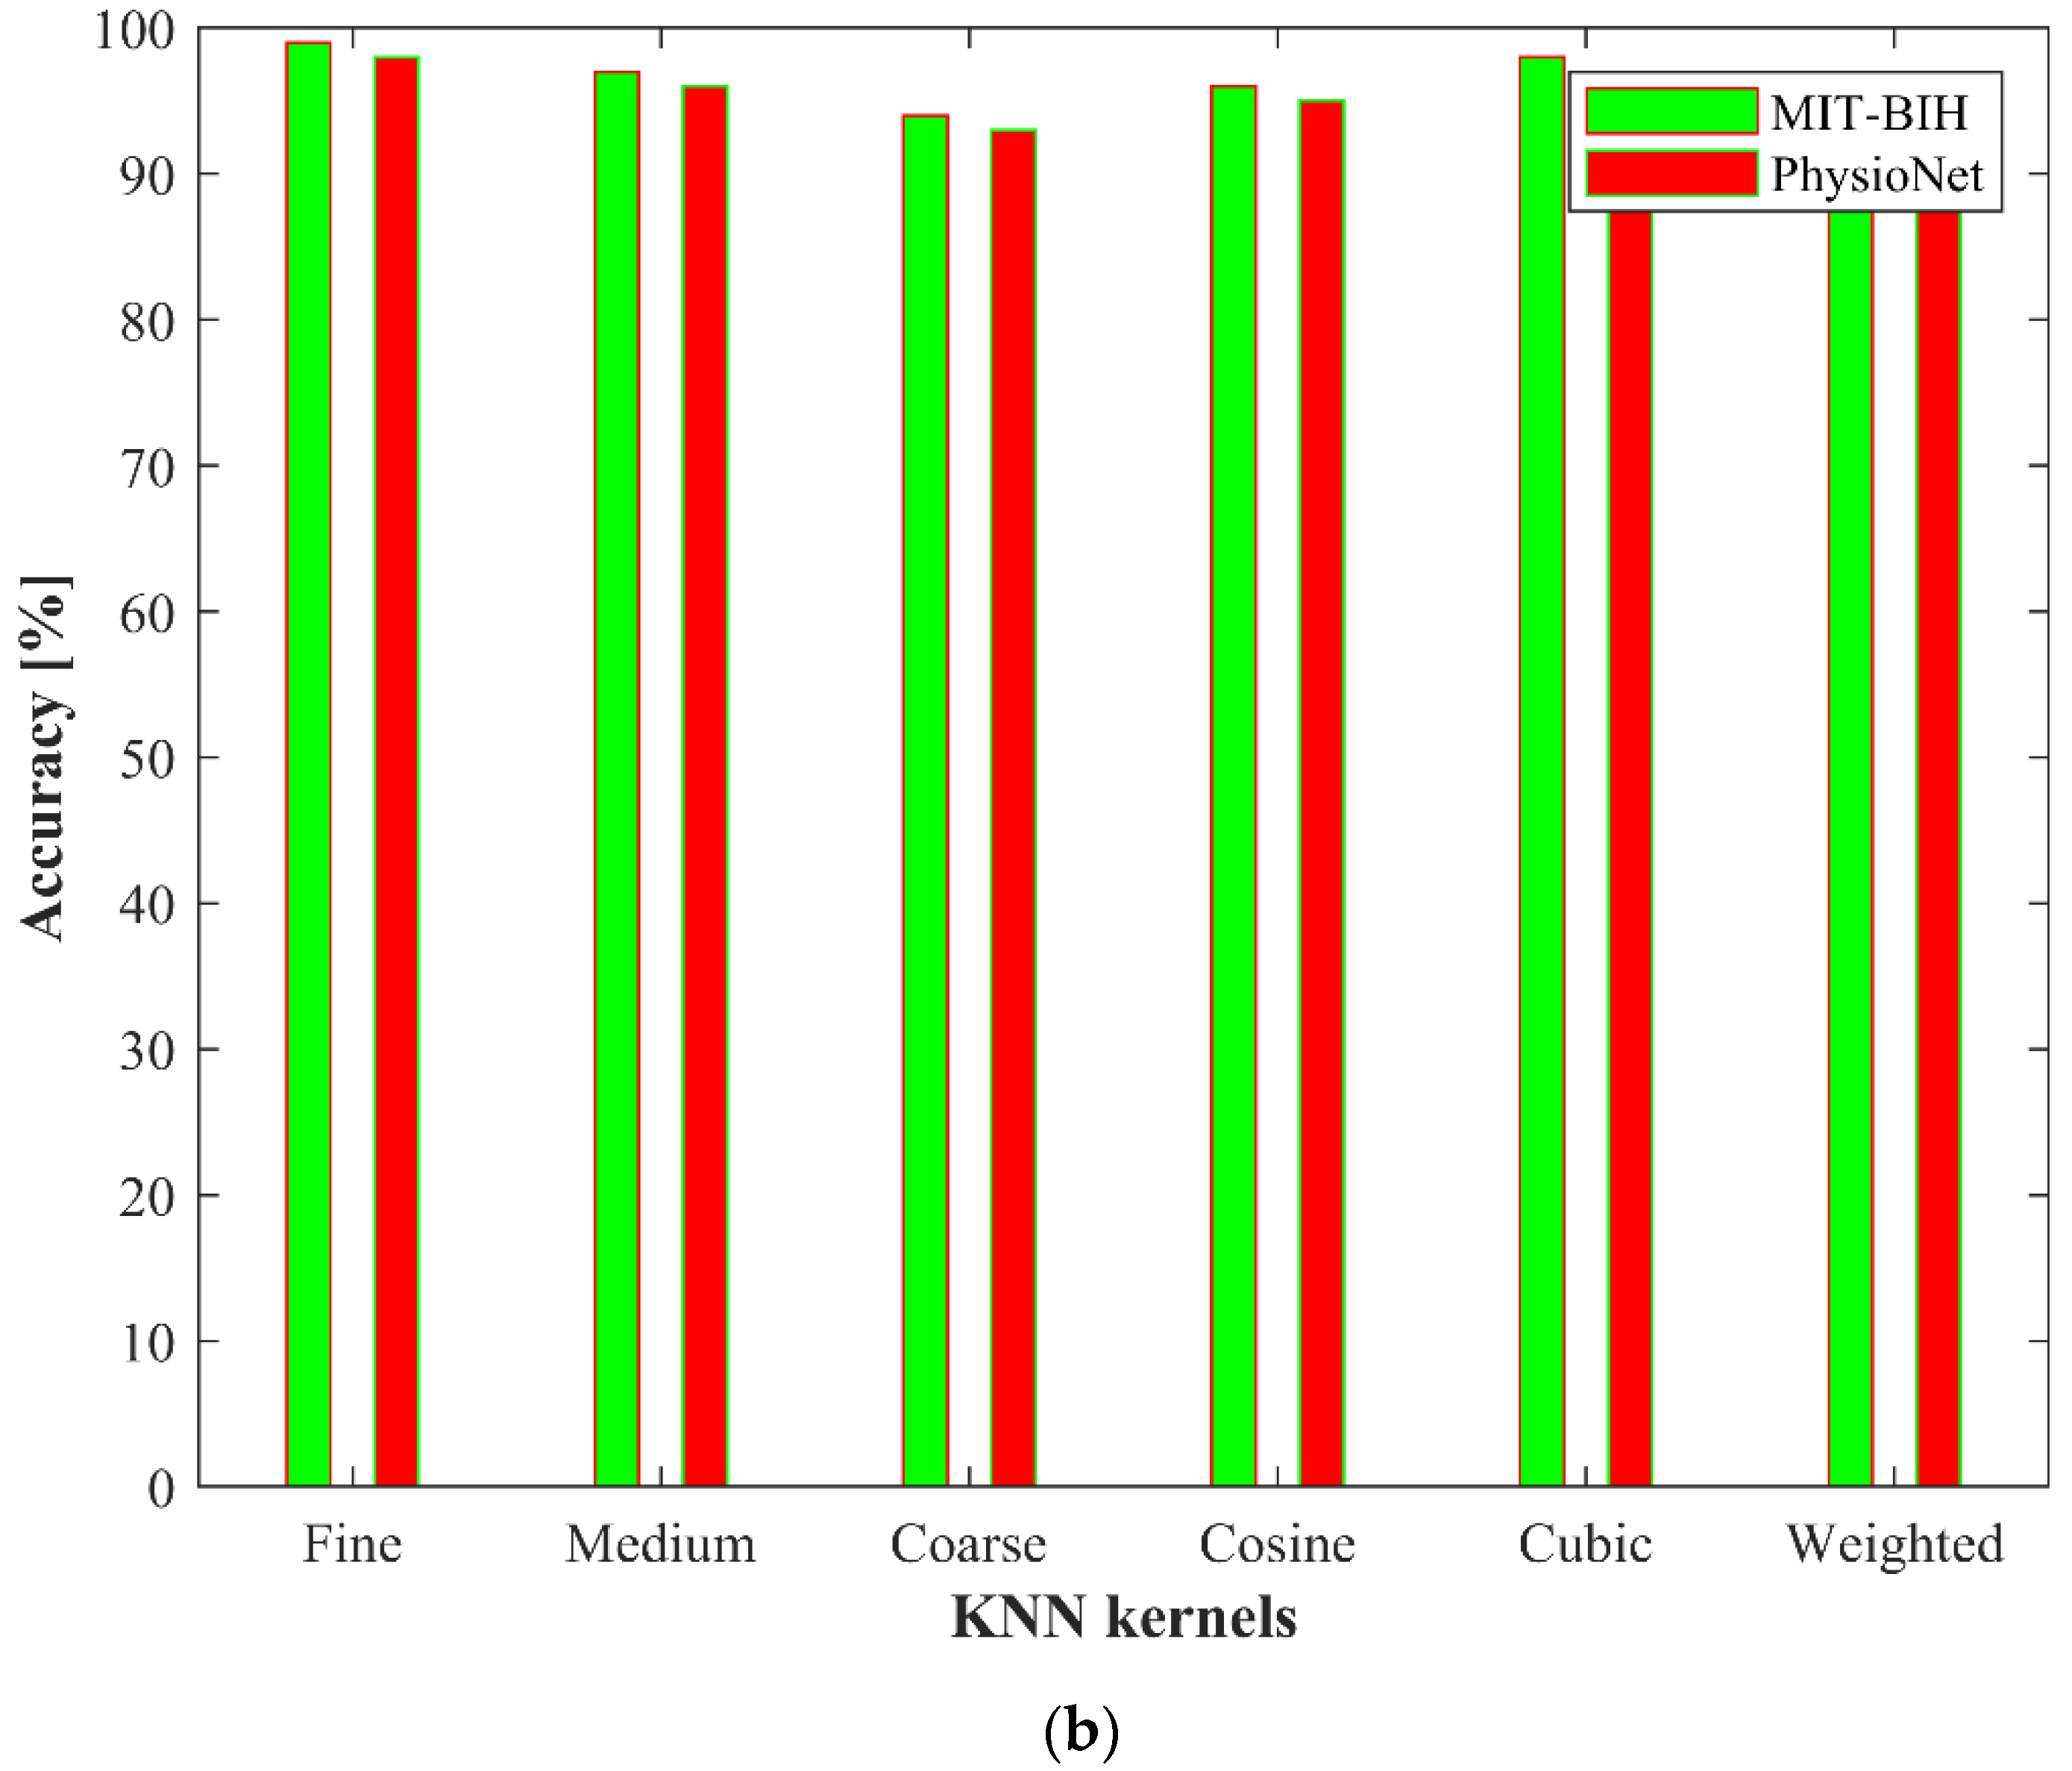
3.5. Classification
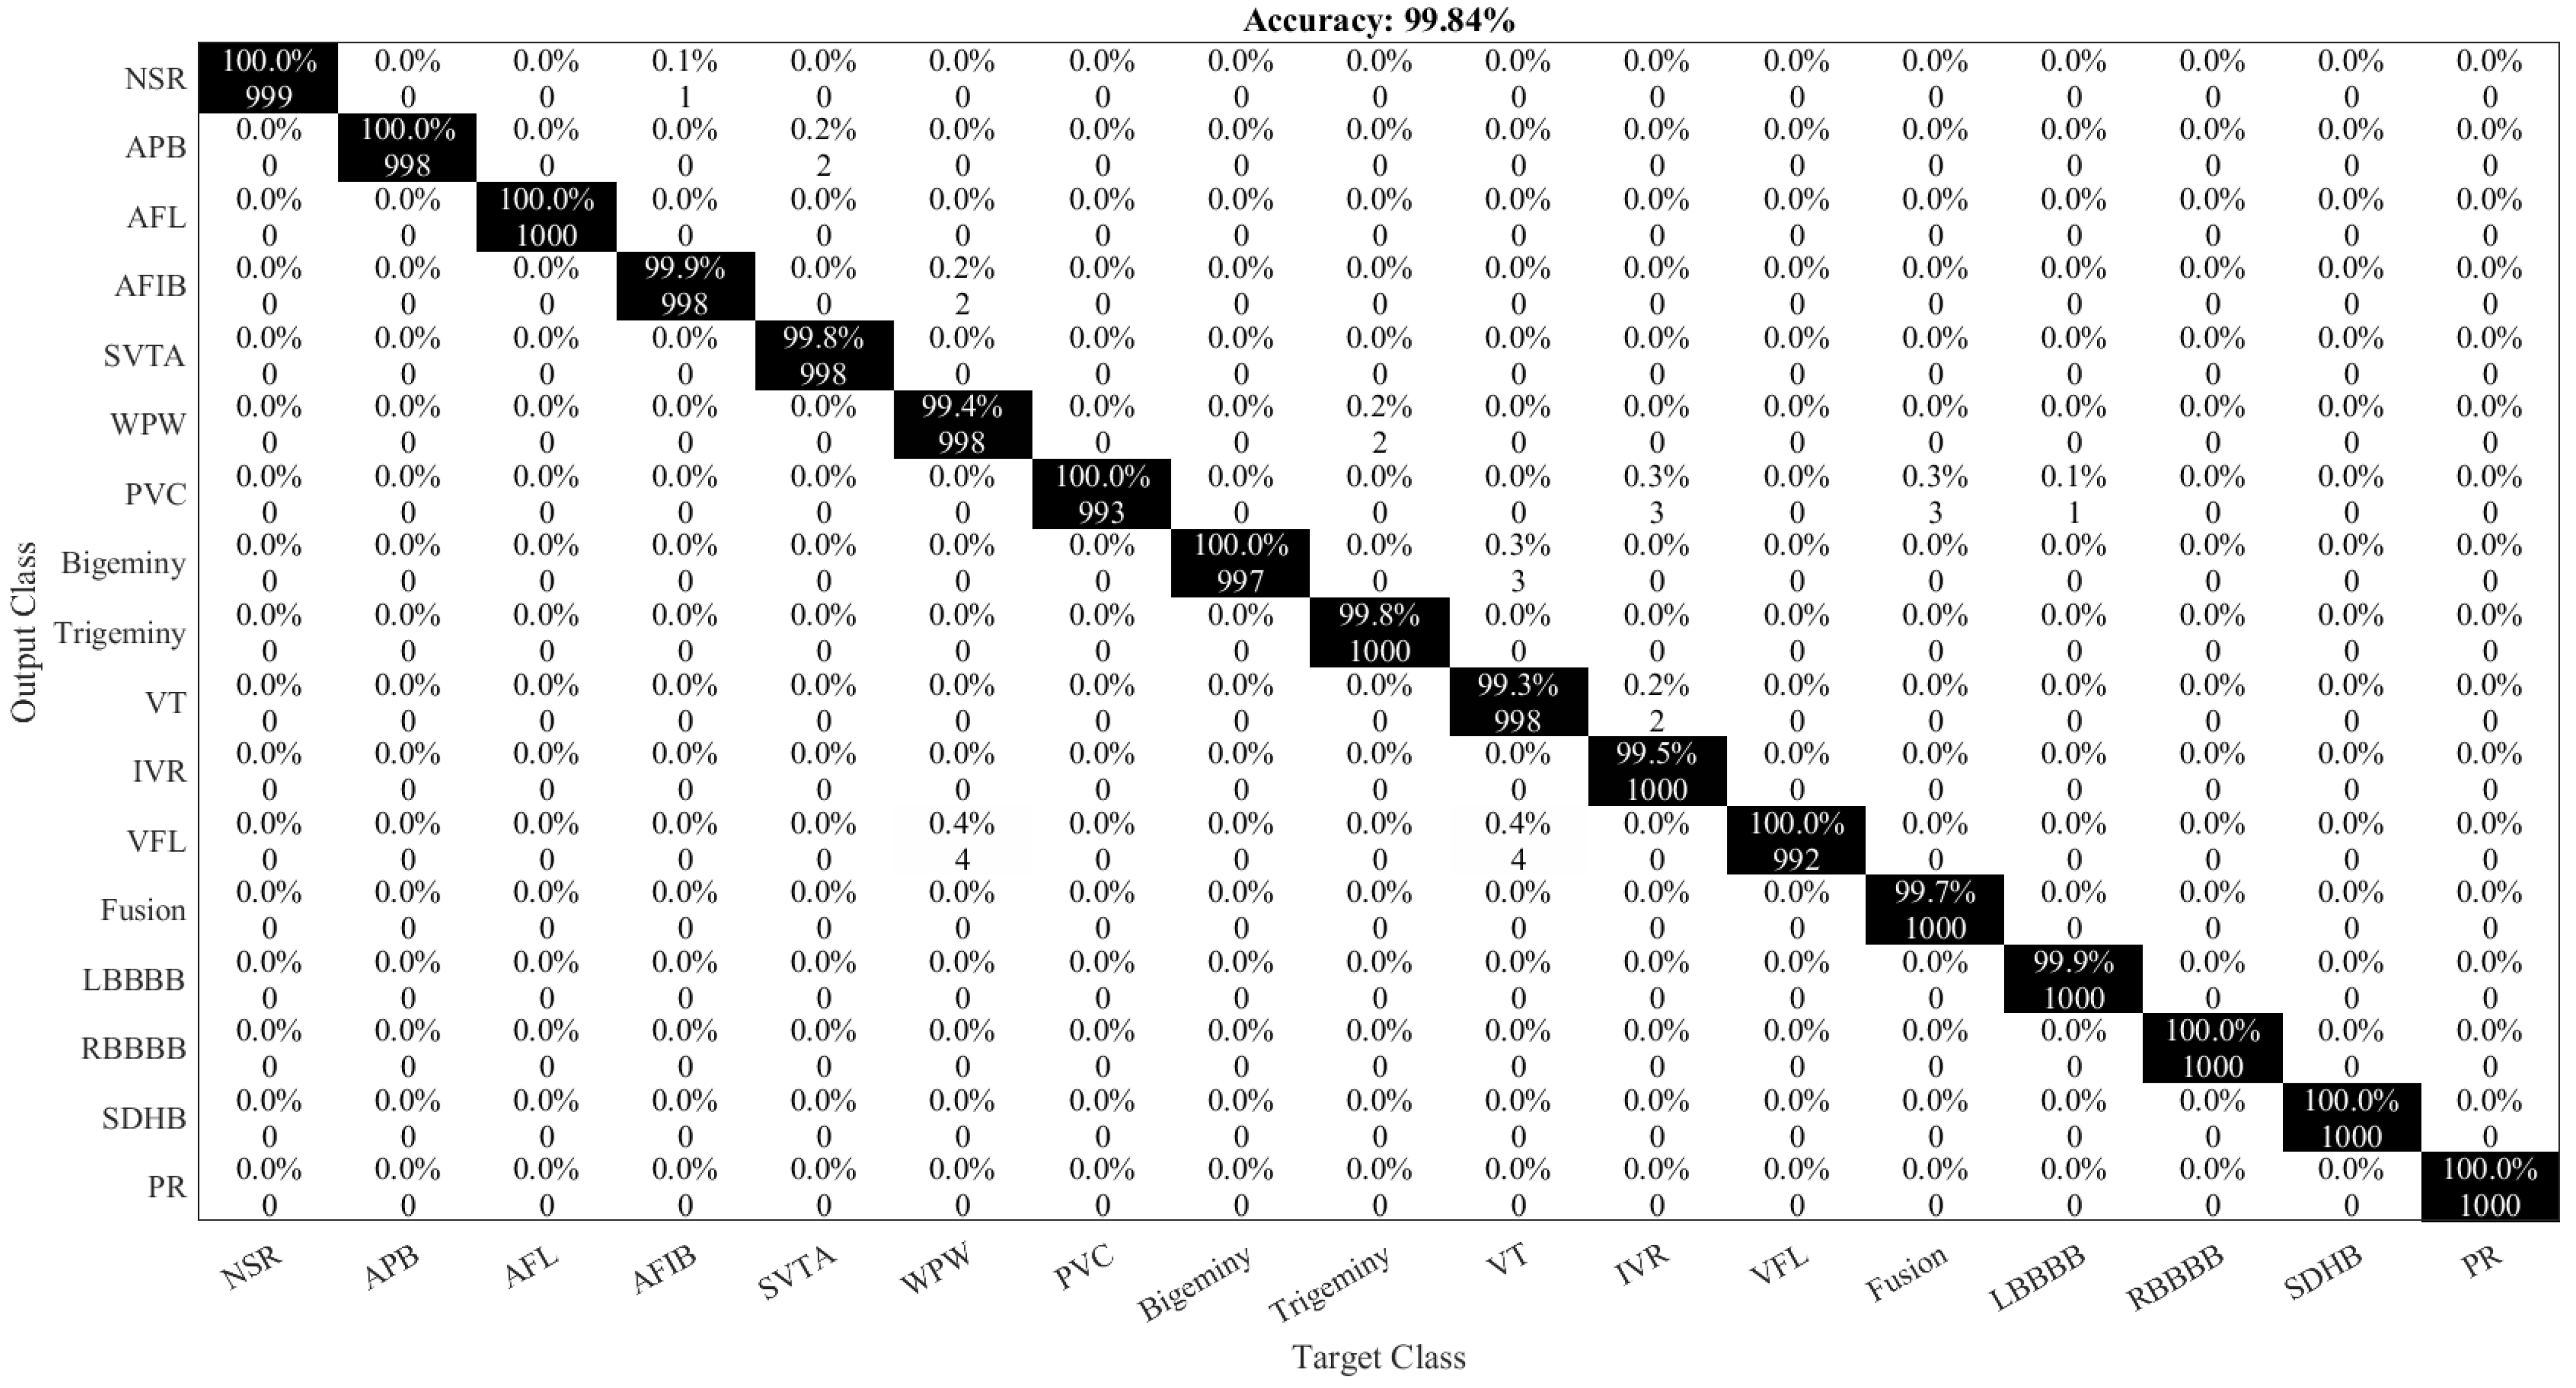
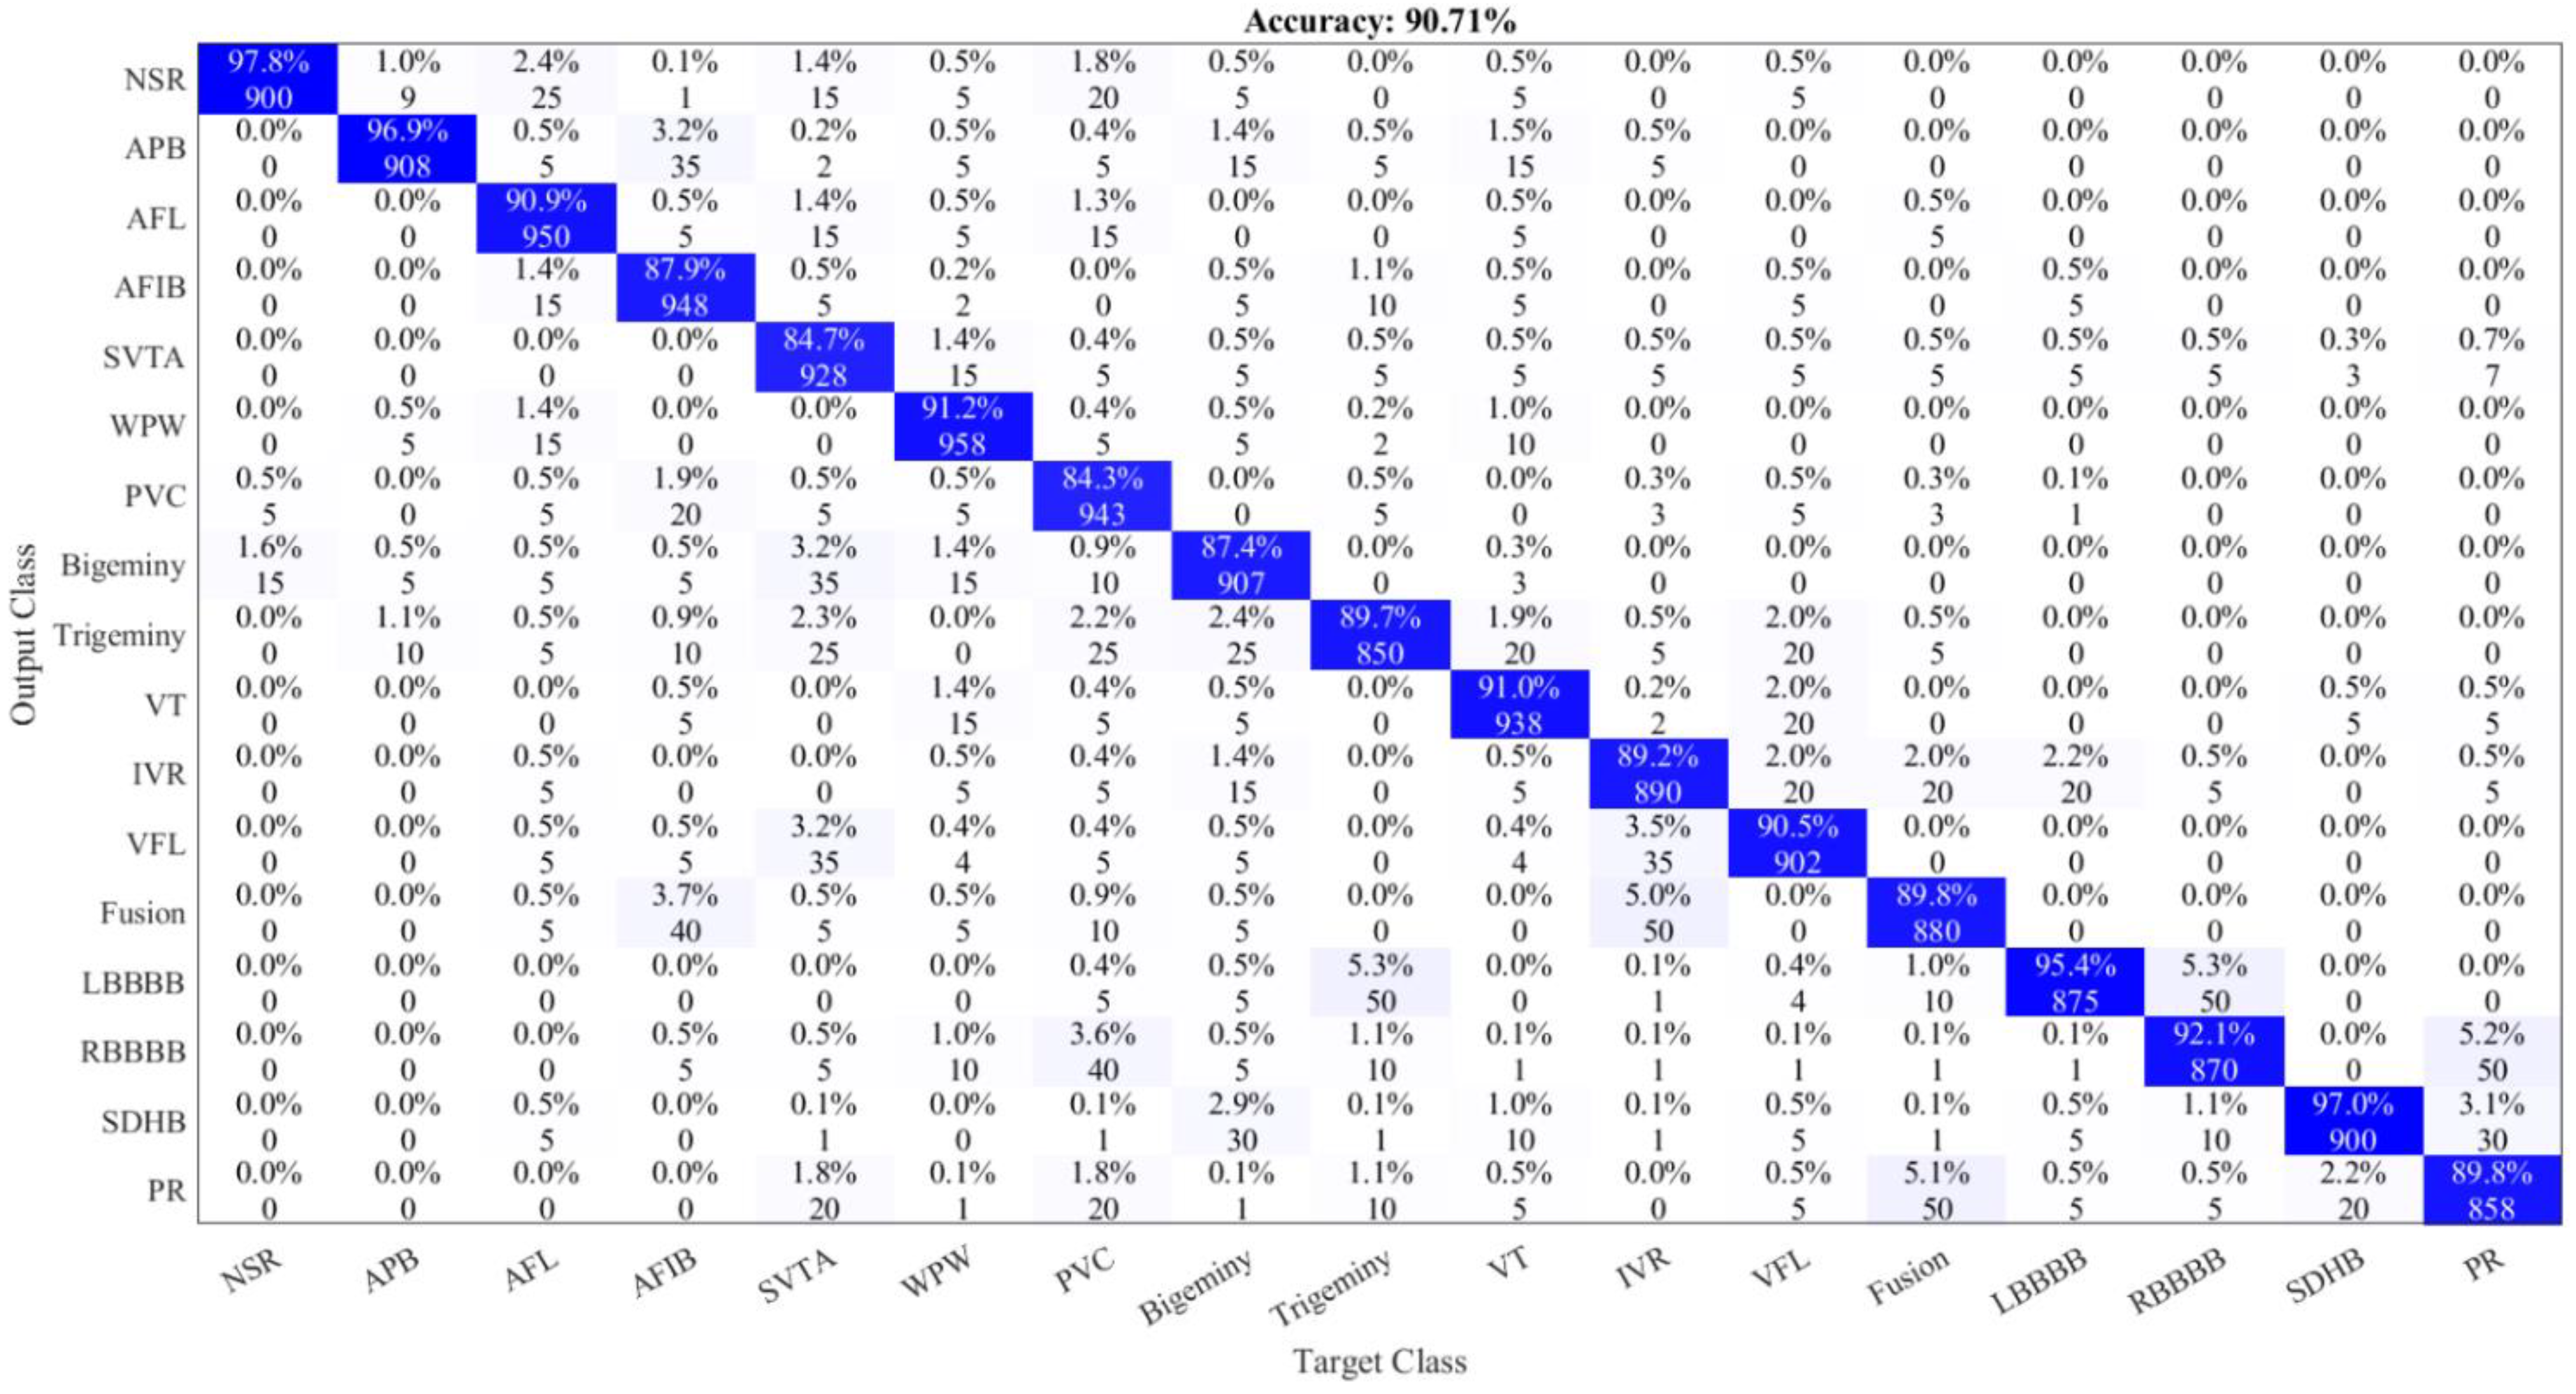
4. Experimental Results
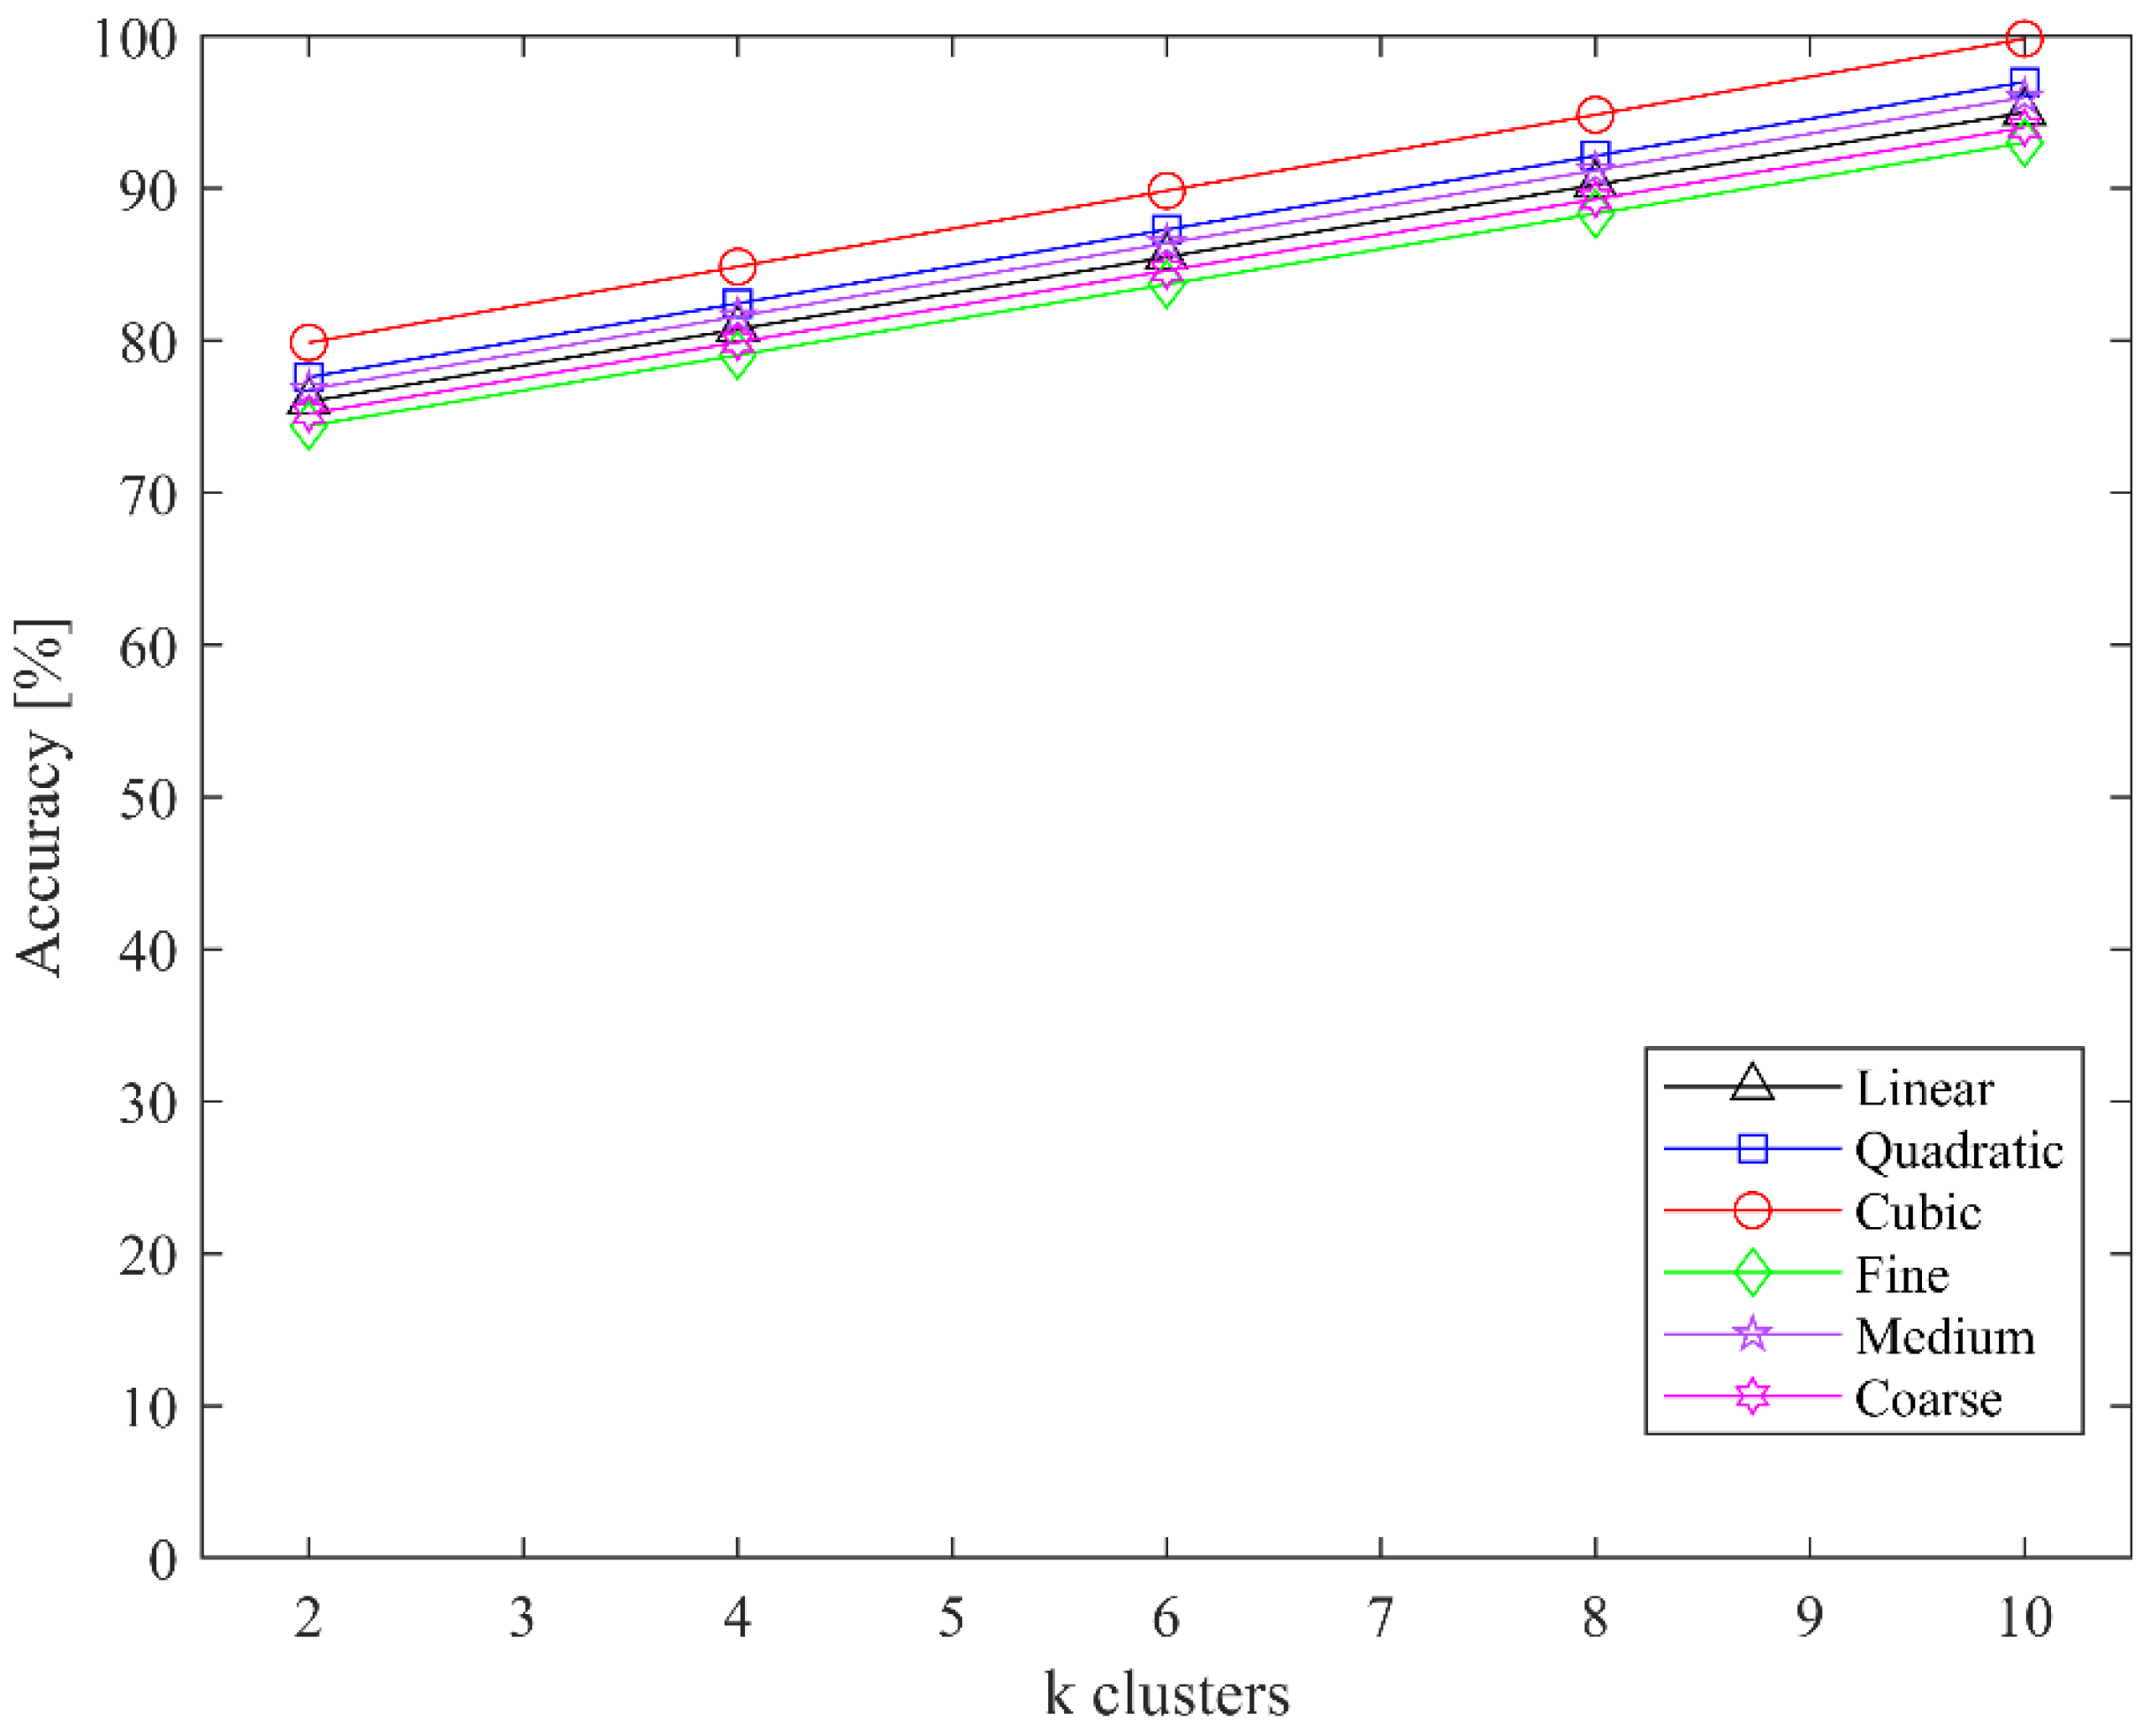
4.1. Ablation Study
4.2. Limitations and Future Directions
5. Conclusions
Author Contributions
Funding
Institutional Review Board Statement
Informed Consent Statement
Data Availability Statement
Conflicts of Interest
References
- Mc Namara, K.; Alzubaidi, H.; Jackson, J.K. Cardiovascular disease as a leading cause of death: How are pharmacists getting involved? Integr. Pharm. Res. Pract. 2019, 8, 1–11. [Google Scholar] [CrossRef] [PubMed] [Green Version]
- Gregory, T.S.; Oshinski, J.N.; Tse, Z.T.H. ECG Electrode Placements for Magnetohydrodynamic Voltage Suppression. J. Imaging 2018, 4, 94. [Google Scholar] [CrossRef] [Green Version]
- Pławiak, P.; Abdar, M. Novel methodology for cardiac arrhythmias classification based on long-duration ECG signal fragments analysis. In Biomedical Signal Processing; Springer: Singapore, 2020; pp. 225–272. [Google Scholar]
- Prasad, H.; Martis, R.J.; Acharya, U.R.; Min, L.C.; Suri, J.S. Application of higher order spectra for accurate delineation of atrial arrhythmia. In Proceedings of the 2013 35th Annual International Conference of the IEEE Engineering in Medicine and Biology Society (EMBC), Osaka, Japan, 3–7 July 2013; pp. 57–60. [Google Scholar]
- Park, J.; Lee, K.; Kang, K. Arrhythmia detection from heartbeat using k-nearest neighbor classifier. In Proceedings of the 2013 IEEE International Conference on Bioinformatics and Biomedicine, Shanghai, China, 18–21 December 2013; pp. 15–22. [Google Scholar]
- Savalia, S.; Emamian, V. Cardiac Arrhythmia Classification by Multi-Layer Perceptron and Convolution Neural Networks. Bioengineering 2018, 5, 35. [Google Scholar] [CrossRef] [PubMed] [Green Version]
- Ullah, A.; Anwar, S.M.; Bilal, M.; Mehmood, R.M. Classification of Arrhythmia by Using Deep Learning with 2-D ECG Spectral Image Representation. Remote Sens. 2020, 12, 1685. [Google Scholar] [CrossRef]
- Lee, H.; Yoon, T.; Yeo, C.; Oh, H.; Ji, Y.; Sim, S.; Kang, D. Cardiac Arrhythmia Classification Based on One-Dimensional Morphological Features. Appl. Sci. 2021, 11, 9460. [Google Scholar] [CrossRef]
- Wang, D.; Meng, Q.; Chen, D.; Zhang, H.; Xu, L. Automatic Detection of Arrhythmia Based on Multi-Resolution Representation of ECG Signal. Sensors 2020, 20, 1579. [Google Scholar] [CrossRef] [Green Version]
- Li, D.; Wu, H.; Zhao, J.; Tao, Y.; Fu, J. Automatic Classification System of Arrhythmias Using 12-Lead ECGs with a Deep Neural Network Based on an Attention Mechanism. Symmetry 2020, 12, 1827. [Google Scholar] [CrossRef]
- Faust, O.; Kareem, M.; Ali, A.; Ciaccio, E.J.; Acharya, U.R. Automated Arrhythmia Detection Based on RR Intervals. Diagnostics 2021, 11, 1446. [Google Scholar] [CrossRef]
- Ullah, A.; Rehman, S.U.; Tu, S.; Mehmood, R.M.; Fawad; Ehatisham-ul-haq, M. A Hybrid Deep CNN Model for Abnormal Arrhythmia Detection Based on Cardiac ECG Signal. Sensors 2021, 21, 951. [Google Scholar] [CrossRef]
- Kobat, M.A.; Karaca, O.; Barua, P.D.; Dogan, S. PrismatoidPatNet54: An Accurate ECG Signal Classification Model Using Prismatoid Pattern-Based Learning Architecture. Symmetry 2021, 13, 1914. [Google Scholar] [CrossRef]
- Hwang, W.H.; Jeong, C.H.; Hwang, D.H.; Jo, Y.C. Automatic Detection of Arrhythmias Using a YOLO-Based Network with Long-Duration ECG Signals. Eng. Proc. 2020, 2, 84. [Google Scholar] [CrossRef]
- Huang, J.; Chen, B.; Yao, B.; He, W. ECG arrhythmia classification using STFT-based spectrogram and convolutional neural network. IEEE Access 2019, 7, 92871–92880. [Google Scholar] [CrossRef]
- Qaisar, S.M.; Mihoub, A.; Krichen, M.; Nisar, H. Multirate Processing with Selective Subbands and Machine Learning for Efficient Arrhythmia Classification. Sensors 2021, 21, 1511. [Google Scholar] [CrossRef] [PubMed]
- Sraitih, M.; Jabrane, Y.; Hajjam El Hassani, A. An Automated System for ECG Arrhythmia Detection Using Machine Learning Techniques. J. Clin. Med. 2021, 10, 5450. [Google Scholar] [CrossRef] [PubMed]
- Scirè, A.; Tropeano, F.; Anagnostopoulos, A.; Chatzigiannakis, I. Fog-Computing-Based Heartbeat Detection and Arrhythmia Classification Using Machine Learning. Algorithm 2019, Algorithm 12 and Algorithm 32. [CrossRef] [Green Version]
- Mjahad, A.; Rosado-Muñoz, A.; Guerrero-Martínez, J.F.; Bataller-Mompeán, M.; Francés-Villora, J.V.; Dutta, M.K. Detection of Ventricular Fibrillation Using the Image from Time-Frequency Representation and Combined Classifiers without Feature Extraction. Appl. Sci. 2018, 8, 2057. [Google Scholar] [CrossRef] [Green Version]
- Jamil, S.; Fawad; Rahman, M.; Ullah, A.; Badnava, S.; Forsat, M.; Mirjavadi, S.S. Malicious UAV Detection Using Integrated Audio and Visual Features for Public Safety Applications. Sensors 2020, 20, 3923. [Google Scholar] [CrossRef]
- He, K.; Zhang, X.; Ren, S.; Sun, J. Deep residual learning for image recognition. In Proceedings of the IEEE Conference on Computer Vision and Pattern Recognition, Las Vegas, NV, USA, 26 June–1 July 2016; pp. 770–778. [Google Scholar]
- Simonyan, K.; Zisserman, A. Very deep convolutional networks for large-scale image recognition. arXiv 2014, arXiv:1409.1556. [Google Scholar]
- Szegedy, C.; Vanhoucke, V.; Ioffe, S.; Shlens, J.; Wojna, Z. Rethinking the inception architecture for computer vision. In Proceedings of the IEEE Conference on Computer Vision and Pattern Recognition, Las Vegas, NV, USA, 26 June–1 July 2016; pp. 2818–2826. [Google Scholar]
- Szegedy, C.; Liu, W.; Jia, Y.; Sermanet, P.; Reed, S.; Anguelov, D.; Erhan, D.; Vanhoucke, V.; Rabinovich, A. Going deeper with convolutions. In Proceedings of the IEEE Conference on Computer Vision and Pattern Recognition, Boston, MA, USA, 7–12 June 2015; pp. 1–9. [Google Scholar]
- Liu, G.; Zhang, C.; Xu, Q.; Cheng, R.; Song, Y.; Yuan, X.; Sun, J. I3D-Shufflenet Based Human Action Recognition. Algorithm 2020, Algorithm 13 and Algorithm 301. [CrossRef]
- Wang, A.; Wang, M.; Jiang, K.; Cao, M.; Iwahori, Y. A Dual Neural Architecture Combined SqueezeNet with OctConv for LiDAR Data Classification. Sensors 2019, 19, 4927. [Google Scholar] [CrossRef] [Green Version]
- Tan, M.; Le, Q. Efficientnet: Rethinking model scaling for convolutional neural networks. In Proceedings of the International Conference on Machine Learning (PMLR), Long Beach, CA, USA, 9–15 June 2019; pp. 6105–6114. [Google Scholar]
- Chao, X.; Hu, X.; Feng, J.; Zhang, Z.; Wang, M.; He, D. Construction of Apple Leaf Diseases Identification Networks Based on Xception Fused by SE Module. Appl. Sci. 2021, 11, 4614. [Google Scholar] [CrossRef]
- Demertzis, K.; Tsiknas, K.; Takezis, D.; Skianis, C.; Iliadis, L. Darknet Traffic Big-Data Analysis and Network Management for Real-Time Automating of the Malicious Intent Detection Process by a Weight Agnostic Neural Networks Framework. Electronics 2021, 10, 781. [Google Scholar] [CrossRef]
- Pławiak, P. ECG Signals (1000 Fragments), version 3; Mendeley Data, 2017. [CrossRef]
- Yang, Y.; Deng, H. GC-YOLOv3: You Only Look Once with Global Context Block. Electronics 2020, 9, 1235. [Google Scholar] [CrossRef]
- Zhou, J.; He, Z.; Song, Y.N.; Wang, H.; Yang, X.; Lian, W.; Dai, H.N. Precious metal price prediction based on deep regularization self-attention regression. IEEE Access 2019, 8, 2178–2187. [Google Scholar] [CrossRef]
- Asghar, M.A.; Khan, M.J.; Fawad; Amin, Y.; Rizwan, M.; Rahman, M.; Badnava, S.; Mirjavadi, S.S. EEG-Based Multi-Modal Emotion Recognition using Bag of Deep Features: An Optimal Feature Selection Approach. Sensors 2019, 19, 5218. [Google Scholar] [CrossRef] [Green Version]
- Jamil, S.; Rahman, M.; Haider, A. Bag of Features (BoF) Based Deep Learning Framework for Bleached Corals Detection. Big Data Cogn. Comput. 2021, 5, 53. [Google Scholar] [CrossRef]
- Bakheet, S. An SVM Framework for Malignant Melanoma Detection Based on Optimized HOG Features. Computation 2017, 5, 4. [Google Scholar] [CrossRef] [Green Version]


| Class Name | Number of Samples |
|---|---|
| NSR | 283 |
| APB | 66 |
| AFL | 20 |
| AFIB | 135 |
| SVTA | 13 |
| WPW | 21 |
| PVC | 133 |
| Bigeminy | 55 |
| Trigeminy | 13 |
| VT | 10 |
| IVR | 10 |
| VFL | 10 |
| Fusion | 11 |
| LBBBB | 103 |
| RBBBB | 62 |
| SDHB | 10 |
| PR | 45 |
| Parameter Name | Parameter Value |
|---|---|
| Optimizer | Stochastic Gradient Descent (SGD) |
| Momentum | 0.9 |
| Learning Rate | 0.001 |
| Mini batch size | 32 |
| Learning rate decay | 10−7 |
| Loss function | Cross entropy |
| Name of D-CNN | Classifier | Accuracy | F1-Score | Sensitivity | Specificity | Cohen’s Kappa | Error |
|---|---|---|---|---|---|---|---|
| AlexNet [20] | SVM | 98.70% | 0.968 | 97.10% | 96.50% | 0.950 | 1.30% |
| ResNet-50 [21] | SVM | 95.40% | 0.951 | 94.60% | 95.60% | 0.930 | 4.60% |
| VGG-19 [22] | SVM | 89.80% | 0.918 | 93.3% | 90.40% | 0.900 | 10.20% |
| Inception v3 [23] | SVM | 98.20% | 0.951 | 94.6% | 95.60% | 0.930 | 1.80% |
| GoogLeNet [24] | SVM | 94.40% | 0.930 | 92.50% | 93.50% | 0.910 | 5.60% |
| ShuffleNet [25] | SVM | 96.80% | 0.964 | 95.40% | 97.40% | 0.940 | 3.20% |
| SqueezeNet [26] | SVM | 86.83% | 0.918 | 93.30% | 90.40% | 0.890 | 13.17% |
| EfficientNetb0 [27] | SVM | 96.50% | 0.996 | 100% | 99.20% | 0.980 | 3.50% |
| Xception [28] | SVM | 98.55% | 0.996 | 100% | 99.20% | 0.980 | 1.45% |
| DarkNet-53 [29] | SVM | 96.35% | 0.928 | 92.3% | 93.30% | 0.900 | 3.65% |
| ArrhythmiaNet | SVM | 99.84% | 0.998 | 100% | 99.60% | 0.990 | 0.16% |
| Ref. | Model | ECG Signal | Arrhythmia Classes | Accuracy |
|---|---|---|---|---|
| [4] | kNN | 1D | 03 | 97.65% |
| [5] | kNN | 1D | 17 | 97.22% |
| [6] | MLP | 1D | 09 | 88.7% |
| [7] | CNN | 2D | 08 | 99.11% |
| [8] | GLCM | 1D | 06 | 90.42% |
| [10] | Attention-based CNN | 1D | 07 | 92.8% |
| [12] | CNN | 2D | 08 | 99.02% |
| [13] | SVM | 1D | 17 | 97.3% |
| [15] | CNN | 2D | 04 | 99.00% |
| [16] | SVM | 1D | 04 | 97.06% |
| [17] | SVM | 1D | 04 | 83.00% |
| This paper | ArrhythmiaNet | 2D | 17 | 99.84% |
Publisher’s Note: MDPI stays neutral with regard to jurisdictional claims in published maps and institutional affiliations. |
© 2022 by the authors. Licensee MDPI, Basel, Switzerland. This article is an open access article distributed under the terms and conditions of the Creative Commons Attribution (CC BY) license (https://creativecommons.org/licenses/by/4.0/).
Share and Cite
Jamil, S.; Rahman, M. A Novel Deep-Learning-Based Framework for the Classification of Cardiac Arrhythmia. J. Imaging 2022, 8, 70. https://doi.org/10.3390/jimaging8030070
Jamil S, Rahman M. A Novel Deep-Learning-Based Framework for the Classification of Cardiac Arrhythmia. Journal of Imaging. 2022; 8(3):70. https://doi.org/10.3390/jimaging8030070
Chicago/Turabian StyleJamil, Sonain, and MuhibUr Rahman. 2022. "A Novel Deep-Learning-Based Framework for the Classification of Cardiac Arrhythmia" Journal of Imaging 8, no. 3: 70. https://doi.org/10.3390/jimaging8030070
APA StyleJamil, S., & Rahman, M. (2022). A Novel Deep-Learning-Based Framework for the Classification of Cardiac Arrhythmia. Journal of Imaging, 8(3), 70. https://doi.org/10.3390/jimaging8030070