

Periocular Data Fusion for Age and Gender Classification


Abstract
1. Introduction
- Multi-sensor: these systems leverage multiple sensors to obtain information on a single biometric trait [2]. This strategy is particularly suitable when the sensors to grab the desired characteristic are all available and properly running.
- Multi-algorithm: the basic idea is being able to extract different characteristics from the same sample by applying different algorithms [3]. If the characteristics extracted from two different algorithms are complementary, the performance of the entire system can improve.
- Multi-instance: the advantages of this approach are lower sensitivity to noise due to the higher number of sample acquisition, greater similarities within a certain class and greater variability between them [4]. For example, in the case of iris recognition, both the left and right iris are used [5].
- Multi-sample: these systems use multiple samples of the same biometric trait, often they are captured with some variations. For example, if you want to create a facial recognition system, you can extract information from the same video, combining the data acquired from a single sensor on multiple video frames [6].
- Multi-modal: in this approach, multiple biometric traits are analyzed. It is possible to create a system that combines physical and/or behavioral characteristics. Such a choice may be more appropriate when security is crucial to protect sensitive data [7].
- According to our knowledge, this is the first paper to combine numerical data derived from the periocular area for the purposes of demographic recognition.
- Extensive testing of the optimal setup of classifiers for usage in a fusion scenario.
- An ad hoc experiment designed to evaluate the combination of the two investigated fusion techniques: feature-based and score-based fusion.
2. Related Work
2.1. Periocular Features
2.1.1. Pupil
2.1.2. Blink
2.1.3. Fixation
2.2. Data Fusion
3. Methodology
3.1. Transformation-Based Score Fusion
3.1.1. Weighted Sum
3.1.2. Weighted Product
3.1.3. Bayes Fusion Rule
3.2. Classifier-Based Score Fusion
4. Experimental Protocol
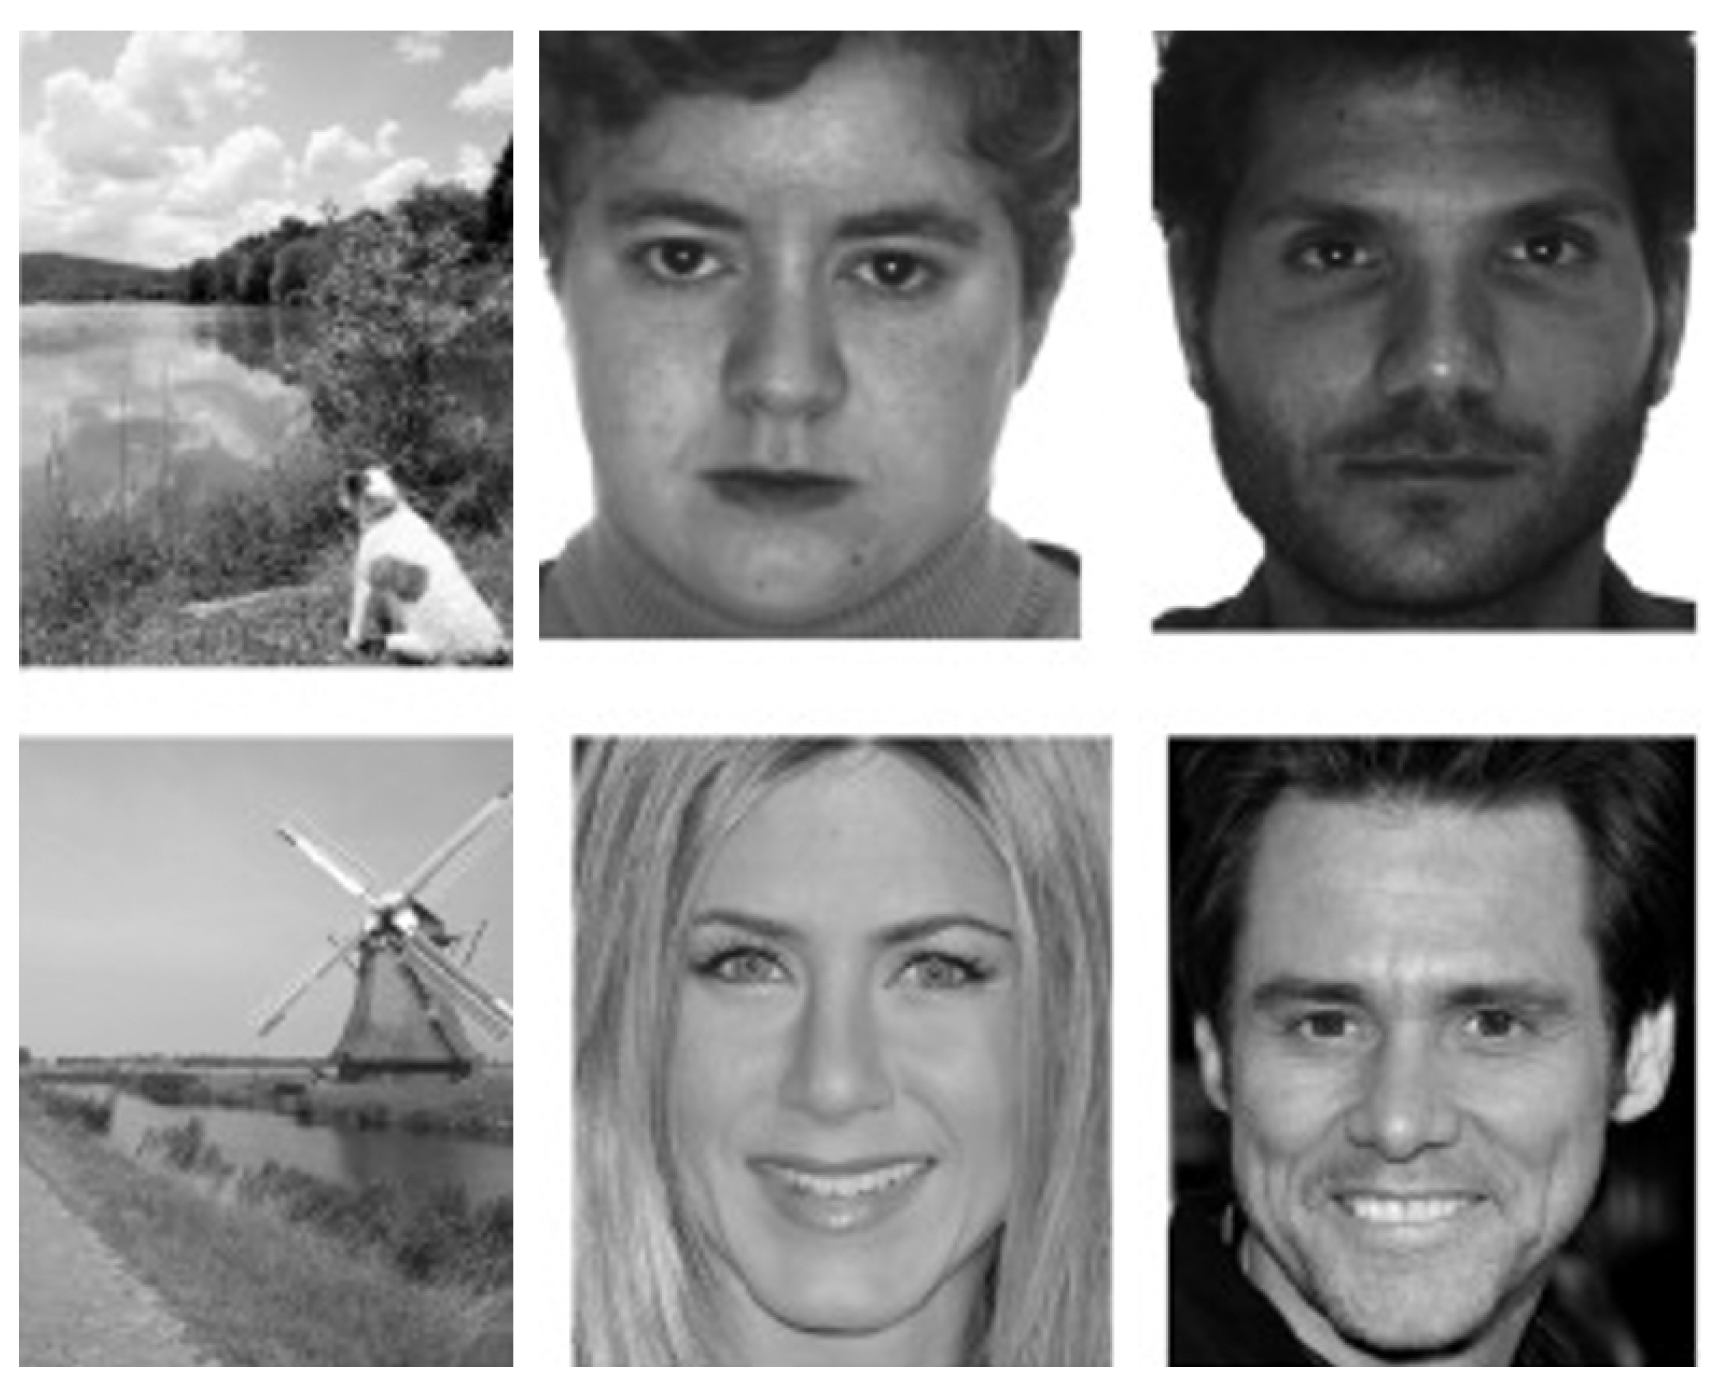
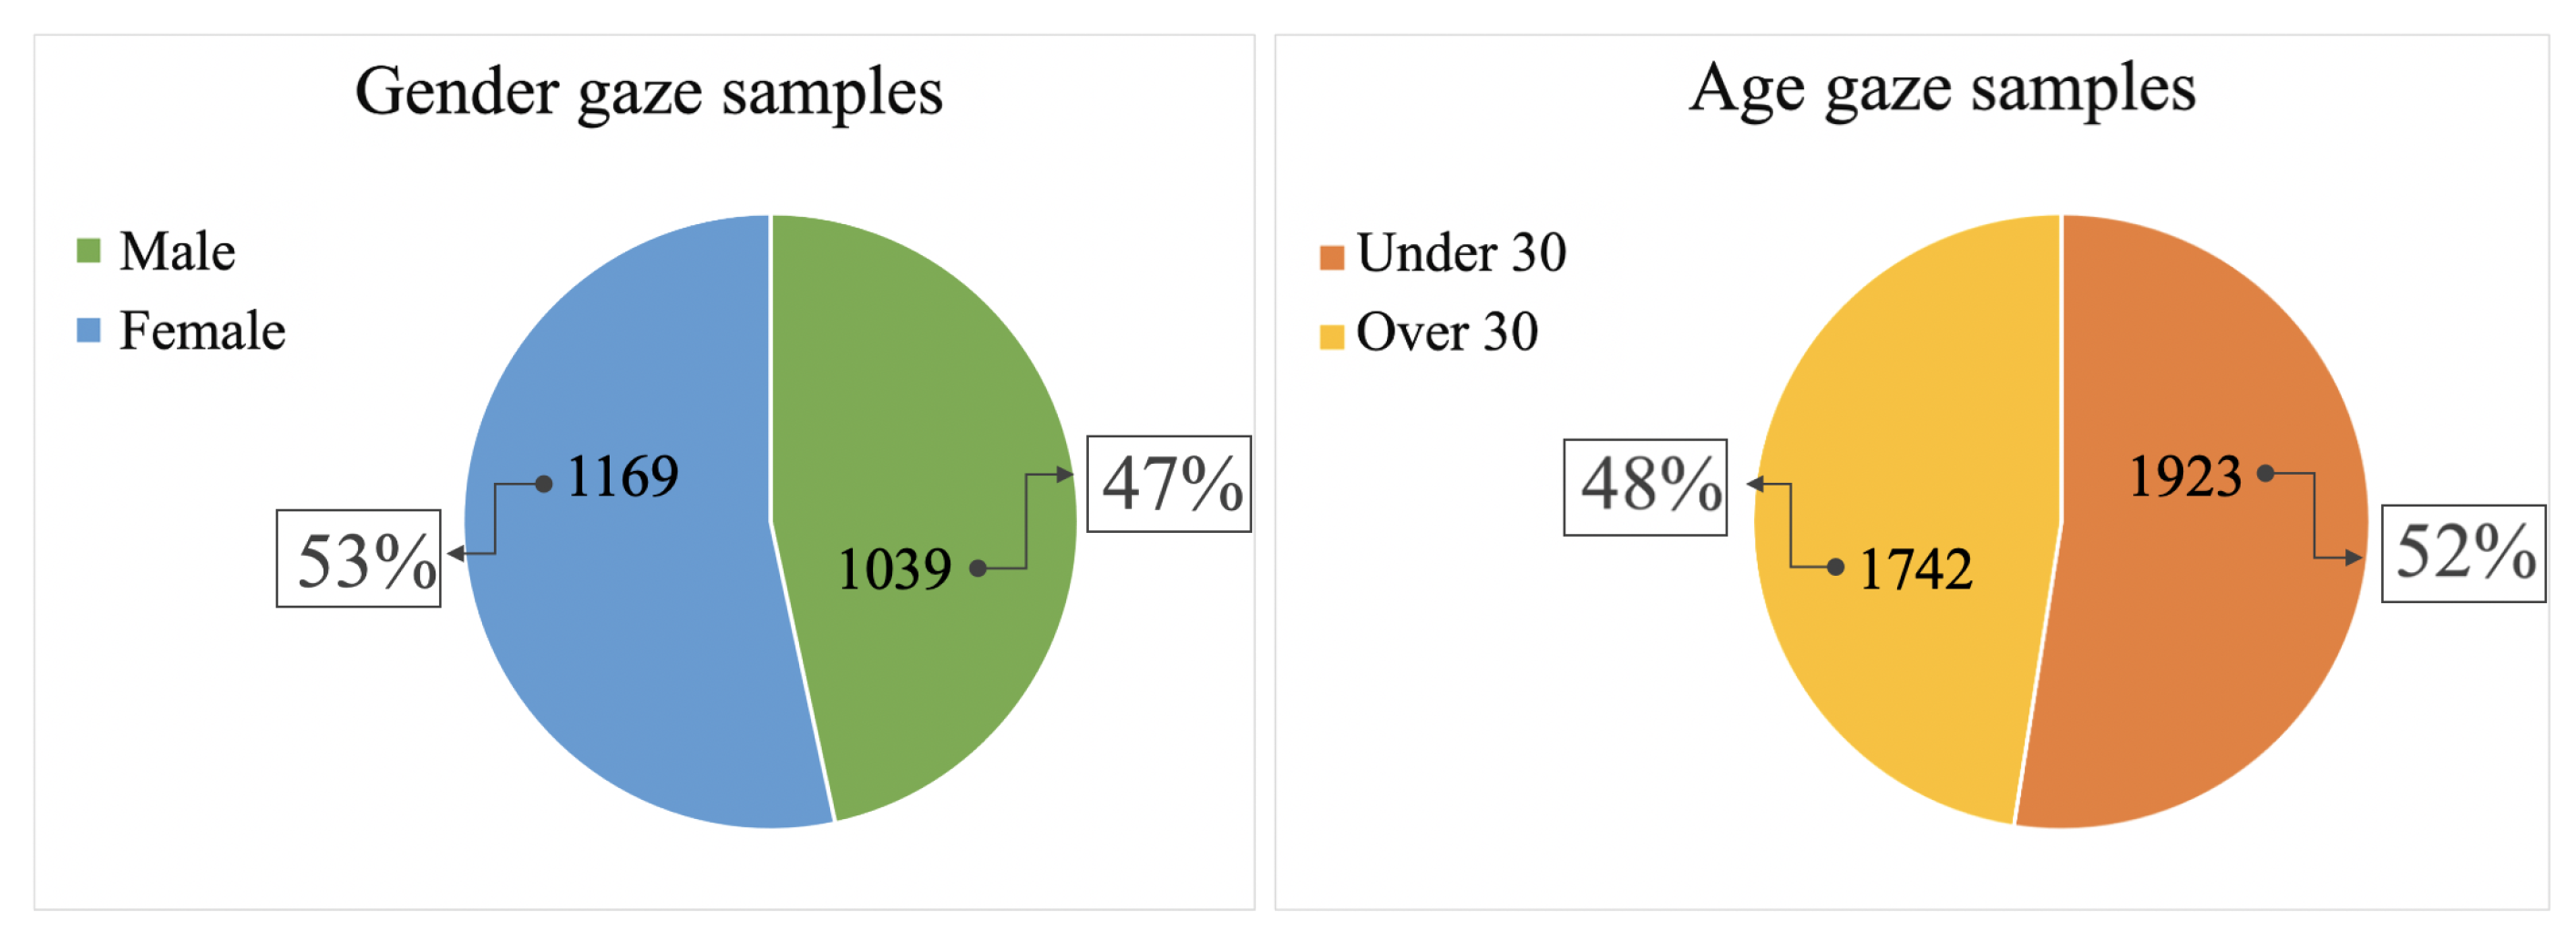
4.1. Dataset
4.2. Data Pre-Processing
4.3. Fusion Strategies Implementation
5. Discussion
6. Conclusions and Future Developments
Author Contributions
Funding
Informed Consent Statement
Data Availability Statement
Conflicts of Interest
References
- Singh, M.; Singh, R.; Ross, A. A comprehensive overview of biometric fusion. Inf. Fusion 2019, 52, 187–205. [Google Scholar] [CrossRef]
- Llano, E.; García Vázquez, M.; Vargas, J.; Fuentes, L.; Ramírez Acosta, A. Optimized robust multi-sensor scheme for simultaneous video and image iris recognition. Pattern Recognit. Lett. 2018, 101, 44–51. [Google Scholar] [CrossRef]
- Gomez-Barrero, M.; Galbally, J.; Morales, A.; Fierrez, J. Privacy-Preserving Comparison of Variable-Length Data with Application to Biometric Template Protection. IEEE Access 2017, 5, 8606–8619. [Google Scholar] [CrossRef]
- Sudhakar, T.; Gavrilova, M. Multi-instance Cancelable Biometric System using Convolutional Neural Network. In Proceedings of the 2019 International Conference on Cyberworlds (CW), Kyoto, Japan, 2–4 October 2019; pp. 287–294. [Google Scholar] [CrossRef]
- Rathgeb, C.; Busch, C. Cancelable Multi-Biometrics: Mixing Iris-Codes based on Adaptive Bloom Filters. Comput. Secur. 2014, 42. [Google Scholar] [CrossRef]
- Goswami, G.; Vatsa, M.; Singh, R. Face Verification via Learned Representation on Feature-Rich Video Frames. IEEE Trans. Inf. Forensics Secur. 2017, 12, 1686–1698. [Google Scholar] [CrossRef]
- Jamdar, S.; Golhar, Y. Implementation of unimodal to multimodal biometrie feature level fusion of combining face iris and ear in multi-modal biometric system. In Proceedings of the 2017 International Conference on Trends in Electronics and Informatics (ICEI), Tirunelveli, India, 11–12 May 2017; Volume 2018, pp. 625–629. [Google Scholar]
- Bokade, G.; Kanphade, R. Secure Multimodal Biometric Authentication Using Face, Palmprint and Ear: A Feature Level Fusion Approach. In Proceedings of the 2019 10th International Conference on Computing, Communication and Networking Technologies (ICCCNT), Kanpur, India, 6–8 July 2019. [Google Scholar]
- Sing, J.; Dey, A.; Ghosh, M. Confidence factor weighted Gaussian function induced parallel fuzzy rank-level fusion for inference and its application to face recognition. Inf. Fusion 2019, 47, 60–71. [Google Scholar] [CrossRef]
- Kumar, A.; Kumar, A. Adaptive management of multimodal biometrics fusion using ant colony optimization. Inf. Fusion 2016, 32, 49–63. [Google Scholar] [CrossRef]
- Algashaam, F.; Nguyen, K.; Banks, J.; Chandran, V.; Do, T.A.; Alkanhal, M. Hierarchical fusion network for periocular and iris by neural network approximation and sparse autoencoder. Mach. Vis. Appl. 2021, 32, 15. [Google Scholar] [CrossRef]
- Goshvarpour, A.; Goshvarpour, A. Gender and age classification using a new Poincare section-based feature set of ECG. Signal Image Video Process. 2019, 13, 531–539. [Google Scholar] [CrossRef]
- Htet, K.S.; Myint Sein, M. Effective Marketing Analysis on Gender and Age Classification with Hyperparameter Tuning. In Proceedings of the 2020 IEEE 2nd Global Conference on Life Sciences and Technologies (LifeTech), Kyoto, Japan, 10–12 March 2020; pp. 247–248. [Google Scholar] [CrossRef]
- Barra, P.; Bisogni, C.; Nappi, M.; Freire-Obregón, D.; Castrillón-Santana, M. Gender classification on 2D human skeleton. In Proceedings of the 2019 3rd International Conference on Bio-Engineering for Smart Technologies (BioSMART), Paris, France, 24–26 April 2019; pp. 1–4. [Google Scholar]
- Barra, P.; Bisogni, C.; Nappi, M.; Freire-Obregón, D.; Castrillón-Santana, M. Gait Analysis for Gender Classification in Forensics. Commun. Comput. Inf. Sci. 2019, 1123, 180–190. [Google Scholar]
- Langer, K.; Hagedorn, B.; Stock, L.M.; Otto, T.; Wolf, O.; Jentsch, V. Acute stress improves the effectivity of cognitive emotion regulation in men. Sci. Rep. 2020, 10, 11571. [Google Scholar] [CrossRef] [PubMed]
- Guillon, M.; Dumbleton, K.; Theodoratos, P.; Gobbe, M.; Wooley, C.; Moody, K. The effects of age, refractive status, and luminance on pupil size. Optom. Vis. Sci. 2016, 93, 1093–1100. [Google Scholar] [CrossRef] [PubMed]
- Cantoni, V.; Cascone, L.; Nappi, M.; Porta, M. Demographic classification through pupil analysis. Image Vis. Comput. 2020, 102. [Google Scholar] [CrossRef]
- Cascone, L.; Medaglia, C.; Nappi, M.; Narducci, F. Pupil size as a soft biometrics for age and gender classification. Pattern Recognit. Lett. 2020, 140, 238–244. [Google Scholar] [CrossRef]
- Sakai, T.; Tamaki, H.; Ota, Y.; Egusa, R.; Inagaki, S.; Kusunoki, F.; Sugimoto, M.; Mizoguchi, H. EDA-based estimation of visual attention by observation of eye blink frequency. Int. J. Smart Sens. Intell. Syst. 2017, 10, 296–307. [Google Scholar] [CrossRef]
- Peddireddy, A.; Wang, K.; Svensson, P.; Arendt-Nielsen, L. Influence of age and gender on the jaw-stretch and blink reflexes. Exp. Brain Res. 2006, 171, 530–540. [Google Scholar] [CrossRef]
- Millen, A.E.; Hope, L.; Hillstrom, A.P.; Vrij, A. Tracking the truth: The effect of face familiarity on eye fixations during deception. Q. J. Exp. Psychol. 2017, 70, 930–943. [Google Scholar] [CrossRef]
- Moss, F.J.M.; Baddeley, R.; Canagarajah, N. Eye movements to natural images as a function of sex and personality. PLoS ONE 2012, 7, e47870. [Google Scholar]
- El-Rahiem, B.A.; El-Samie, F.E.A.; Amin, M. Multimodal biometric authentication based on deep fusion of electrocardiogram (ECG) and finger vein. Multimed. Syst. 2022, 28, 1325–1337. [Google Scholar] [CrossRef]
- Kabir, W.; Ahmad, M.O.; Swamy, M. A multi-biometric system based on feature and score level fusions. IEEE Access 2019, 7, 59437–59450. [Google Scholar] [CrossRef]
- Huber, M.F.; Merentitis, A.; Heremans, R.; Niessen, M.; Debes, C.; Frangiadakis, N. Bayesian Score Level Fusion for Facial Recognition. In Proceedings of the 2016 IEEE International Conference on Multisensor Fusion and Integration for Intelligent Systems (MFI), Baden-Baden, Germany, 19–21 September 2016. [Google Scholar]
- Akhtar, Z.; Fumera, G.; Marcialis, G.L.; Roli, F. Evaluation of multimodal biometric score fusion rules under spoof attacks. In Proceedings of the 2012 5th IAPR International Conference on Biometrics (ICB), New Delhi, India, 29 March–1 April 2012; pp. 402–407. [Google Scholar] [CrossRef]
- Kim, W.; Song, J.; Park, K. Multimodal biometric recognition based on convolutional neural network by the fusion of finger-vein and finger shape using near-infrared (NIR) camera sensor. Sensors 2018, 18, 2296. [Google Scholar] [CrossRef] [PubMed]
- Swain, P.H.; Hauska, H. Decision tree classifier: Design and potential. IEEE Trans. Geosci. Electron. 1977, GE-15, 142–147. [Google Scholar] [CrossRef]
- Breiman, L. Random forests. Mach. Learn. 2001, 45, 5–32. [Google Scholar] [CrossRef]
- Dietterich, T. Ensemble methods in machine learning. In Lecture Notes in Computer Science (Including Subseries Lecture Notes in Artificial Intelligence and Lecture Notes in Bioinformatics); Springer: Berlin/Heidelberg, Germany, 2000; pp. 1–15. [Google Scholar]
- Brown, I.; Mues, C. An experimental comparison of classification algorithms for imbalanced credit scoring data sets. Expert Syst. Appl. 2012, 39, 3446–3453. [Google Scholar] [CrossRef]
- Staal, J.; Abràmoff, M.; Niemeijer, M.; Viergever, M.; Van Ginneken, B. Ridge-based vessel segmentation in color images of the retina. IEEE Trans. Med. Imaging 2004, 23, 501–509. [Google Scholar] [CrossRef]
- Hsu, C.W.; Lin, C.J. A comparison of methods for multiclass support vector machines. IEEE Trans. Neural Netw. 2002, 13, 415–425. [Google Scholar]
- Kivinen, J.; Smola, A.; Williamson, R. Online learning with kernels. IEEE Trans. Signal Process. 2004, 52, 2165–2176. [Google Scholar] [CrossRef]
- Cantoni, V.; Galdi, C.; Nappi, M.; Porta, M.; Riccio, D. GANT: Gaze analysis technique for human identification. Pattern Recognit. 2015, 48, 1027–1038. [Google Scholar] [CrossRef]


| Spearman’s Correlation Coefficients | |
|---|---|
| Blink-pupil | 0.1439 |
| Blink-fixation | −0.0992 |
| Fixation-pupil | 0.0644 |
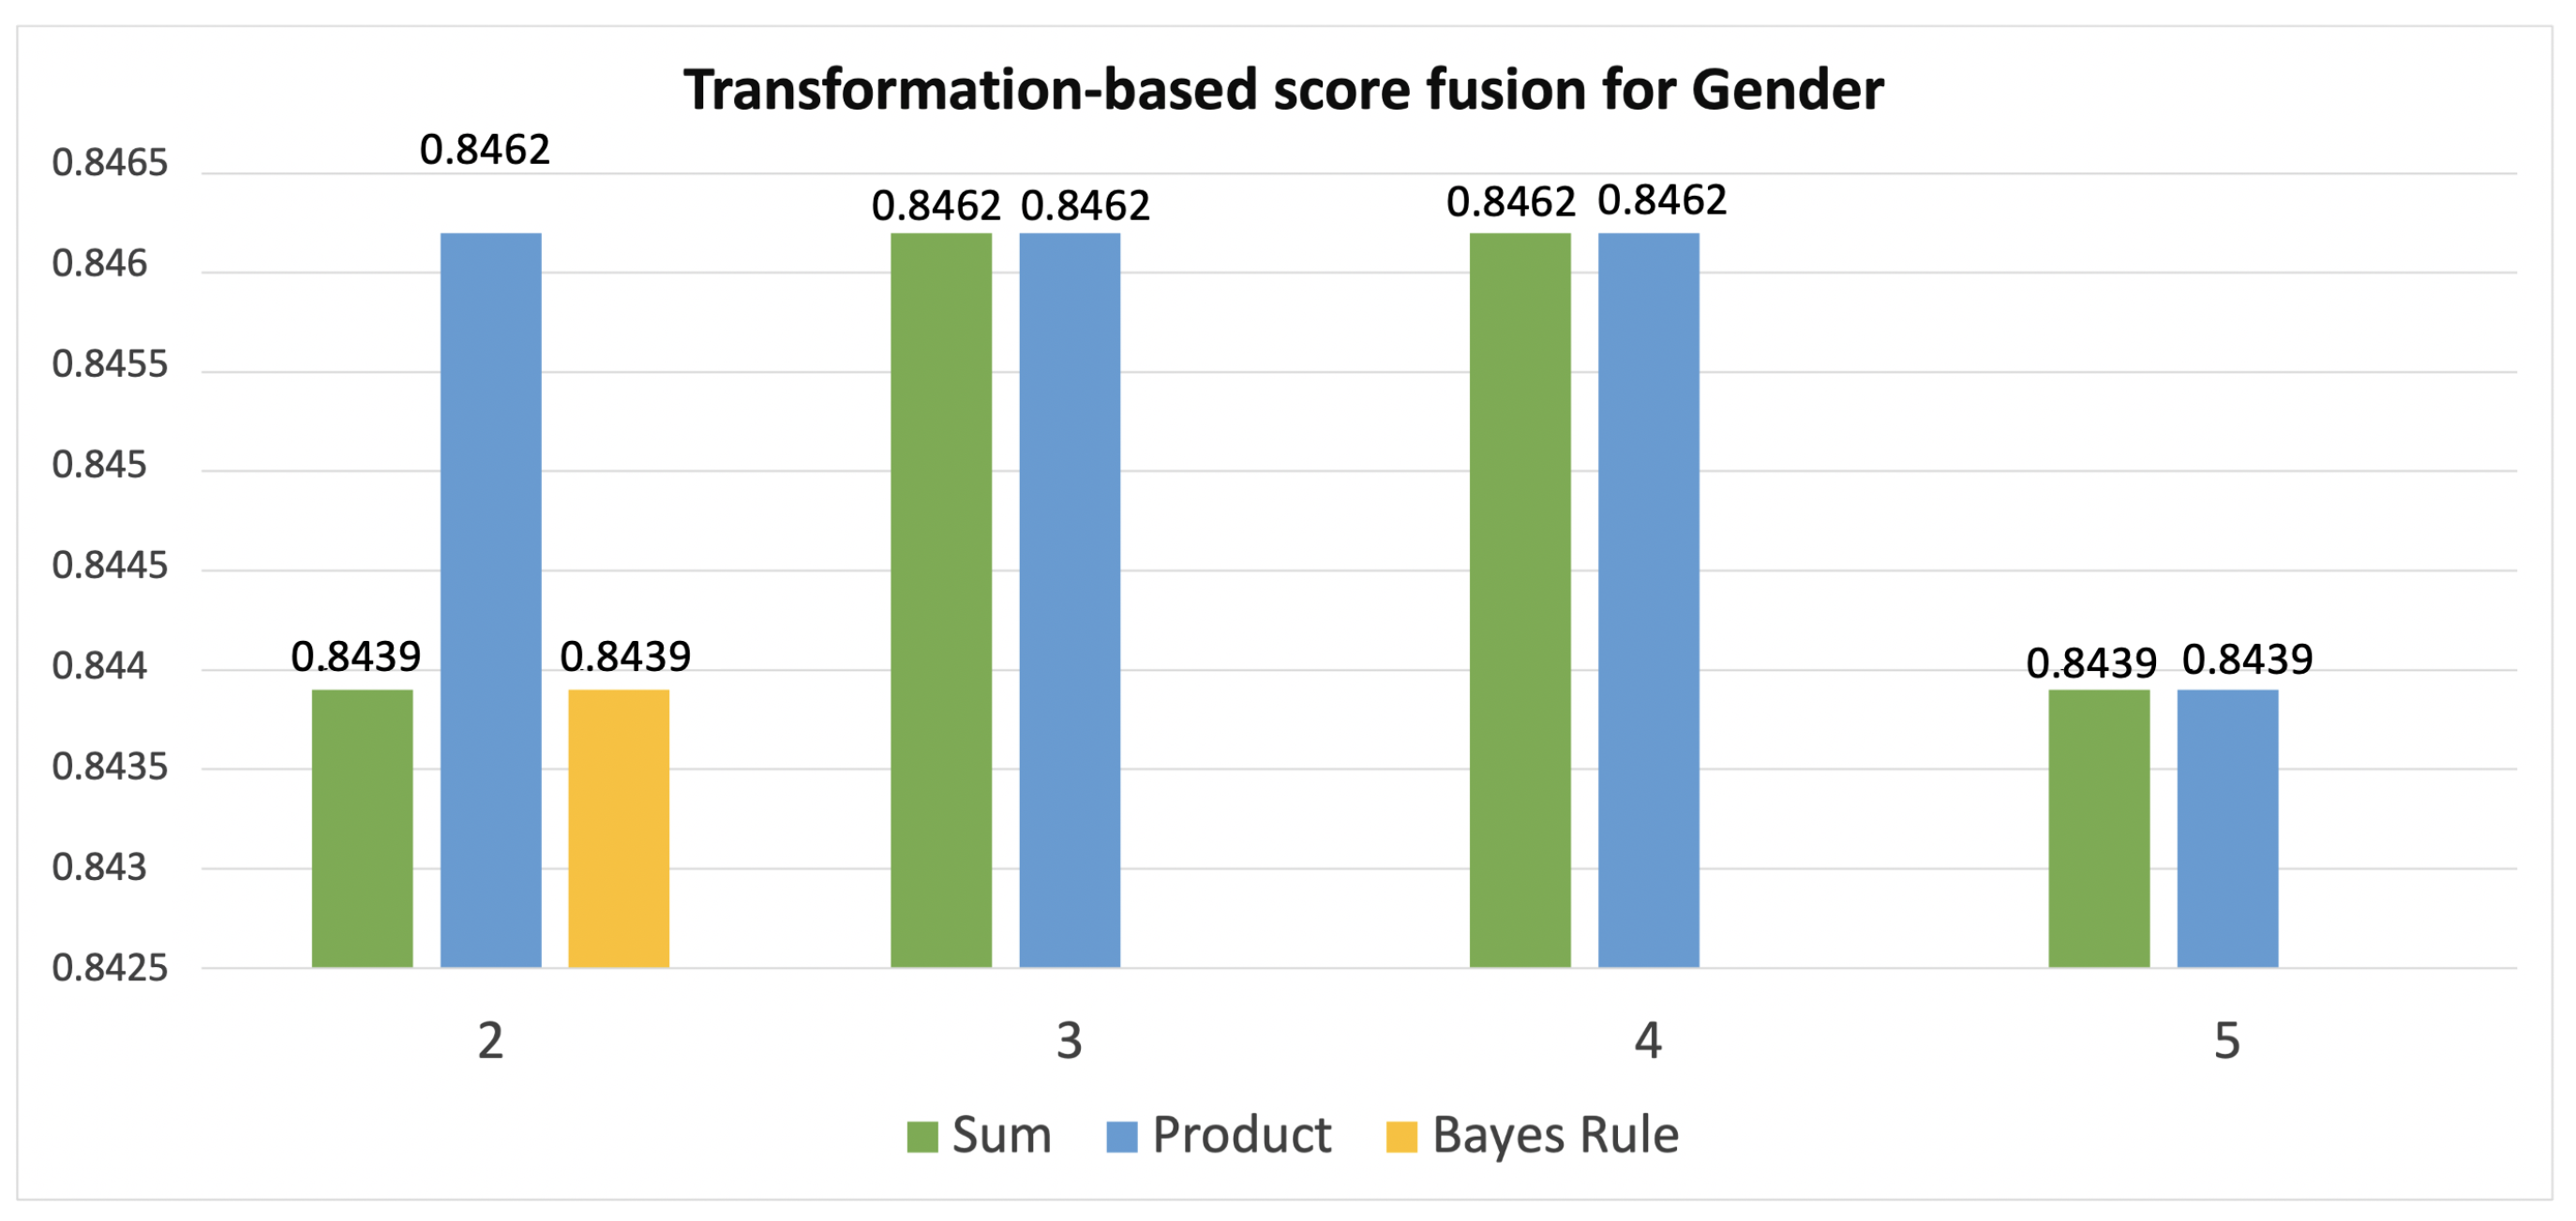
| Transformation-Based Score Fusion for Gender | |||
|---|---|---|---|
| n | Combination of Classifiers | Acc. | |
| Sum | 2 | GB&SVM SVM&KNN | 0.8439 |
| 3 | GB&SVM&RF GB&SVM&BG | 0.8462 | |
| 4 | GB&SVM&RF&BG | 0.8462 | |
| 5 | GB&SVM&RF&BG&KNN | 0.8439 | |
| Prod | 2 | GB&SVM | 0.8462 |
| 3 | GB&SVM&BG | 0.8462 | |
| 4 | GB&SVM&BG&RF | 0.8462 | |
| 5 | GB&SVM&RF&BG&KNN | 0.8439 | |
| Bayes Rule | 2 | GB&SVM SVM&KNN | 0.8439 |
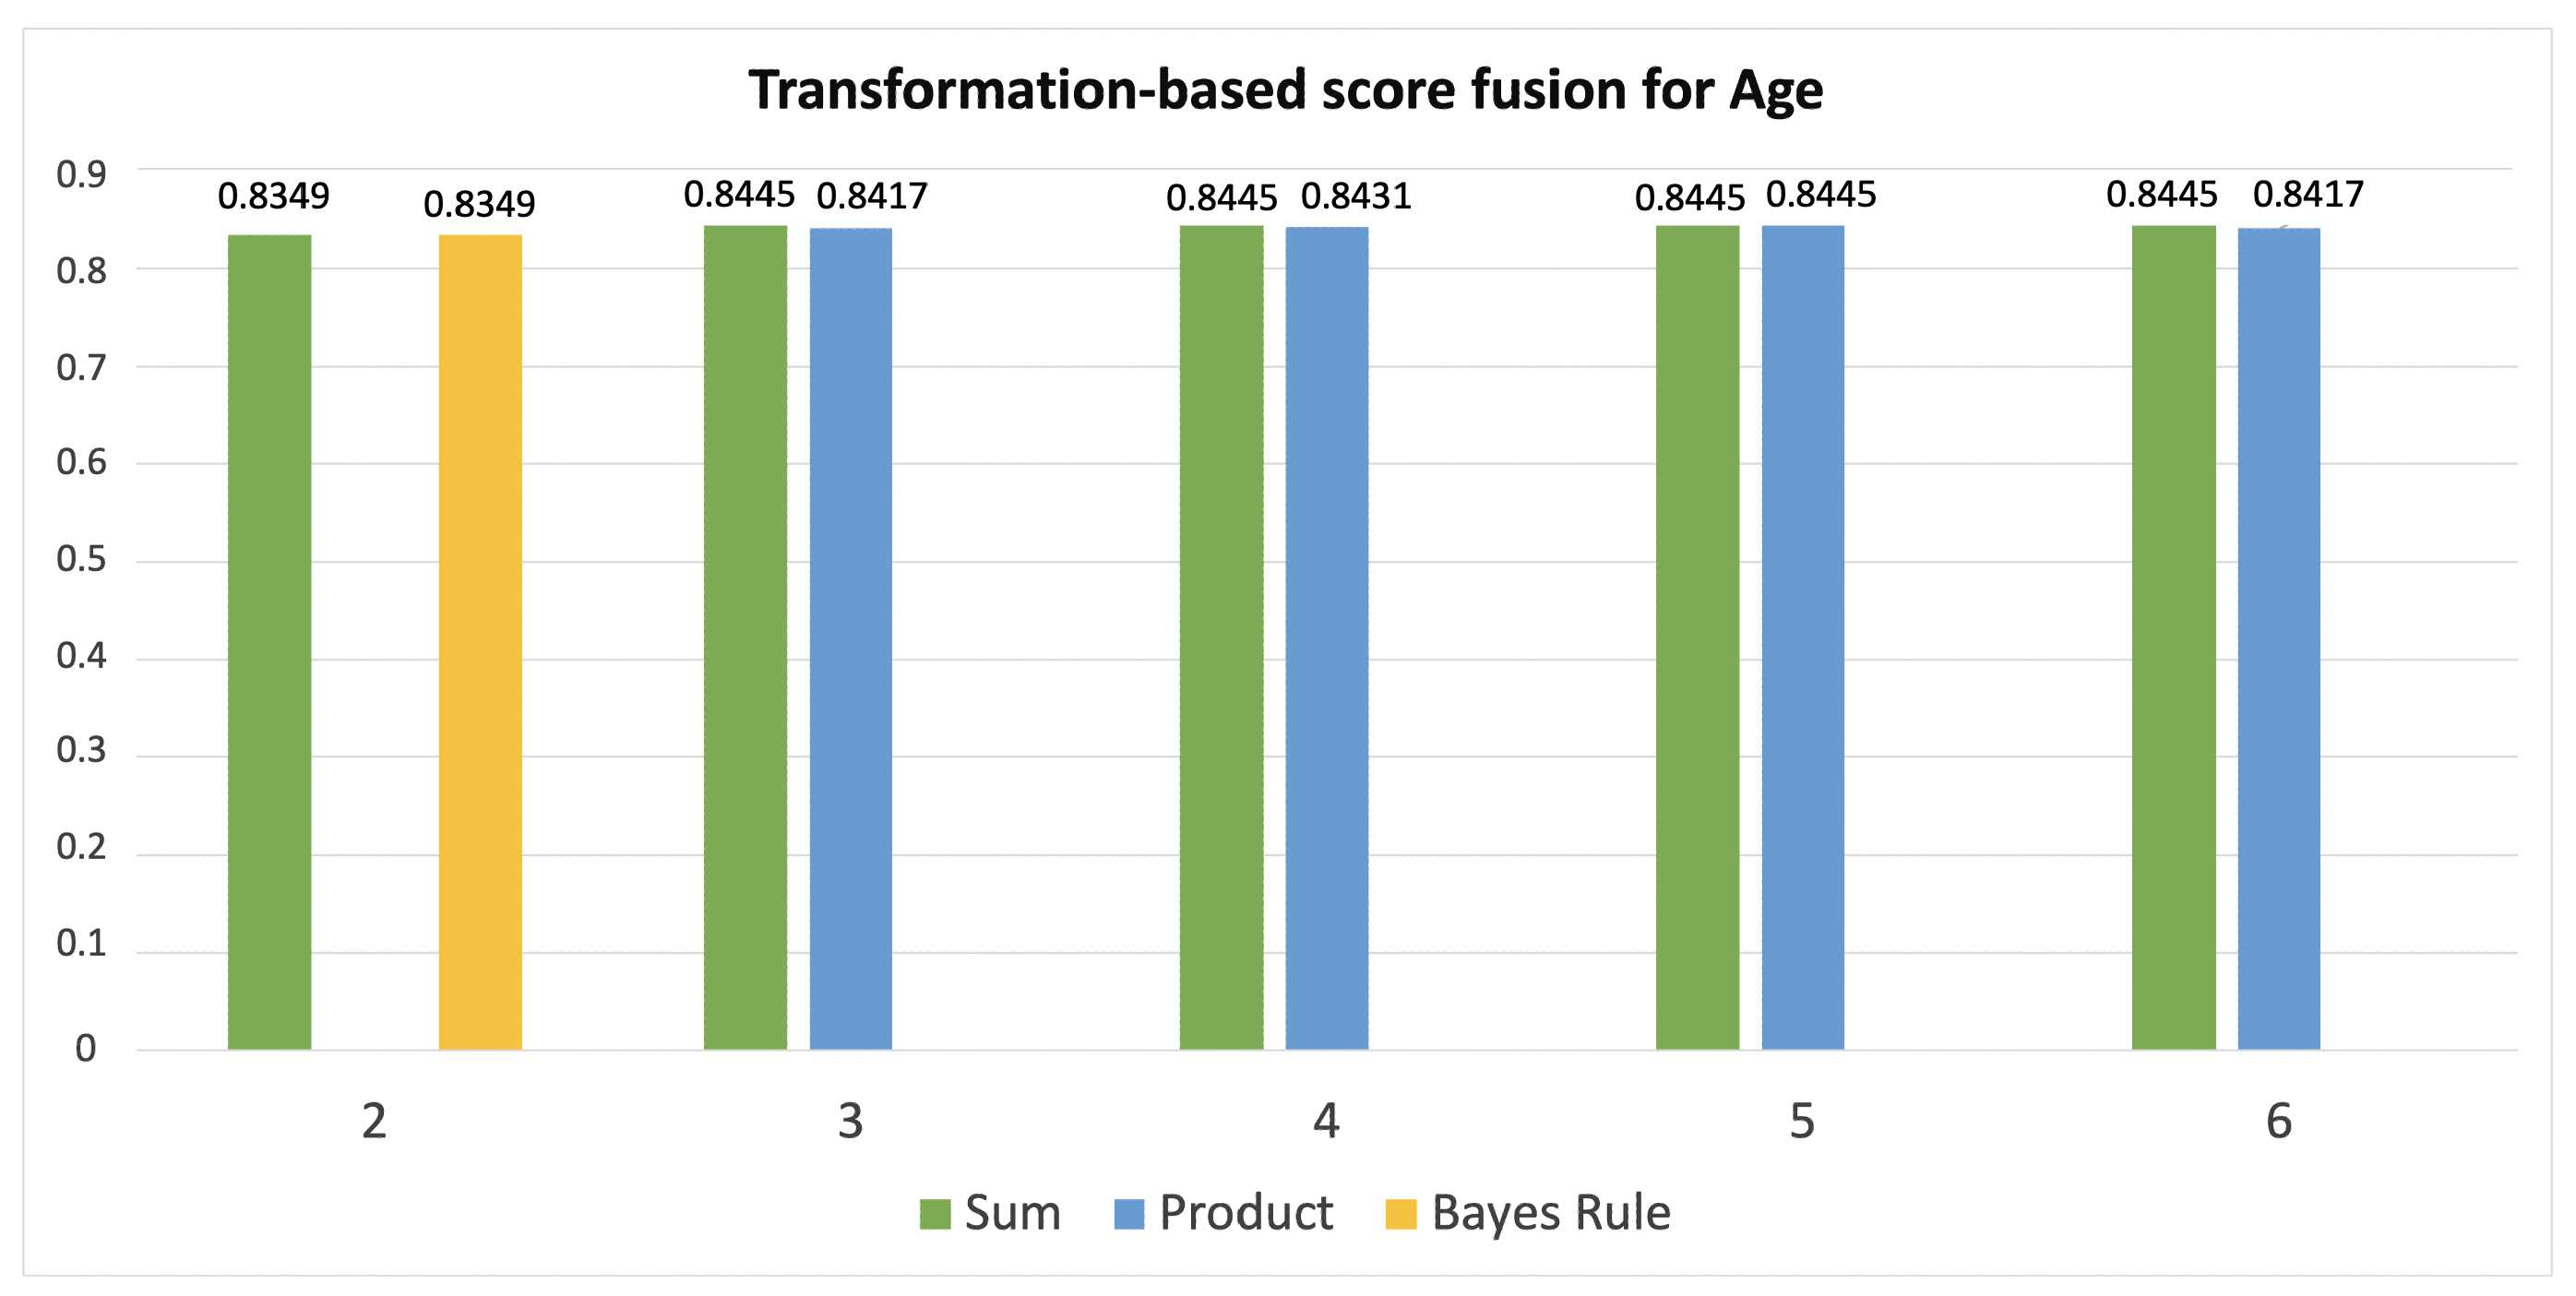
| Transformation-Based Score Fusion for Age | |||
|---|---|---|---|
| n | Combination of Classifiers | Acc. | |
| Sum | 2 | RF&SVM GB&SVM | 0.8349 |
| 3 | GB&SVM&DT | 0.8445 | |
| 4 | SVM&KNN&DT&RF | 0.8445 | |
| 5 | GB&SVM&DT&KNN&RF GB&SVM&DT&KNN&BG | 0.8445 | |
| 6 | GB&KNN&DT&BG&SVM&RF | 0.8445 | |
| Prod | 2 | - | - |
| 3 | RF&SVM&DT GB&SVM&DT SVM&DT&BG | 0.8417 | |
| 4 | GB&SVM&KNN&DT SVM&KNN&DT&RF SVM&BG&DT&RF | 0.8431 | |
| 5 | SVM&BG&DT&RF&KNN | 0.8445 | |
| 6 | GB&SVM&BG&DT&RF&KNN | 0.8417 | |
|
Bayes Rule | 2 | RF&SVM | 0.8349 |
| Age Classification without Concatenation | |||||
|---|---|---|---|---|---|
| Fixation | Pupil | Blink | Classifiers | k | Acc. |
| X | X | X | KNN | 2 | 0.8 |
| X | X | KNN | 5 | 0.8091 | |
| X | X | AD | 3 | 0.6182 | |
| X | X | DT | 2 | 0.7818 | |
| BG | 10 | ||||
| SVM | 3 | ||||
| Gender Classification without Concatenation | ||||||
|---|---|---|---|---|---|---|
| Fixation | Pupil | Blink_1 | Blink_2 | Classifiers | k | Acc. |
| X | X | X | SGD | 4 | 0.8346 | |
| X | X | X | SVM | 3 | 0.8421 | |
| X | X | KNN | 6 | 0.7894 | ||
| X | X | KNN | 9 | 0.7669 | ||
| X | X | SVM | 3 | 0.7970 | ||
| X | X | SVM | 2 | 0.8045 | ||
| KNN | 3 | |||||
| AD | 2 | |||||
| X | X | KNN | 3 | 0.7970 | ||
| Transformation-Based Score Fusion for Gender without Concatenation | ||||
|---|---|---|---|---|
| Combination of Classifiers | Acc. | |||
| Fixation | Pupil | Blink | ||
| Sum | RF | SVM | BG | 0.8054 |
| RF | SVM | DT | 0.8167 | |
| Prod | RF | SVM | BG | 0.7443 |
| RF | SVM | DT | 0.7511 | |
|
Bayes Rule | RF | SVM | 0.7579 | |
| RF | BG | 0.6923 | ||
| RF | DT | 0.7059 | ||
| SVM | BG | 0.7624 | ||
| SVM | DT | 0.7851 | ||
| Transformation-Based Score Fusion for Age without Concatenation | ||||
|---|---|---|---|---|
| Combination of Classifiers | Acc. | |||
| Fixation | Pupil | Blink | ||
| Sum | SVM | BG | KNN | 0.7913 |
| Prod | SVM | BG | KNN | 0.7763 |
|
Bayes Rule | SVM | BG | 0.7804 | |
| SVM | KNN | 0.5921 | ||
| BG | KNN | 0.7844 | ||
| Summary Table: Best Results | |||||||
|---|---|---|---|---|---|---|---|
| Strategy | Features | Classifiers | k | Acc. | |||
| Age Classification | First classification | Blink | KNN | 10 | 0.5921 | ||
| Fixation | SVM | 3 | 0.5853 | ||||
| Pupil | BG | 4 | 0.7872 | ||||
| All | RF | 6 | 0.8336 | ||||
| Fusion | Sum | with conc. | All | GB&SVM&DT SVM&KNN&DT&RF GB&SVM&DT&KNN&BG GB&SVM&DT&KNN&RF | - | 0.8445 | |
| without conc. | Fixation Pupil Blink | SVM&BG&KNN | - | 0.7913 | |||
| Prod. | with conc. | All | SVM&DT&KNN&BG&RF | - | 0.8445 | ||
| without conc. | Fixation Pupil Blink | SVM&BG&KNN | 0.7763 | ||||
| Bayes | with conc. | All | RF&SVM | - | 0.8349 | ||
| without conc. | Pupil Blink | BG&KNN | - | 0.7844 | |||
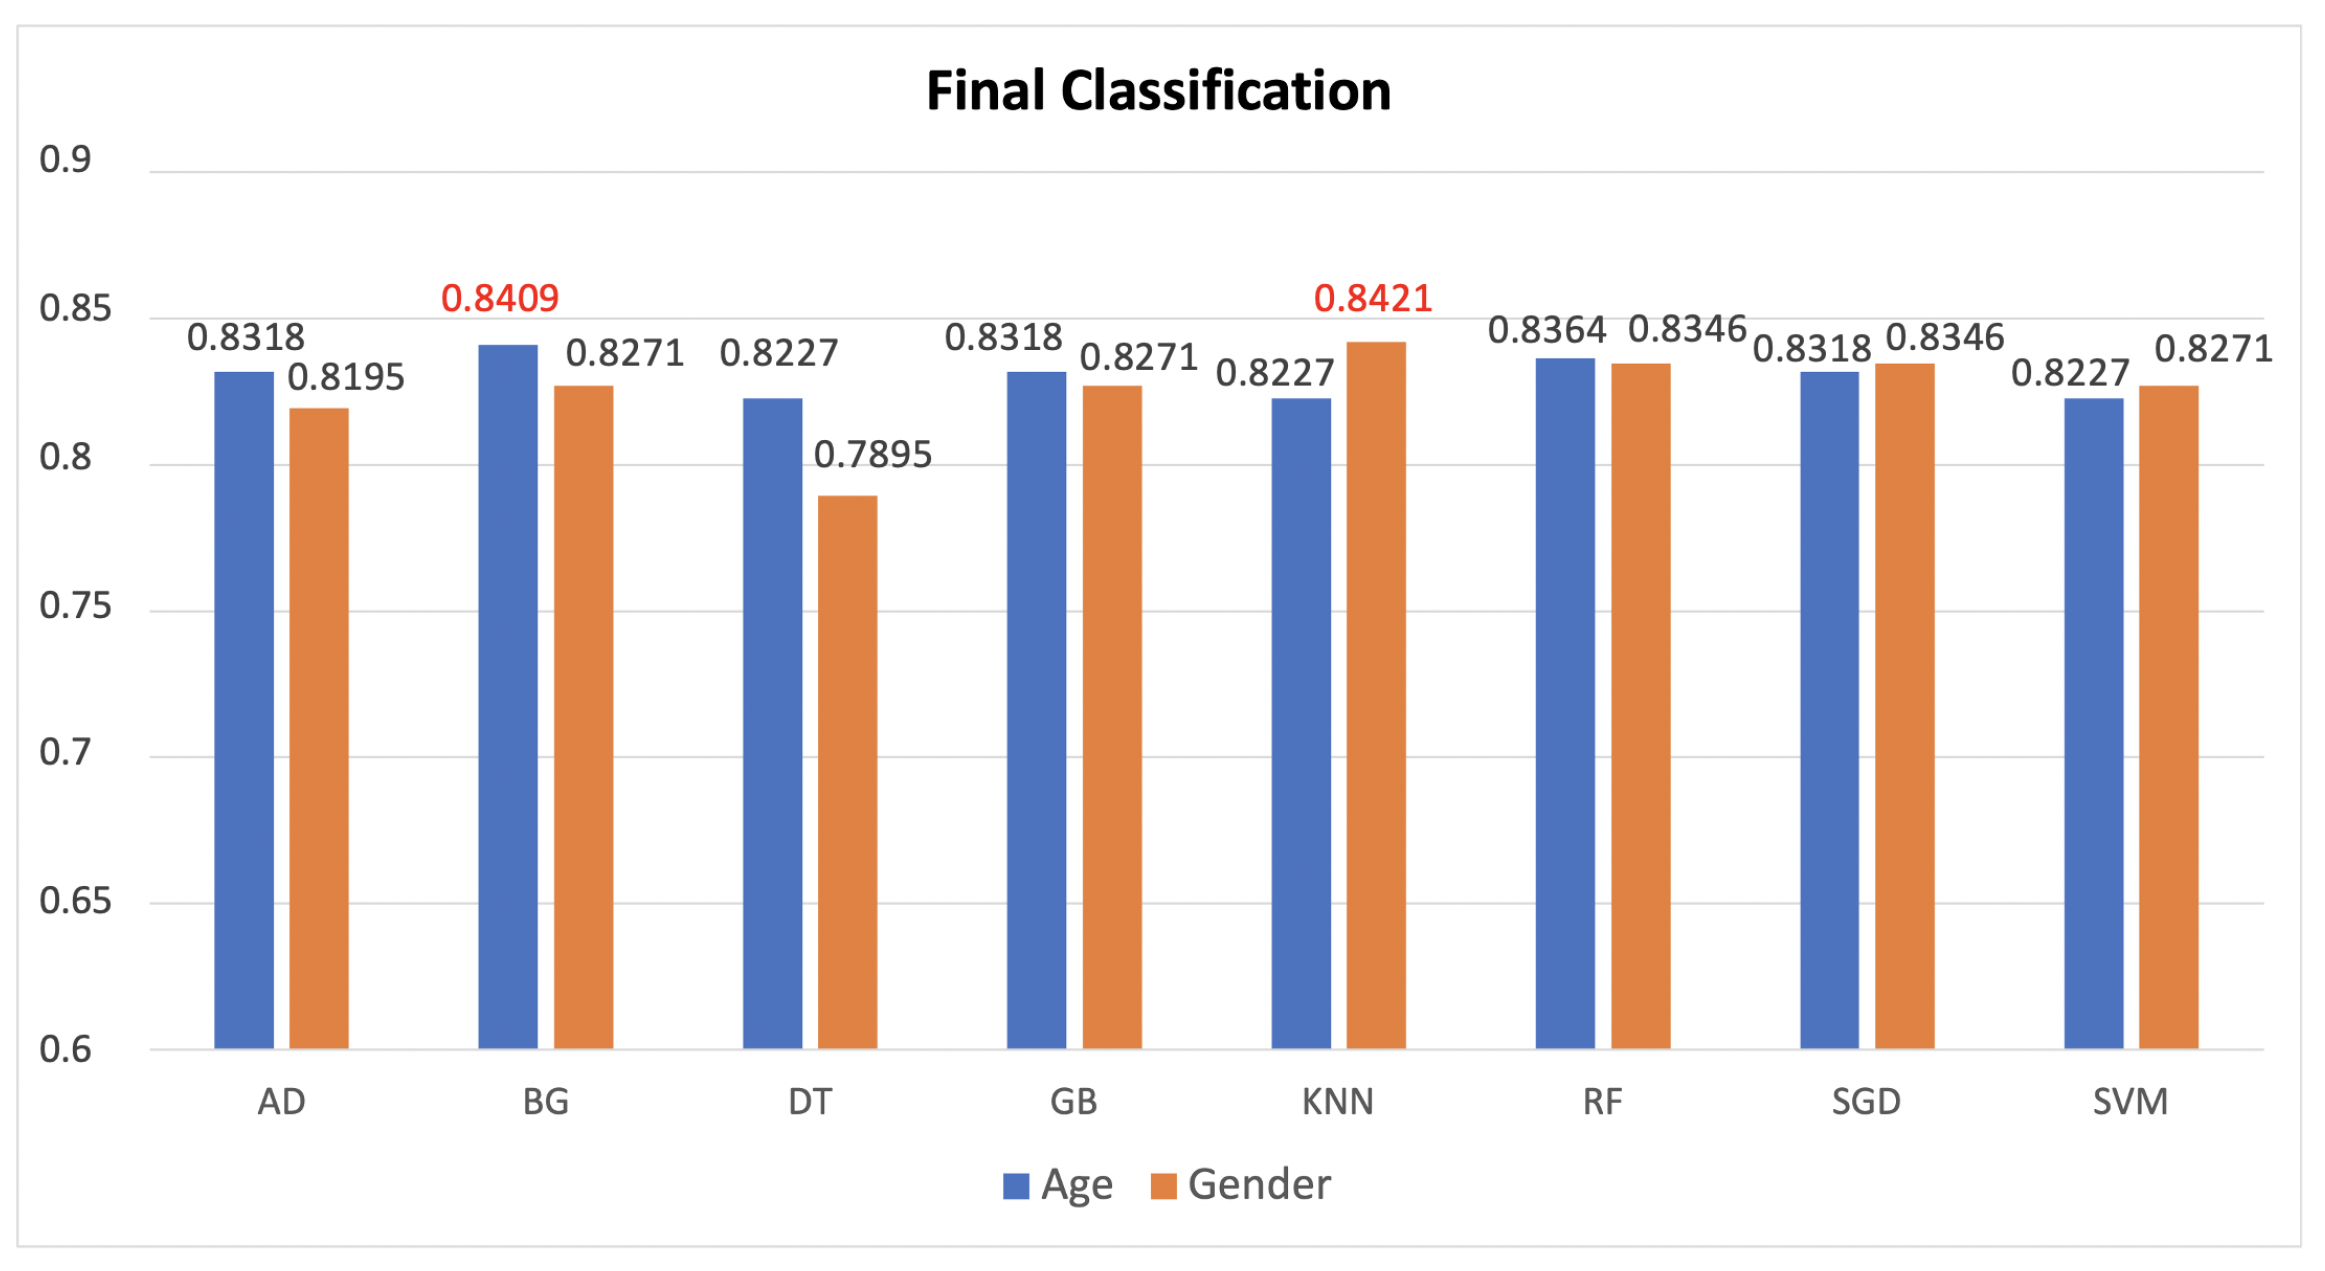
| Classifiers | with conc. | All | BG | 7 | 0.8409 | ||
| without conc. | Pupil Blink | KNN | 5 | 0.8091 | |||
| [8] | Pupil | Multilayer perceptron | - | 0.8369 | |||
| Gender Classification | First classification | Blink | BG DT | 8 6 | 0.6357 | ||
| Fixation | RF | 6 | 0.6244 | ||||
| Pupil | SVM | 2 | 0.7579 | ||||
| All | GB | 2 | 0.8326 | ||||
| Fusion | Sum | with conc. | All | GB&SVM&BG GB&SVM&RF GB&SVM&RF&BG | - | 0.8462 | |
| without conc. | Fixation Pupil Blink | RF&SVM&DT | - | 0.81674 | |||
| Prod. | with conc. | All | GB&SVM GB&SVM&BG GB&SVM&RF&BG | - | 0.8462 | ||
| without conc. | Fixation Pupil Blink | RF&SVM&DT | - | 0.7511 | |||
| Bayes | with conc. | All | GB&SVM SVM&KNN | - | 0.8439 | ||
| without conc. | Pupil Blink | SVM&DT | - | 0.7851 | |||
| Classifiers | with conc. | All | KNN | 4 | 0.8421 | ||
| without conc. | Fixation Pupil Blink | SVM | 3 | 0.8421 | |||
| [8] | Pupil | SGD | - | 0.5848 | |||
Publisher’s Note: MDPI stays neutral with regard to jurisdictional claims in published maps and institutional affiliations. |
© 2022 by the authors. Licensee MDPI, Basel, Switzerland. This article is an open access article distributed under the terms and conditions of the Creative Commons Attribution (CC BY) license (https://creativecommons.org/licenses/by/4.0/).
Share and Cite
Bisogni, C.; Cascone, L.; Narducci, F. Periocular Data Fusion for Age and Gender Classification. J. Imaging 2022, 8, 307. https://doi.org/10.3390/jimaging8110307
Bisogni C, Cascone L, Narducci F. Periocular Data Fusion for Age and Gender Classification. Journal of Imaging. 2022; 8(11):307. https://doi.org/10.3390/jimaging8110307
Chicago/Turabian StyleBisogni, Carmen, Lucia Cascone, and Fabio Narducci. 2022. "Periocular Data Fusion for Age and Gender Classification" Journal of Imaging 8, no. 11: 307. https://doi.org/10.3390/jimaging8110307
APA StyleBisogni, C., Cascone, L., & Narducci, F. (2022). Periocular Data Fusion for Age and Gender Classification. Journal of Imaging, 8(11), 307. https://doi.org/10.3390/jimaging8110307