
Phase Composition and Its Spatial Distribution in Antique Copper Coins: Neutron Tomography and Diffraction Studies

 ,
,
Abstract
:1. Introduction
2. Materials and Methods
2.1. The Coins Description
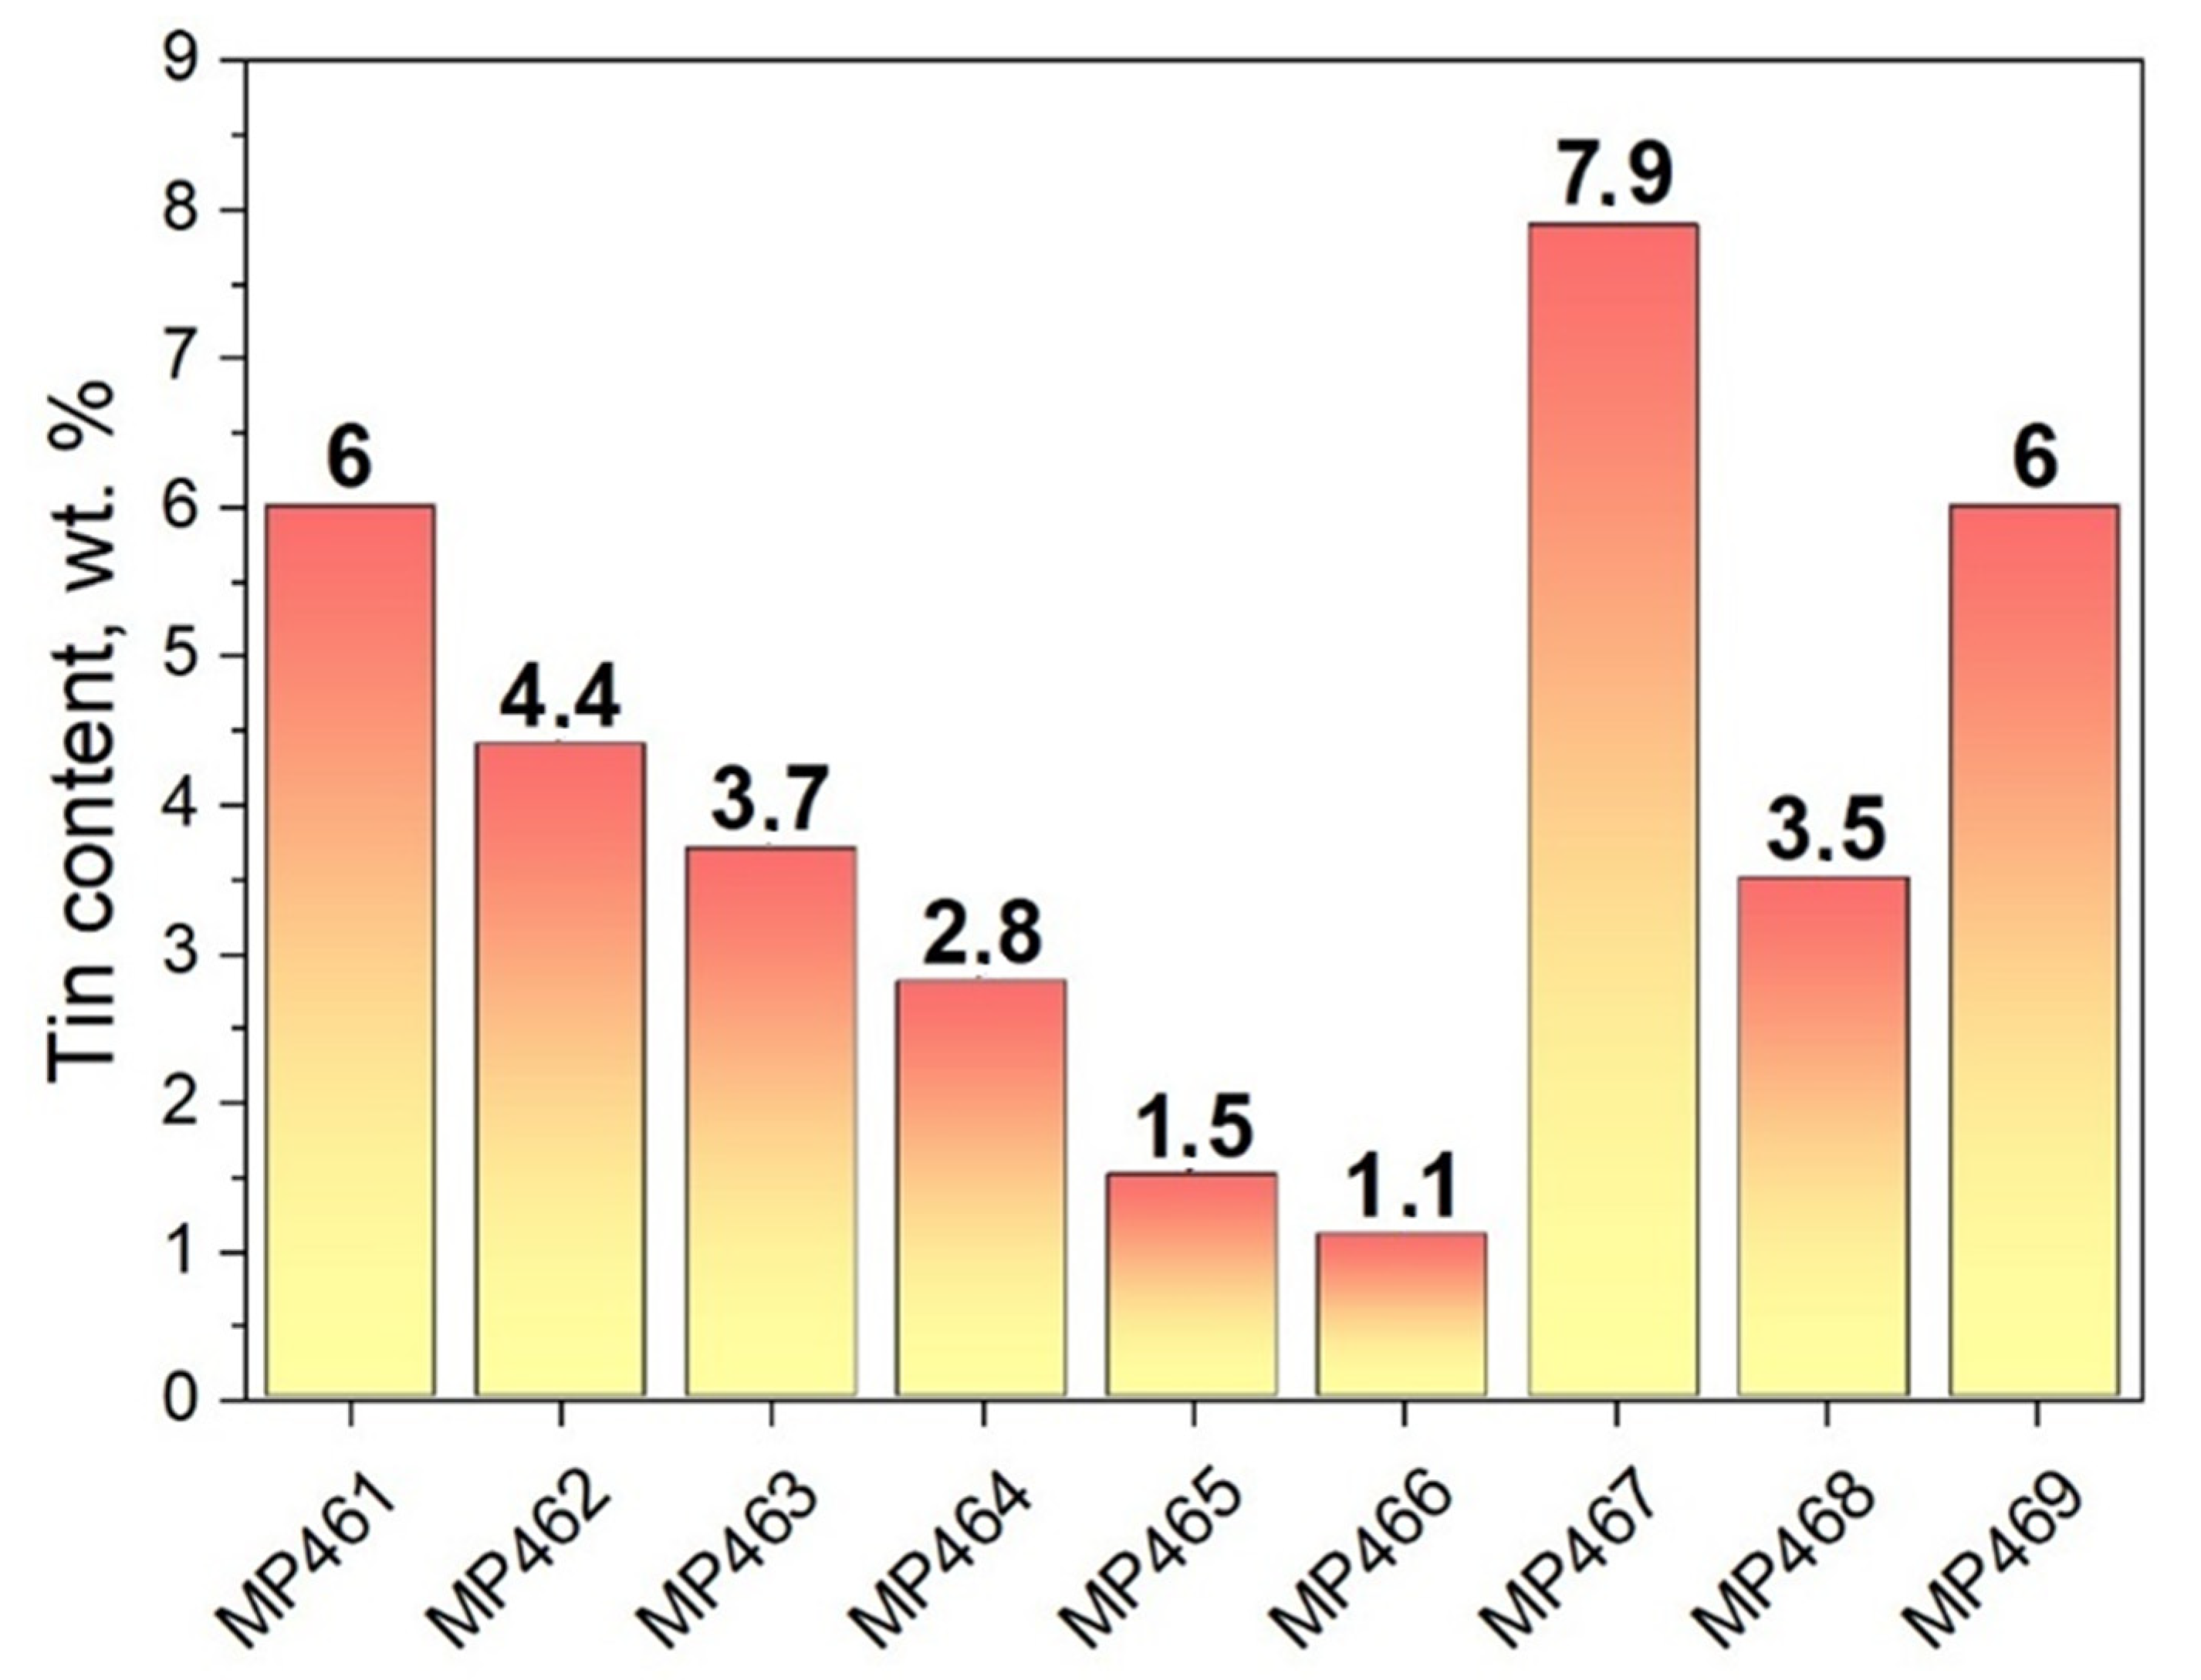
2.2. X-ray Fluoresce Analysis
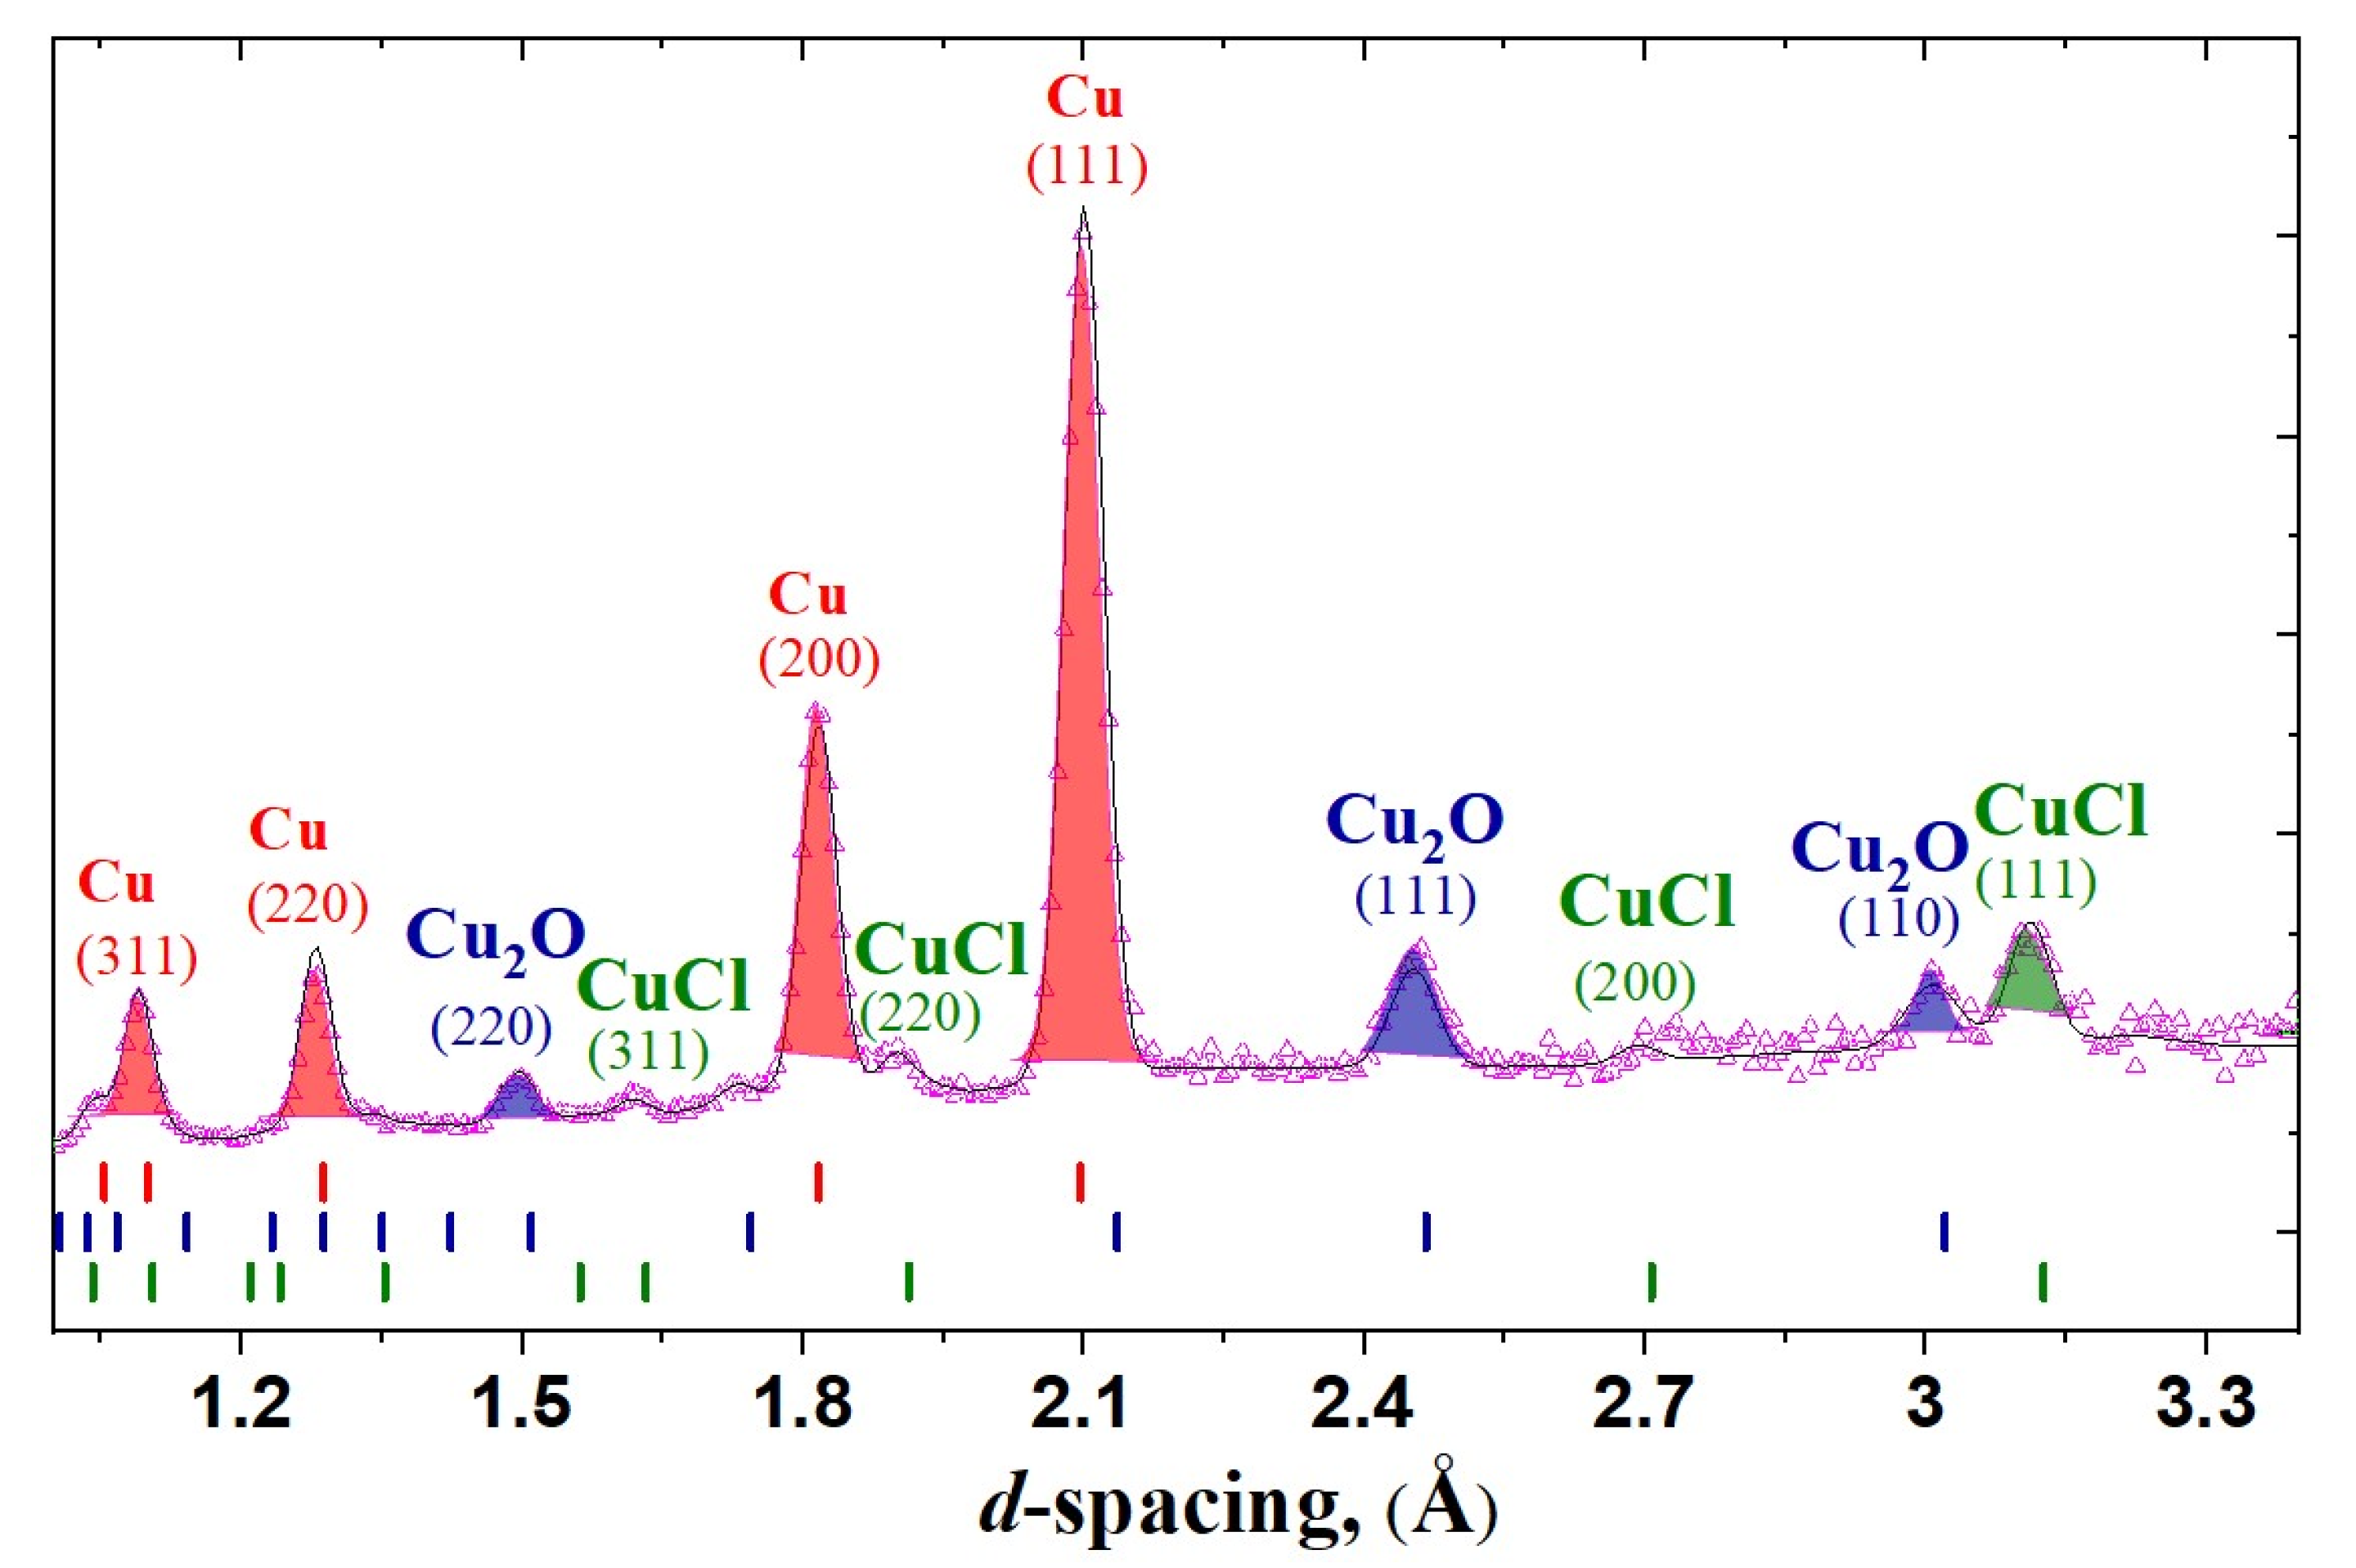
2.3. Neutron Diffraction
2.4. Neutron Tomography
3. Results
3.1. The Composition of the Patina and Inner Volume of the Coins
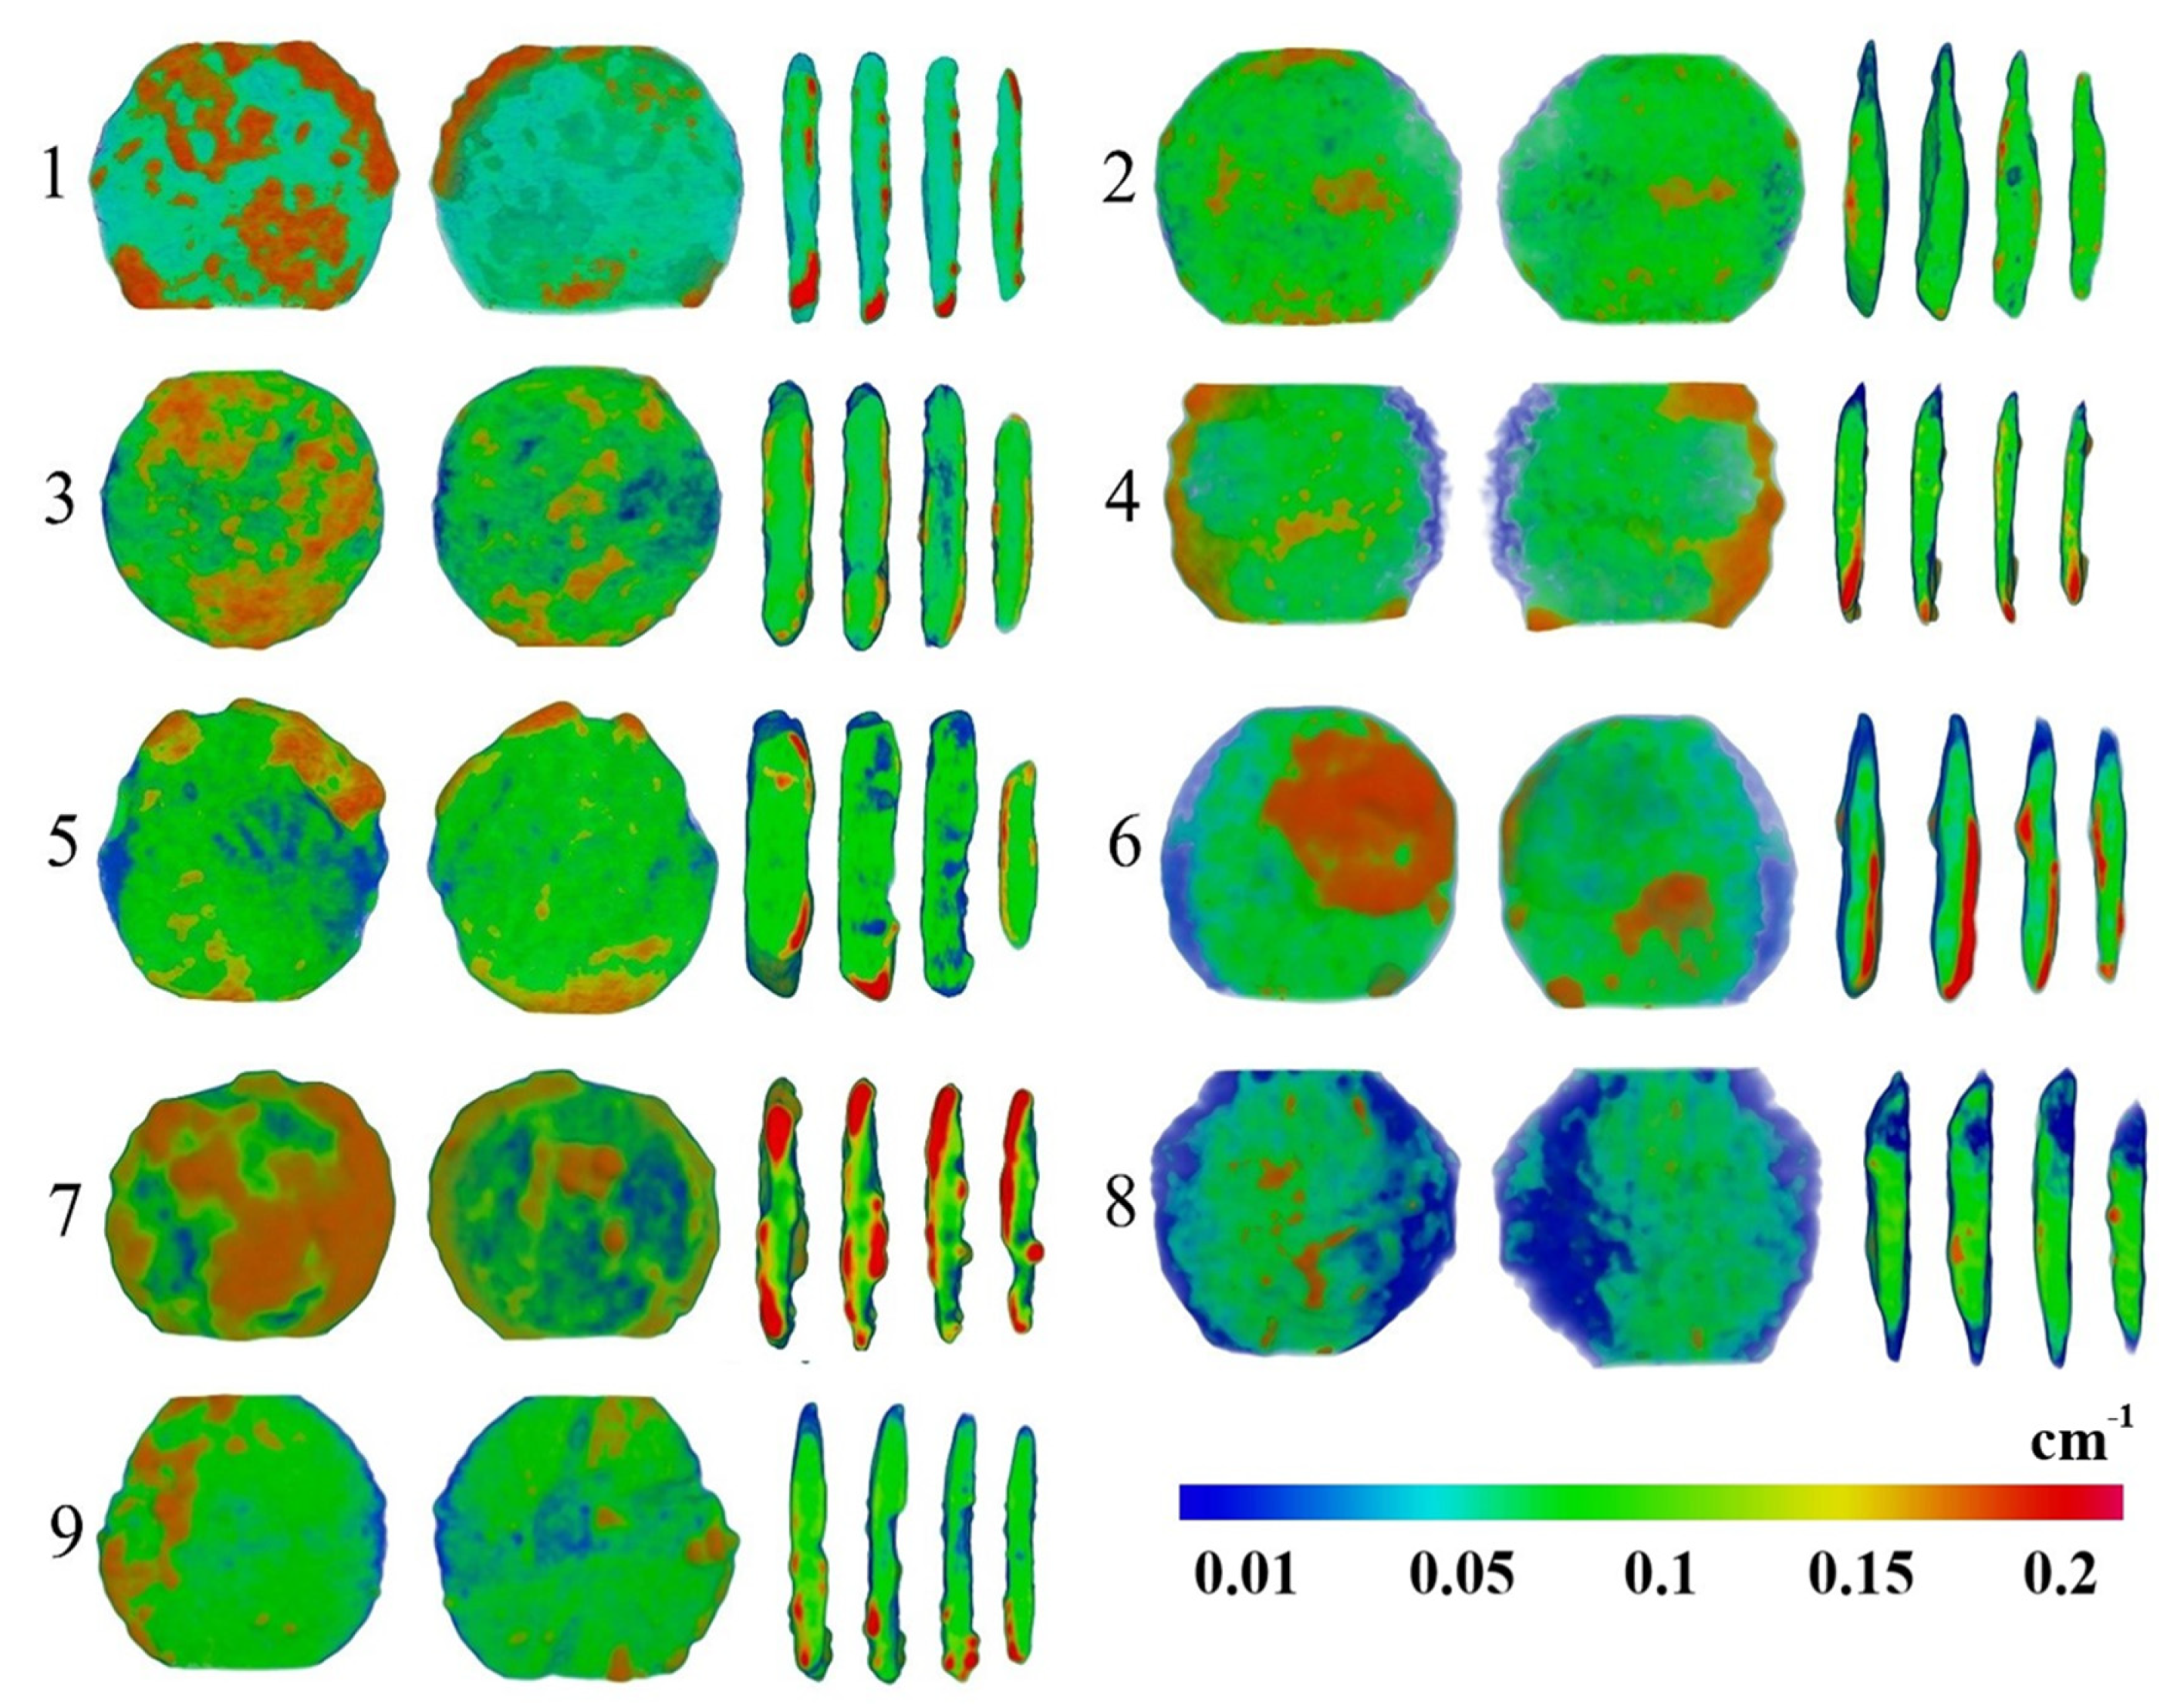
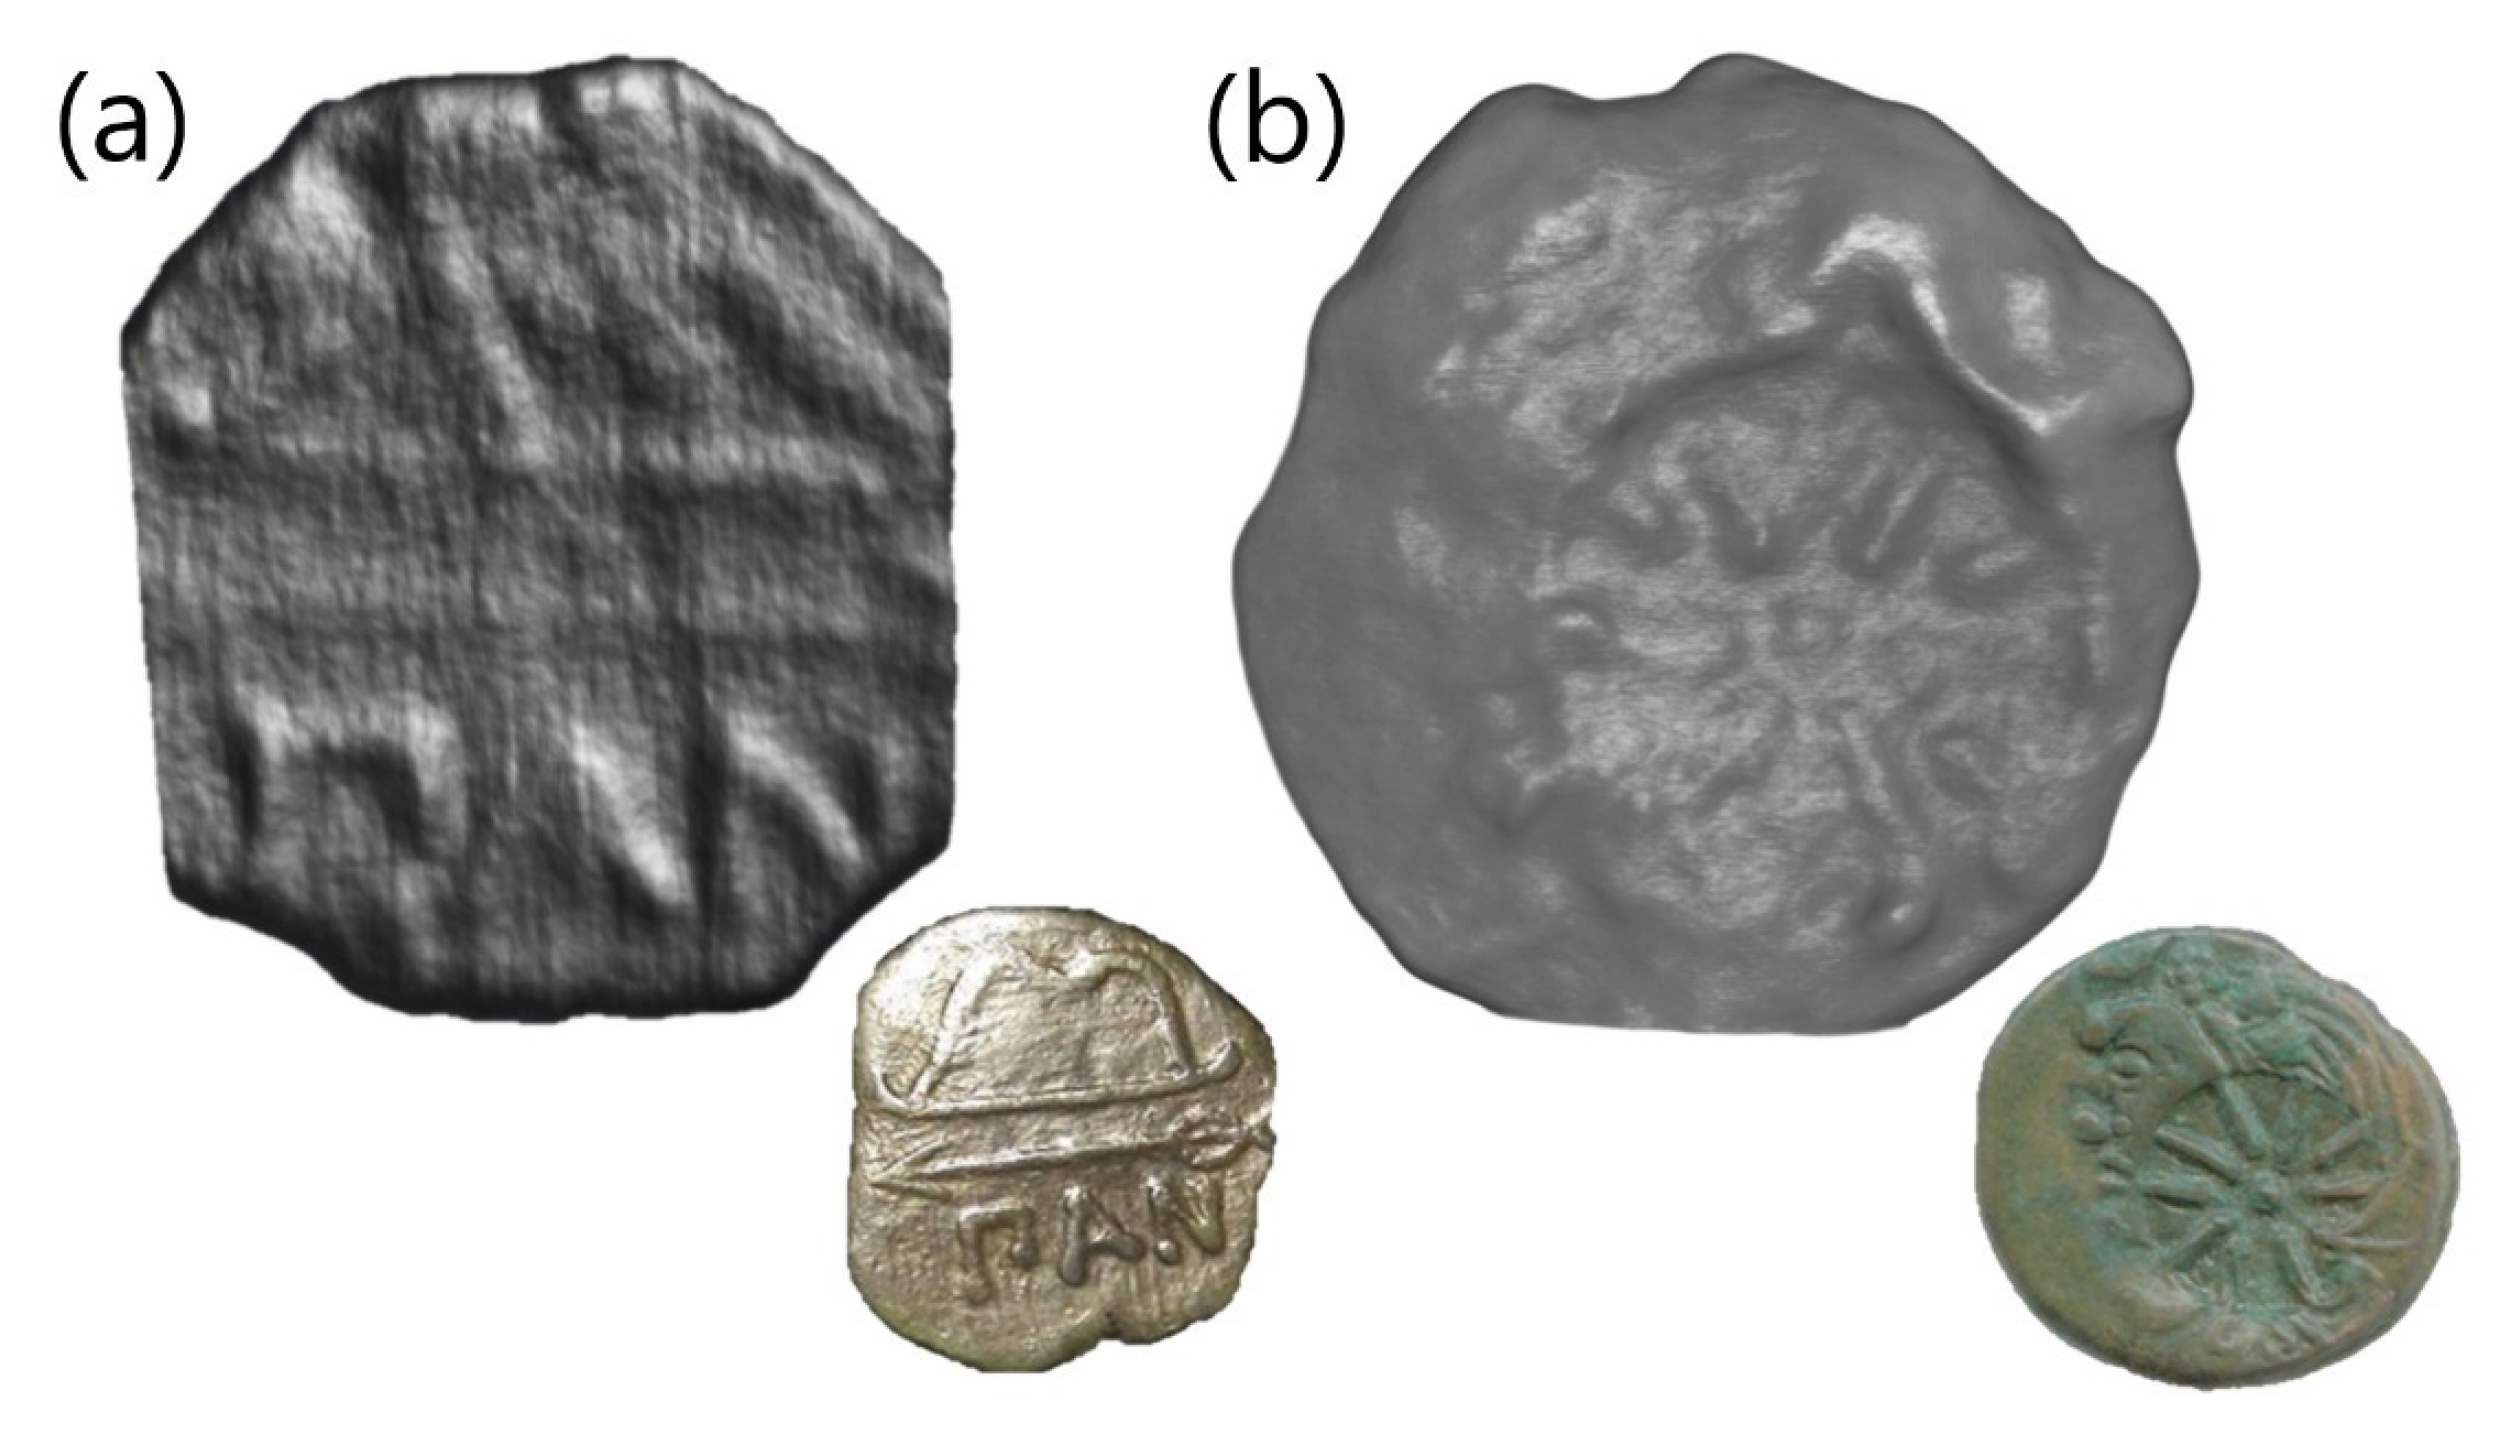
3.2. Neutron Tomography
4. Conclusions
Author Contributions
Funding
Institutional Review Board Statement
Informed Consent Statement
Data Availability Statement
Conflicts of Interest
References
- Kardjilov, N.; Giulia, F. Neutron Methods for Archaeology and Cultural Heritage, 1st ed.; Springer International Publishing: Berlin/Heidelberg, Germany, 2017; pp. 3–171. [Google Scholar] [CrossRef]
- Olsen, S.; Silvemini, F.; Luzin, V.; Garbe, U.; Avdeev, M.; Davis, J.; Sheedy, K. A Neutron Tomographic Analysis of Plated Silver Coins from Ancient Greece Official or Illegal? Mater. Res. Proc. 2020, 15, 233–238. [Google Scholar] [CrossRef]
- Debernardi, P.; Corsi, J.; Angelini, I.; Barzagli, E.; Grazzi, F.; Lo Giudice, A.; Re, A.; Scherillo, A. Average and core silver content of ancient-debased coins via neutron diffraction and specific gravity. Archaeol. Anthr. Sci. 2018, 10, 1585–1602. [Google Scholar] [CrossRef]
- Beck, L.; Bosonnet, S.; Réveillon, S.; Eliot, D.; Pilon, F. Silver surface enrichment of silver-copper alloys: A limitation for the analysis of ancient silver coins by surface techniques. Nucl. Instrum. Methods Phys. Res. Sect. B Beam Interact. Mater. At. 2004, 226, 153–162. [Google Scholar] [CrossRef]
- Mezzasalma, A.; Mondio, G.; Serafino, T.; Fulvio, G.; Romeo, M.; Salici, A. Ancient Coins and their Modern Fakes: An Attempt of Physico-Chemical Unmasking. Mediterr. Archaeol. Archaeom. 2009, 9, 15–28. [Google Scholar]
- Abramzon, M.G.; Kuznetsov, V.D. A Hoard of 3rd-4th Centuries AD Bosporan Staters from Phanagoria (2011). Anc. Civiliz. Scythia Sib. 2019, 25, 308–356. [Google Scholar] [CrossRef]
- Zwicker, U.; Oddy, A.; Niece, S.L. Roman techniques of manufacturing silver-plated coins. In Metal Plating and Patination: Cultural, Technical, and Historical Developments, 1st ed.; Butterworth-Heinemann: Oxford, UK, 1993; pp. 223–246. [Google Scholar] [CrossRef]
- Hall, E.T.; Metcalf, D.M. Methods of Chemical and Metallurgical Investigation of Ancient Coinage; a Symposium Held by the Royal Numismatic Society at Burlington House, London on 9–11 December 1970, 1st ed.; Royal Numismatic Society: London, UK, 1972. [Google Scholar]
- Sedyshev, P.V.; Shvetsov, V.N.; Abramzon, M.G.; Saprykina, I.A. Determining the Elemental Composition of Antique Coins of Phanagorian Treasure by Neutron Spectroscopy at the Pulsed Neutron Source IREN in FLNP JINR. Phys. Part. Nucl. Lett. 2020, 17, 389–400. [Google Scholar] [CrossRef]
- Salvemini, F.; Sheedy, K.A.; Olsen, S.; Luzin, V.; Garbe, U. Neutron imaging for numismatics. In Metallurgy in Numismatics 6: Mines, Metals and Money: Ancient World Studies in Science, Archaeology and History; Kenneth, A.S., Gillan, D., Eds.; The Royal Numismatic Society: London, UK, 2020; pp. 247–259. [Google Scholar]
- Kichanov, S.; Nazarov, K.; Kozlenko, D.; Saprykina, I.; Lukin, E.; Savenko, B. Analysis of the internal structure of ancient copper coins by neutron tomography. J. Synch. Investig. 2017, 11, 585–589. [Google Scholar] [CrossRef]
- Bakirov, B.; Kichanov, S.; Khramchenkova, R.; Belushkin, A.; Kozlenko, D.; Sitdikov, A. Studies of Coins of Medieval Volga Bulgaria by Neutron Diffraction and Tomography. J. Synch. Investig. 2020, 14, 376–381. [Google Scholar] [CrossRef]
- Siouris, I.; Katsavounis, S.; Kockelmann, W. Characterization of ancient Greek coins using non-destructive TOF neutron diffraction. J. Phys. Conf. Ser. 2012, 340, 012112. [Google Scholar] [CrossRef]
- Abramson, M.G.; Saprykina, I.A.; Kichanov, S.E.; Kozlenko, D.P.; Nazarov, K.M. A Study of the Chemical Composition of the 3rd Century AD Bosporan Billon Staters by XRF Analysis, Neutron Tomography and Diffraction. J. Synch. Investig. 2018, 12, 114–117. [Google Scholar] [CrossRef]
- Podurets, K.; Kichanov, S.; Glazkov, V.; Kovalenko, E.; Murashev, M.; Kozlenko, D.; Lukin, E.; Yatsishina, E. Modern Methods of Neutron Radiography and Tomography in Studies of the Internal Structure of Objects. Crystallogr. Rep. 2021, 66, 254–266. [Google Scholar] [CrossRef]
- Lehmann, E.H.; Vontobel, P.; Deschler-Erb, E.; Soares, M. Non-invasive studies of objects from cultural heritage. Nucl. Instrum. Methods Phys. Res. Sect. A Accel. Spectrometers Detect. Assoc. Equip. 2005, 542, 68–75. [Google Scholar] [CrossRef]
- Ryzewski, K.; Herringer, S.; Bilheux, H.; Walker, L.; Sheldon, B.; Voisin, S.; Bilheux, J.; Finocchiaro, V. Neutron Imaging of Archaeological Bronzes at the Oak Ridge National Laboratory. Phys. Procedia 2013, 43, 343–351. [Google Scholar] [CrossRef] [Green Version]
- Griesser, M.; Traum, R.; Vondrovec, K.; Vontobel, P.; Lehmann, E. Application of X-Ray and Neutron Tomography to Study Antique Greek Bronze Coins with a High Lead Content. IOP Conf. Ser. Mater. Sci. Eng. 2012, 37, 012011. [Google Scholar] [CrossRef] [Green Version]
- Sodaei, B.; Hajivaliei, M.; Nadooshan, F. Possible sources for extraction of silver by comparison of Parthian and Sasanian coins in mede satraps. Mediterr. Archaeol. Archaeom. 2013, 13, 161–170. [Google Scholar]
- Mednikova, M.; Saprykina, I.; Kichanov, S.; Kozlenko, D. The Reconstruction of a Bronze Battle Axe and Comparison of Inflicted Damage Injuries Using Neutron Tomography, Manufacturing Modeling, and X-ray Microtomography Data. J. Imaging 2020, 6, 45. [Google Scholar] [CrossRef]
- Griesser, M.; Kockelmann, W.; Hradil, K.; Traum, R. New insights into the manufacturing technique and corrosion of high leaded antique bronze coins. Microchem. J. 2016, 126, 181–193. [Google Scholar] [CrossRef]
- Abramzon, M.; Bezuglov, S.; Gunchina, O.; Ustaeva, E. A Hoard of the 2nd–3rd Cent. AD Bosporan Gold Staters from Volna 1 Settlement on the Taman Peninsula. Vestn. Drevnei Istor. 2020, 80, 462–481. [Google Scholar] [CrossRef]
- Klemeshova, M.; Mimokhod, R.; Sudarev, N. Horizon of the Late Bronze burials in the classical necropolis Volna-1 on the Taman Peninsula. Russ. Archaeol. 2021, 1, 59–73. [Google Scholar] [CrossRef]
- Mimokhod, R.A.; Sudarev, N.I.; Uspenskiy, P.S. New “City” Necropolis of Archaic and Classical Period in Taman Peninsula (Preliminary Information). Antiq. Bosporus 2017, 21, 295–310. [Google Scholar]
- Stevens, S. Charon’s Obol and Other Coins in Ancient Funerary Practice. Phoenix 1991, 45, 215–229. [Google Scholar] [CrossRef]
- Brown, L. Charon’s Obols? A case study in the role of coins in Roman Burial Ritual. Theor. Rom. Archaeol. J. 2008, 121–130. [Google Scholar] [CrossRef]
- Kozlenko, D.P.; Kichanov, S.E.; Lukin, E.V.; Savenko, B.N. High-Pressure Neutron Diffraction Study of the Crystal and Magnetic Structure of Materials at the Pulsed Reactor IBR-2: Current Opportunities and Prospects. Crystallogr. Rep. 2021, 66, 303–313. [Google Scholar] [CrossRef]
- Rodriguez-Carvajal, J. Recent Advances in Magnetic Structure Determination by Neutron Powder Diffraction. Phys. B Condens. Matter. 1993, 192, 55–69. [Google Scholar] [CrossRef]
- Kozlenko, D.; Kichanov, S.; Lukin, E.; Rutkauskas, A.; Belushkin, A.; Bokuchava, G.; Savenko, B. Neutron Radiography and Tomography Facility at IBR-2 Reactor. Phys. Part. Nucl. Lett. 2016, 13, 346–351. [Google Scholar] [CrossRef]
- Kozlenko, D.; Kichanov, S.; Lukin, E.; Rutkauskas, A.; Bokuchava, G.; Savenko, B.; Pakhnevich, A.; Rozanov, A. Neutron Radiography Facility at IBR-2 High Flux Pulsed Reactor: First Results. Phys. Procedia 2015, 69, 87–91. [Google Scholar] [CrossRef] [Green Version]
- Schneider, C.A.; Rasband, W.S.; Eliceiri, K.W. NIH Image to ImageJ: 25 years of image analysis. Nat. Methods 2012, 9, 671–675. [Google Scholar] [CrossRef]
- Brun, F.; Massimi, L.; Fratini, M.; Dreossi, D.; Billé, F.; Accardo, A.; Pugliese, R.; Cedola, A. SYRMEP Tomo Project: A graphical user interface for customizing CT reconstruction workflows. Adv. Struct. Chem. Imaging 2017, 3, 1–9. [Google Scholar] [CrossRef] [Green Version]
- Shalev, S.; Shilstein, S.; Paradowska, A.; Kockelmann, W.; Levy, Y. Neutron diffraction study of Levantine Middle Bronze Age cast axes. J. Phys. Conf. Ser. 2010, 251, 012047. [Google Scholar] [CrossRef]
- Kichanov, S.E.; Kozlenko, D.P.; Lukin, E.V.; Rutkauskas, A.V.; Krasavin, E.A.; Rozanov, A.Y.; Savenko, B.N. A neutron tomography study of the Seymchan pallasite. Meteorit. Planet. Sci. 2018, 53, 2155–2164. [Google Scholar] [CrossRef]
- Chen, P.C.; Pavlidis, T. Image segmentation as an estimation problem. Comput. Graph. Image Process. 1980, 12, 153–172. [Google Scholar] [CrossRef]
- Stolba, V.F. Monetary crises in the early Hellenistic poleis of Olbia, Chersonesos and Pantikapaion. A re-assessment. In XIII Congreso Internacional de Numismática (Madrid, 2003); Ministerio de Cultura: Madrid, Spain, 2005; pp. 395–403. [Google Scholar]
- Anokhin, V.A. Coins of Antique Cities of the North-Western Black Sea Region: Catalog; Publishing Company “Stilos”: Kiev, Ukraine, 2011; 328p. [Google Scholar]
- Abramzon, M.G.; Novichikhin, A.M.; Saprykina, I.A.; Smekalova, T.N. The Third Hoard of Late Bosporan Staters from Gai-Kodzor site; Institute of Archaeology RAS: Moscow, Russia, 2019; 344p. [Google Scholar]
- Widawski, M. The Exchange of Coins in the Bosporan State in the 3-rd century B.C. Pol. Numis. News 1990, 34, 101–112. [Google Scholar]

| N | Collection Label | Photos of Obverse and Reverse of the Coins |
|---|---|---|
| 1 | MP461 |  |
| 2 | MP462 | 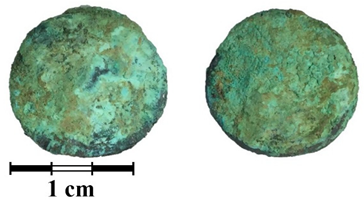 |
| 3 | MP463 | 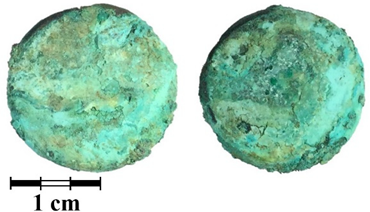 |
| 4 | MP464 | 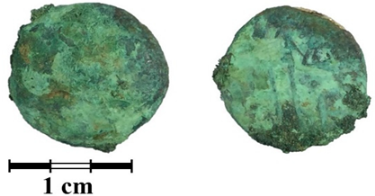 |
| 5 | MP465 | 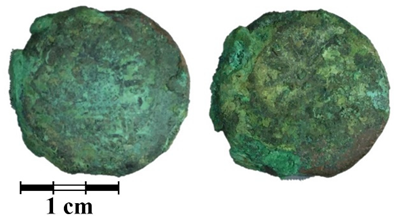 |
| 6 | MP466 | 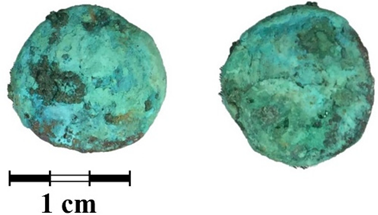 |
| 7 | MP467 |  |
| 8 | MP468 |  |
| 9 | MP469 |  |
| Coin | Total Coin Volume, mm3 | Alloy Volume, mm3 | Patina Volume, mm3 | Volume of Surface Contaminations, mm3 |
|---|---|---|---|---|
| MP461 | 615.9(3) | 449.2(2) | 95.2(2) | 71.5(2) |
| MP462 | 204.5(2) | 153.6(3) | 48.6(2) | 2.3(2) |
| MP463 | 898.1(3) | 745.5(2) | 102.3(2) | 50.3(2) |
| MP464 | 139.9(2) | 78.5(2) | 53.9(2) | 7.5(1) |
| MP465 | 746.8(3) | 607.7(2) | 77.8(2) | 61.4(2) |
| MP466 | 226.7(2) | 138.2(2) | 57.3(3) | 31.2(3) |
| MP467 | 375.9(2) | 225.1(3) | 56.8(2) | 94.0(3) |
| MP468 | 346.7(2) | 131.0(2) | 212.1(3) | 3.6(2) |
| MP469 | 576.2(3) | 419.6(2) | 114.0(3) | 42.6(2) |
Publisher’s Note: MDPI stays neutral with regard to jurisdictional claims in published maps and institutional affiliations. |
© 2021 by the authors. Licensee MDPI, Basel, Switzerland. This article is an open access article distributed under the terms and conditions of the Creative Commons Attribution (CC BY) license (https://creativecommons.org/licenses/by/4.0/).
Share and Cite
Bakirov, B.; Saprykina, I.; Kichanov, S.; Mimokhod, R.; Sudarev, N.; Kozlenko, D. Phase Composition and Its Spatial Distribution in Antique Copper Coins: Neutron Tomography and Diffraction Studies. J. Imaging 2021, 7, 129. https://doi.org/10.3390/jimaging7080129
Bakirov B, Saprykina I, Kichanov S, Mimokhod R, Sudarev N, Kozlenko D. Phase Composition and Its Spatial Distribution in Antique Copper Coins: Neutron Tomography and Diffraction Studies. Journal of Imaging. 2021; 7(8):129. https://doi.org/10.3390/jimaging7080129
Chicago/Turabian StyleBakirov, Bulat, Irina Saprykina, Sergey Kichanov, Roman Mimokhod, Nikolay Sudarev, and Denis Kozlenko. 2021. "Phase Composition and Its Spatial Distribution in Antique Copper Coins: Neutron Tomography and Diffraction Studies" Journal of Imaging 7, no. 8: 129. https://doi.org/10.3390/jimaging7080129
APA StyleBakirov, B., Saprykina, I., Kichanov, S., Mimokhod, R., Sudarev, N., & Kozlenko, D. (2021). Phase Composition and Its Spatial Distribution in Antique Copper Coins: Neutron Tomography and Diffraction Studies. Journal of Imaging, 7(8), 129. https://doi.org/10.3390/jimaging7080129