Imaging Meets Cytometry: Analyzing Heterogeneous Functional Microscopic Data from Living Cell Populations
Abstract
1. Introduction
2. Materials and Methods
2.1. Animals and Islet Isolation
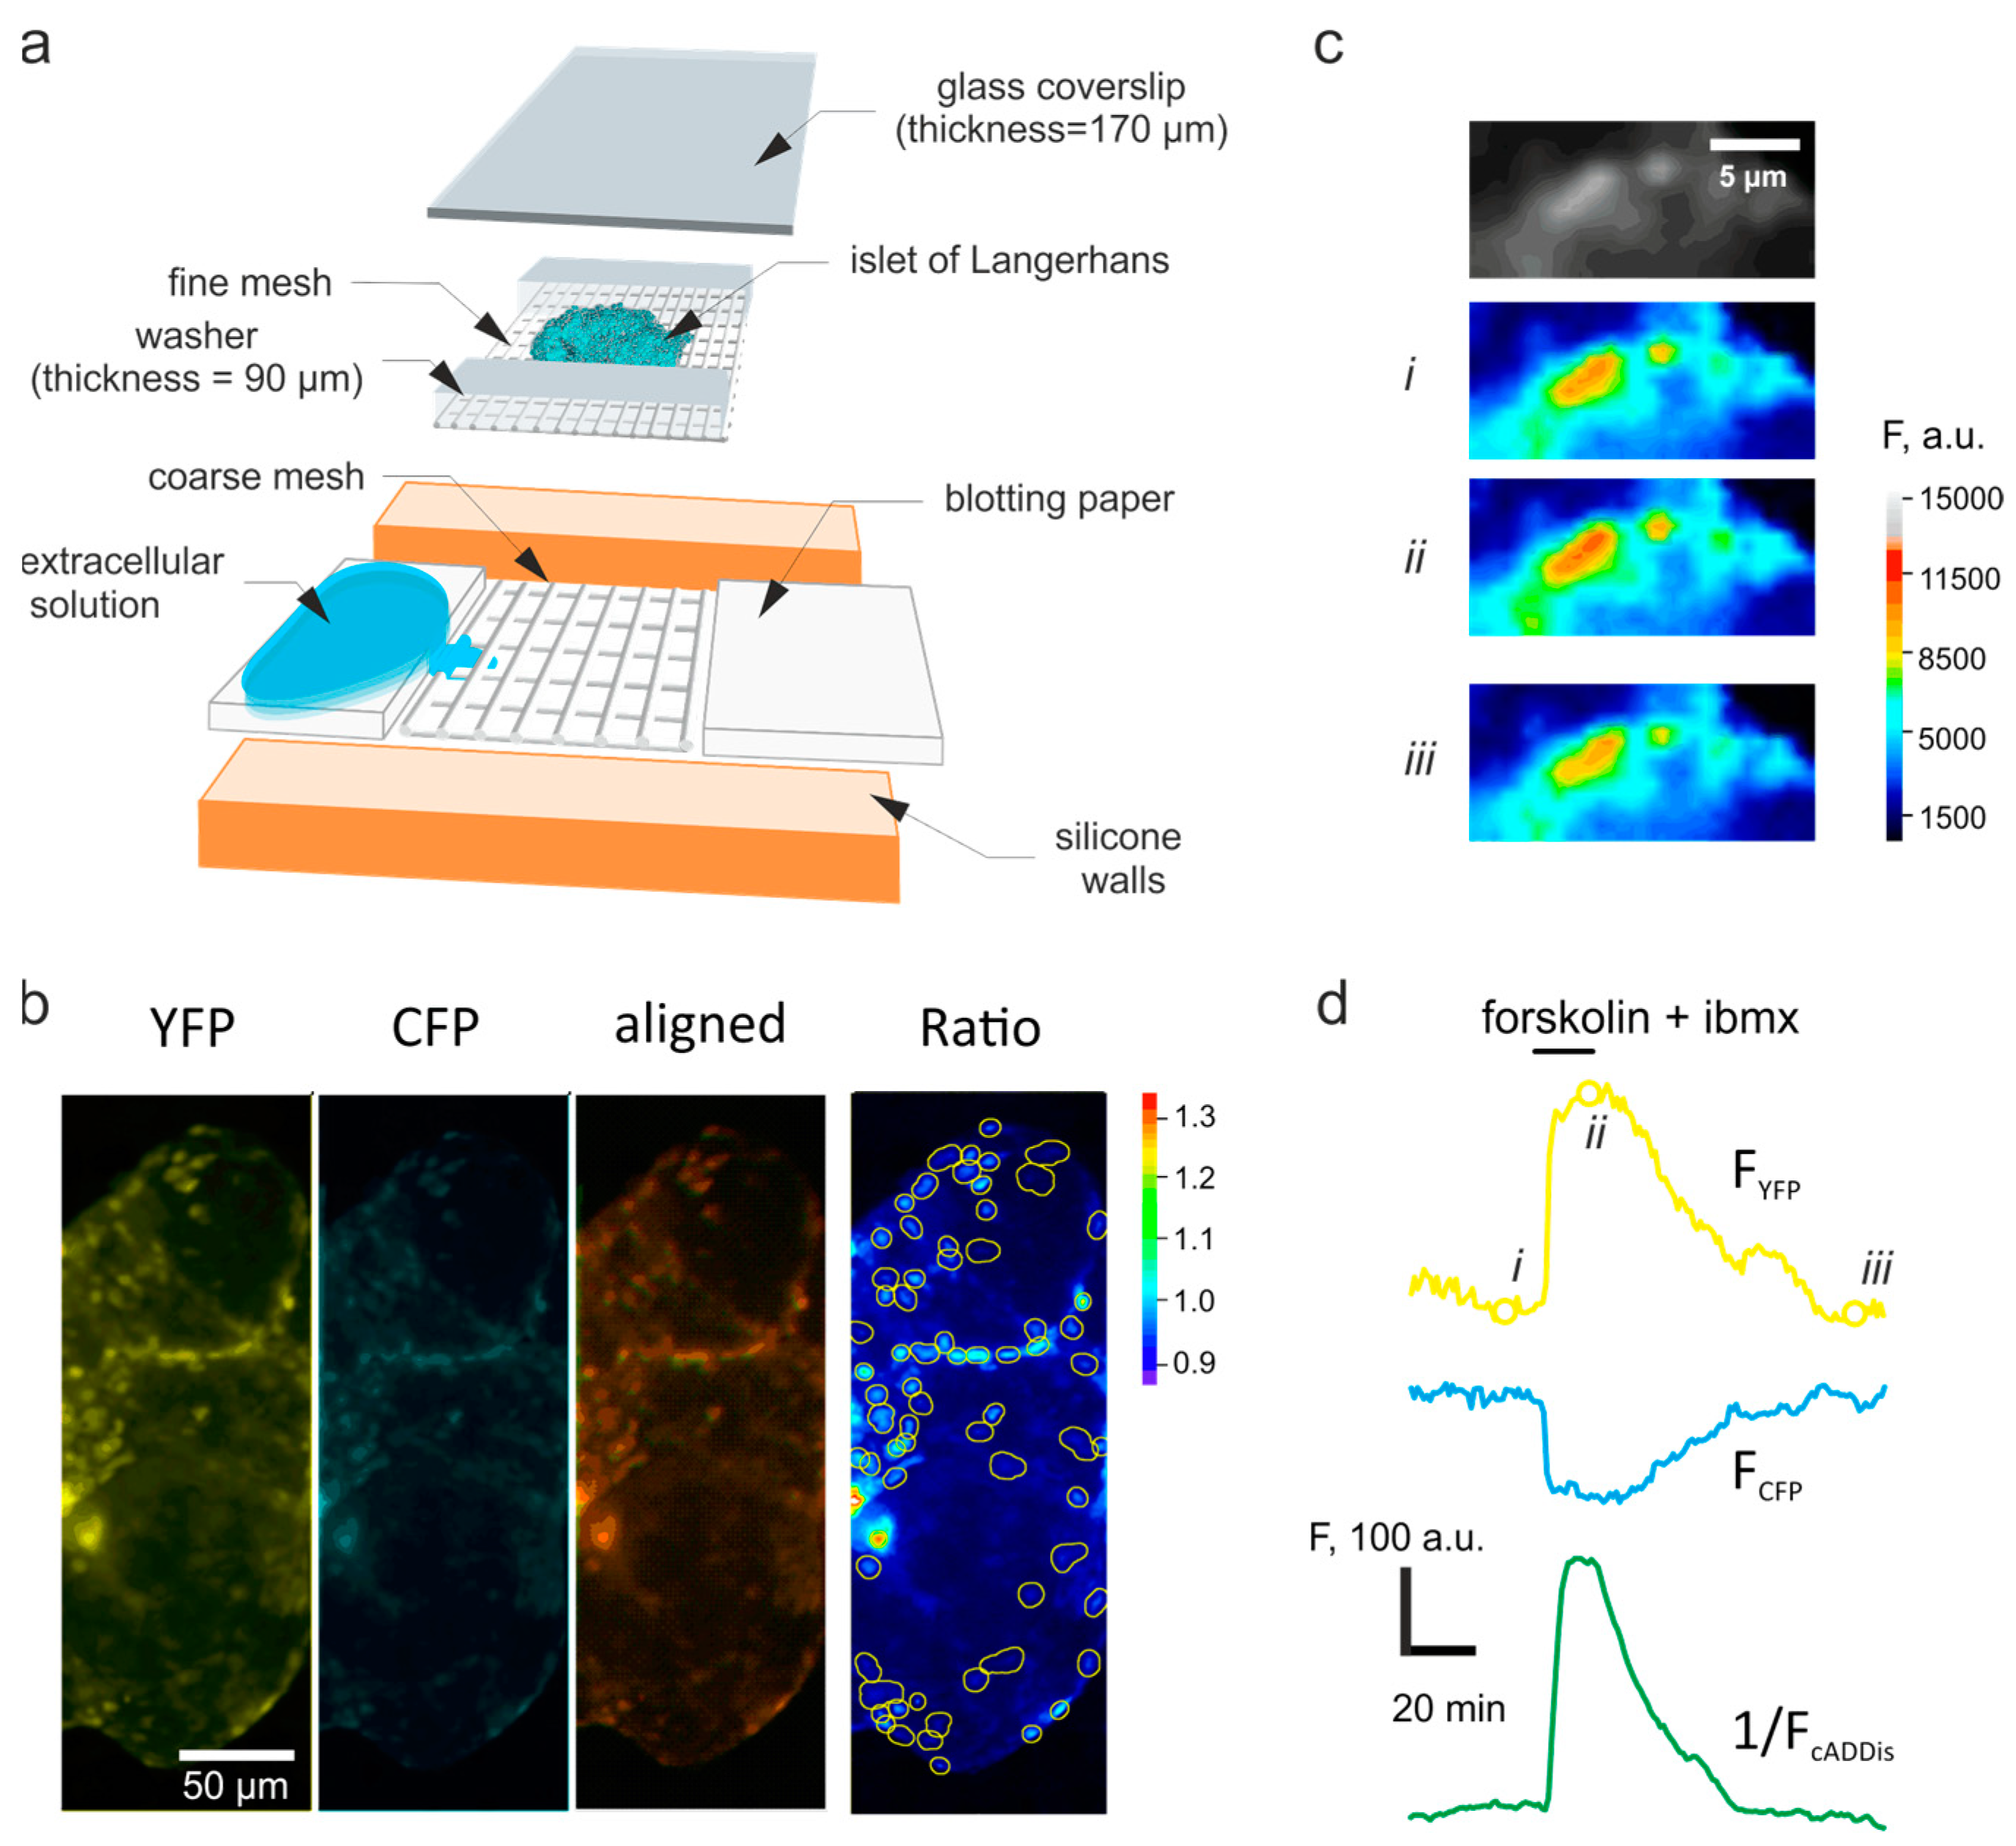
2.2. Imaging
2.3. Image Analysis
2.4. Time-Lapse Data Analysis
2.5. Statistics
3. Results
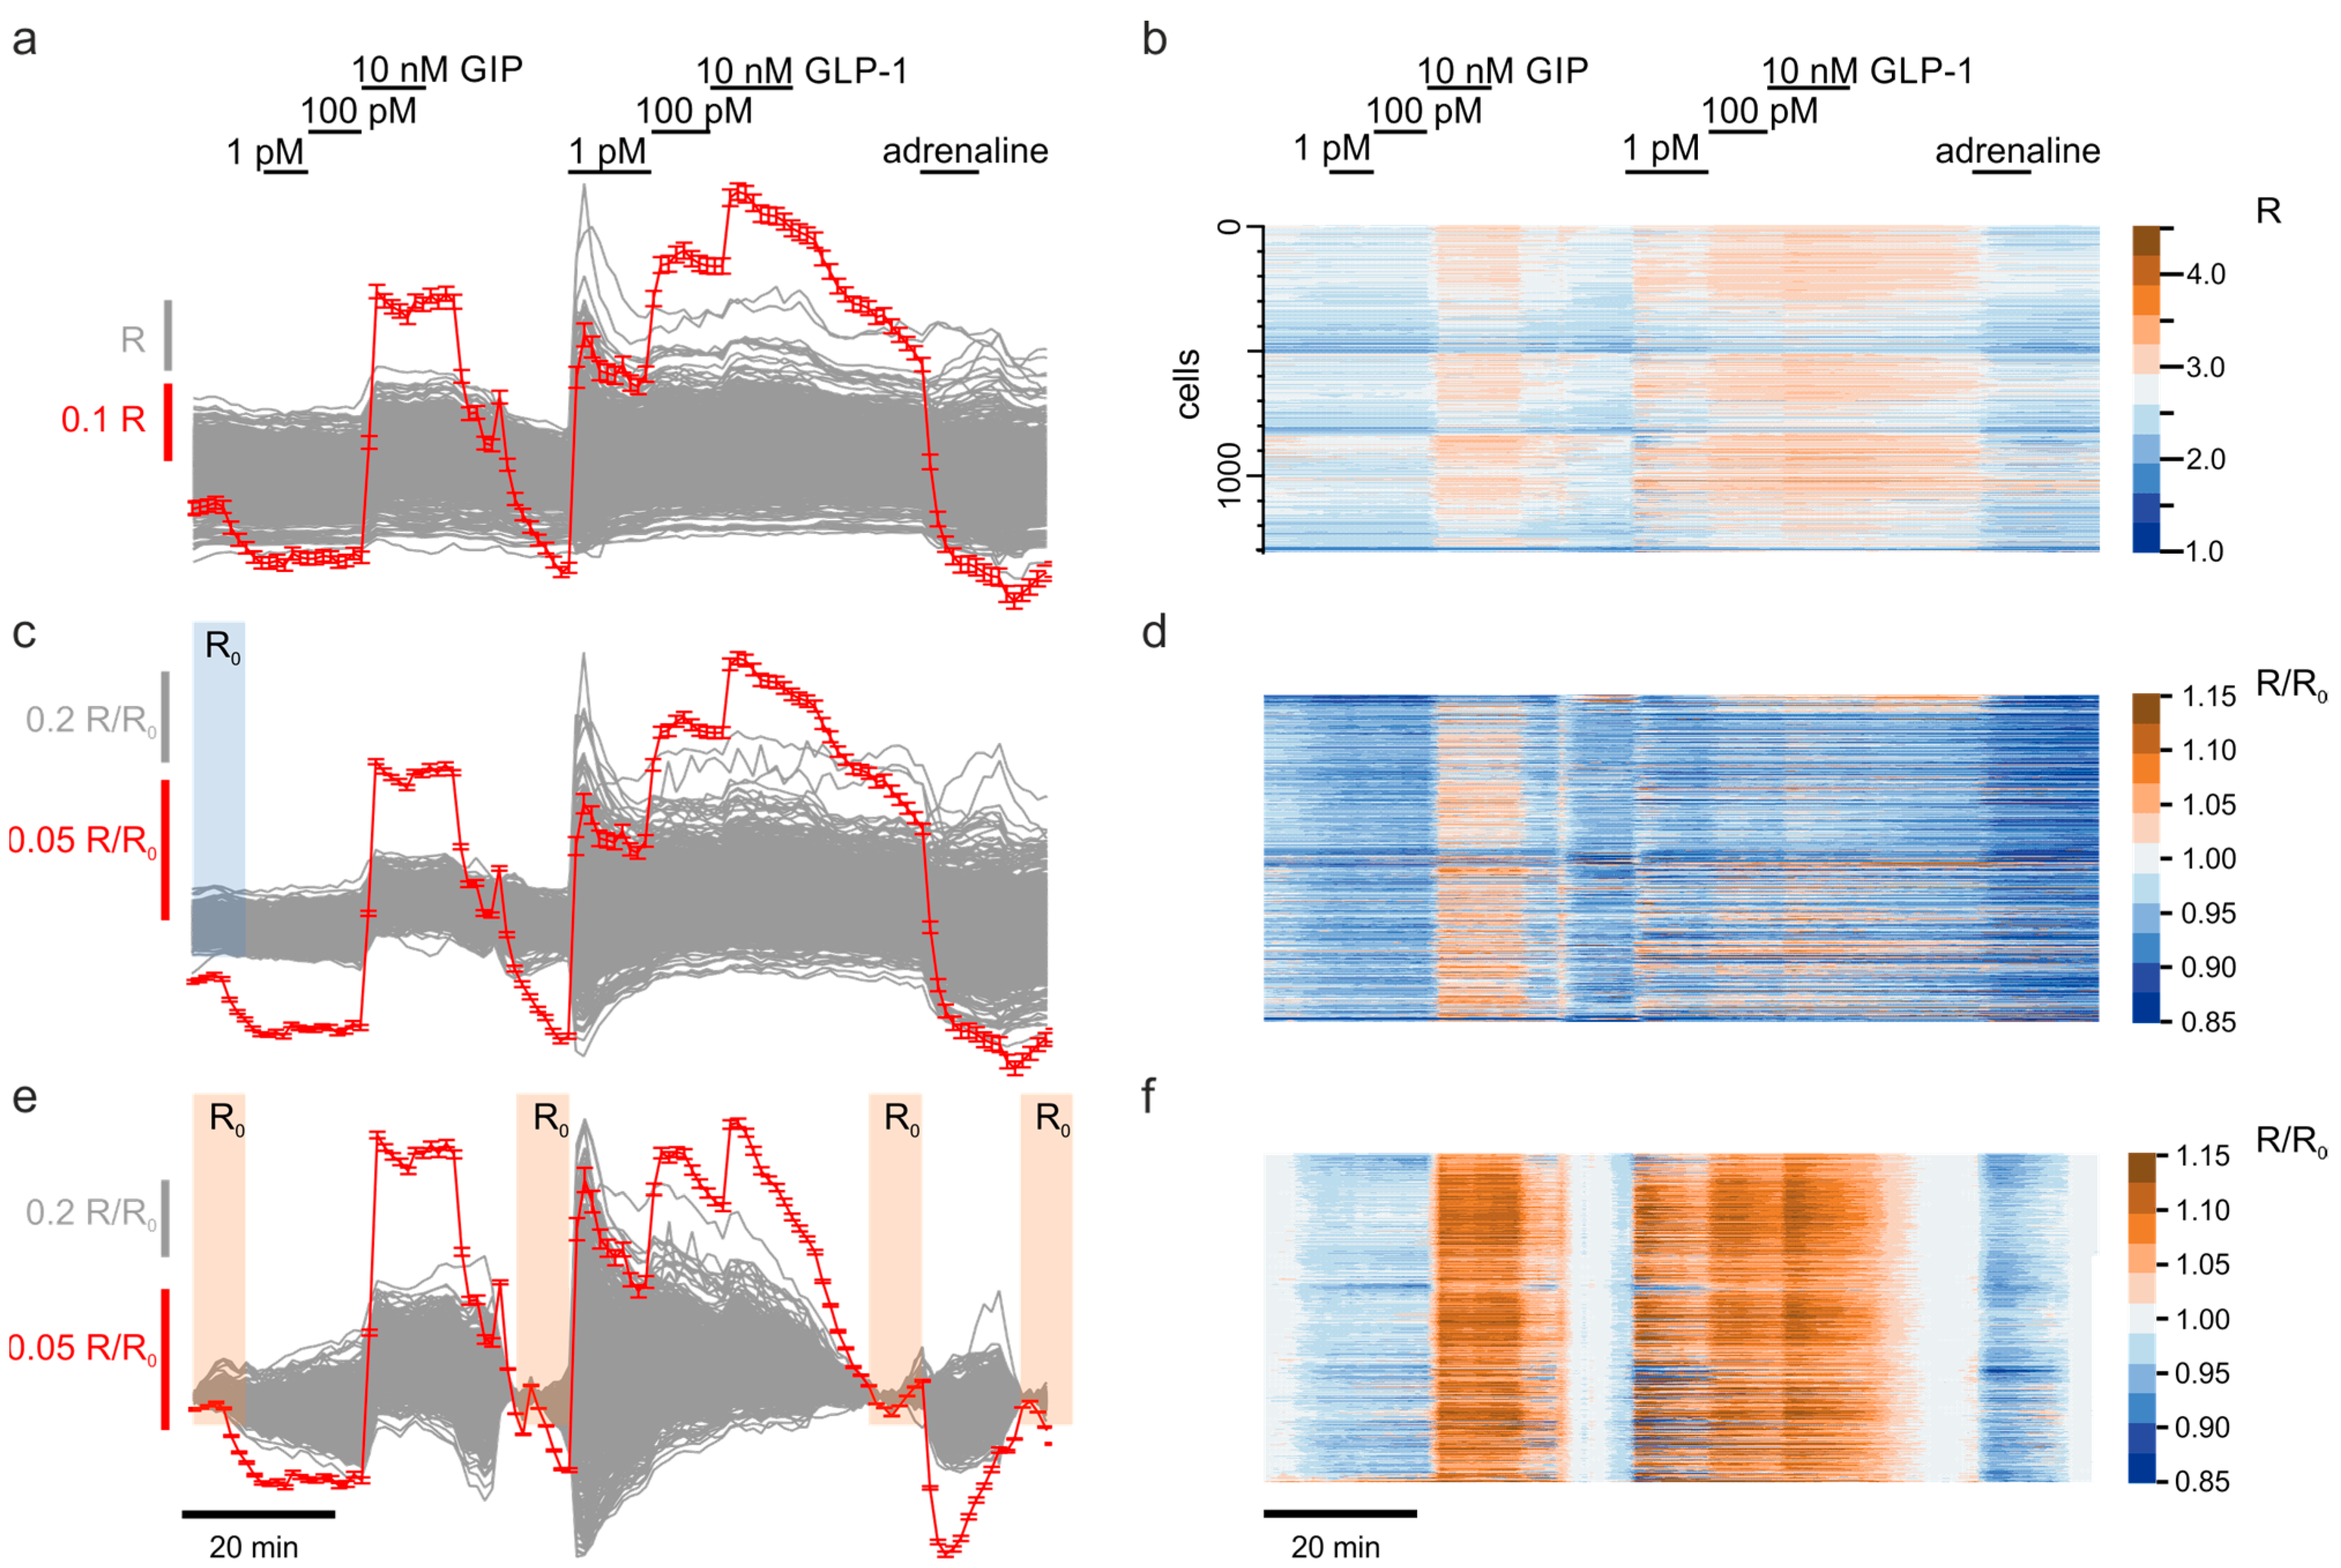
3.1. Correcting the Time-Dependent Drift of Fluorescence
3.2. Scaling Up the Unsupervised Quantification of the Effects
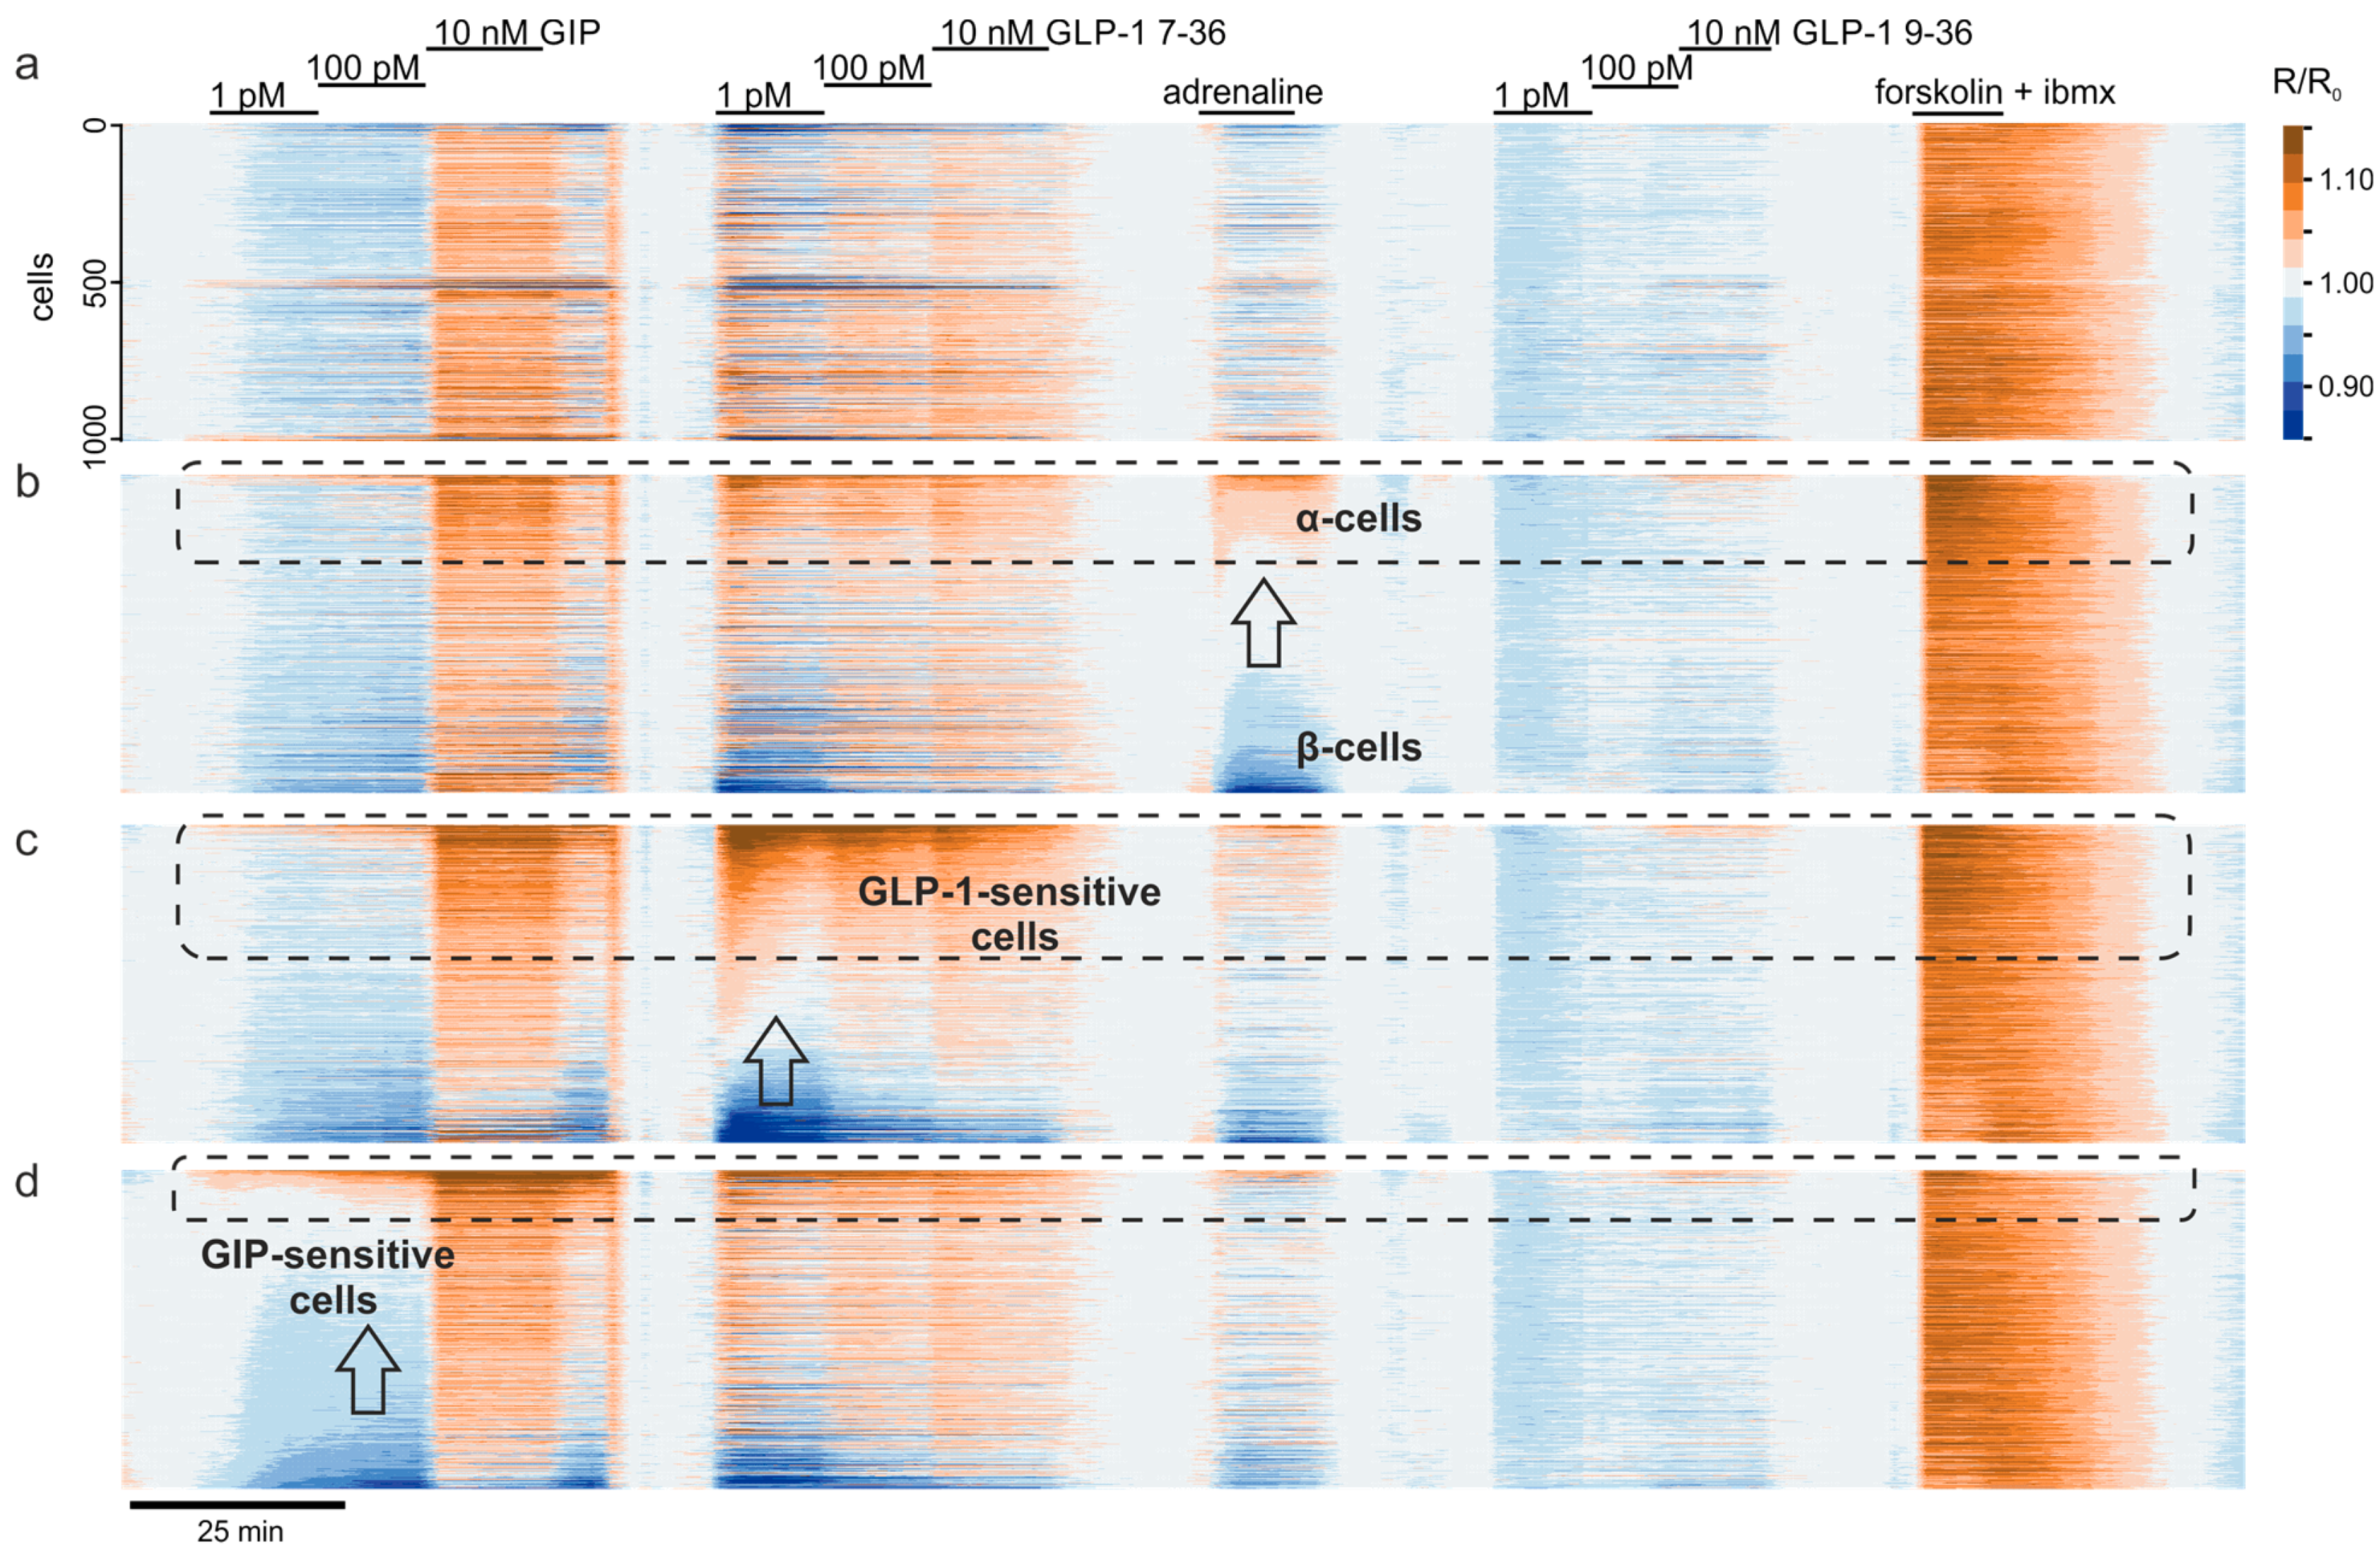
3.3. Exploratory Analysis of Cell Populations Based on the Response to Various Stimuli
3.4. Multiparameter Profiling of Cell Subpopulations within Islets
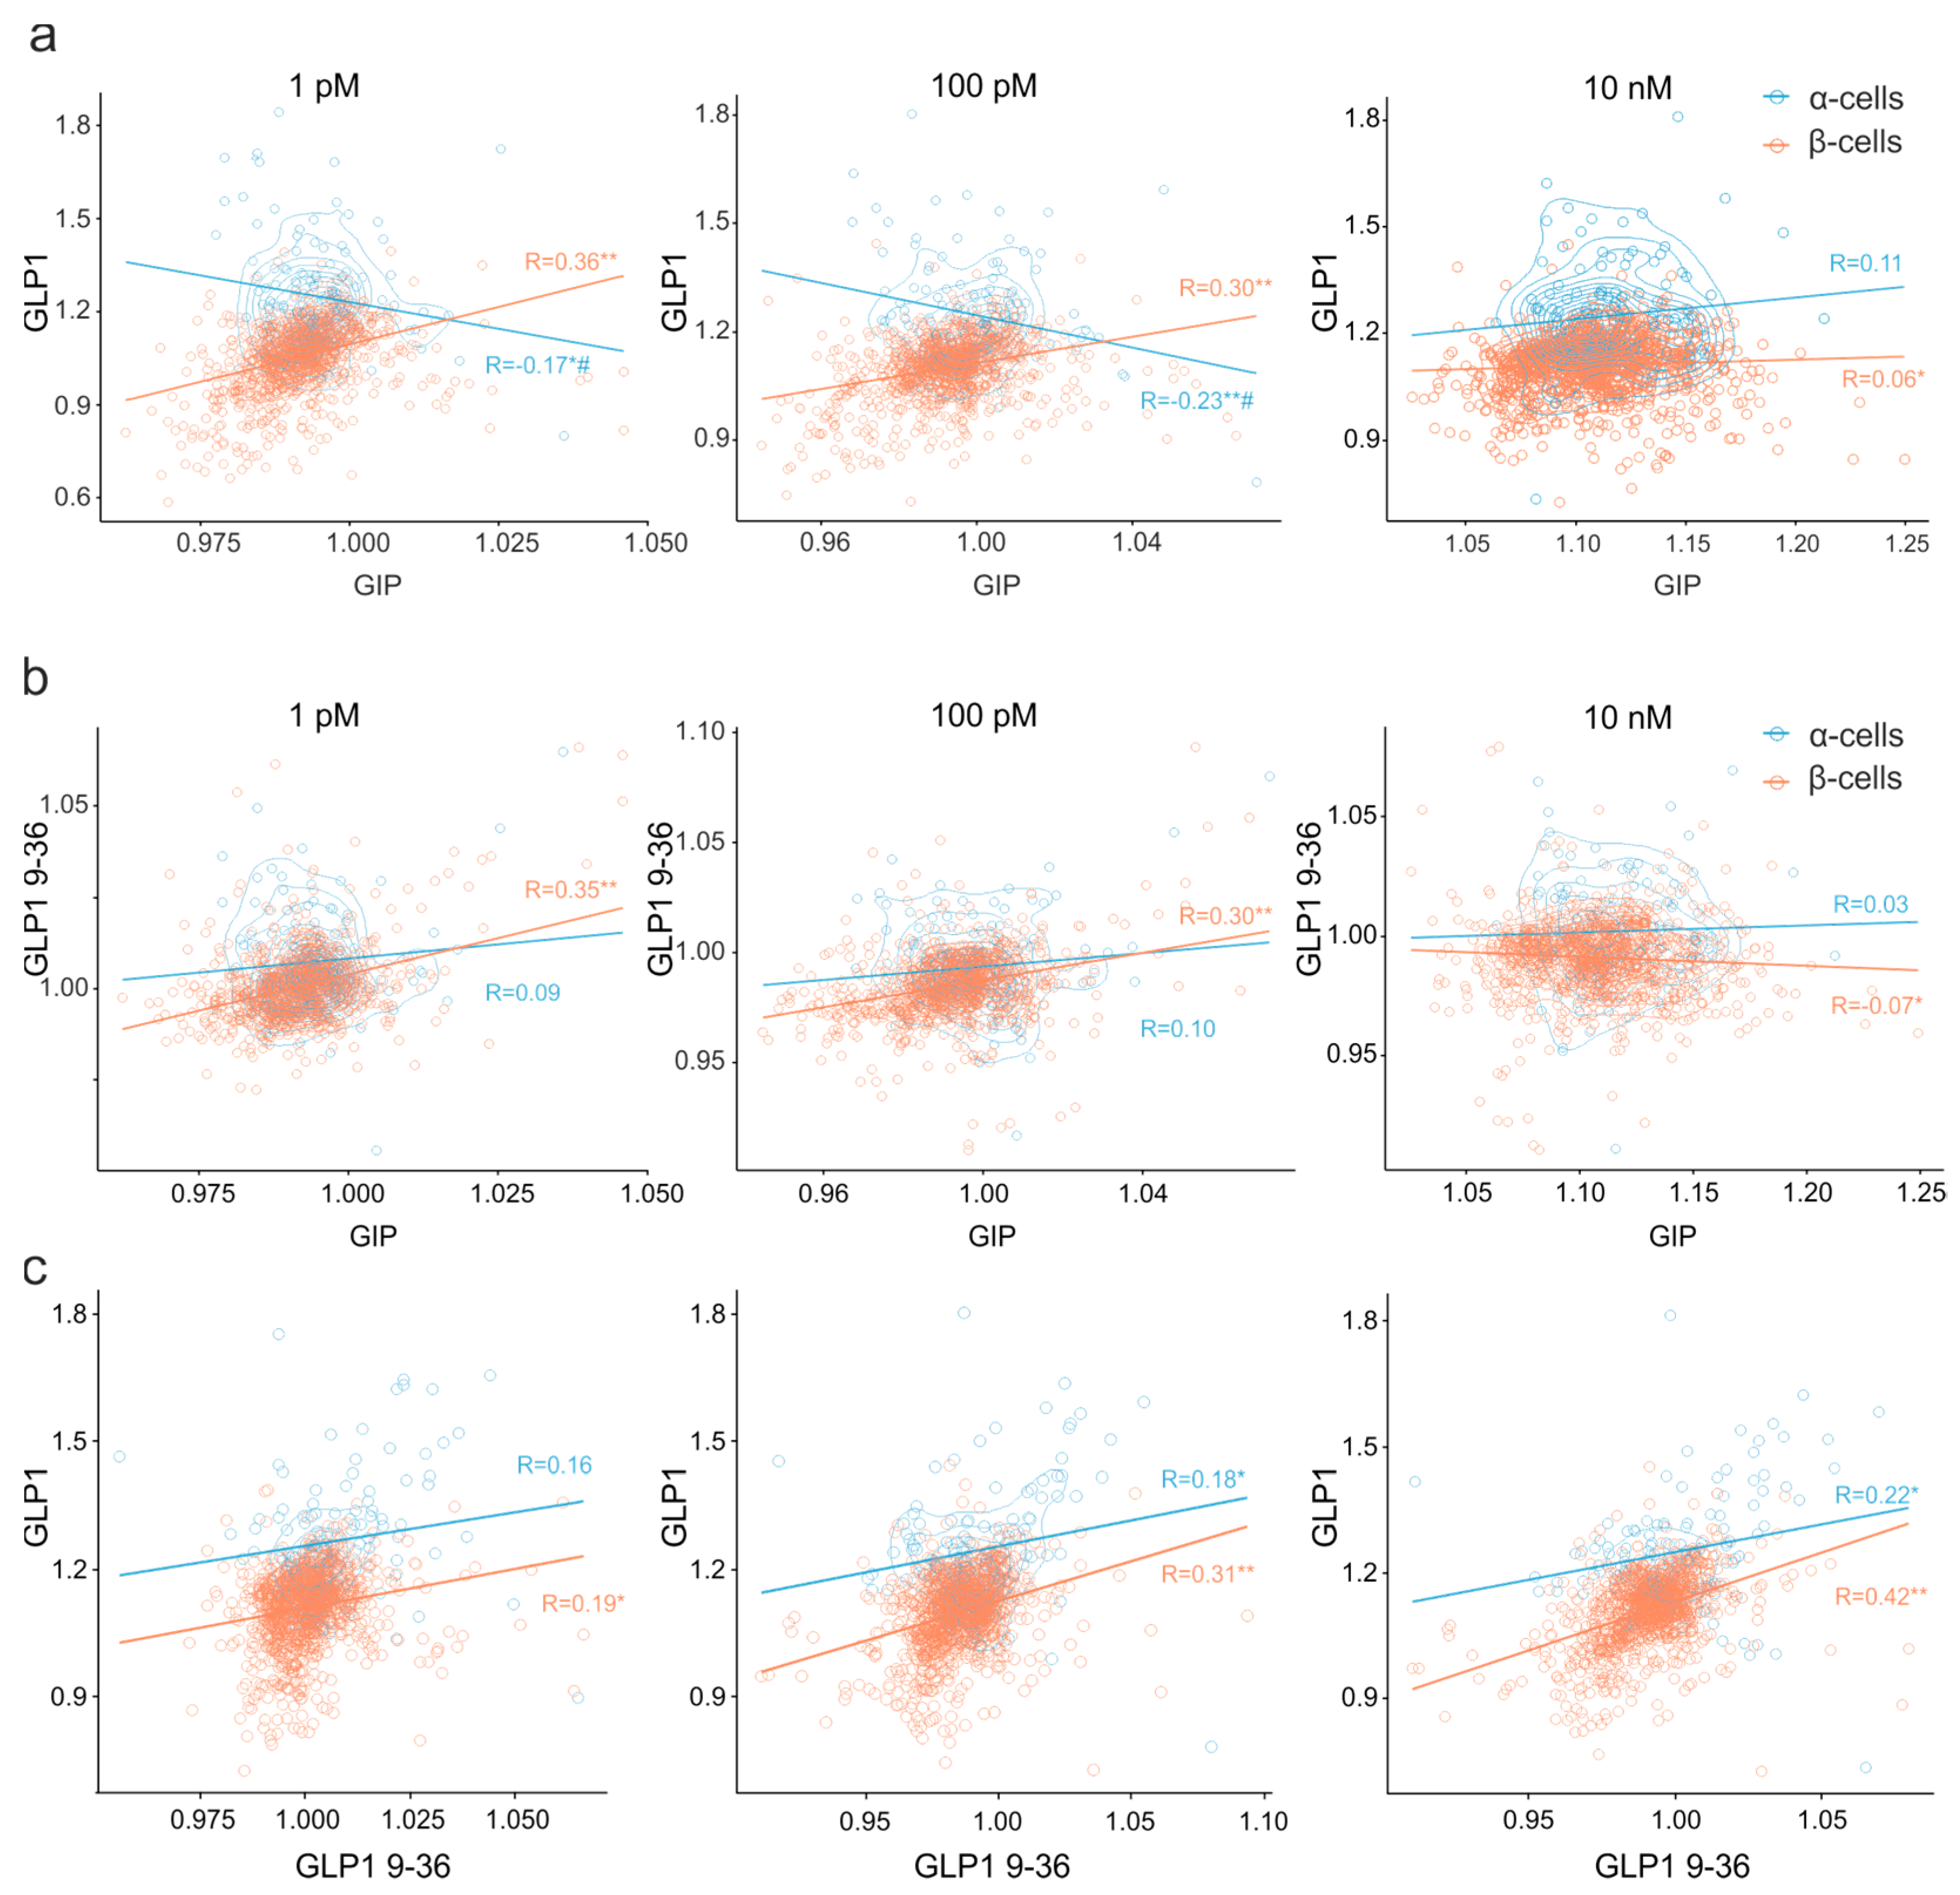
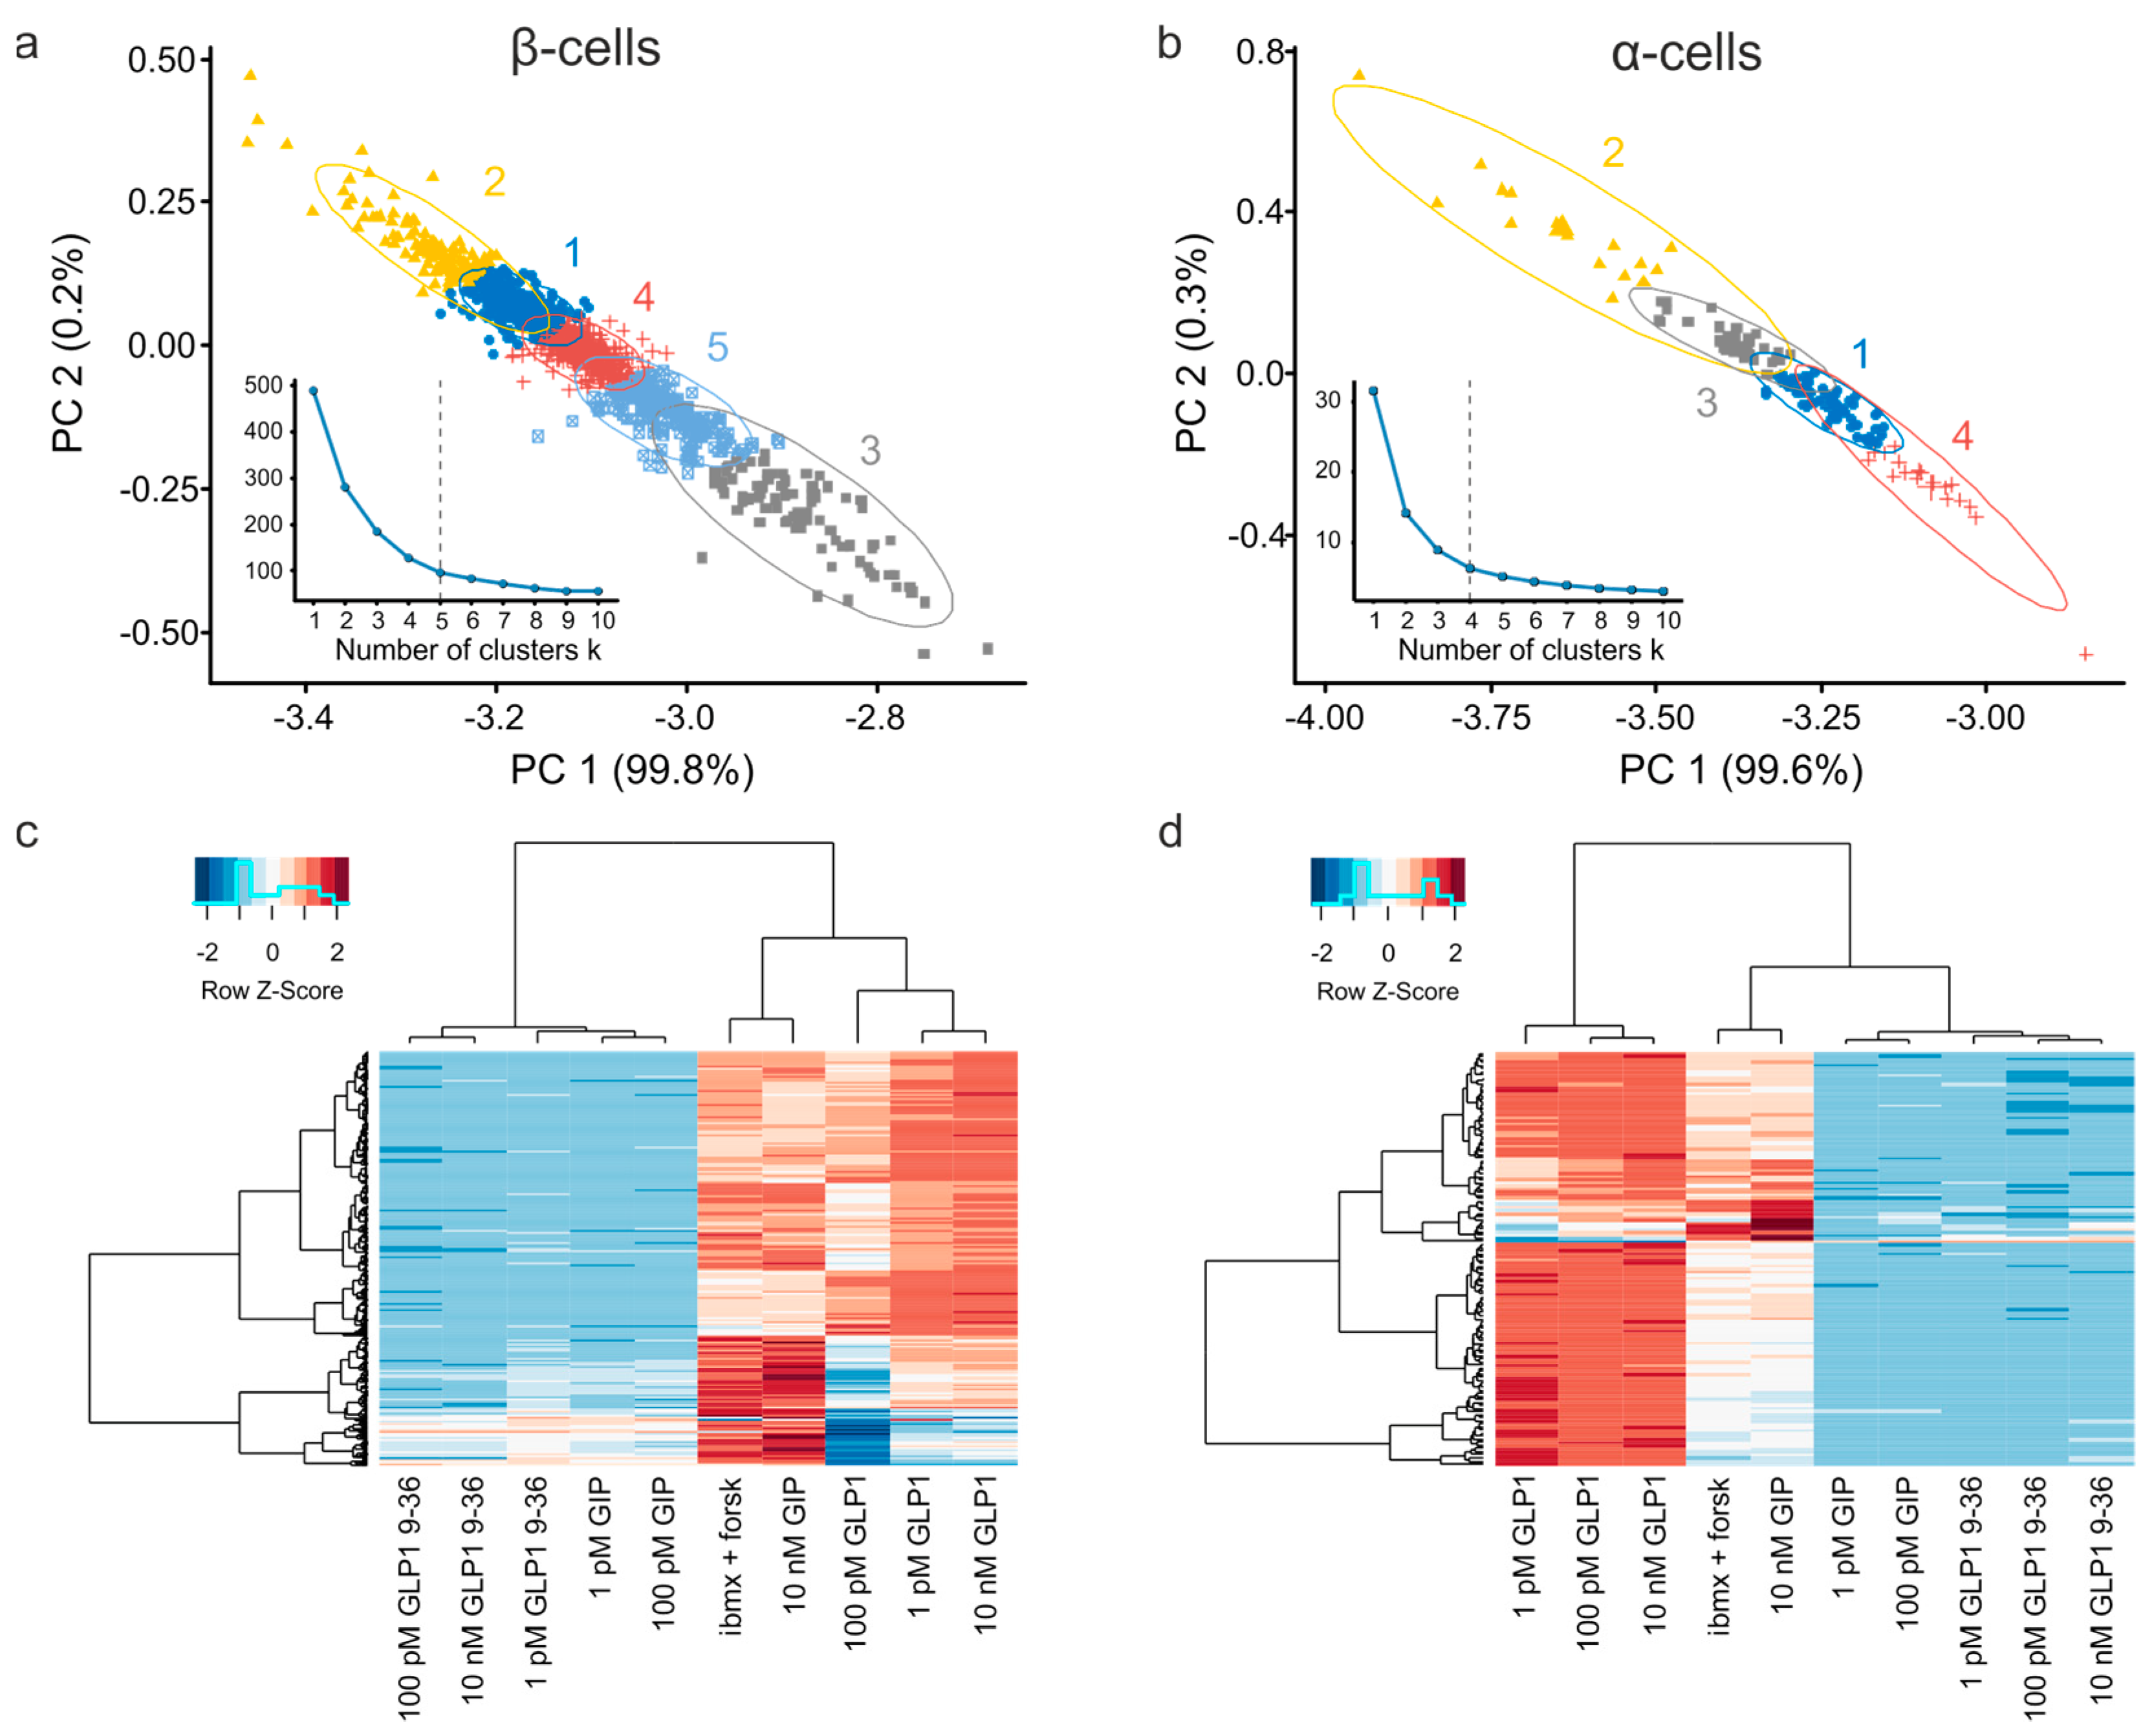
3.5. Clusters of Islet Cells Responding to the Incretin Signals
4. Discussion
4.1. Technical Aspects
4.1.1. Cell Detection
4.1.2. Choice of Reporter
4.1.3. Depth of Profiling
4.1.4. Baseline Correction
4.2. Physiological Significance
4.2.1. Functional Profiling Reflects Cell Heterogeneity
4.2.2. Pharmacology of Cell Populations
5. Conclusions
Supplementary Materials
Author Contributions
Funding
Institutional Review Board Statement
Informed Consent Statement
Data Availability Statement
Conflicts of Interest
Abbreviations
References
- Noguchi, G.M.; Huising, M.O. Integrating the inputs that shape pancreatic islet hormone release. Nat. Metab. 2019, 1, 1189–1201. [Google Scholar] [CrossRef] [PubMed]
- Tarasov, A.I.; Girard, C.A.; Larkin, B.; Tammaro, P.; Flanagan, S.E.; Ellard, S.; Ashcroft Frances, M. Functional analysis of two Kir6. 2 (KCNJ11) mutations, K170T and E322K, causing neonatal diabetes. Diabetes Obes. Metab. 2007, 9, 46–55. [Google Scholar] [CrossRef] [PubMed]
- Tarasov, A.I.; Nicolson, T.J.; Riveline, J.-P.; Taneja, T.K.; Baldwin, S.A.; Baldwin, J.M.; Charpentier, G.; Gautier, J.-F.; Froguel, P.; Vaxillaire, M.; et al. A rare mutation in ABCC8/SUR1 leading to altered ATP-sensitive K+ channel activity and beta-cell glucose sensing is associated with type 2 diabetes in adults. Diabetes 2008, 57, 1595–1604. [Google Scholar] [CrossRef] [PubMed]
- Tarasov, A.I.; Welters, H.J.; Senkel, S.; Ryffel, G.U.; Hattersley, A.T.; Morgan, N.G.; Ashcroft, F.M. A Kir6. 2 mutation causing neonatal diabetes impairs electrical activity and insulin secretion from INS-1 β-cells. Diabetes 2006, 55, 3075–3082. [Google Scholar] [CrossRef]
- Hamilton, A.; Zhang, Q.; Salehi, A.; Willems, M.; Knudsen, J.G.; Ringgaard, A.K.; Chapman, C.E.; Gonzalez-Alvarez, A.; Surdo, N.C.; Zaccolo, M.; et al. Adrenaline Stimulates Glucagon Secretion by Tpc2-Dependent Ca(2+) Mobilization From Acidic Stores in Pancreatic alpha-Cells. Diabetes 2018, 67, 1128–1139. [Google Scholar] [CrossRef]
- Vieira, E.; Liu, Y.-J.; Gylfe, E. Involvement of alpha1 and beta-adrenoceptors in adrenaline stimulation of the glucagon-secreting mouse alpha-cell. Naunyn. Schmiedebergs Arch. Pharmacol. 2004, 369, 179–183. [Google Scholar] [CrossRef]
- Shaw, T.J.; Rognoni, E. Dissecting Fibroblast Heterogeneity in Health and Fibrotic Disease. Curr. Rheumatol. Rep. 2020, 22, 1–10. [Google Scholar] [CrossRef]
- McCarron, J.G.; Wilson, C.; Heathcote, H.R.; Zhang, X.; Buckley, C.; Lee, M.D. Heterogeneity and emergent behaviour in the vascular endothelium. Curr. Opin. Pharmacol. 2019, 45, 23–32. [Google Scholar] [CrossRef]
- Lee, D.D.; Schwarz, M.A. Cell-Cell Communication Breakdown and Endothelial Dysfunction. Crit. Care Clin. 2020, 36, 189–200. [Google Scholar] [CrossRef]
- Chen, B.; Wu, J.; Tang, Y.; Liang, X.-H. What makes leader cells arise: Intrinsic properties and support from neighboring cells. J. Cell. Physiol. 2020, 235, 8983–8995. [Google Scholar] [CrossRef]
- Dabrowski, M.; Tarasov, A.; Ashcroft, F.M. Mapping the architecture of the ATP-binding site of the KATP channel subunit Kir6. 2. J. Physiol. 2004, 557, 347–354. [Google Scholar] [CrossRef] [PubMed]
- Tarasov, A.I.; Girard, C.A.; Ashcroft, F.M. ATP sensitivity of the ATP-sensitive K+ channel in intact and permeabilized pancreatic beta-cells. Diabetes 2006, 55, 2446–2454. [Google Scholar] [CrossRef] [PubMed]
- Goltsev, Y.; Samusik, N.; Kennedy-Darling, J.; Bhate, S.; Hale, M.; Vazquez, G.; Black, S.; Nolan, G.P. Deep profiling of mouse splenic architecture with CODEX multiplexed imaging. Cell 2018, 174, 968–981. [Google Scholar] [CrossRef] [PubMed]
- Marklein, R.A.; Lam, J.; Guvendiren, M.; Sung, K.E.; Bauer, S.R. Functionally-Relevant Morphological Profiling: A Tool to Assess Cellular Heterogeneity. Trends Biotechnol. 2018, 36, 105–118. [Google Scholar] [CrossRef] [PubMed]
- Adriaenssens, A.E.; Svendsen, B.; Lam, B.Y.H.; Yeo, G.S.H.; Holst, J.J.; Reimann, F.; Gribble, F.M. Transcriptomic profiling of pancreatic alpha, beta and delta cell populations identifies delta cells as a principal target for ghrelin in mouse islets. Diabetologia 2016, 59, 2156–2165. [Google Scholar] [CrossRef]
- DiGruccio, M.R.; Mawla, A.M.; Donaldson, C.J.; Noguchi, G.M.; Vaughan, J.; Cowing-Zitron, C.; Van Der Meulen, T.; Huising, M.O. Comprehensive alpha, beta and delta cell transcriptomes reveal that ghrelin selectively activates delta cells and promotes somatostatin release from pancreatic islets. Mol. Metab. 2016, 5, 449–458. [Google Scholar] [CrossRef]
- Hamilton, A.; Vergari, E.; Miranda, C.; Tarasov, A.I. Imaging Calcium Dynamics in Subpopulations of Mouse Pancreatic Islet Cells. J. Vis. Exp. 2019, 2019, e59491. [Google Scholar] [CrossRef]
- Müller, T.D.; Finan, B.; Bloom, S.; D’Alessio, D.; Drucker, D.J.; Flatt, P.R.; Fritsche, A.; Gribble, F.; Grill, H.J.; Habener, J.F.; et al. Glucagon-like peptide 1 (GLP-1). Mol. Metab. 2019, 30, 72–130. [Google Scholar] [CrossRef]
- Gault, V.A.; O’Harte, F.P.; Flatt, P.R. Glucose-dependent insulinotropic polypeptide (GIP): Anti-diabetic and anti-obesity potential? Neuropeptides 2003, 37, 253–263. [Google Scholar] [CrossRef]
- Nikolaev, V.O.; Bünemann, M.; Hein, L.; Hannawacker, A.; Lohse, M.J. Novel Single Chain cAMP Sensors for Receptor-induced Signal Propagation. J. Biol. Chem. 2004, 279, 37215–37218. [Google Scholar] [CrossRef]
- Allen, M.D.; Zhang, J. Subcellular dynamics of protein kinase A activity visualized by FRET-based reporters. Biochem. Biophys. Res. Commun. 2006, 348, 716–721. [Google Scholar] [CrossRef] [PubMed]
- Tarasov, A.I.; Rutter, G.A. Use of Genetically Encoded Sensors to Monitor Cytosolic ATP/ADP Ratio in Living Cells Methods in Enzymology; Elsevier: Amsterdam, The Netherlands, 2014; pp. 289–311. [Google Scholar]
- Tarasov, A.; Petrenko, A.Y.; Jones, D. The osmotic characteristics of human fetal liver-derived hematopoietic stem cell candidates. Cryobiology 2004, 48, 333–340. [Google Scholar] [CrossRef] [PubMed]
- Tarasov, A.I.; Galvanovskis, J.; Rorsman, O.; Hamilton, A.; Vergari, E.; Johnson, P.R.V.; Reimann, F.; Ashcroft, F.M.; Rorsman, P. Monitoring real-time hormone release kinetics via high-content 3-D imaging of compensatory endocytosis. Lab Chip 2018, 18, 2838–2848. [Google Scholar] [CrossRef]
- Zhang, J.; Ma, Y.; Taylor, S.S.; Tsien, R.Y. Genetically encoded reporters of protein kinase A activity reveal impact of substrate tethering. Proc. Nat. Acad. Sci. USA 2001, 98, 14997–15002. [Google Scholar] [CrossRef] [PubMed]
- Liu, X.; Gong, H.; Li, X.; Zhou, W. Monitoring Calcium Concentration in Neurons with Cameleon. J. Biosci. Bioeng. 2008, 105, 106–109. [Google Scholar] [CrossRef]
- Katsikanis, N. 2019. Available online: https://imagejdocu.tudor.lu/_media/plugin/utilities/cairm_image_splitter/cairn_image_splitter.jar (accessed on 15 December 2020).
- Tarasov, A.I. 2020. Available online: https://github.com/tapacob/jImaging2020 (accessed on 15 December 2020).
- Rasband, W.; Schmid, M. 2006. Available online: https://github.com/imagej/imagej1/blob/master/ij/plugin/filter/MaximumFinder.java (accessed on 15 December 2020).
- Rasband, W. 2008. Available online: https://github.com/imagej/imagej1/blob/master/ij/plugin/filter/ParticleAnalyzer.java (accessed on 15 December 2020).
- R Development Core Team. R: A Language and Environment for Statistical Computing. 2019. Available online: https://www.R-project.org/ (accessed on 15 December 2020).
- Samols, E.; Weir, G.C. Adrenergic modulation of pancreatic A, B, and D cells alpha-Adrenergic suppression and beta-adrenergic stimulation of somatostatin secretion, alpha-adrenergic stimulation of glucagon secretion in the perfused dog pancreas. J. Clin. Investig. 1979, 63, 230–238. [Google Scholar] [CrossRef]
- De Marinis, Y.Z.; Salehi, A.; Ward, C.E.; Zhang, Q.; Abdulkader, F.; Bengtsson, M.; Braha, O.; Braun, M.; Ramracheya, R.; Amisten, S.; et al. GLP-1 inhibits and adrenaline stimulates glucagon release by differential modulation of N- and L-type Ca2+ channel-dependent exocytosis. Cell Metab. 2010, 11, 543–553. [Google Scholar] [CrossRef]
- Thevenaz, P.; Ruttimann, U.; Unser, M. A pyramid approach to subpixel registration based on intensity. IEEE Trans. Image Process. 1998, 7, 27–41. [Google Scholar] [CrossRef]
- Misun, P.M.; Yesildag, B.; Forschler, F.; Neelakandhan, A.; Rousset, N.; Biernath, A.; Hierlemannb, A.; Freyc, O. In Vitro Platform for Studying Human Insulin Release Dynamics of Single Pancreatic Islet Microtissues at High Resolution. Adv. Biosyst. 2020, 4, e1900291. [Google Scholar] [CrossRef]
- Eggeling, C.; Widengren, J.; Rigler, R.; Seidel, C.A.M. Photobleaching of Fluorescent Dyes under Conditions Used for Single-Molecule Detection: Evidence of Two-Step Photolysis. Anal. Chem. 1998, 70, 2651–2659. [Google Scholar] [CrossRef]
- Song, L.; Hennink, E.; Young, I.T.; Tanke, H.J. Photobleaching kinetics of fluorescein in quantitative fluorescence microscopy. Biophys. J. 1995, 68, 2588–2600. [Google Scholar] [CrossRef]
- Malkani, N.; Schmid, J.A. Some secrets of fluorescent proteins: Distinct bleaching in various mounting fluids and photoactivation of cyan fluorescent proteins at YFP-excitation. PLoS ONE 2011, 6, e18586. [Google Scholar] [CrossRef] [PubMed]
- Zal, T.; Gascoigne, N.R.J. Photobleaching-Corrected FRET Efficiency Imaging of Live Cells. Biophys. J. 2004, 86, 3923–3939. [Google Scholar] [CrossRef] [PubMed]
- Bajar, B.T.; Wang, E.S.; Zhang, S.; Lin, M.Z.; Chu, J. A Guide to Fluorescent Protein FRET Pairs. Sensors 2016, 16, 1488. [Google Scholar] [CrossRef]
- Giordano, E.; Bosco, D.; Cirulli, V.; Meda, P. Repeated glucose stimulation reveals distinct and lasting secretion patterns of individual rat pancreatic B cells. J. Clin. Investig. 1991, 87, 2178–2185. [Google Scholar] [CrossRef]
- Dominguez-Gutierrez, G.; Xin, Y.; Gromada, J. Heterogeneity of human pancreatic β-cells. Mol. Metab. 2019, 27, S7–S14. [Google Scholar] [CrossRef]
- Thorel, F.; Damond, N.; Chera, S.; Wiederkehr, A.; Thorens, B.; Meda, P.; Wollheim, C.B.; Herrera, P.L. Normal glucagon signaling and beta-cell function after near-total alpha-cell ablation in adult mice. Diabetes 2011, 60, 2872–2882. [Google Scholar] [CrossRef]
- Vergari, E.; Denwood, G.; Salehi, A.; Zhang, Q.; Adam, J.; Alrifaiy, A.; Asterholm, I.W.; Benrick, A.; Chibalina, M.V.; Eliasson, L.; et al. Somatostatin secretion by Na+-dependent Ca2+-induced Ca2+ release in pancreatic delta cells. Nature Metab. 2020, 2, 32–40. [Google Scholar] [CrossRef]
- Gray, S.M.; Xin, Y.; Ross, E.C.; Chazotte, B.M.; Capozzi, M.E.; El, K.; Svendsen, B.; Ravn, P.; Sloop, K.W.; Tong, J.; et al. Discordance between GLP-1R gene and protein expression in mouse pancreatic islet cells. J. Biol. Chem. 2020, 295, 11529–11541. [Google Scholar] [CrossRef]
- Vilsbøll, T.; Christensen, M.; E Junker, A.; Knop, F.K.; Gluud, L.L. Effects of glucagon-like peptide-1 receptor agonists on weight loss: Systematic review and meta-analyses of randomised controlled trials. BMJ 2012, 344. [Google Scholar] [CrossRef]
| Procedure | SNR, a.u. | Comment |
|---|---|---|
| Raw data | 23 ± 5 (n = 1300) | Per-cell variation of fluorescence and baseline drift |
| Normalized to initial ratio | 256 ± 24 | Baseline drifts with time |
| Linear baseline correction | 322 ± 44 | Ignores small effects |
| Exp baseline correction | 318 ± 40 | Ignores small effects |
| Spline baseline correction | 385 ± 15 | Introduces artefacts |
| Poly baseline correction | 374 ± 55 | Ignores small effects |
| Piecewise linear baseline correction | 410 ± 21 | Method of choice |
| Piecewise square baseline correction | 395 ± 28 | Introduces artefacts |
| Procedure | RMS vs. the Two-Region | Comment |
|---|---|---|
| Two-region | 0 | Bona fide but time-consuming |
| Linear | 0.152 ± 0.053 (n = 1300) | Method of choice |
| Square | 0.841 ± 0.122 | Introduces artefacts |
| End–start | 0.363 ± 0.094 | Requires smoothing, prone to artefacts |
| Sigmoid | 0.023 ± 0.008 | Precise but fitting needs supervision |
| Hill | 0.022 ± 0.007 | Precise but fitting requires supervision |
Publisher’s Note: MDPI stays neutral with regard to jurisdictional claims in published maps and institutional affiliations. |
© 2021 by the authors. Licensee MDPI, Basel, Switzerland. This article is an open access article distributed under the terms and conditions of the Creative Commons Attribution (CC BY) license (http://creativecommons.org/licenses/by/4.0/).
Share and Cite
Draper, M.; Willems, M.; Malahe, R.K.; Hamilton, A.; Tarasov, A.I. Imaging Meets Cytometry: Analyzing Heterogeneous Functional Microscopic Data from Living Cell Populations. J. Imaging 2021, 7, 9. https://doi.org/10.3390/jimaging7010009
Draper M, Willems M, Malahe RK, Hamilton A, Tarasov AI. Imaging Meets Cytometry: Analyzing Heterogeneous Functional Microscopic Data from Living Cell Populations. Journal of Imaging. 2021; 7(1):9. https://doi.org/10.3390/jimaging7010009
Chicago/Turabian StyleDraper, Matthew, Mara Willems, Reshwan K. Malahe, Alexander Hamilton, and Andrei I. Tarasov. 2021. "Imaging Meets Cytometry: Analyzing Heterogeneous Functional Microscopic Data from Living Cell Populations" Journal of Imaging 7, no. 1: 9. https://doi.org/10.3390/jimaging7010009
APA StyleDraper, M., Willems, M., Malahe, R. K., Hamilton, A., & Tarasov, A. I. (2021). Imaging Meets Cytometry: Analyzing Heterogeneous Functional Microscopic Data from Living Cell Populations. Journal of Imaging, 7(1), 9. https://doi.org/10.3390/jimaging7010009


