Investigating Optimal Time Step Intervals of Imaging for Data Quality through a Novel Fully-Automated Cell Tracking Approach


Abstract
1. Introduction
2. Materials and Methods
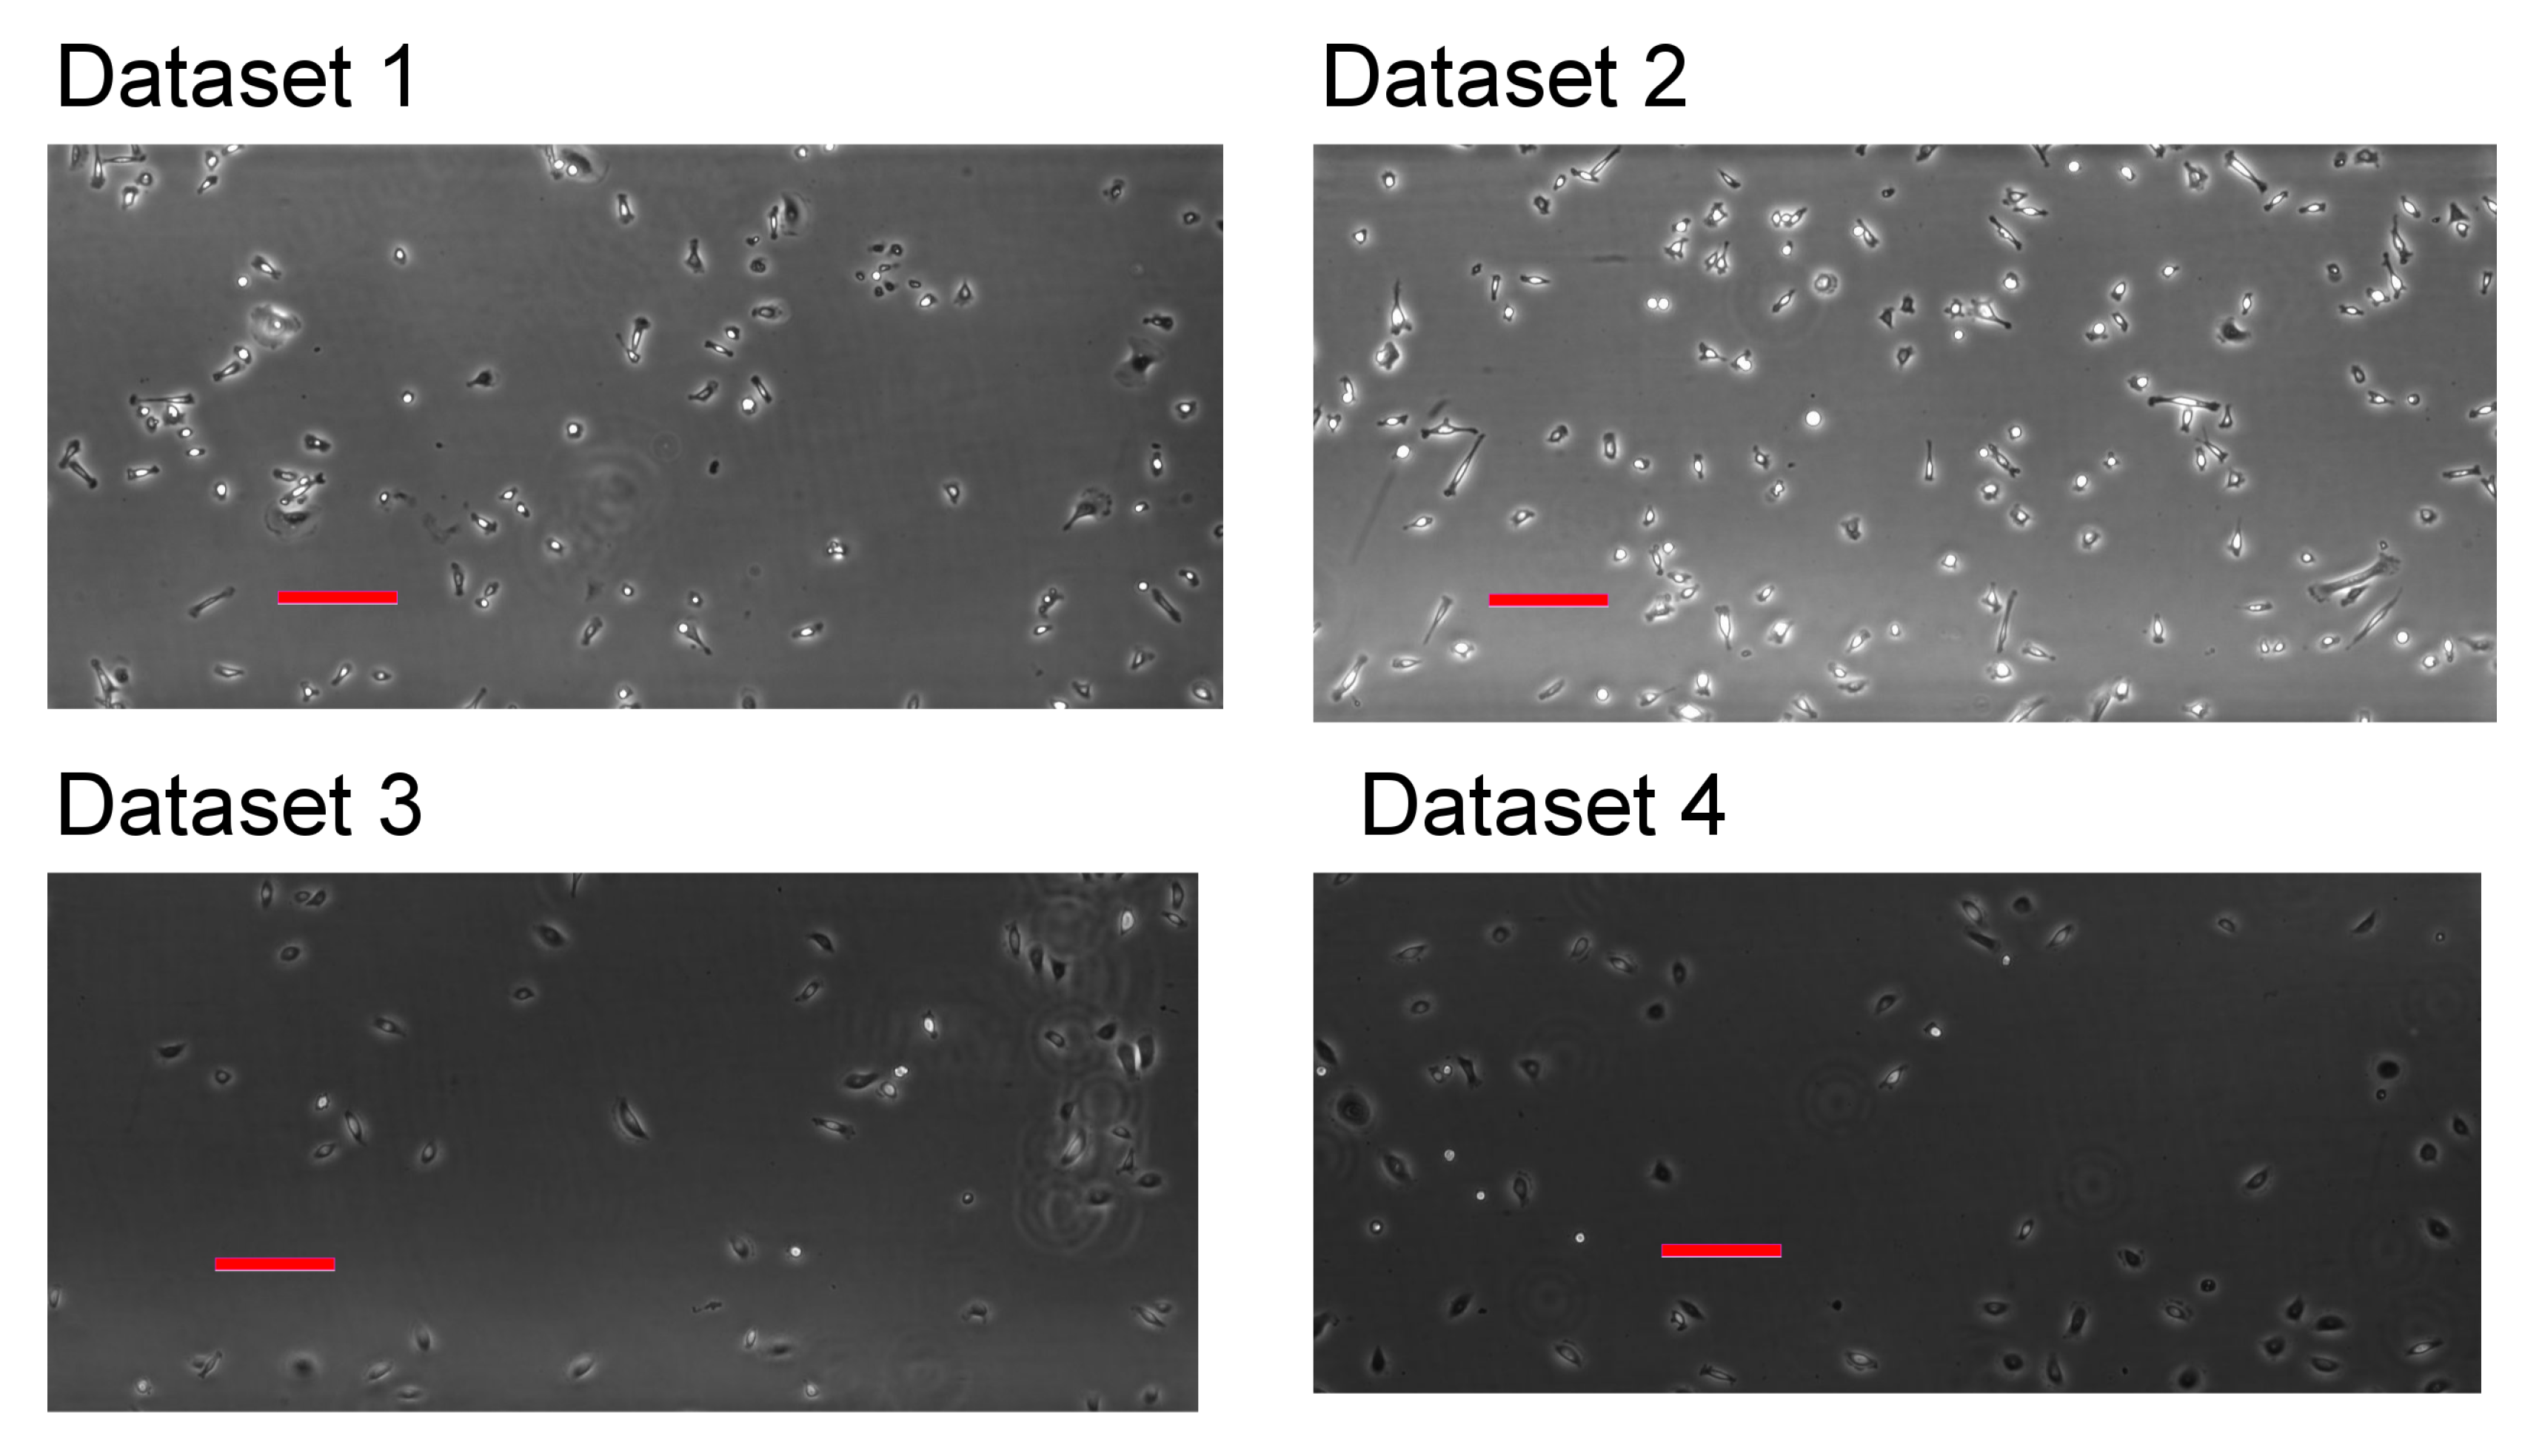
2.1. Cell Culture and Microscopy Data
- Dataset 1:
- Both reservoirs and the channel were filled with DMEM supplemented with 10% FBS to induce random migration of HT1080.
- Dataset 2:
- The lower reservoir was filled with DMEM with 10% FBS, while the channel and upper reservoir were filled with DMEM without FBS to establish a gradient inducing directed migration of HT1080.
- Dataset 3:
- The upper reservoir and the channel were filled with the DermaLife medium with 10 ng/mL epithelial growth factor (EGF; Sigma, Germany) and the lower reservoir was filled with DermaLife medium that was supplemented with a mixture of growth factors, containing 0.5 g/mL EGF and 50 ng/mL transforming growth factor -1 (Peprotech, Hamburg, Germany). At these conditions, the gradient of growth factors did not induce a chemotactic response in nHEK cells.
- Dataset 4:
- Both reservoirs and the channel were filled with the DermaLife medium with 10 ng/mL EGF to induce random migration of nHEK.
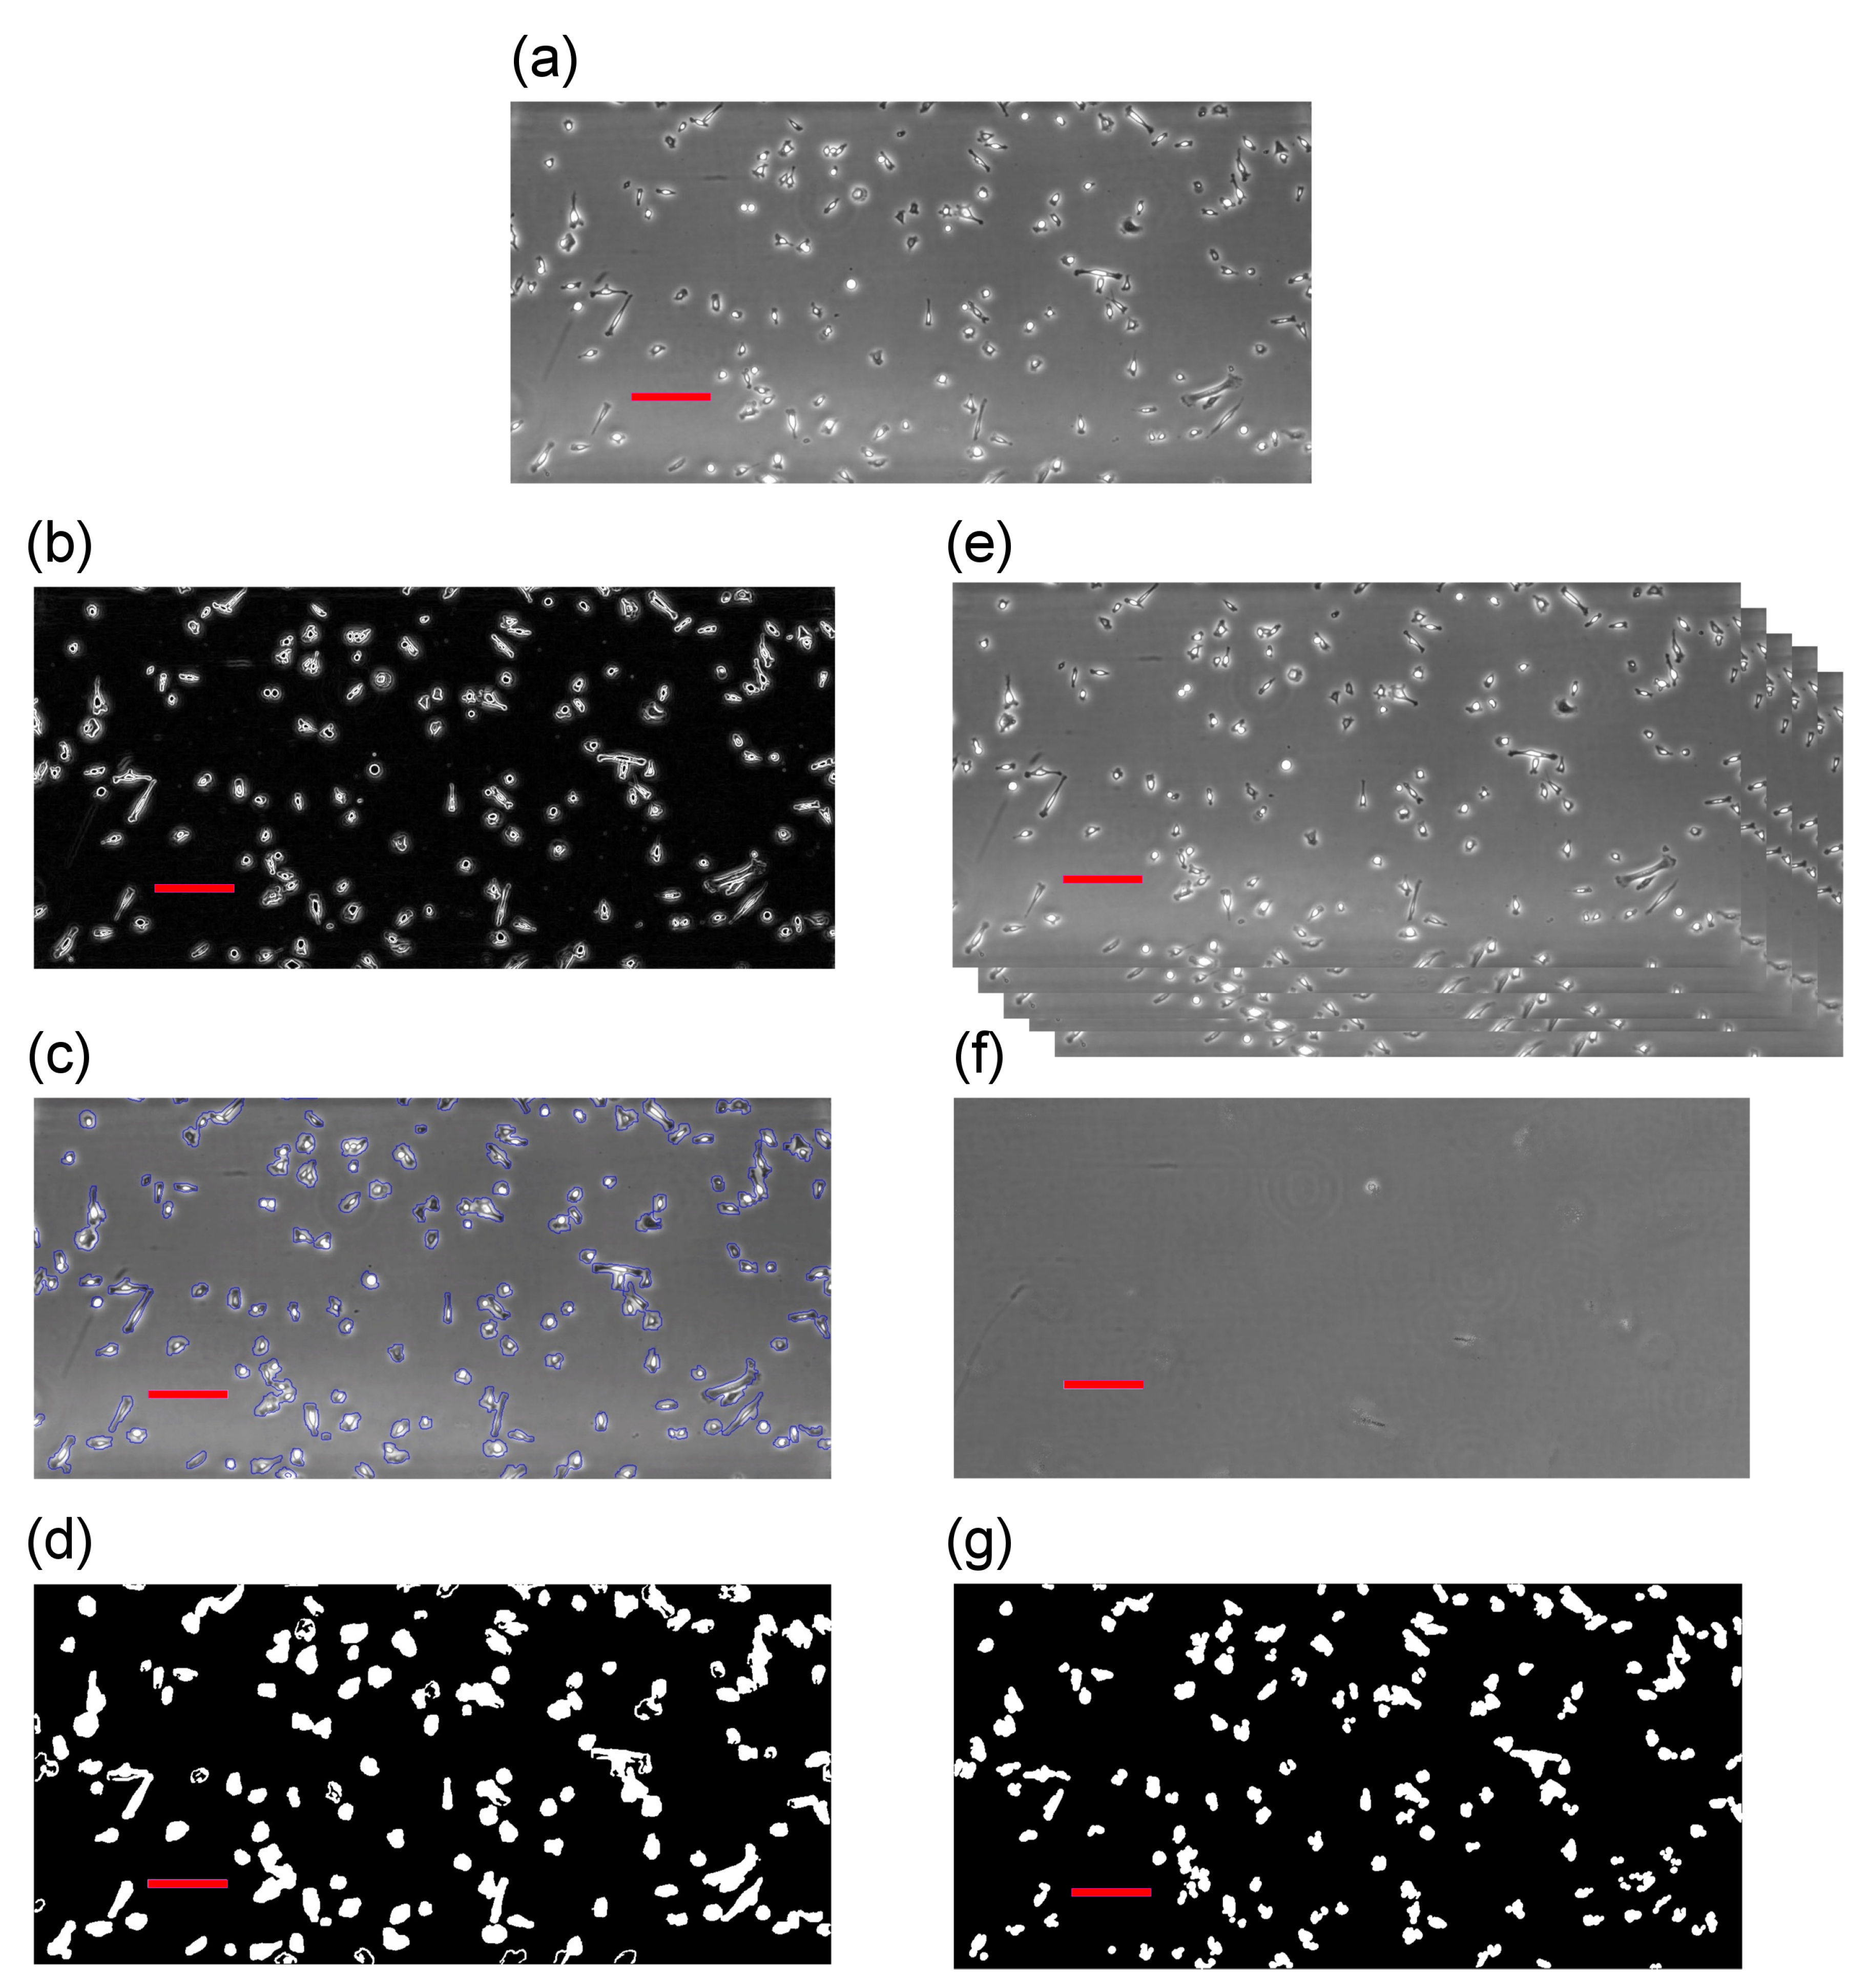
2.2. Cell Tracking Techniques
2.2.1. Segmentation Algorithm 1—Edge Detection and Active Contour
2.2.2. Segmentation Algorithm 2—Background Reconstruction and Subtraction
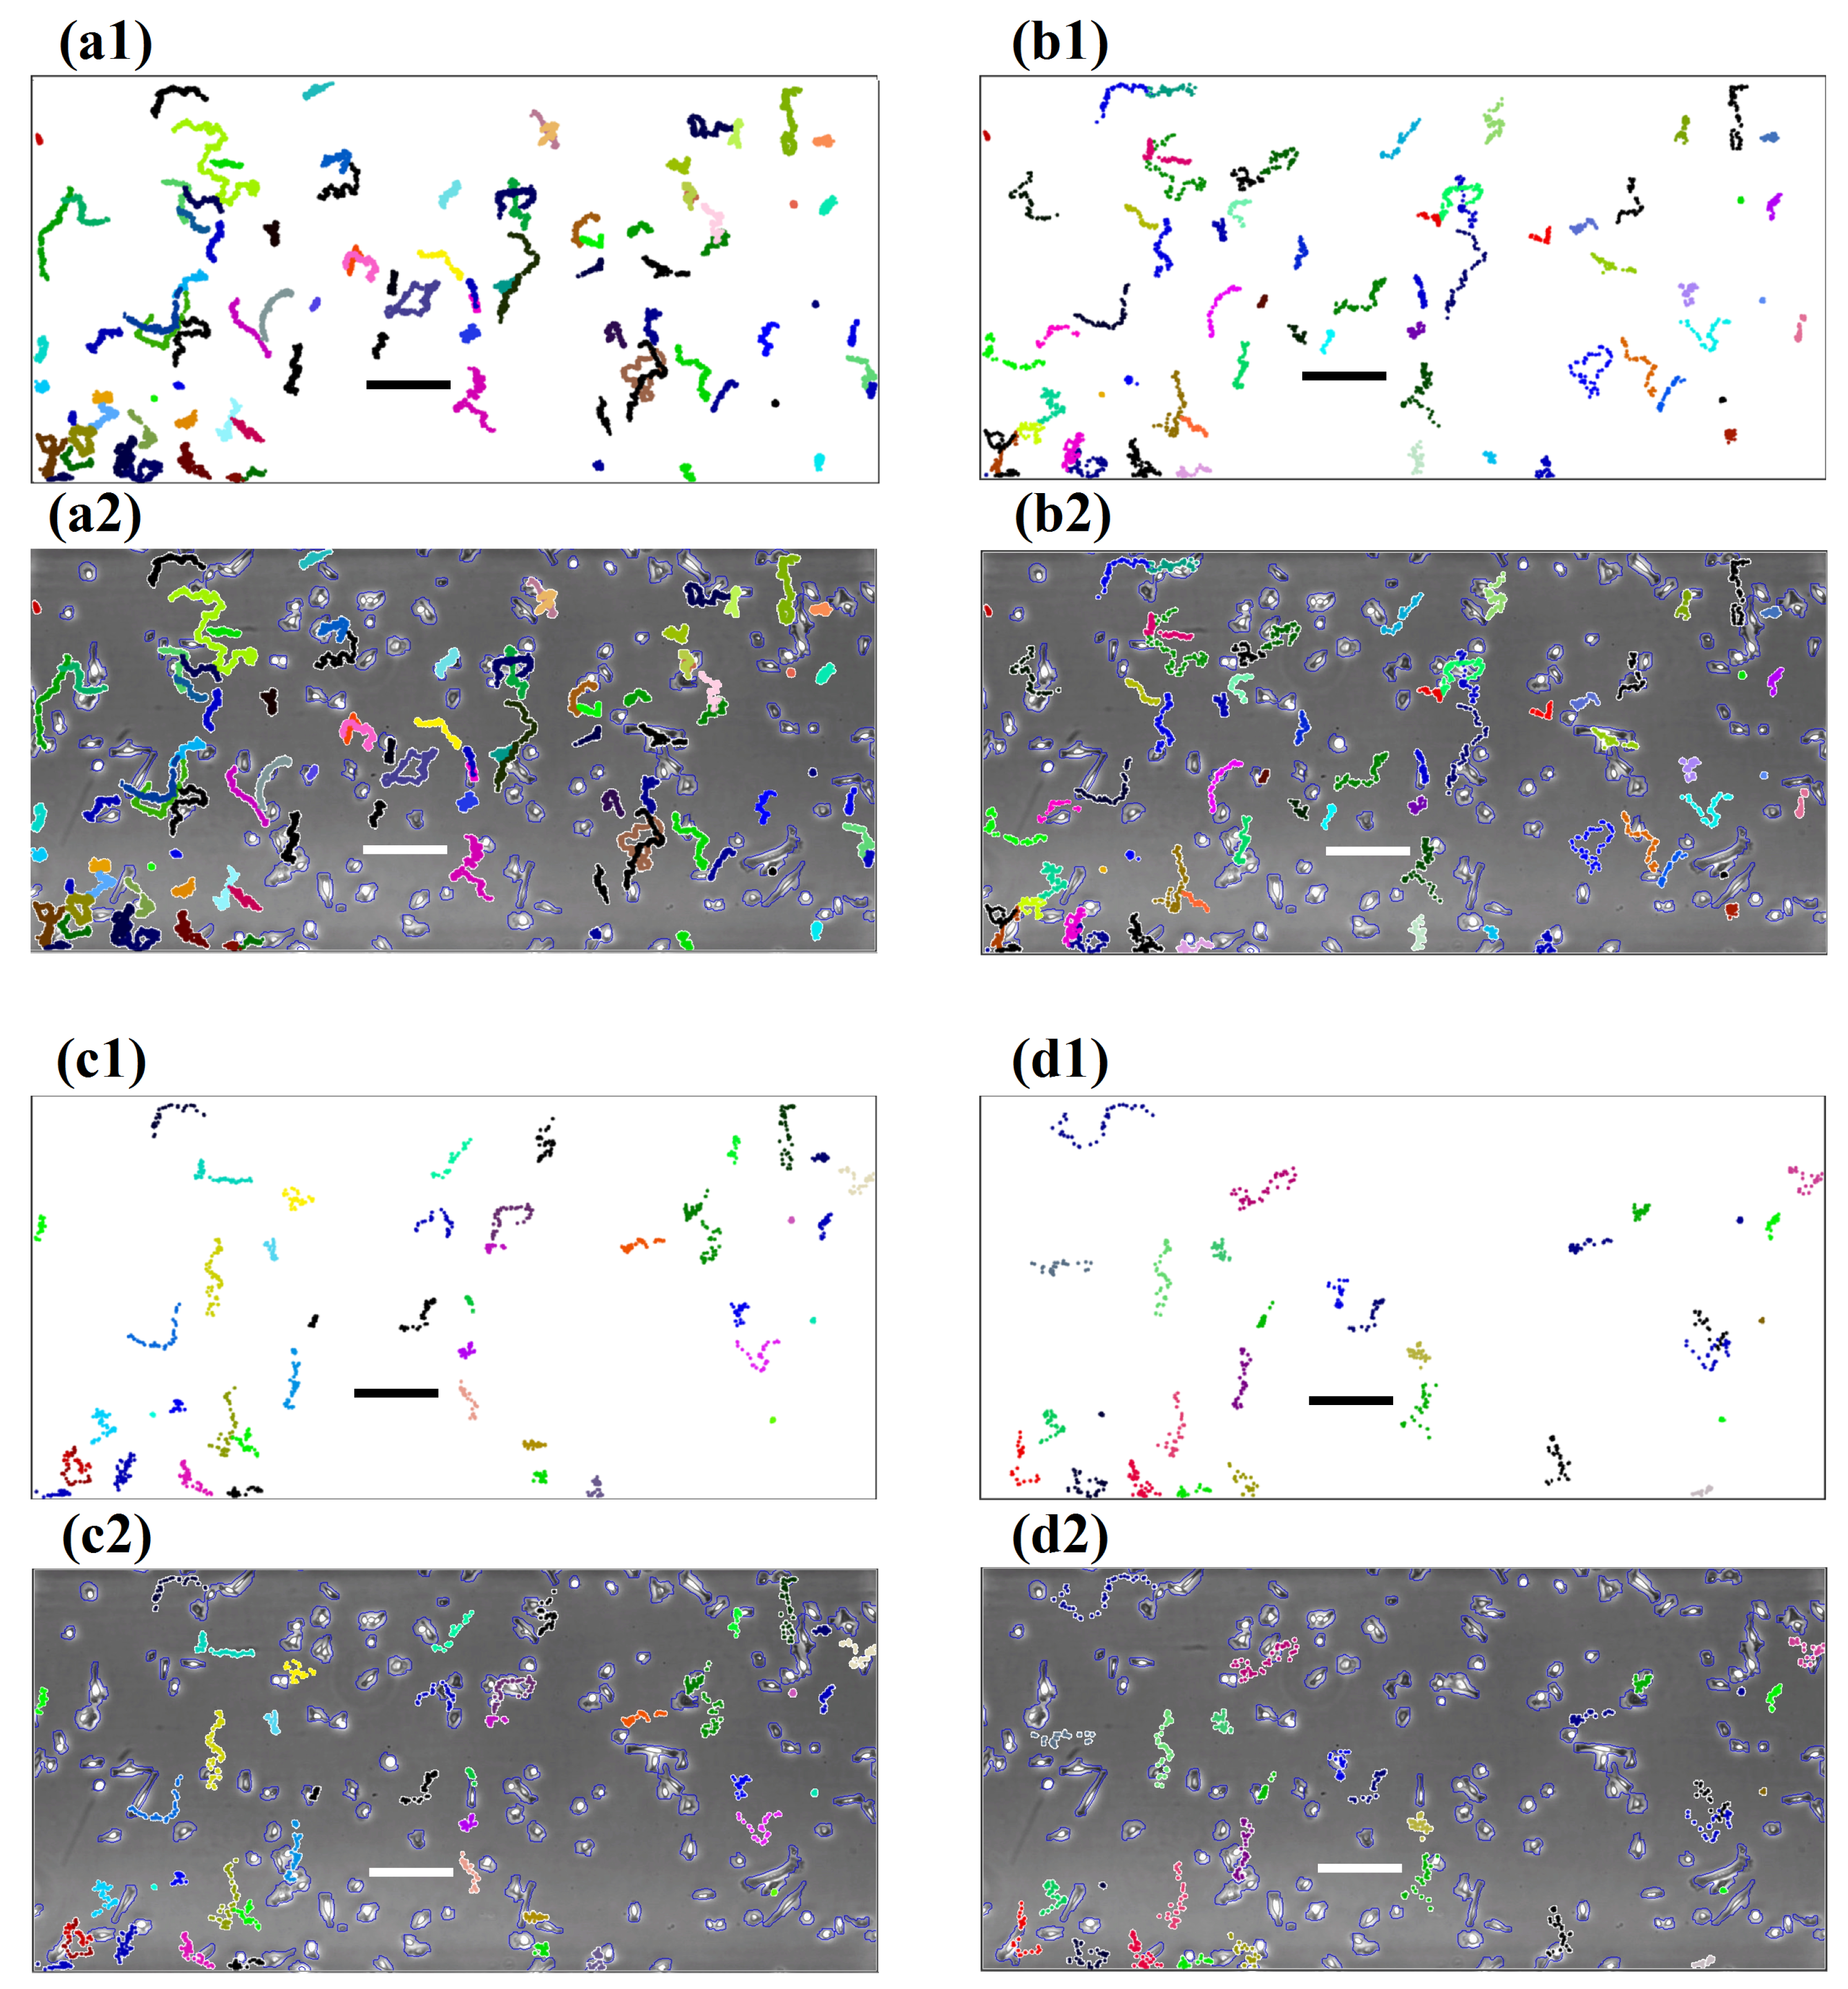
2.2.3. Tracking Algorithm—Nearest Neighbour Approach
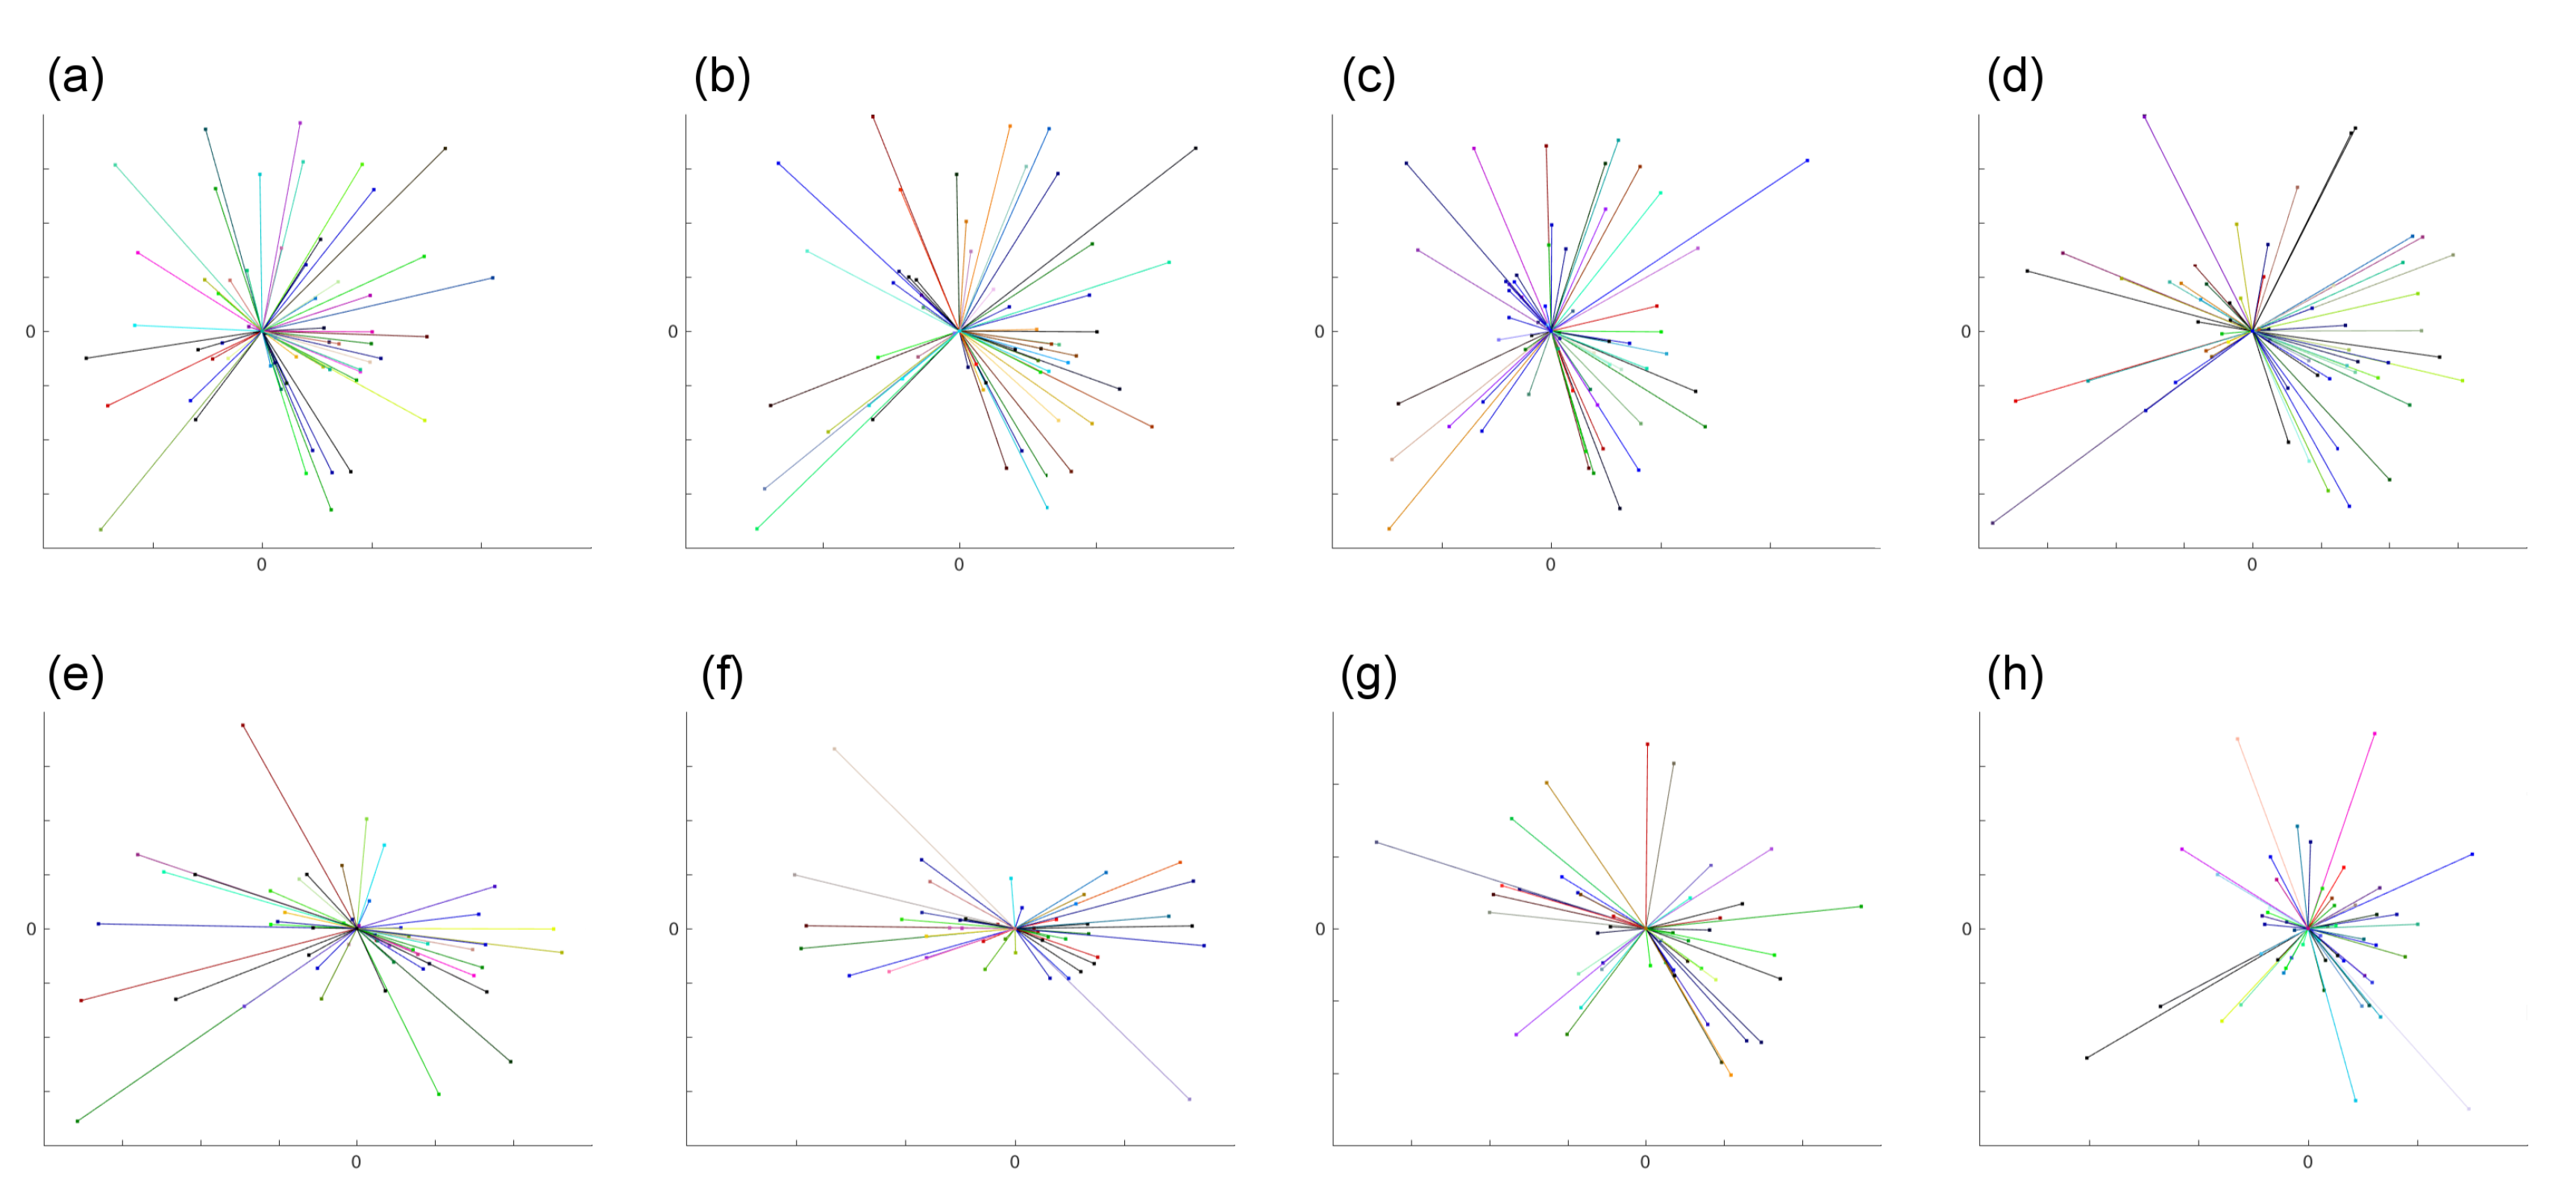
3. Results
- Dataset 1:
- Total number of frames: 2880 (24 h), confluences vary between 7.30–15.02%, random-walk pattern is expected.
- Dataset 2:
- Total number of frames: 2880 (24 h), confluences vary between 17.26–48.37%, directional migration towards south, random-walk pattern between east and west is expected.
- Dataset 3:
- Total number of frames: 2761 (23.01 h), confluences vary between 4.59–12.44%, random-walk pattern is expected.
- Dataset 4:
- Total number of frames: 2566 (21.38 h), confluences vary between 6.42–14.94%, random-walk pattern is expected.
4. Discussion
5. Conclusions
6. Data Management
Author Contributions
Funding
Acknowledgments
Conflicts of Interest
References
- Ridley, A.; Schwartz, M.; Burridge, K.; Firtel, R.; Ginsberg, M.; Borisy, G.; Parsons, J.; Horwitz, A. Cell migration: Integrating signals from front to back. Science 2003, 302, 1704–1709. [Google Scholar] [CrossRef] [PubMed]
- Friedl, P.; Wolf, K. Plasticity of cell migration: A multiscale tuning model. J. Cell Biol. 2010, 188, 11. [Google Scholar] [CrossRef] [PubMed]
- Olson, M.; Sahai, E. The actin cytoskeleton in cancer cell motility. Clin. Exp. Metastasis 2009, 26, 273. [Google Scholar] [CrossRef] [PubMed]
- Stephens, L.; Milne, L.; Hawkins, P. Moving towards a better understanding of chemotaxis. Curr. Biol. 2008, 18, R485–R494. [Google Scholar] [CrossRef] [PubMed]
- Scarpa, E.; Mayor, R. Collective cell migration in development. J. Cell Biol. 2016, 212, 143. [Google Scholar] [CrossRef] [PubMed]
- Pollard, T.; Borisy, G. Cellular motility driven by assembly and disassembly of actin filaments. Cell 2003, 112, 453–465. [Google Scholar] [CrossRef]
- Pollard, T.; Cooper, J. Actin, A central player in cell shape and movement. Science 2009, 326, 1208–1212. [Google Scholar] [CrossRef]
- Stelzer, E. Light-sheet fluorescence microscopy for quantitative biology. Nat. Methods 2015, 12, 23–26. [Google Scholar] [CrossRef]
- Wagner, M.; Weber, P.; Bruns, T.; Strauss, W.; Wittig, R.; Schneckenburger, H. Light dose is a limiting factor to maintain cell viability in fluorescence microscopy and single molecule detection. Int. J. Mol. Sci. 2010, 11, 956–966. [Google Scholar] [CrossRef]
- Greger, K.; Swoger, J.; Stelzer, E. Basic building units and properties of a fluorescence single plane illumination microscope. Rev. Sci. Instrum. 2007, 78, 023705. [Google Scholar] [CrossRef]
- Keller, P.; Schmidt, A.; Santella, A.; Khairy, K.; Bao, Z.; Wittbrodt, J.; Stelzer, E. Fast, high-contrast imaging of animal development with scanned light sheet–based structured-illumination microscopy. Nat. Methods 2010, 7, 637–642. [Google Scholar] [CrossRef] [PubMed]
- Chan, T.; Vese, L. Active contours without edges. IEEE Trans. Image Process. 2001, 10, 266–277. [Google Scholar] [CrossRef] [PubMed]
- Bosgraaf, L.; van Haastert, P.; Bretschneider, T. Analysis of cell movement by simultaneous quantification of local membrane displacement and fluorescent intensities using Quimp2. Cell Motil. Cytoskelet. 2009, 66, 1560165. [Google Scholar] [CrossRef] [PubMed]
- Maska, M.; Ulman, V.; Svoboda, D.; Matula, P.; Matula, P.; Ederra, C.; Urbiola, A.; Espana, T.; Venkatesan, S.; Balak, D.; et al. A benchmark for comparison of cell tracking algorithms. Bioinformatics 2014, 30, 1609–1700. [Google Scholar] [CrossRef]
- Miura, K. Tracking movement in cell biology. Adv. Biochem. Eng./Biotechnol. 2005, 95, 267–295. [Google Scholar]
- Crocker, J.; Grier, D. Methods of digital video microscopy for colloidal studies. J. Colloid Interface Sci. 1996, 179, 298–310. [Google Scholar] [CrossRef]
- Gonzalez, R.; Woods, R.; Eddins, S. Digital Image Processing: Using MATLAB; Pearson/Prentice Hall: Upper Saddle River, NJ, USA, 2004. [Google Scholar]
- Hand, A.; Sun, T.; Barber, D.; Hose, D.; MacNeil, S. Automated tracking of migrating cells in phase-contrast video microscopy sequences using image registration. J. Microsc. 2009, 234, 62–69. [Google Scholar] [CrossRef]
- Horn, B.; Schunck, B. Determining optical flow. Artif. Intell. 1981, 17, 185–203. [Google Scholar] [CrossRef]
- Meijering, E.; Dzyubachyk, O.; Smal, I. Methods for cell and particle tracking. Methods Enzymol. 2012, 504, 183–200. [Google Scholar]
- de Rooij, J.; Kerstens, A.; Danuser, G.; Schwartz, M.; Waterman-Storer, C. Integrin-dependent actomyosin contraction regulates epithelial cell scattering. J. Cell Biol. 2005, 171, 153–164. [Google Scholar] [CrossRef]
- Peschetola, V.; Laurent, V.; Duperray, A.; Michel, R.; Ambrosi, D.; Preziosi, L.; Verdier, C. Time-dependent traction force microscopy for cancer cells as a measure of invasiveness. Cytoskeleton 2013, 70, 201–214. [Google Scholar] [CrossRef] [PubMed]
- Schneckenburger, H.; Weber, P.; Wagner, M.; Schickinger, S.; Richter, V.; Bruns, T.; Strauss, W.; Wittig, R. Light exposure and cell viability in fluorescence microscopy. J. Microsc. 2012, 245, 311–318. [Google Scholar] [CrossRef] [PubMed]
- Waldchen, S.; Lehmann, J.; Klein, T.; van de Linde, S.; Sauer, M. Light-induced cell damage in live-cell super-resolution microscopy. Sci. Rep. 2015, 5, 15348. [Google Scholar] [CrossRef] [PubMed]
- Hoebe, R.; van Oven, C.; Gadella, T.; Dhonukshe, P.; van Noorden, C.; Manders, E. Controlled light-exposure microscopy reduces photobleaching and phototoxicity in fluorescence live-cell imaging. Nat. Biotechnol. 2007, 25, 249–253. [Google Scholar] [CrossRef] [PubMed]
- Frigault, M.; Lacoste, J.; Swift, J.; Brown, C. Live-cell microscopy—Tips and tools. J. Cell Sci. 2009, 122, 753–767. [Google Scholar] [CrossRef] [PubMed]
- Carlton, P.; Boulanger, J.; Kervrann, C.; Sibarita, J.; Salamero, J.; Gordon-Messer, S.; Bressan, D.; Haber, J.; Haase, S.; Shao, L.; et al. Fast live simultaneous multiwavelength four-dimensional optical microscopy. Proc. Natl. Acad. Sci. USA 2010, 107, 16016–16022. [Google Scholar] [CrossRef]
- Artifacts of light. Nat. Methods 2013, 10, 1135. [CrossRef]
- Murphy, D. Fundamentals of Light Microscopy and Electronic Imaging; Wiley-Liss: New York, NY, USA, 2001; pp. 97–112. [Google Scholar]
- Yang, F.; Venkataraman, C.; Styles, V.; Kuttenberger, V.; Horn, E.; von Guttenberg, Z.; Madzvamuse, A. A computational framework for particle and whole cell tracking. J. Biomech. 2016, 49, 1290–1304. [Google Scholar] [CrossRef]
- Roussos, E.; Condeelis, J.; Patsialou, A. Chemotaxis in cancer. Nat. Rev. Cancer 2011, 11, 573–587. [Google Scholar] [CrossRef]
- Grinnell, F. Wound repair, keratinocyte activation and integrin modulation. J. Cell Sci. 1992, 101, 1–5. [Google Scholar]
- Zantl, R.; Horn, E. Chemotaxis of slow migrating mammalian cells analysed by video microscopy. Methods Mol. Biol. 2011, 769, 191–203. [Google Scholar] [PubMed]
- Bear, J.; Haugh, J. Directed migration of mesenchymal cells: Where signaling and the cytoskeleton meet. Curr. Opin. Cell Biol. 2014, 30, 74–82. [Google Scholar] [CrossRef] [PubMed]
- Zengel, P.; Nguyen-Hoang, A.; Schildhammer, C.; Zantl, R.; Kahl, V.; Horn, E. μ-Slide Chemotaxis: A new chamber for long-term chemotaxis studies. BMC Cell Biol. 2011, 12, 21. [Google Scholar] [CrossRef] [PubMed]
- Debeir, O.; Milojevic, D.; Leloup, T.; van Ham, P.; Kiss, R.; Decaestecker, C. Mitotic tree construction by computer in vitro cell tracking: A tool for proliferation. In Proceedings of the EUROCON 2005 the International Conference on Computer as a Tool, Belgrade, Serbia, 21–24 November 2005; Volume 2, pp. 1–10. [Google Scholar]
- Li, K.; Miller, E.; Weiss, L.; Campbell, P.; Kanade, T. Online tracking of migrating and proliferating cells imaged with phase-contrast microscopy. In Proceedings of the 2006 Conference on Computer Vision and Pattern Recongnition Workshop, New York, NY, USA, 17–22 June 2006. [Google Scholar]
- Sacan, A.; Ferhatosmanoglu, H.; Coskun, H. CellTrack: An open-souce software for cell tracking and motility analysis. Bioinformatics 2008, 24, 1647–1649. [Google Scholar] [CrossRef]
- Topman, G.; Sharabani-Yosef, O.; Gefen, A. A Method for Quick, Low-Cost Automated Confluency Measurements. Microsc. Microanal. 2011, 17, 915–922. [Google Scholar] [CrossRef] [PubMed]
- Xiao, M.; Zhang, L.; Kou, W.; Miao, Y.; Liu, W. A background reconstruction algorithm based on intensity extremum classification. Adv. Inf. Sci. Serv. Sci. 2012, 4, 337–345. [Google Scholar]
- Halang, P.; Vorburger, T.; Steuber, J. Serine 26 in the PomB Subunit of the Flagellar Motor Is Essential for Hypermotility of Vibrio cholerae. PLoS ONE 2015, 10, e0123518. [Google Scholar] [CrossRef]
- Caino, M.; Ghosh, J.; Chae, Y.; Vaira, V.; Rivadeneira, D.; Faversani, A.; Rampini, P.; Kossenkov, A.; Aird, K.; Zhang, R.; et al. PI3K therapy reprograms mitochondrial trafficking to fuel tumor cell invasion. Proc. Natl. Acad. Sci. USA 2015, 112, 8638–8643. [Google Scholar] [CrossRef] [PubMed]
- Popp, F.; Armitage, J.; Schuler, D. Polarity of bacterial magnetotaxis is controlled by aerotaxis through a common sensory pathway. Nat. Commun. 2014, 5, 5398. [Google Scholar] [CrossRef]
- Gilad, T.; Bray, M.; Carpenter, A.; Riklin-Raviv, T. Symmetry-based mitosis detection in time-lapse microscopy. In Proceedings of the IEEE International Symposium Biomedical Imaging: From Nano to Macro, New York, NY, USA, 16–19 April 2015; pp. 164–167. [Google Scholar]
- Ulman, V.; Maška, M.; Magnusson, K.; Ronneberger, O.; Haubold, C.; Harder, N.; Matula, P.; Matula, P.; Svoboda, D.; Radojevic, M.; et al. An objective comparison of cell-tracking algorithms. Nat. Methods 2017, 14, 1141–1152. [Google Scholar] [CrossRef]
- Guo, Z.; Lin, P.; Lowengrub, J.; Wise, S. Mass conservative and energy stable finite difference methods for the quasi-incompressible Navier–Stokes–Cahn–Hilliard system: Primitive variable and projection-type schemes. Comput. Methods Appl. Mech. Eng. 2017, 326, 144–174. [Google Scholar] [CrossRef]
- Feng, W.; Guo, Z.; Lowengrub, J.; Wise, S. A mass-conservative adaptive FAS multigrid solver for cell-centered finite difference methods on block-structured, locally-cartesian grids. J. Comput. Phys. 2018, 352, 463–497. [Google Scholar] [CrossRef]


| Time Step Interval | Trajectories | South Moving Trajectories | % of South Moving | East Moving Trajectories | % of East Moving | Accuracy |
|---|---|---|---|---|---|---|
| Dataset 1 | ||||||
| 30 s | 60 | 35 | 58.3% | 35 | 58.3% | 98.3% |
| 1 min | 58 | 34 | 58.6% | 32 | 55.2% | 96.6% |
| 2 min | 59 | 33 | 56.0% | 34 | 57.6% | 95.0% |
| 3 min | 59 | 29 | 49.2% | 33 | 55.9% | 93.2% |
| 5 min | 51 | 29 | 56.9% | 30 | 58.8% | 88.2% |
| 7.5 min | 53 | 28 | 52.8% | 31 | 58.5% | 88.7% |
| 10 min | 45 | 21 | 46.7% | 27 | 60.0% | 84.4% |
| 15 min | 45 | 25 | 55.6% | 27 | 60.0% | 84.4% |
| Dataset 2 | ||||||
| 30 s | 93 | 73 | 78.5% | 48 | 51.6% | 96.0% |
| 1 min | 87 | 69 | 79.3% | 42 | 48.3% | 94.2% |
| 2 min | 76 | 59 | 77.6% | 42 | 55.3% | 93.4% |
| 3 min | 67 | 53 | 79.1% | 37 | 55.2% | 93.0% |
| 5 min | 56 | 45 | 80.4% | 29 | 52.0% | 86.0% |
| 7.5 min | 63 | 48 | 76.2% | 32 | 50.8% | 81.0% |
| 10 min | 46 | 35 | 76.1% | 28 | 60.8% | 76.0% |
| 15 min | 30 | 22 | 73.3% | 18 | 60.0% | 66.7% |
| Dataset 3 | ||||||
| 30 s | 49 | 26 | 53.1% | 27 | 55.1% | 93.9% |
| 1 min | 49 | 26 | 53.1% | 26 | 53.1% | 96.0% |
| 2 min | 49 | 25 | 51.0% | 30 | 61.2% | 93.9% |
| 3 min | 49 | 24 | 49.0% | 31 | 63.3% | 92.0% |
| 5 min | 44 | 23 | 52.3% | 26 | 59.1% | 84.1% |
| 7.5 min | 40 | 20 | 50.0% | 24 | 60.0% | 82.5% |
| 10 min | 36 | 19 | 53.0% | 21 | 58.3% | 80.5% |
| 15 min | 27 | 8 | 29.6% | 13 | 48.1% | 74.1% |
| Dataset 4 | ||||||
| 30 s | 56 | 29 | 51.8% | 25 | 44.6% | 91.1% |
| 1 min | 57 | 32 | 56.1% | 26 | 45.6% | 91.2% |
| 2 min | 59 | 33 | 55.9% | 31 | 52.5% | 90.0% |
| 3 min | 62 | 36 | 58.1% | 29 | 46.8% | 88.7% |
| 5 min | 55 | 32 | 58.2% | 27 | 49.1% | 85.5% |
| 7.5 min | 51 | 32 | 62.7% | 20 | 39.2% | 80.4% |
| 10 min | 44 | 24 | 54.5% | 18 | 40.9% | 77.3% |
| 15 min | 41 | 23 | 56.1% | 16 | 39.0% | 73.2% |
| Time Step Interval | Trajectories | South Moving Trajectories | % of South Moving | East Moving Trajectories | % of East Moving | Accuracy |
|---|---|---|---|---|---|---|
| Dataset 1 | ||||||
| 30 s | 31 | 15 | 48.4% | 17 | 54.8% | 89.2% |
| 1 min | 36 | 18 | 50.0% | 21 | 58.3% | 84.4% |
| 2 min | 34 | 18 | 52.9% | 17 | 50.0% | 83.2% |
| 3 min | 39 | 19 | 48.7% | 23 | 58.9% | 81.1% |
| 5 min | 21 | 12 | 57.1% | 12 | 57.1% | 78.8% |
| 7.5 min | 18 | 9 | 50.0% | 11 | 61.1% | 75.5% |
| 10 min | 29 | 17 | 58.6% | 19 | 65.5% | 72.5% |
| 15 min | 26 | 13 | 50.0% | 16 | 61.5% | 67.8% |
| Dataset 2 | ||||||
| 30 s | 36 | 28 | 77.8% | 20 | 55.6% | 83.3% |
| 1 min | 38 | 31 | 81.6% | 21 | 55.3% | 81.6% |
| 2 min | 39 | 31 | 79.5% | 19 | 48.7% | 79.5% |
| 3 min | 43 | 31 | 72.1% | 21 | 48.8% | 74.4% |
| 5 min | 41 | 29 | 70.7% | 20 | 48.8% | 73.2% |
| 7.5 min | 39 | 28 | 71.8% | 20 | 51.3% | 74.4% |
| 10 min | 42 | 31 | 73.8% | 25 | 59.5% | 71.4% |
| 15 min | 43 | 32 | 74.4% | 26 | 60.5% | 65.1% |
| Dataset 3 | ||||||
| 30 s | 20 | 10 | 50.0% | 12 | 60.0% | 93.5% |
| 1 min | 19 | 11 | 57.8% | 10 | 52.6% | 91.1% |
| 2 min | 21 | 11 | 52.3% | 10 | 47.6% | 90.3% |
| 3 min | 24 | 13 | 54.1% | 11 | 45.8% | 85.2% |
| 5 min | 22 | 13 | 59.0% | 12 | 54.5% | 79.0% |
| 7.5 min | 21 | 10 | 47.6% | 12 | 57.1% | 77.2% |
| 10 min | 18 | 8 | 44.4% | 10 | 55.5% | 68.1% |
| 15 min | 9 | 3 | 33.3% | 5 | 55.5% | 55.4% |
| Dataset 4 | ||||||
| 30 s | 43 | 19 | 44.2% | 20 | 46.5% | 86.0% |
| 1 min | 42 | 23 | 54.8% | 22 | 52.4% | 85.7% |
| 2 min | 45 | 26 | 57.8% | 24 | 53.3% | 82.2% |
| 3 min | 41 | 22 | 53.7% | 22 | 53.7% | 80.5% |
| 5 min | 44 | 26 | 59.1% | 22 | 50.0% | 79.5% |
| 7.5 min | 39 | 24 | 61.5% | 19 | 48.7% | 77.0% |
| 10 min | 31 | 18 | 58.1% | 10 | 32.3% | 64.5% |
| 15 min | 23 | 13 | 56.5% | 13 | 56.5% | 43.4% |
© 2020 by the authors. Licensee MDPI, Basel, Switzerland. This article is an open access article distributed under the terms and conditions of the Creative Commons Attribution (CC BY) license (http://creativecommons.org/licenses/by/4.0/).
Share and Cite
Yang, F.W.; Tomášová, L.; Guttenberg, Z.v.; Chen, K.; Madzvamuse, A. Investigating Optimal Time Step Intervals of Imaging for Data Quality through a Novel Fully-Automated Cell Tracking Approach. J. Imaging 2020, 6, 66. https://doi.org/10.3390/jimaging6070066
Yang FW, Tomášová L, Guttenberg Zv, Chen K, Madzvamuse A. Investigating Optimal Time Step Intervals of Imaging for Data Quality through a Novel Fully-Automated Cell Tracking Approach. Journal of Imaging. 2020; 6(7):66. https://doi.org/10.3390/jimaging6070066
Chicago/Turabian StyleYang, Feng Wei, Lea Tomášová, Zeno v. Guttenberg, Ke Chen, and Anotida Madzvamuse. 2020. "Investigating Optimal Time Step Intervals of Imaging for Data Quality through a Novel Fully-Automated Cell Tracking Approach" Journal of Imaging 6, no. 7: 66. https://doi.org/10.3390/jimaging6070066
APA StyleYang, F. W., Tomášová, L., Guttenberg, Z. v., Chen, K., & Madzvamuse, A. (2020). Investigating Optimal Time Step Intervals of Imaging for Data Quality through a Novel Fully-Automated Cell Tracking Approach. Journal of Imaging, 6(7), 66. https://doi.org/10.3390/jimaging6070066