Article

Radio Frequency Modeling of Receive Coil Arrays for Magnetic Resonance Imaging

by
Christopher Stumpf
1,*,†,
Matthias Malzacher
2 and
Lorenz-Peter Schmidt
1
1
Institute of Microwaves and Photonics, Friedrich-Alexander-University Erlangen-Nuremberg, 91058 Erlangen, Germany
2
Computer Assisted Clinical Medicine, Medical Faculty Mannheim, Heidelberg University, 68167 Mannheim, Germany
*
Author to whom correspondence should be addressed.
Current address: WORK Microwave, 83607 Holzkirchen, Germany.
J. Imaging 2018, 4(5), 67; https://doi.org/10.3390/jimaging4050067
Submission received: 1 April 2018 / Revised: 28 April 2018 / Accepted: 1 May 2018 / Published: 7 May 2018

Abstract

:
The numerical calculation of the signal-to-noise ratio (SNR) of magnetic resonance imaging (MRI) coil arrays is a powerful tool in the development of new coil arrays. The proposed method describes a complete model that allows the calculation of the absolute SNR values of arbitrary coil arrays, including receiver chain components. A new method for the SNR calculation of radio frequency receive coil arrays for MRI is presented, making use of their magnetic B 1 transmit pattern and the S-parameters of the network. The S-parameters and B 1 fields are extracted from an electromagnetic field solver and are post-processed using our developed model to provide absolute SNR values. The model includes a theory for describing the noise of all components in the receiver chain and the noise figure of a pre-amplifier by a simple passive two-port network. To validate the model, two- and four-element receive coil arrays are investigated. The SNR of the examined arrays is calculated and compared to measurement results using imaging of a saline water phantom in a 3   T scanner. The predicted values of the model are in good agreement with the measured values. The proposed method can be used to predict the absolute SNR for any receive coil array by calculating the transmit B 1 pattern and the S-parameters of the network. Knowledge of the components of the receiver chain including pre-amplifiers leads to satisfactory results compared to measured values, which proves the method to be a useful tool in the development process of MRI receive coil arrays.

1. Introduction

The signal-to-noise ratio (SNR) of receive coils in magnetic resonance imaging (MRI) is a crucial value in terms of image quality. In the development process of receive coil arrays for MRI, the available SNR can be considered the most important parameter. As common array structures can be complex, an analytical calculation of the SNR, as for example shown in [1,2], is not feasible. Here, the progress of electromagnetic field solvers has opened possibilities for predicting the SNR of coil arrays. Many approaches can be found in literature that deal with numerical modeling of coils used in MRI. For example, the authors of [3] show an approach for numerically calculating values of B 1 / P , where B 1 denotes the counter-rotating transmit field and P the dissipated power [4]. A finite difference time domain (FDTD) solver [5] is used to calculate the magnetic field and the absorbed power, leading to the SNR of a receive coil, which is proportional to B 1 / P . This exploits the principle of reciprocity as described in [6]. In [7], a simulator is shown that can determine the sensitivity of a coil using an FDTD solver. In addition, in [8,9,10], further numerical approaches are provided to calculate coil sensitivity. In [11], an approach is shown that makes use of the magnetic fields and S-parameters of the coil model that were calculated in a three-dimensional (3D) electromagnetic field simulation, adding the parameters of the receiver chain in a post-processing step. When mutual coupling within the array cannot be neglected, the noise properties of the pre-amplifiers must be considered in the SNR calculation, as will be shown in this work. In our approach, a complete model for any coil array including the receiver chain is proposed, which makes use of the numerical B 1 values that can be extracted from an electromagnetic field solver as shown in the literature [3,4,5,6,7,8,9]. Further, the S-parameters of the coil are post-processed, considering all noisy components of the receiver chain and an accurate model of the pre-amplifier noise contributions. The investigated cases focus on lightly loaded coil arrays, as the correct modeling of noise coupling of the pre-amplifiers becomes more important in this case. The degree of SNR degradation due to pre-amplifier noise coupling has already been discussed in [12,13]. In [12] a model for pre-amplifier noise parameters is proposed, which is extended in this work. The restriction that applies to this model is the required identity of noise parameters of all channels, which usually holds true in good approximation for common arrays.
A calibration method allows us to determine the constant factor between coil sensitivity and SNR, making an absolute comparison of measured and calculated SNR values possible [14]. Therefore, the proposed model allows absolute and accurate SNR prediction of arbitrary coil arrays, including a lossy S-parameter model for pre-amplifier noise to account for noise coupling, which is shown to have a significant impact on the SNR for arrays with a large number of elements.
This work proposes a mathematical description for calculating the maximum combined SNR of MRI receive coil arrays utilizing numerical B 1 -field values and S-parameters, and includes a new, complete model of pre-amplifier noise contribution, which allows an accurate prediction of the absolute SNR values in MRI images.

2. Theory

2.1. SNR Calculation

The SNR of a receive coil array for MRI has been widely discussed in the literature. It can be stated as in [1]:
SNR ( r ) = ω V M T ( r ) 4 k B T Δ f B 1 ( r ) P C + P L = K c a l · B 1 ( r ) P
The first term, which includes the Larmor frequency ω , the volume V of a voxel at the point of interest r , the complex valued nuclear transverse magnetization M T in that voxel, the Boltzmann constant k B , the temperature T, and the receiver bandwidth Δ f , comprises the factor K c a l that can be determined in a calibration measurement. A calibration method for the acquisition of K c a l is shown in [14]. The complex valued magnetic counter-rotating B 1 field denotes the circular polarized component of the coil array’s composite transmit field that is parallel and in conjugate phase with the magnetization M T . The dissipated power in the coil array P C and in the load P L in the case of transmit coils is equivalent to their noise power in the receive case. The term B 1 ( r ) / P is the starting point for the proposed SNR calculation.
From an electromagnetic field simulation a normalized, complex magnetic field vector B n ( r ) of an n-channel coil array can be extracted with the array’s scattering matrix S C . The field vector comprises the complex, circular polarized components that are normalized to the incoming wave a ν at the respective coil channel ν :
B ν ( r ) = 1 2 ( B ν , x ( r ) i B ν , y ( r ) ) / a ν .
Normalization is done because of the subsequent multiplication of the field vector with a wave vector for maximum SNR values.
In Figure 1, the coil array network with matrix S C is connected to the network of the receiver chain with its S-parameters S R C . The vectors A C and A R C denote the incoming waves at ports ( 2 n + 1 ) 3 n of the coil network S C and at ports 1 n of the receiver chain network S R C , respectively. The receiver chain network consists of two-port networks that describe all components between the coil ports and the pre-amplifier. The composition of S R C that has been used in this work is shown in Figure 2. It consists of 2 n -port networks for the pre-amplifiers ( S P A ), phase shifters for pre-amp decoupling ( S ϕ ), matching networks ( S M N ), and coil losses ( S C L ). Every 2 n -port network of the receiver chain is comprised of n decoupled 2-port networks, as indicated in Figure 2. All coupling mechanisms of the coil array are included in the matrix S C calculated in the field simulation. A detailed theory for the noise modeling of the pre-amplifiers will be shown in Section 2.2.
Further, S R C and S C are combined with the matrix of the total network S T , which will be used to calculate the dissipated power P of the network:
P ( r ) = 1 2 A R C T ( r ) · E S T T · S T · A R C ( r ) = 1 2 A R C T ( r ) · K P · A R C ( r ) ,
with the constant matrix K P that is a measure of the noise power of the network and E denoting the n × n unit matrix. The input wave vector A R C must be optimized to obtain the maximum SNR values at every point of interest r in the investigated object.
The vector A R C , o p t for maximum SNR results in an optimum vector A C , o p t that is used to weigh the normalized magnetic field vector B n . Moreover, A C can be expressed by:
A C ( r ) = E S R C , 22 · S C 1 · S R C , 21 X · A R C ( r )
with
S R C , 21 = s R C , ( n + 1 ) 1 s R C , ( n + m ) 1 s R C , ( n + m ) 1 s R C , ( n + m ) n , S R C , 22 = s R C , ( n + 1 ) ( n + 1 ) s R C , ( n + 1 ) ( n + m ) s R C , ( n + m ) ( n + 1 ) s R C , ( n + m ) ( n + m )
and the substitutional matrix X . The magnetic field B 1 , c ( r ) in Equation (1) can then be written as:
B 1 , c ( r ) = B n T ( r ) · X · A R C ( r ) .
Using Equations (3) and (5), the SNR of Equation (1) is given by:
SNR ( r ) = K c a l · B n T ( r ) · X · A R C ( r ) 1 2 A R C T ( r ) · K P · A R C ( r ) .
For the calculation of the optimum SNR, Equation (6) is modified to determine the maximum value using the Cauchy–Schwarz inequality:
SNR ( r ) = K c a l · B n T ( r ) · X · K P 1 · K P · A R C ( r ) 1 2 A R C T ( r ) · K P · K P · A R C ( r ) .
The matrix K P is, due to its definition in Equation (3), a Hermitian matrix. The fact that the model only uses passive networks makes K P also semidefinite. Therefore, a semidefinite root exists, and further, the following statement applies:
K P T = K P and K P T = K P .
By making the following substitutions:
Φ ( r ) = K P · A R C ( r ) ,
and
Ξ ( r ) = B n T ( r ) · X · K P 1 T ,
Equation (7) can be written as:
SNR ( r ) = K c a l · 2 · Ξ T ( r ) · Φ ( r ) Φ T ( r ) · Φ ( r ) = K c a l · 2 · Ξ T ( r ) · Φ ( r ) | | Φ ( r ) | |
where | | Φ ( r ) | | denotes the L 2 norm of the vector:
| | Φ ( r ) | | = i = 1 n | Φ ν | 2 .
As the Cauchy–Schwarz inequality states:
Ξ T ( r ) · Φ ( r ) | | Ξ ( r ) | | · | | Φ ( r ) | |
the maximum SNR at the point of interest is given by:
SNR m a x ( r ) = K c a l · 2 · | | Ξ ( r ) | | · | | Φ ( r ) | | | | Φ ( r ) | | = K c a l · 2 · | | Ξ ( r ) | | .
After re-substitution, the maximum SNR in terms of magnetic field and S-parameter values can be expressed by the following:
SNR m a x ( r ) = K c a l · 2 · Ξ T ( r ) · Ξ ( r ) = K c a l · 2 · B n T ( r ) · X · K P 1 · K P 1 T · X T · B n ( r ) = K c a l · 2 · B n T ( r ) · X · K P 1 · X T · B n ( r ) .
Similar expressions have been found in [1,2,15]. The demonstrated approach allows the use of calculated magnetic fields and S-parameters of an electromagnetic simulation to determine the maximum available SNR of any coil array. How to model the S-parameters of the components in the receiver chain to obtain accurate SNR results will be shown in the following sections.

2.2. Pre-Amplifier Noise Model

Pre-amplifiers used in MRI receive coil arrays decrease the maximum achievable SNR of the array due to additional noise sources. This degradation can be enhanced due to coupling between coil elements. To correctly calculate the SNR, the model must provide a proper description of all noise sources of the pre-amplifiers, and all coupling effects must be considered.

2.2.1. Single-Channel Noise Model

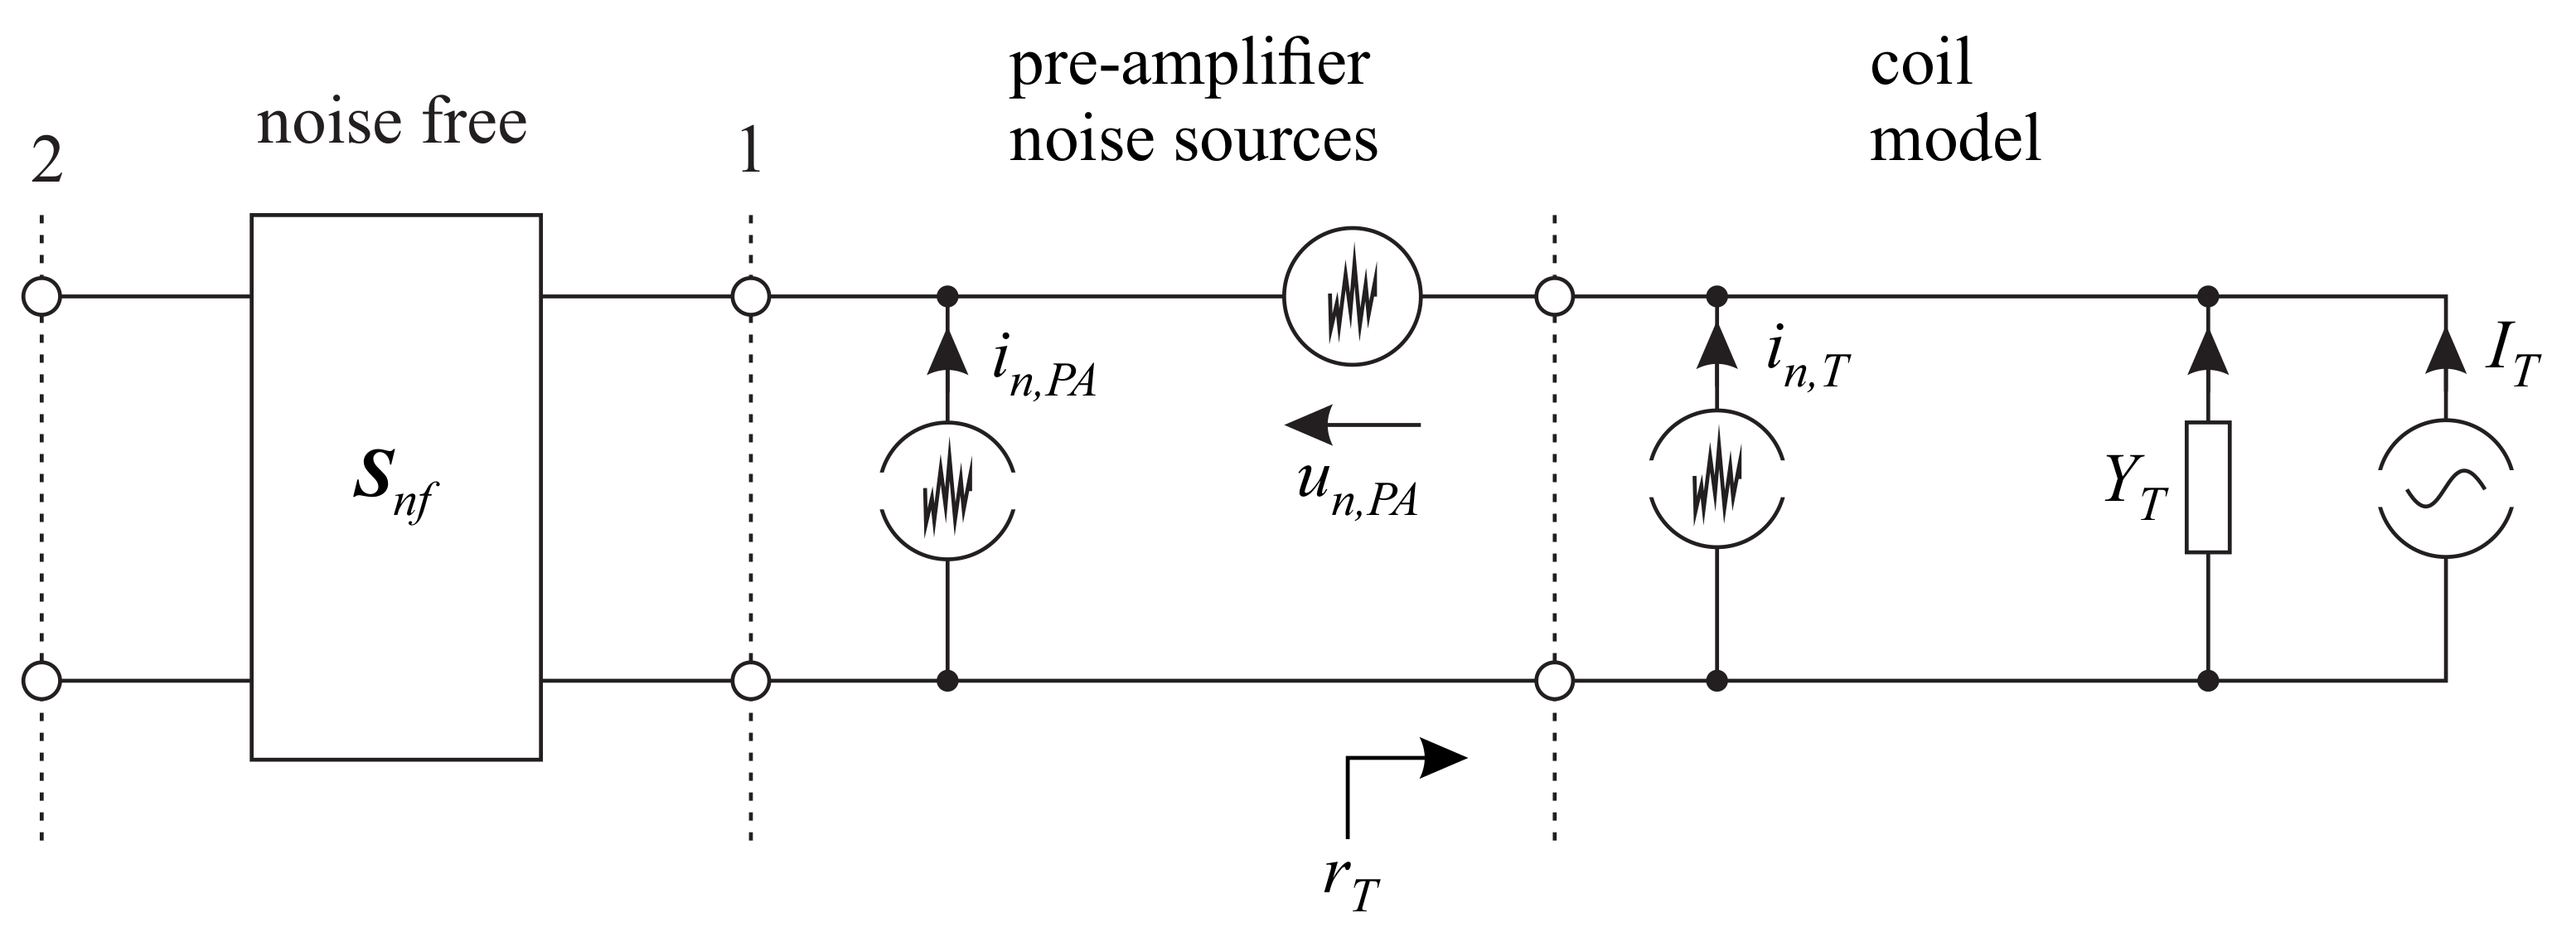
Figure 3 shows a model for the noise sources of a single coil and a pre-amplifier. Every two-port network, such as the pre-amplifier, can be described as a noise-free two-port with a noise current source and a noise voltage source at its input port [16,17,18]. The noise current of the coil can be calculated using the admittance Y T that is transformed into the pre-amplifier reference plane:
i n , T 2 ¯ = 4 k B T Δ f Re ( Y T ) = 4 k B T Δ f G T
with the equivalent noise conductance G T of the coil in the pre-amplifier plane.
The noise figure of a linear two-port is given, for example, in [18] or [19]:
F P A = F P A , m i n + 4 R n Z 0 r T r P A , o p t 2 1 r T 2 1 + r P A , o p t 2
with the transformed reflection coefficient r T of the coil in the pre-amplifier plane, the equivalent noise resistance R n , the optimum reflection coefficient r P A , o p t in the pre-amplifier plane to obtain the minimum noise figure of the pre-amplifier F P A , m i n , and a reference impedance Z 0 . The noise parameters F P A , m i n , R n , Re ( r P A , o p t ) , and Im ( r P A , o p t ) completely describe the noise of the pre-amplifier. They can be determined from the values of the noise sources u n , P A and i n , P A by separating them into correlated and uncorrelated sources as shown in [16].
To use this set of parameters in the SNR calculation, it must be expressed by a set of S-parameters. In [12], this has been done using an attenuator and a global SNR scaling factor. This approach models a pre-amplifier with two uncorrelated noise sources resulting in a real, optimum source impedance. The model has been extended here to be valid for any optimum source impedance, which means the noise sources of the pre-amplifier model can be partially correlated. The only restriction for the usage on a coil array is that every channel must be connected to pre-amplifiers with equivalent noise parameters, which is usually the case.
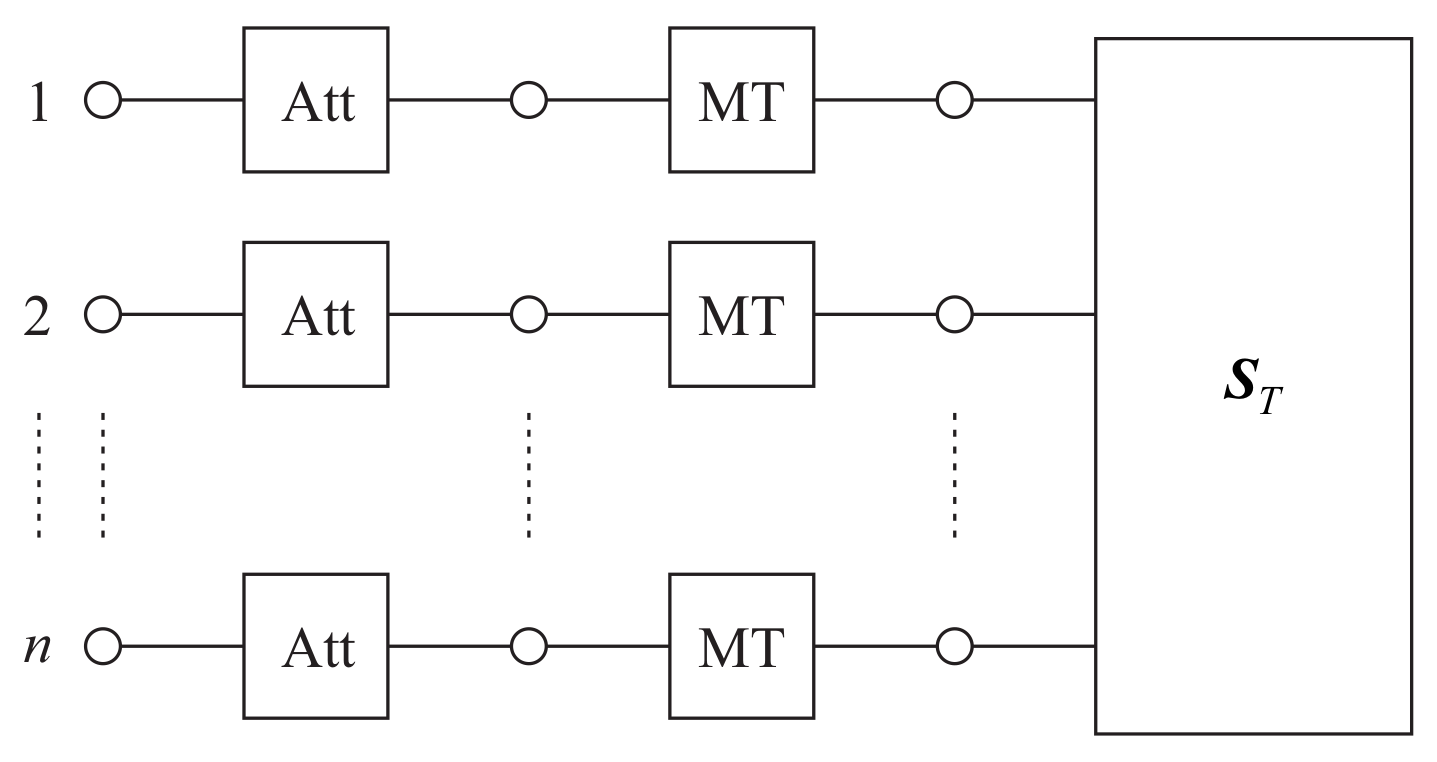
The two-port network of the pre-amplifier is modeled as a chain circuit of a matching transformer and an attenuator with corresponding S-matrices of:
S M T = s M T , 11 s M T , 21 s M T , 21 s M T , 22 , S A t t = 0 s A t t , 21 s A t t , 21 0 .
As the networks are reciprocal s M T , 12 = s M T , 21 and s A t t , 12 = s A t t , 21 . For lossless matching transformers, further restrictions can be placed:
| s M T , 11 | = | s M T , 22 | , | s M T , 11 | = 1 | s M T , 21 | 2 , φ M T , 11 φ M T , 12 = φ M T , 21 φ M T , 22 + ( 2 n + 1 ) π .
The phase values φ of the transmission coefficients do not affect the noise figure of the total network. Therefore, they can be set to zero, which leads to s M T , 22 = s M T , 11 . The chain connection of S M T and S A t t then results in the S-parameters for the pre-amplifier model:
S P A = s P A , 11 s P A , 21 s P A , 21 s P A , 22 = s M T , 11 s A t t , 21 1 | s M T , 11 | 2 s A t t , 21 1 | s M T , 11 | 2 s M T , 11 | s A t t , 21 | 2 .
The noise figure F 2 P of a passive two-port network at reference temperature T 0 equals its inverted available gain 1 / G A , which is given by:
F 2 P = 1 G A = 1 s 11 r T 2 s 22 1 s 11 r T + s 12 s 21 r T 2 s 21 2 1 r T 2 .
If the S-parameters are replaced by the values of Equation (19), the noise figure can be written as:
F 2 P = 1 s M T , 11 r T 2 s A t t , 21 4 r T s M T , 11 2 s A t t , 21 2 1 s M T , 11 2 1 r T 2 .
This equation can be rearranged to obtain a form that describes the noise circles of constant noise figure values F 2 P , c in the reflection coefficient plane for the reflection coefficients r T = r T , c , similar to the approach in [16] or [18] for determining the minimum noise figure:
r T , c 2 F 2 P , c s A t t , 21 2 s M T , 11 2 1 s M T , 11 2 + s A t t , 21 4 κ 1 + r T , c s M T , 11 1 s A t t , 21 4 κ 2 + r T , c s M T , 11 1 s A t t , 21 4 κ 2 + F 2 P , c s A t t , 21 2 1 s M T , 11 2 + s M T , 11 2 s A t t , 21 4 1 κ 3 = 0 .
Equation (22) describes circles with the center point:
r M , c = κ 2 κ 1 ,
and the radius:
R M , c = κ 2 κ 2 κ 1 κ 3 κ 1 2 ,
for constant noise figure values F 2 P , c . For determination of the minimum noise figure of the two-port network, radius (24) is set to zero. This leads to:
F 2 P , m i n = 1 s A t t , 21 2
and Equation (23) for the center point gives the optimum reflection coefficient:
r 2 P , o p t = s M T , 11 .
With F 2 P , m i n and r 2 P , o p t , the noise figure of the model in Equation (21) can then be written as:
F 2 P = F 2 P , m i n + F 2 P , m i n 1 F 2 P , m i n r T r 2 P , o p t 2 1 r T 2 1 r 2 P , o p t 2 .
With this expression, the noise figure of the two-port network is completely determined. As Equation (21) only has three degrees of freedom ( Re ( s M T , 11 ) , Im ( s M T , 11 ) , and s A t t , 21 ), only three parameters can be chosen to define the noise paraboloid of the network. The gradient of the noise paraboloid, which means the increase of the noise figure at deviations of r T from r 2 P , o p t , is already determined by F 2 P , m i n and r 2 P , o p t . It is possible to choose a minimum noise figure F 2 P , m i n that leads to the same slope as that of the pre-amplifier noise paraboloid. Both noise paraboloids merely differ by a constant scaling factor F o f f . Assuming Equation (27) multiplied by F o f f equals Equation (16), F o f f and F 2 P , m i n can be calculated as follows:
F 2 P · F o f f = F 2 P , m i n · F o f f + F o f f F 2 P , m i n 1 F 2 P , m i n r T r 2 P , o p t 2 1 r T 2 1 r 2 P , o p t 2 = ! F P A , m i n + 4 R n Z 0 r T r P A , o p t 2 1 r T 2 1 + r P A , o p t 2 .
With r 2 P , o p t = r P A , o p t = r o p t , it follows that:
F 2 P , m i n = F P A , m i n F o f f
with
F o f f = F P A , m i n F P A , m i n 4 R n Z 0 1 r o p t 2 1 + r o p t 2 .
Knowing the four noise parameters of a pre-amplifier, the three S-parameters of a passive two-port network in Equation (19) for modeling its noise figure according to Equation (21) can be determined. The real and imaginary parts of s M T , 11 are defined by r o p t , and s A t t , 21 is given by F 2 P , m i n = F P A , m i n / F o f f and Equation (25). The factor F o f f in Equation (30) cannot be captured by the passive network. The resulting SNR can be multiplied by F o f f :
SNR m a x ( r ) = SNR m a x ( r , F 2 P ) F o f f ,
where SNR m a x ( r , F 2 P ) has been calculated using F 2 P .

2.2.2. Multiple-Channel Noise Model

The noise model of the pre-amplifiers in an n-channel coil array is shown in Figure 4.
Equation (31) relies on the restriction that all pre-amplifiers of a multiple-channel array have the same noise parameters, which is usually the case in a good approximation.
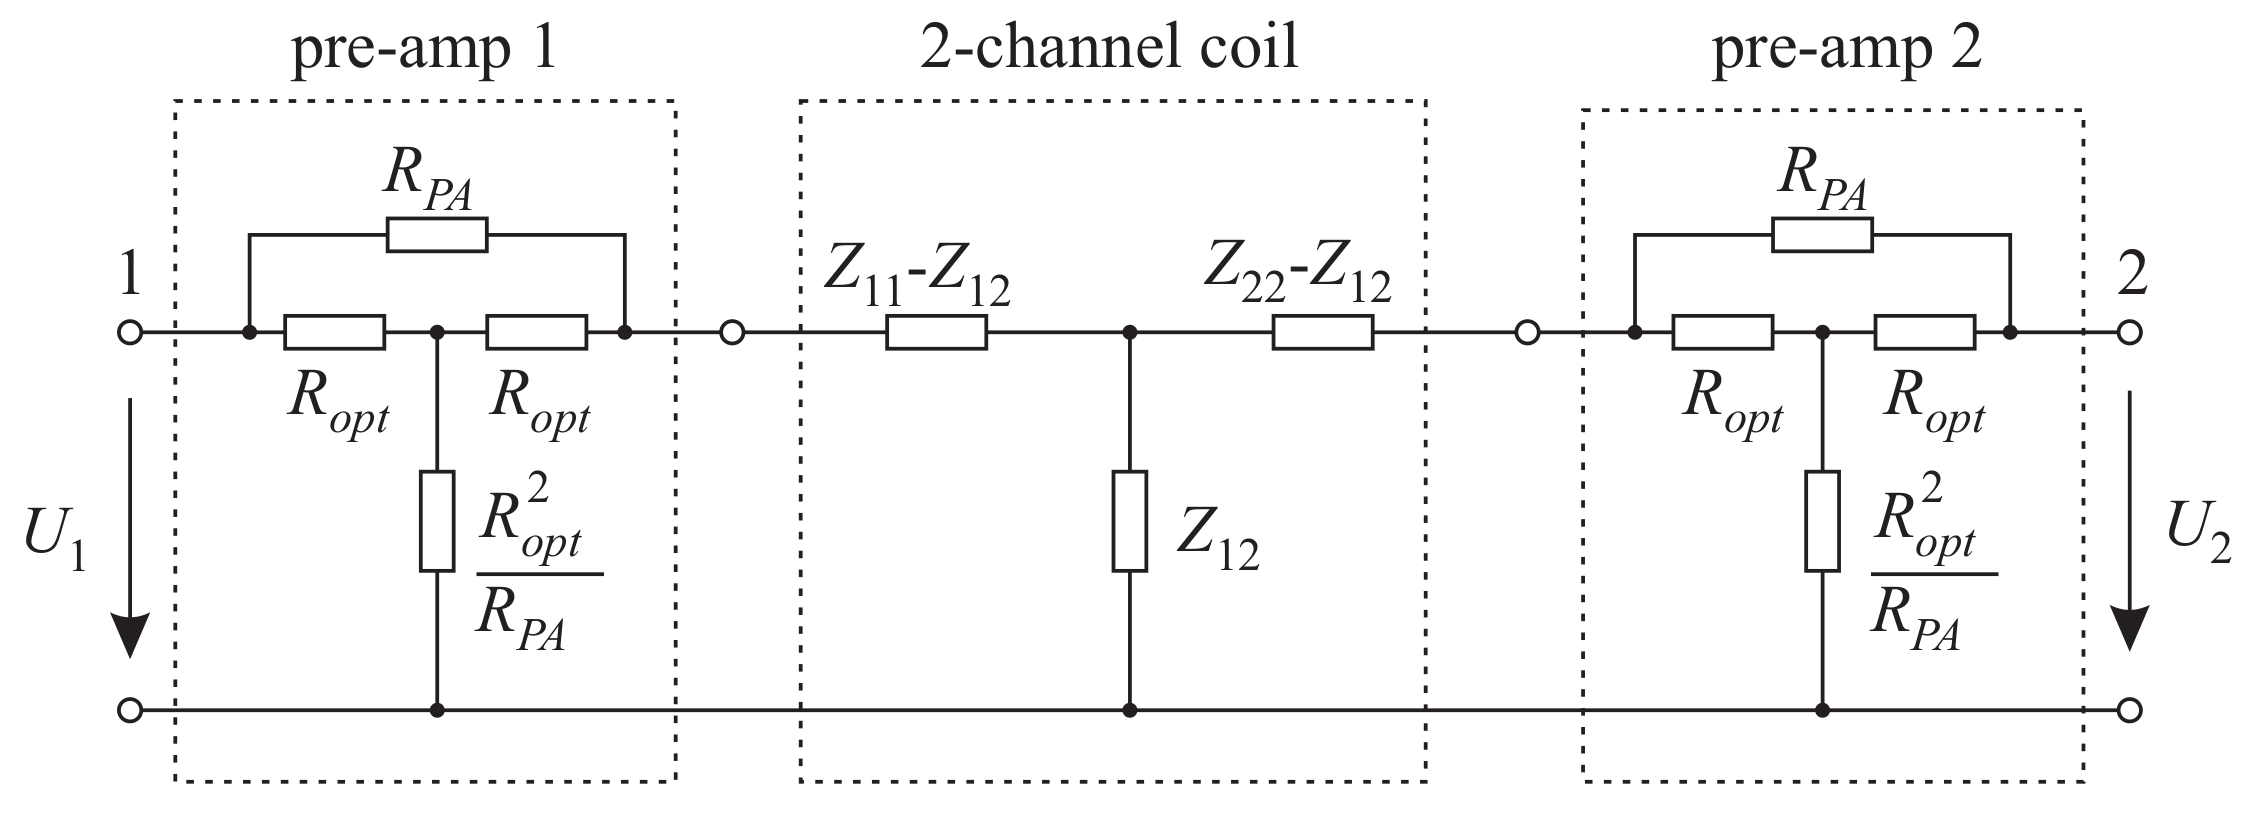
For simplicity, the noise coupling mechanism of the introduced pre-amplifier model will be illustrated considering the electric circuit of a two-channel network in Figure 5. The theory can also be applied to multiple-channel arrays.
The pre-amplifiers at ports 1 and 2 are modeled by attenuators with R P A = R o p t ( F 2 P , m i n 1 ) . The two-element array is described by its impedance parameters: Z 11 , Z 22 , and Z 12 = Z 21 . For the sake of simplicity and without any limitation of generality, the optimum impedance of the pre-amplifiers is chosen to have no imaginary part ( Z o p t = R o p t ), and both coils have the same input impedance parameter ( Z 11 = Z 22 ). The SNR in every voxel can be calculated by the superposition of the fields of two orthogonal modes. In [13], the noise coupling mechanisms have been described, making use of this superposition of an even and odd mode. For the even mode, the voltages U 1 and U 2 in Figure 5 are equal in amplitude and sign, which means ports 1 and 2 can be connected. The two pre-amplifiers are in parallel for this case and can be substituted by a single pre-amplifier with Z o p t , e v e n = Z o p t / 2 . The impedance of the resulting network that is applied to the input of the amplifier is given by Z e v e n = ( Z 11 + Z 12 ) / 2 . When the decoupled coil 1 (impedance Z 11 ) is noise matched to Z o p t , the grade of mismatch due to coupling normalized to the even-mode input impedance Z 11 / 2 of the coil is described by the term Z 12 / Z 11 .
For the odd mode, U 1 and U 2 are equal in amplitude but opposite in sign. The two pre-amplifiers can be considered to be in series for this mode, and the optimum impedance for an equivalent single pre-amplifier is given by Z o p t , o d d = 2 Z o p t , as shown in [13]. The resulting impedance of the network is calculated by Z o d d = 2 ( Z 11 Z 12 ) . Therefore, the degree of mismatch caused by coupling normalized to the odd-mode input impedance 2 Z 11 of the coil is expressed by the term Z 12 / Z 11 , which results in the same noise figure increase as for the even mode.
Thus, for the excitation of the network with the even and odd mode, the coupling results in a mismatch of the network’s impedance with respect to the pre-amplifier’s optimum input impedance, which can be regarded as additional noise introduced by the pre-amplifiers.
In [13,20], it is stated that the effective noise figure F of a pre-amplifier depends on the product k Q of the coupling factor k between two coil elements and the quality factor Q of the coils. It further depends on the impedance of the coil that is present at the input of the pre-amplifier. The dependency of the SNR and the effective noise figure is given by SNR 1 / 1 + F . For noise-matched coils the effective noise figure results in F = F ( 1 + ( k Q ) 2 / 2 ) [20]. Thus, reducing Q while k remains constant, which could be the case for increasing the load of the coil, the effective noise figure is reduced and the degradation of the SNR due to pre-amplifier noise is decreased. To mitigate the degradation of the SNR due to noise coupling, a broadband matching technique is proposed in [13,20]. These effects are covered by the proposed pre-amplifier model, as the dependency of the noise figure on the coil impedance at the input of the pre-amplifier and the matching network are included in the model.

3. Methods

3.1. Modeling and Measurement of Receive Coil Arrays

The losses of the coil structure and lumped components can be determined by a quality factor measurement. The corresponding resistance value of a coil R C will be modeled as a series resistor in a simple two-port network. In addition, matching networks, phase shifters for pre-amplifier decoupling, and cable losses are also modeled by two-port networks. The S-parameters of these networks can be easily calculated with circuit simulators. All two-port networks of the receiver chain, including the pre-amplifier model, are concatenated to build the receiver chain network with a scattering matrix S R C (Figure 1). To validate the model, two different coil arrays have been assembled, measured with respect to their SNR, and compared to the calculated SNR values.

3.1.1. Coil Array With Two and Four Elements

In [21], a two-channel coil array has been investigated, which consists of two coaxially ring coils proposing an equation for the SNR based on the received signal voltage and the optimum noise parameters of the pre-amplifiers. In [12], the distance between the two coil elements has been made variable to get an insight into the degree of SNR degradation due to noise coupling. The measurement of this work clearly showed the effect of SNR degradation due to pre-amplifier noise when increasing the coupling between the coils beyond a certain point.
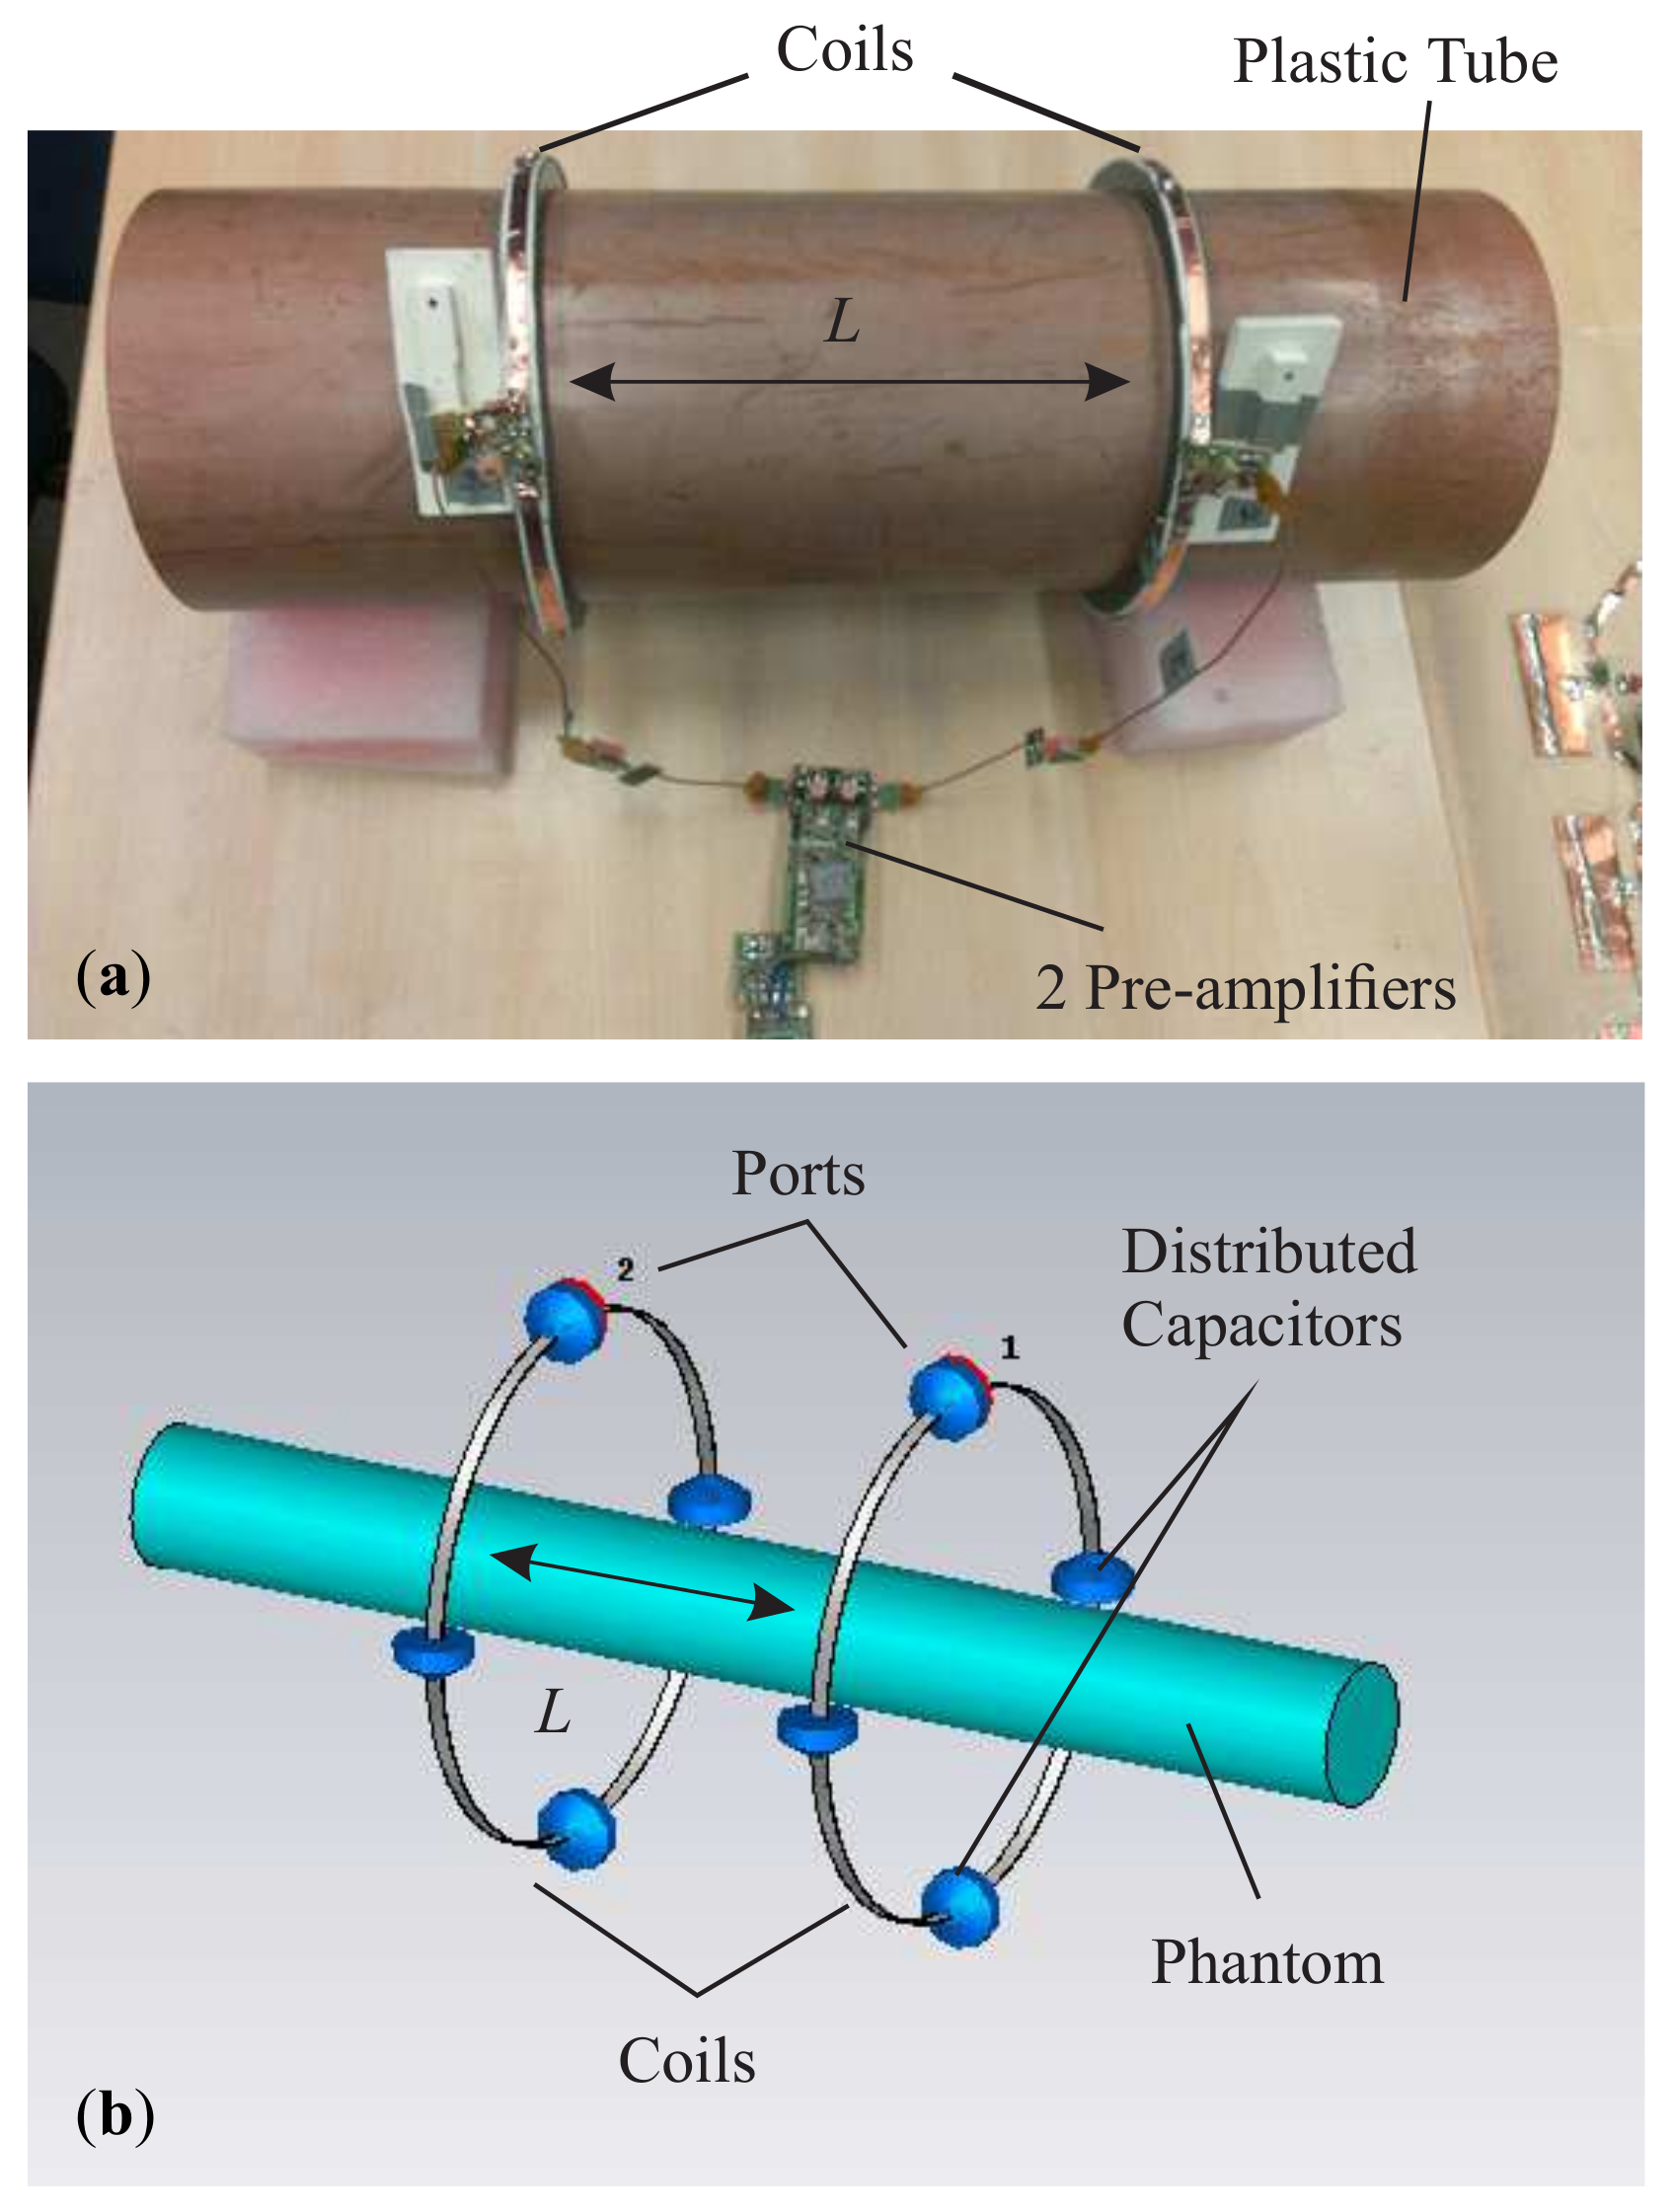
Here the same coil setup is used with a smaller phantom that is filled with a saline water solution of 3.75 g NiSO4·6H2O and 5 g NaCl per liter water, which results in an electrical conductivity of σ = 0.97   S   m 1 at room temperature and a relative electrical permittivity of ε r = 80.3 . A calculation of the dielectric constant of saline water can be found in [22]. The coil setup is shown in Figure 6. The small volume of the phantom and the distance to the coils makes the array only lightly loaded, which even further enhances the coupling effects. This should give insight into the dependency of the coupled noise of the pre-amplifiers on the SNR and shows the degree of accuracy with which the proposed model captures this effect. An example of a practical application of a lightly loaded receive coil array is the “Remote Body Array”, which has been described in [23,24]. Moreover, with decreasing field strength B 0 (e.g., at 1.5   T compared to 3   T ), the noise contribution of the receive system becomes more dominant over the patient noise contribution.
Furthermore, a four-channel planar coil array is investigated to validate the model by a more complex setup of a typical local coil structure (Figure 7). The array is placed 13 cm above a phantom filled with a saline water solution of 1.24 g NiSO4·6H2O and 2.62 g NaCl per liter of water, which results in σ = 0.51   S   m 1 and ε r = 80.3 . This configuration also leads to lightly loaded coil elements. As usual, only the nearest neighbor elements are inductively decoupled by a partial overlap.
Both coil arrays are made of copper strips that are tuned to the magnetic resonance frequency using well-known techniques with distributed capacitors and low loss reactive networks comprising a parallel and a series capacitor for noise-matching at the pre-amplifier inputs. Noise matching is done for each element when all other elements are detuned. The transformation of the coil S-parameters into the pre-amplifier plane by the matching networks is reproduced in the model by an electrical circuit simulation tool. The losses of the coil material and the lumped components are measured by a Q-factor measurement and are used in the post-processing of the SNR calculation.
The noise parameters of the pre-amplifiers have been measured in a shielded environment using the Y-factor method as described in [19]. Twenty equivalent pre-amplifiers were characterized, and the mean value of the noise parameters was used in the model. The measured noise parameters of the pre-amplifiers are included in the model.
The SNR values for the combination of a particular coil array and the phantom, which can be compared in absolute values to the simulated results, are obtained by recording a combined MR image using a gradient echo sequence. The field of view of the two-element coil is 500   mm × 500 mm and for the four-element coil it is 350   mm × 350 mm . The difference is due to different phantom sizes. The cutting plane of the SNR images is located in the transversal orientation at the phantom center with a slice thickness of d S = 5 mm and a resolution of 256 × 256 voxels. The repetition time between transmit pulses is chosen to be T R = 100 ms , and the echo time is T E = 10 ms . For every channel of an array, MR images and additional noise images are recorded. Every voxel value of the single-channel MR image is normalized to the square root of the mean of the noise image. The single-channel SNR images are weighted according to their SNR value voxel by voxel and added together to give a resultant combined image for the array. This method, which maximizes the SNR in each voxel, has been described in [15]. To find the optimum flip angle in each voxel, the so-called Ernst angle [25], the flip angle is varied in a series of MR sequences, and the optimum SNR is extracted for every voxel across the series. The resulting maximized SNR image equals the simulated result in theory.
The SNR value of a voxel depends on various factors, such as the sequence parameters ( T R , T E ), voxel size, or MRI signal weighting (proton density weighting, T 1 -weighting, and T 2 -weighting). All of these factors affect the factor K c a l in Equation (1). To determine this factor, which allows an absolute comparison of modeled and measured SNR values, a calibration technique is used, which is described in [14]. It is ideal to use small phantoms for this measurement to obtain homogeneous SNR values, which leads to more accurate results. Although in principle the method is independent of phantom size, in practice it is best to use small phantoms to avoid errors by averaging over inhomogeneous B 1 profiles. The value B 1 ( r ) / P in Equation (1) can be determined by sending a 180°-pulse of 1 ms with the body coil and measuring the dissipated power in the system. The magnitude of the transmit magnetic field for this pulse can be calculated to be approximately | B 1 |   11.74   μ T . Together with the SNR measured in the calibration phantom the value of K c a l can be determined by K c a l = S N R · P / | B 1 | . This calibration factor is only valid for equivalent phantom liquids and when the sequence parameters of the actual measurement are the same as in the calibration measurement. This provides all factors in Equation (1) that are comprised in K c a l to be constant.

3.1.2. Electromagnetic Field Simulation

The structure of the investigated coil arrays is imported to the electromagnetic field solver. The coil material is chosen to be a perfect electrical conductor, as any losses of the coils and components are added in the post-processing, which leads to more accurate results. The only noise contributions in the field simulator are radiation, phantom losses, and losses in the RF screen, which are modeled as a cylindrical copper bore of the size of the actual screen in the scanner. The electromagnetic field solver can be any commercially available program that is capable of calculating the complex magnetic field of a coil array in the region of interest at MR-frequency, and the S-parameters at the coil ports. In this work the finite element method (FEM, [26]) solver of the software CST MICROWAVE STUDIO® of CST Computer Simulation Technology GmbH, Darmstadt, Germany, has been used.

4. Results

The measurement results of the noise parameters of 20 low-noise pre-amplifiers are given in Table 1. The mean values are used to calculate F o f f = 0.19 dB according to Equation (30) and F 2 P , m i n = 0.66 dB according to Equation (29). With Equations (25) and (26), the S-parameters of the pre-amplifier two-port model result in s A t t , 12 = s A t t , 21 = 0.93 and s M T , 11 = s M T , 22 = 0.1 + 0.36 i . The remaining S-parameters of the matching transformer can be determined by Equation (18): s M T , 12 = s M T , 21 = 0.93 . Therefore, the S-matrix of the pre-amplifier model in Equation (19) is completely determined. All calculated SNR values based on this model must then be weighted by F o f f .
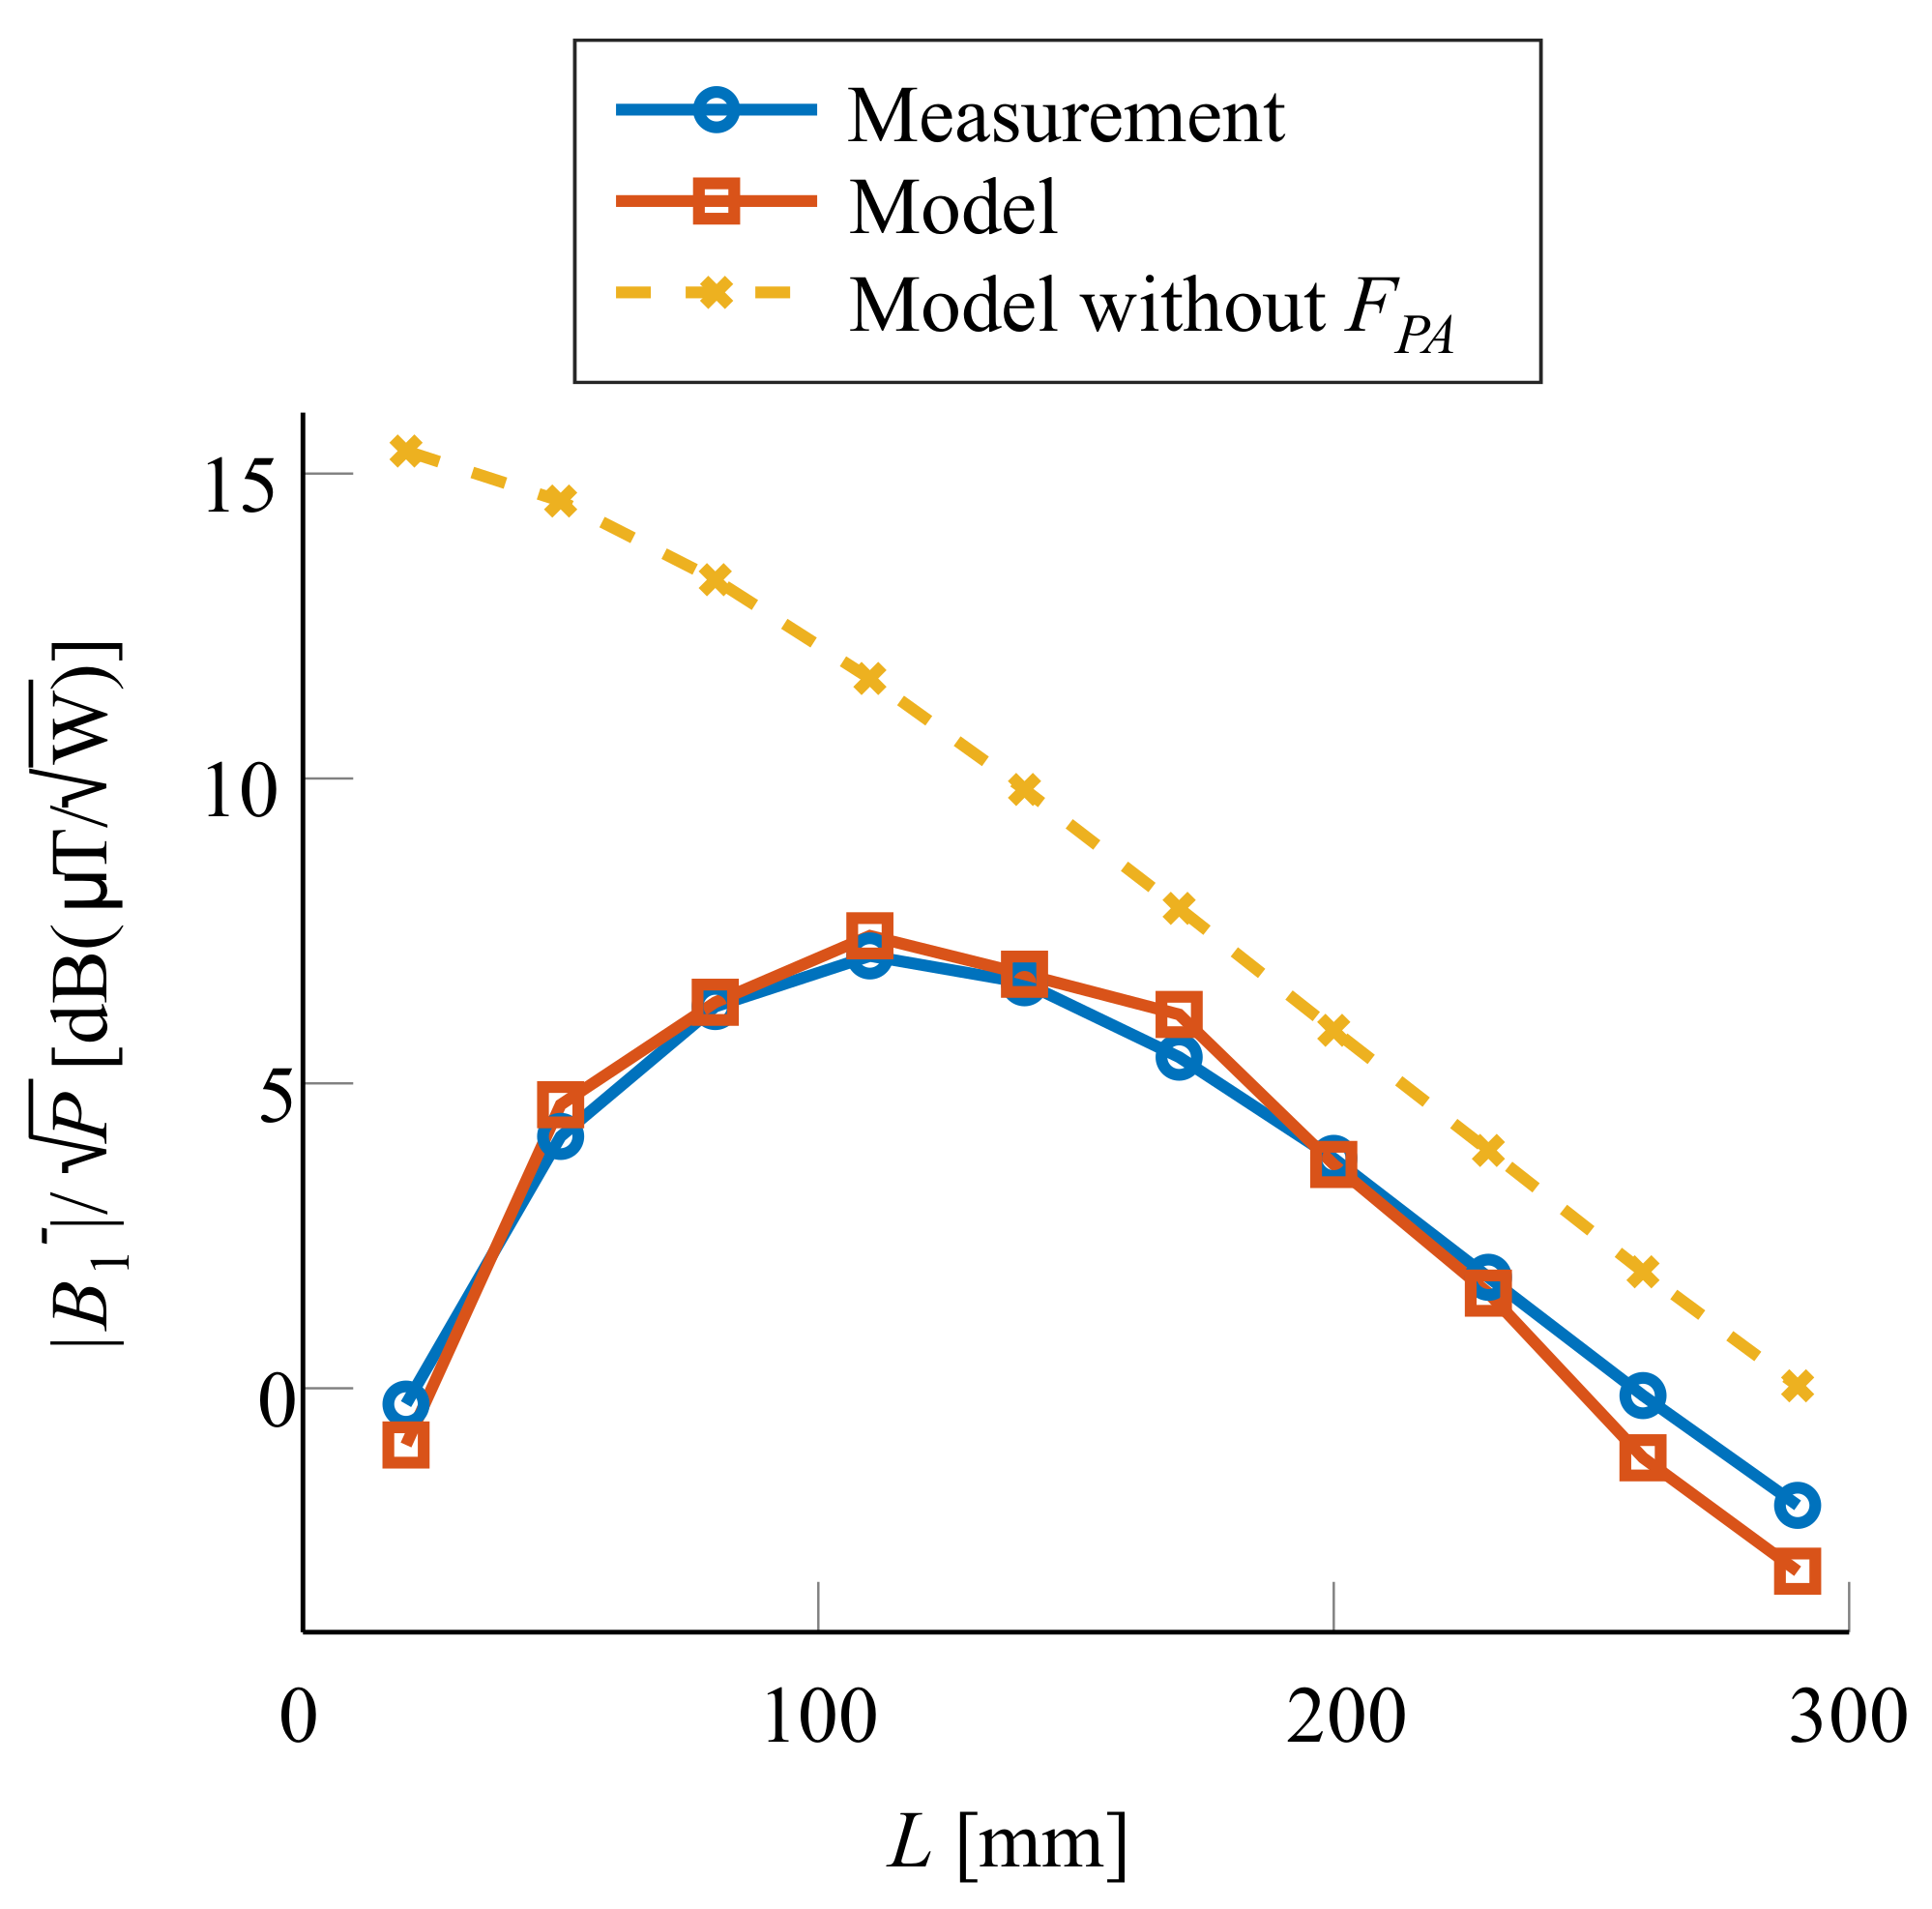
The SNR results of the two-channel coil array are shown in Figure 8. The measurement results gathered in a 3   T system are compared to the calculated SNR values of the model based on the pre-amplifier noise parameters of Table 1. The SNR values at the phantom center show an increase for decreasing the distance L between the coils down to L = 110 mm as the two elements approach the point of interest in the center (Figure 8). However for further decreasing distances, the noise coupling of the pre-amplifiers becomes the dominating factor, which results in a drop in SNR below L = 110 mm . The results for the model without pre-amplifier noise, which can be obtained by setting F 2 P , m i n = F o f f = 0 dB , do not show this tendency, as a continuous increase of the SNR toward lower distances L can be observed. This clearly points out the strong effect of pre-amplifier noise coupling.
The reflection coefficient of a single coil element of the four-channel coil array has been matched to approximately 50   Ω when the remaining elements are detuned. The matching network of a parallel and series capacitor has been modeled in a circuitry simulator to obtain the same reflection coefficients for the model in the pre-amplifier plane. The transmission values between the single elements are given in Table 2 at f = 123.2 MHz for the measurement and model.
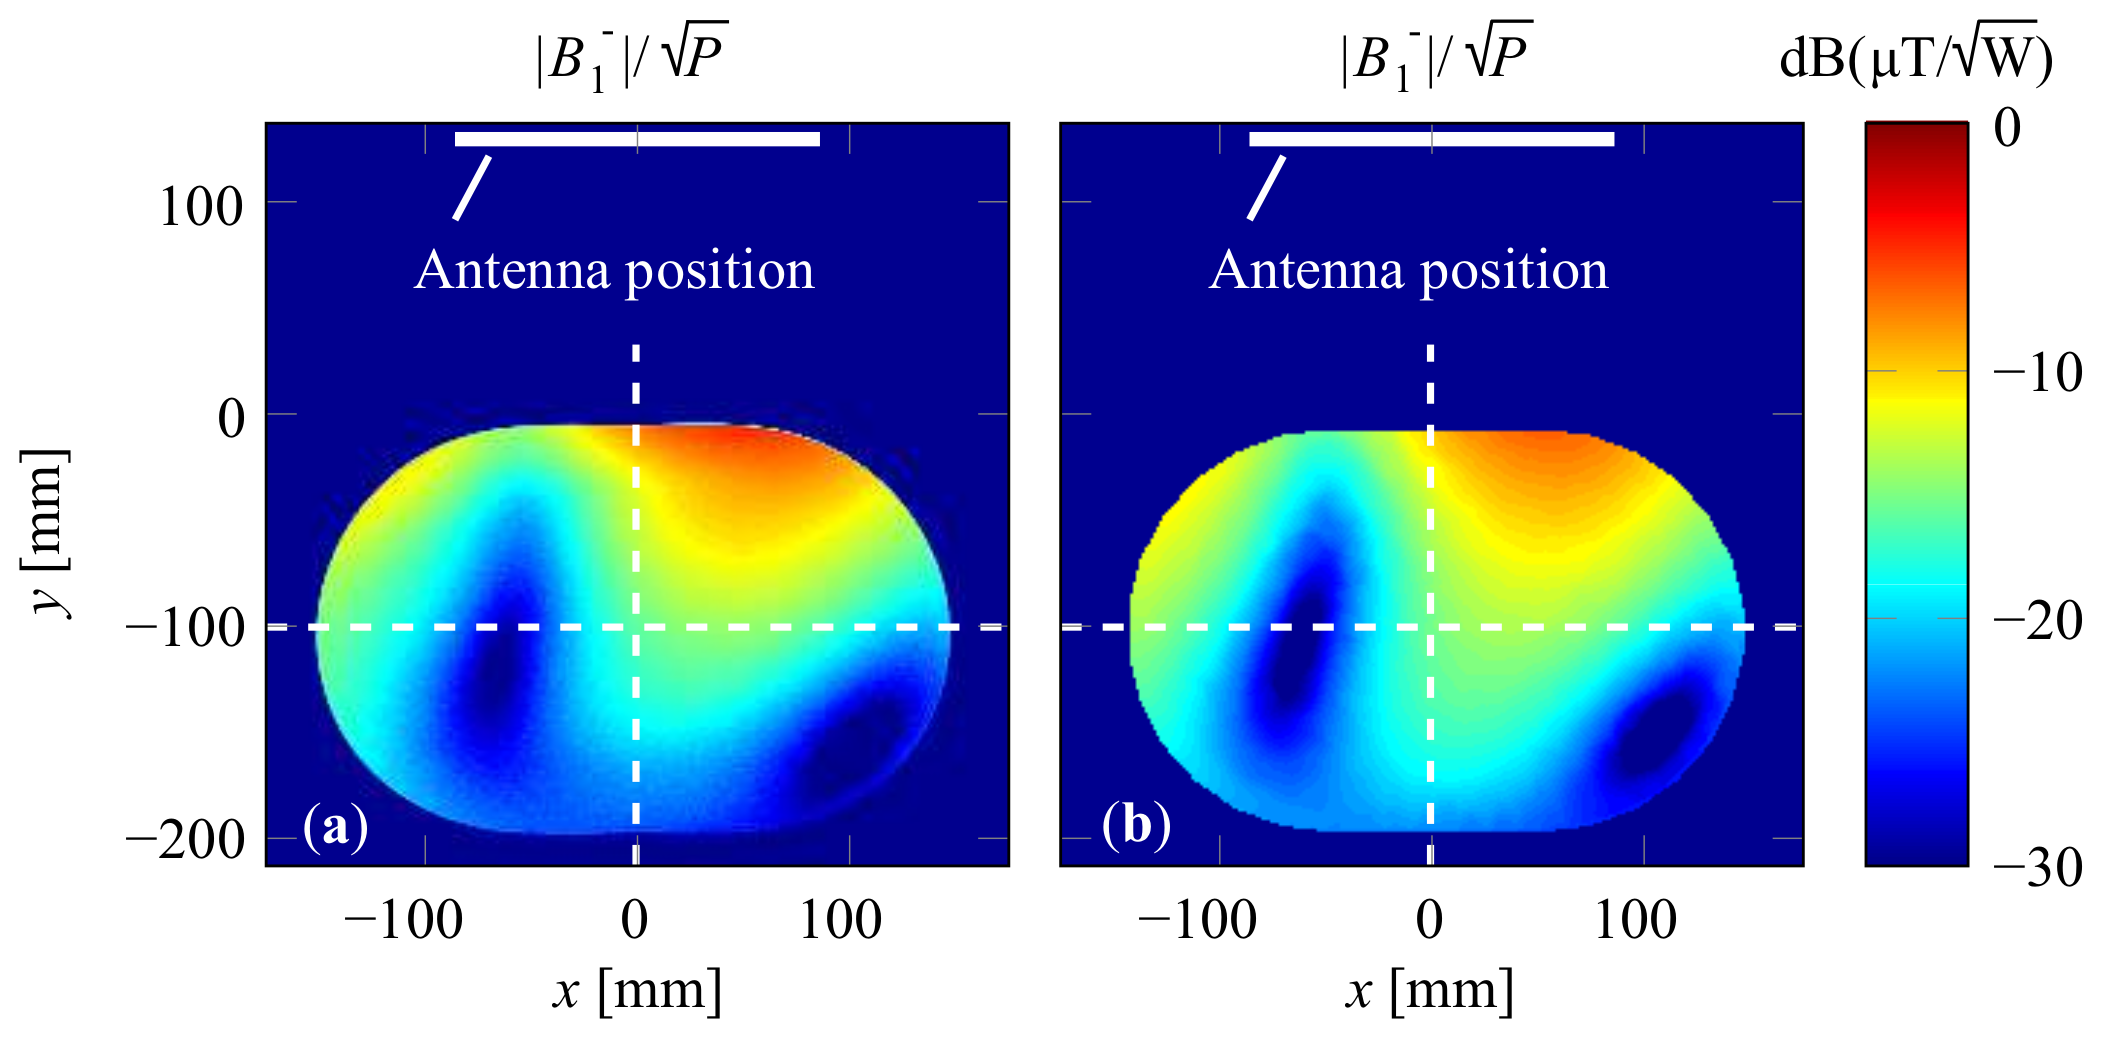
The resulting SNR values based on this model compared to the measurement values can be seen in Figure 9 in a transversal plane. The SNR is normalized to the factor K c a l for absolute comparison.
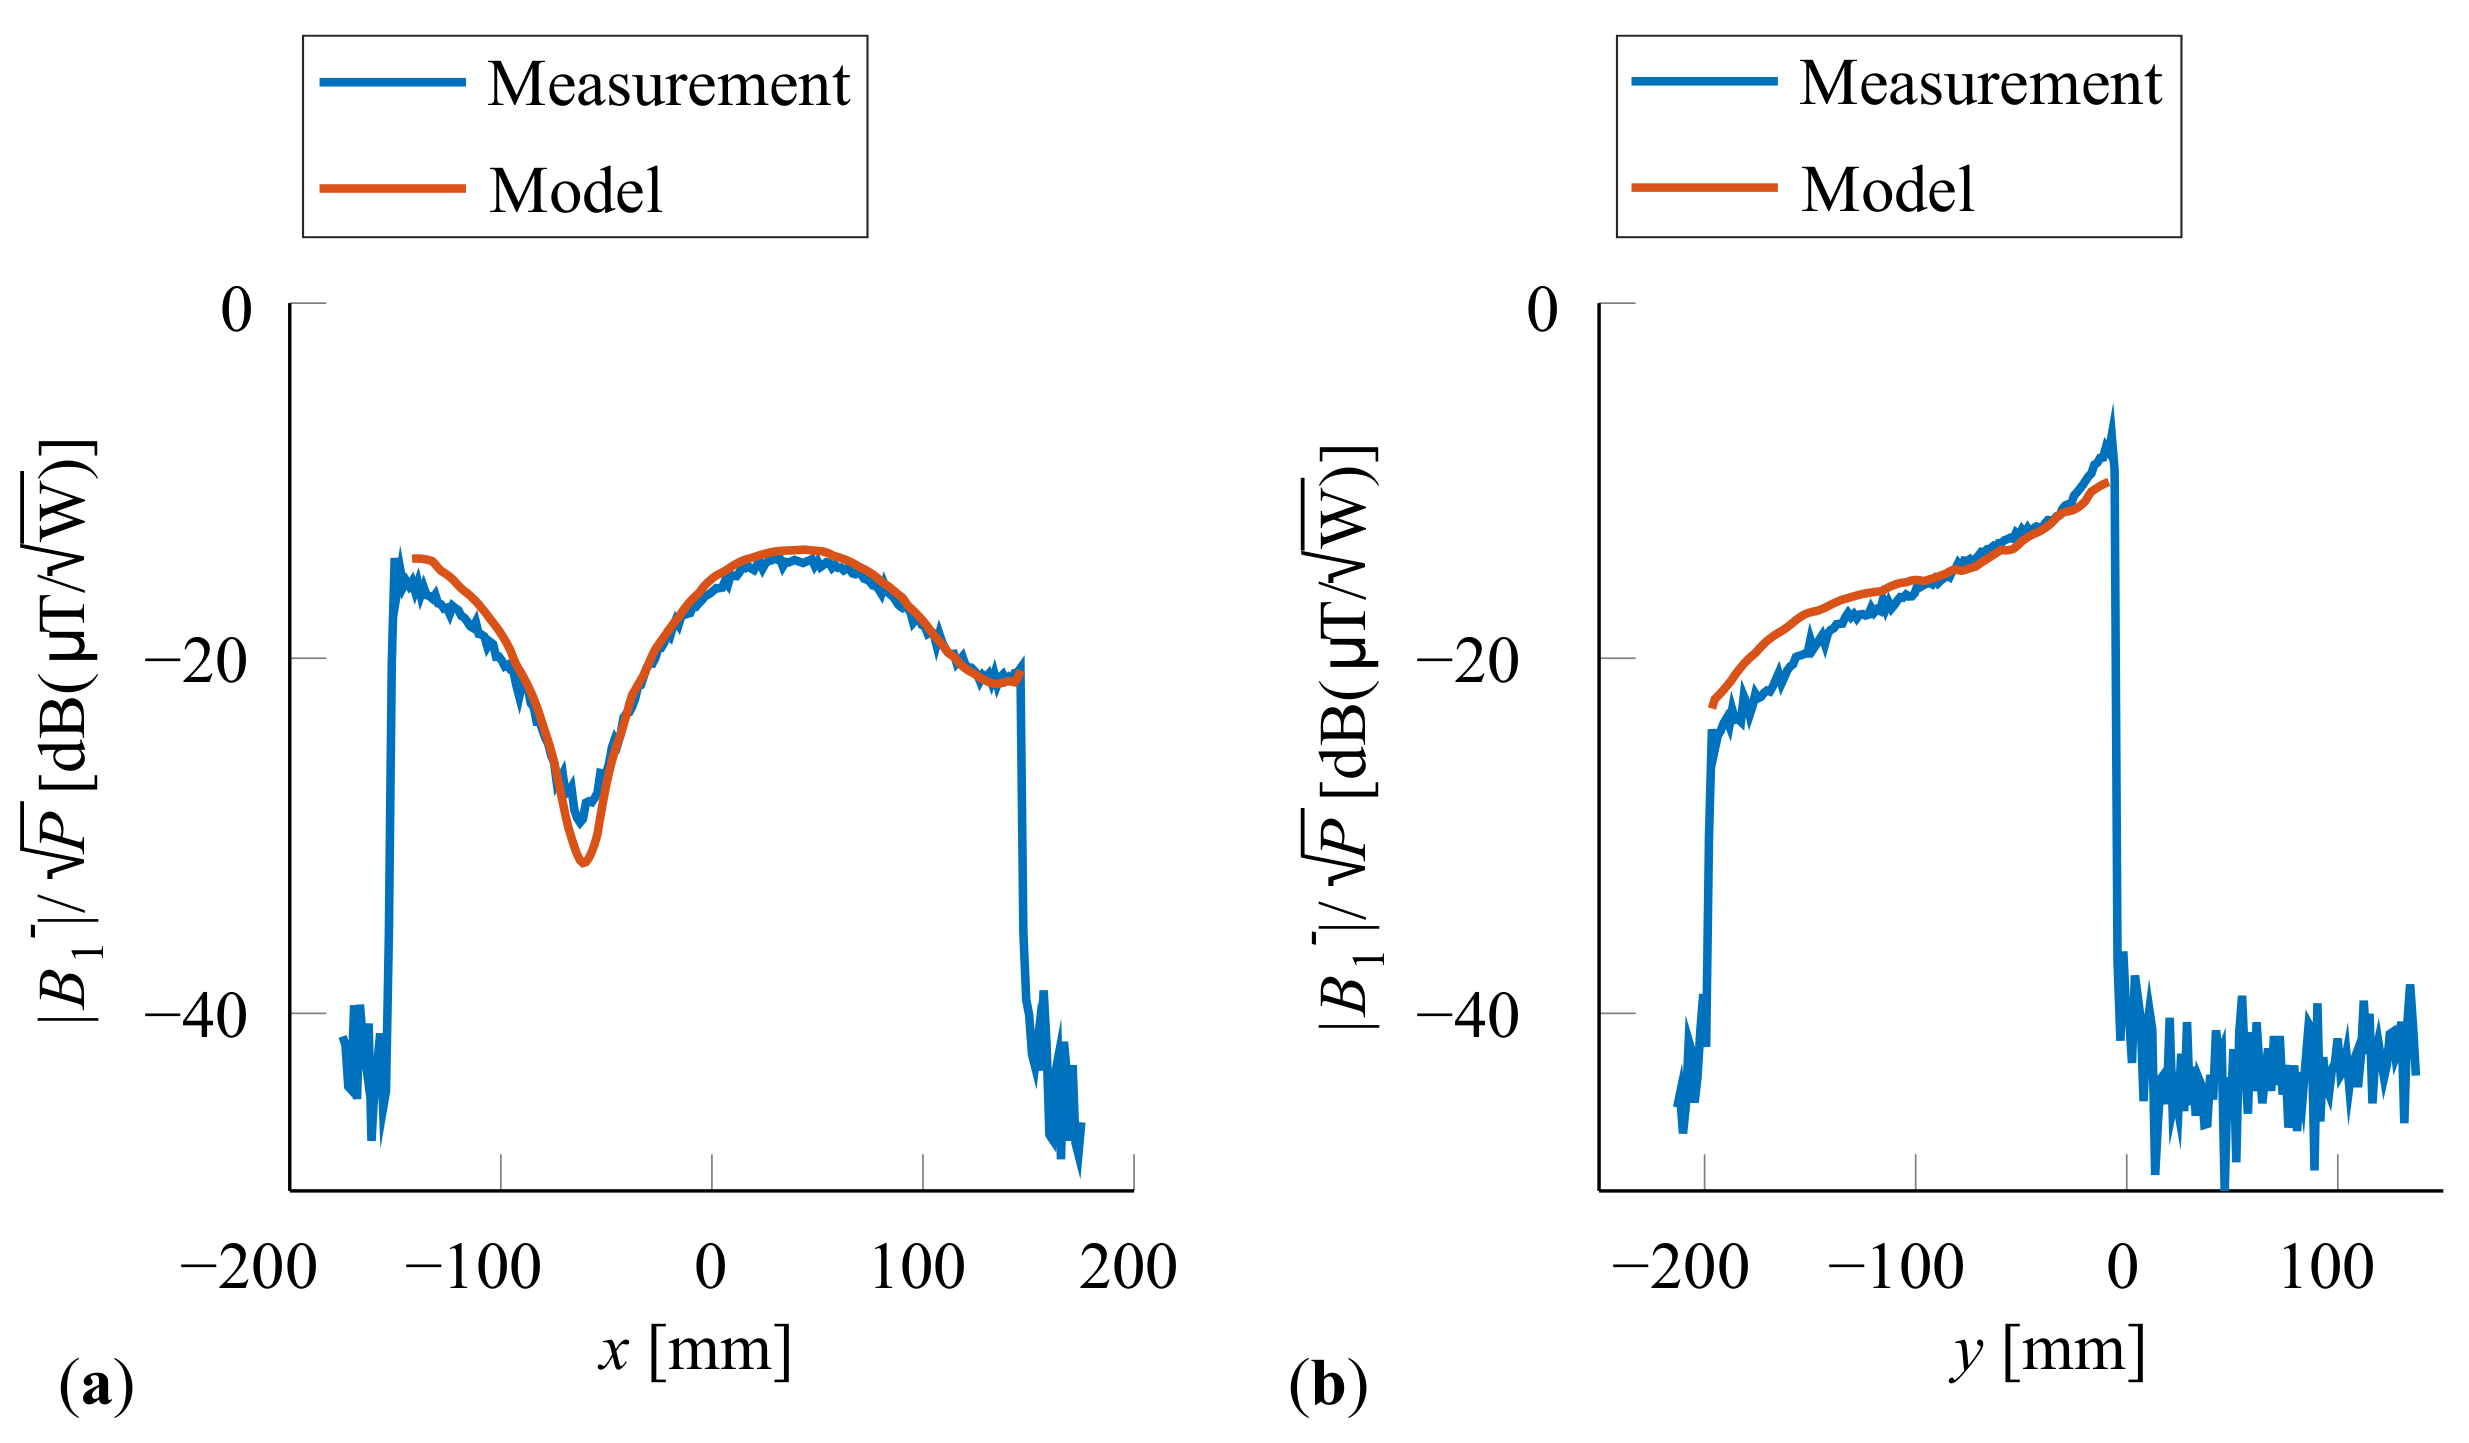
The SNR shows an asymmetrical pattern, which is due to eddy currents in the phantom and the occurrence of a dielectric resonance that results in a standing wave. Figure 10 shows one-dimensional (1D) cuts through the phantom at y 0 = 100 mm and x 0 = 0 mm to gain insight into the accuracy of the model.

5. Discussion

The tendency that the SNR of the two-channel coil array decreases for coil distances below L = 110 mm is very well captured by the model. The SNR values of the model are in good agreement with the measured values, showing a maximum deviation of 1.1 dB at a coil distance of l = 290 mm . This deviation can be due to measurement inaccuracies. In addition, the boundary conditions of the electromagnetic field simulation do not cover all details of the entire scanner system. For example, due to their complexity, the detuned body coil, the gradient coils, and the patient table with cables and balancing chokes are not modeled in the field simulator. However, the resulting accuracy of the SNR model shows that the noise coupling of the pre-amplifiers and the degradation of the SNR are reproduced well. The case of a model without pre-amplifier noise contributions gives an insight into the degree of SNR degradation due to pre-amplifier noise coupling. For L = 20 mm , which represents strongly coupled coils, the estimated SNR ratio between physical and noise free pre-amplifiers is about 16 dB . This shows that reducing the noise figure of pre-amplifiers and optimizing the decoupling of coil elements can have a major impact on the resulting SNR for lightly loaded coil arrays. As the coil load increases the effect will be weakened as the noise of the sample will become the dominating factor regarding the SNR.
The SNR results of measurement and model of the four-element array (Figure 9 and Figure 10) can also be considered to be in good agreement.
The maximum deviation between measured and modeled values is observed in regions where the MR-signal is low in amplitude. This can be explained by a standing wave that builds up in the investigated phantom. As the water-based phantom has a large volume and high permittivity ( ε r 80 ), the electrical dimensions are close to λ / 2 which makes the phantom a dielectric resonator inside the boundaries of the MR scanner. Slightly varying conditions in the circumference of the coil can lead to large relative deviations, especially where cancellation due to standing waves occurs. Therefore, areas with low signal strength are most sensitive to inaccuracies in the 3D model of the electromagnetic field solver. However, the predicted SNR values show good agreement in the major part of the phantom.
The results of the two-channel and four-channel coil arrays show that the proposed approach for modeling the SNR can be used to predict absolute SNR values with good accuracy, even for lightly loaded elements. The passive pre-amplifier model allows the modeling of the entire network by S-parameters, considering all coupling effects.

6. Conclusions

A new model has been described that allows the calculation of the maximum available SNR of an arbitrary arranged receive coil array used for MRI, including the effect of the coupled pre-amplifier noise. The accurate prediction of absolute SNR values can help optimize coil structures and electronics before assembly. As the model obtains the SNR, making use of magnetic field values and S-parameters, it can be easily used in a post-processing step based on the results of an electromagnetic field solver.

Author Contributions

Christopher Stumpf and Matthias Malzacher conceived, designed and performed the experiments. Christopher Stumpf, Matthias Malzacher, and Lorenz-Peter Schmidt analyzed the data. Christopher Stumpf wrote the paper.

Acknowledgments

This work was supported by Siemens Healthineers (Erlangen, Germany) within the scope of a Medical Valley EMN project (Grant Number: 01EX1012C). We would like to thank our colleagues, especially Markus Vester, Robert Rehner, and Sebastian Martius, who helped with their expertise and had a great impact on the results in many productive technical discussions.

Conflicts of Interest

The authors declare no conflict of interest.

References

  1. Schnell, W.; Renz, W.; Vester, M.; Ermert, H. Ultimate signal-to-noise-ratio of surface and body antennas for magnetic resonance imaging. IEEE Trans. Antennas Propag. 2000, 48, 418–428. [Google Scholar] [CrossRef]
  2. Reykowski, A. Theory and Design of Synthesis Array Coils for Magnetic Resonance Imaging. Ph.D. Thesis, Texas A&M University, College Station, TX, USA, 1996. [Google Scholar]
  3. Collins, C.M.; Smith, M.B. Calculations of B1 distribution, SNR, and SAR for a surface coil adjacent to an anatomically-accurate human body model. Magn. Reson. Med. 2001, 45, 692–699. [Google Scholar] [CrossRef] [PubMed]
  4. Collins, C.M.; Wang, Z. Calculation of radiofrequency electromagnetic fields and their effects in MRI of human subjects. Magn. Reson. Med. 2011, 65, 1470–1482. [Google Scholar] [CrossRef] [PubMed]
  5. Kunz, K.; Luebbers, R. The Finite Difference Time Domain Method for Electromagnetics; Taylor & Francis: Abingdon, UK, 1993. [Google Scholar]
  6. Hoult, D.; Richards, R. The signal-to-noise ratio of the nuclear magnetic resonance experiment. J. Magn. Reson. 1976, 24, 71–85. [Google Scholar] [CrossRef]
  7. Giovannetti, G.; Viti, V.; Liu, Y.; Yu, W.; Mittra, R.; Landini, L.; Benassi, A. An accurate simulator for magnetic resonance coil sensitivity estimation. Concepts Magn. Reson. Part B Magn. Reson. Eng. 2008, 33B, 209–215. [Google Scholar] [CrossRef]
  8. Rojas, R.; Rodriguez, A.O. Numerical Study of the SNR and SAR of MRI Coil Arrays. In Proceedings of the 2007 29th Annual International Conference of the IEEE Engineering in Medicine and Biology Society, Lyon, France, 22–26 August 2007; pp. 1196–1199. [Google Scholar]
  9. Chen, Z.; Solbach, K.; Erni, D.; Rennings, A. Improving B1 Efficiency and Signal-to-Noise-Ratio of a Surface Coil by a High-Impedance-Surface RF Shield for 7-T Magnetic Resonance Imaging. IEEE Trans. Microw. Theory Tech. 2017, 65, 988–997. [Google Scholar] [CrossRef]
  10. Paska, J.; Froehlich, J.; Brunner, D.O.; Pruessmann, K.P.; Vahldieck, R. Field Superposition Method for RF coil design. Proc. Int. Soc. Magn. Reson. Med. 2009, 17, 3038. [Google Scholar]
  11. Kozlov, M.; Turner, R. Fast MRI coil analysis based on 3-D electromagnetic and RF circuit co-simulation. J. Magn. Reson. 2009, 200, 147–152. [Google Scholar] [CrossRef] [PubMed]
  12. Malzacher, M.; Vester, M.; Rehner, R.; Stumpf, C.; Korf, P. SNR simulations including coupled preamplifier noise. Proc. Int. Soc. Magn. Reson. Med. 2016, 24, 2157. [Google Scholar]
  13. Vester, M.; Biber, S.; Rehner, R.; Brown, R.; Wiggins, G.; Sodickson, D. Mitigation of Inductive Coupling in Array Coils by Wideband Port Matching. Proc. Int. Soc. Magn. Reson. Med. 2012, 20, 2689. [Google Scholar]
  14. Stumpf, C.; Rehner, R.; Martius, S.; Vester, M.; Engelbrecht, R.; Schmidt, L.P. Calibration of Electromagnetic Field Simulations of MR Coil Arrays for Accurate Quantitative Comparison with the Measured Image SNR. Proc. Int. Soc. Magn. Reson. Med. 2012, 20, 2684. [Google Scholar]
  15. Roemer, P.B.; Edelstein, W.A.; Hayes, C.E.; Souza, S.P.; Mueller, O.M. The NMR phased array. Magn. Reson. Med. 1990, 16, 192–225. [Google Scholar] [CrossRef] [PubMed]
  16. Rothe, H.; Dahlke, W. Theory of noisy fourpoles. Proc. IRE 1956, 44, 811–818. [Google Scholar] [CrossRef]
  17. Bosma, H. On the Theory of Linear Noisy Systems; Philips Research Reports; Philips Research Laboratories: Eindhoven, The Netherlands, 1967. [Google Scholar]
  18. Vendelin, G.; Pavio, A.; Rohde, U. Microwave Circuit Design Using Linear and Nonlinear Techniques; Wiley: Hoboken, NJ, USA, 2005. [Google Scholar]
  19. Pozar, D. Microwave Engineering; Wiley: Hoboken, NJ, USA, 2004. [Google Scholar]
  20. Brown, R.; Lakshmanan, K.; Madelin, G.; Alon, L.; Chang, G.; Sodickson, D.K.; Regatte, R.R.; Wiggins, G.C. A flexible nested sodium and proton coil array with wideband matching for knee cartilage MRI at 3T. Magn. Reson. Med. 2015, 76, 1325–1334. [Google Scholar] [CrossRef] [PubMed]
  21. Findeklee, C.; Duensing, R.; Reykowski, A. Simulating Array SNR And Effective Noise Figure In Dependence Of Noise Coupling. Proc. Int. Soc. Magn. Reson. Med. 2011, 19, 1883. [Google Scholar]
  22. Stogryn, A. Equations for Calculating the Dielectric Constant of Saline Water (Correspondence). IEEE Trans. Microw. Theory Tech. 1971, 19, 733–736. [Google Scholar] [CrossRef]
  23. Sodickson, D.K.; Zhang, B.; Duan, Q.; Brown, R.; Lattanzi, R.; Lakshmanan, K.; Vaidya, M.V.; Yang, A.; Rehner, R.; Vester, M.; et al. Is a ’one size fits all’ many-element bore-lining remote body array feasible for routine imaging? Proc. Int. Soc. Magn. Reson. Med. 2014, 22, 618. [Google Scholar]
  24. Sodickson, D.; Biber, S.; Renz, W.; Schnell, W.; Vester, M. Remote Body Arrays for High-Performance Magnetic Resonance Imaging and Spectroscopy. WO 2,010,097,375 A2, 2 September 2010. [Google Scholar]
  25. Ernst, R.R.; Anderson, W.A. Application of Fourier Transform Spectroscopy to Magnetic Resonance. Rev. Sci. Instrum. 1966, 37, 93–102. [Google Scholar] [CrossRef]
  26. Jin, J. The Finite Element Method in Electromagnetics; Wiley: Hoboken, NJ, USA, 2015. [Google Scholar]
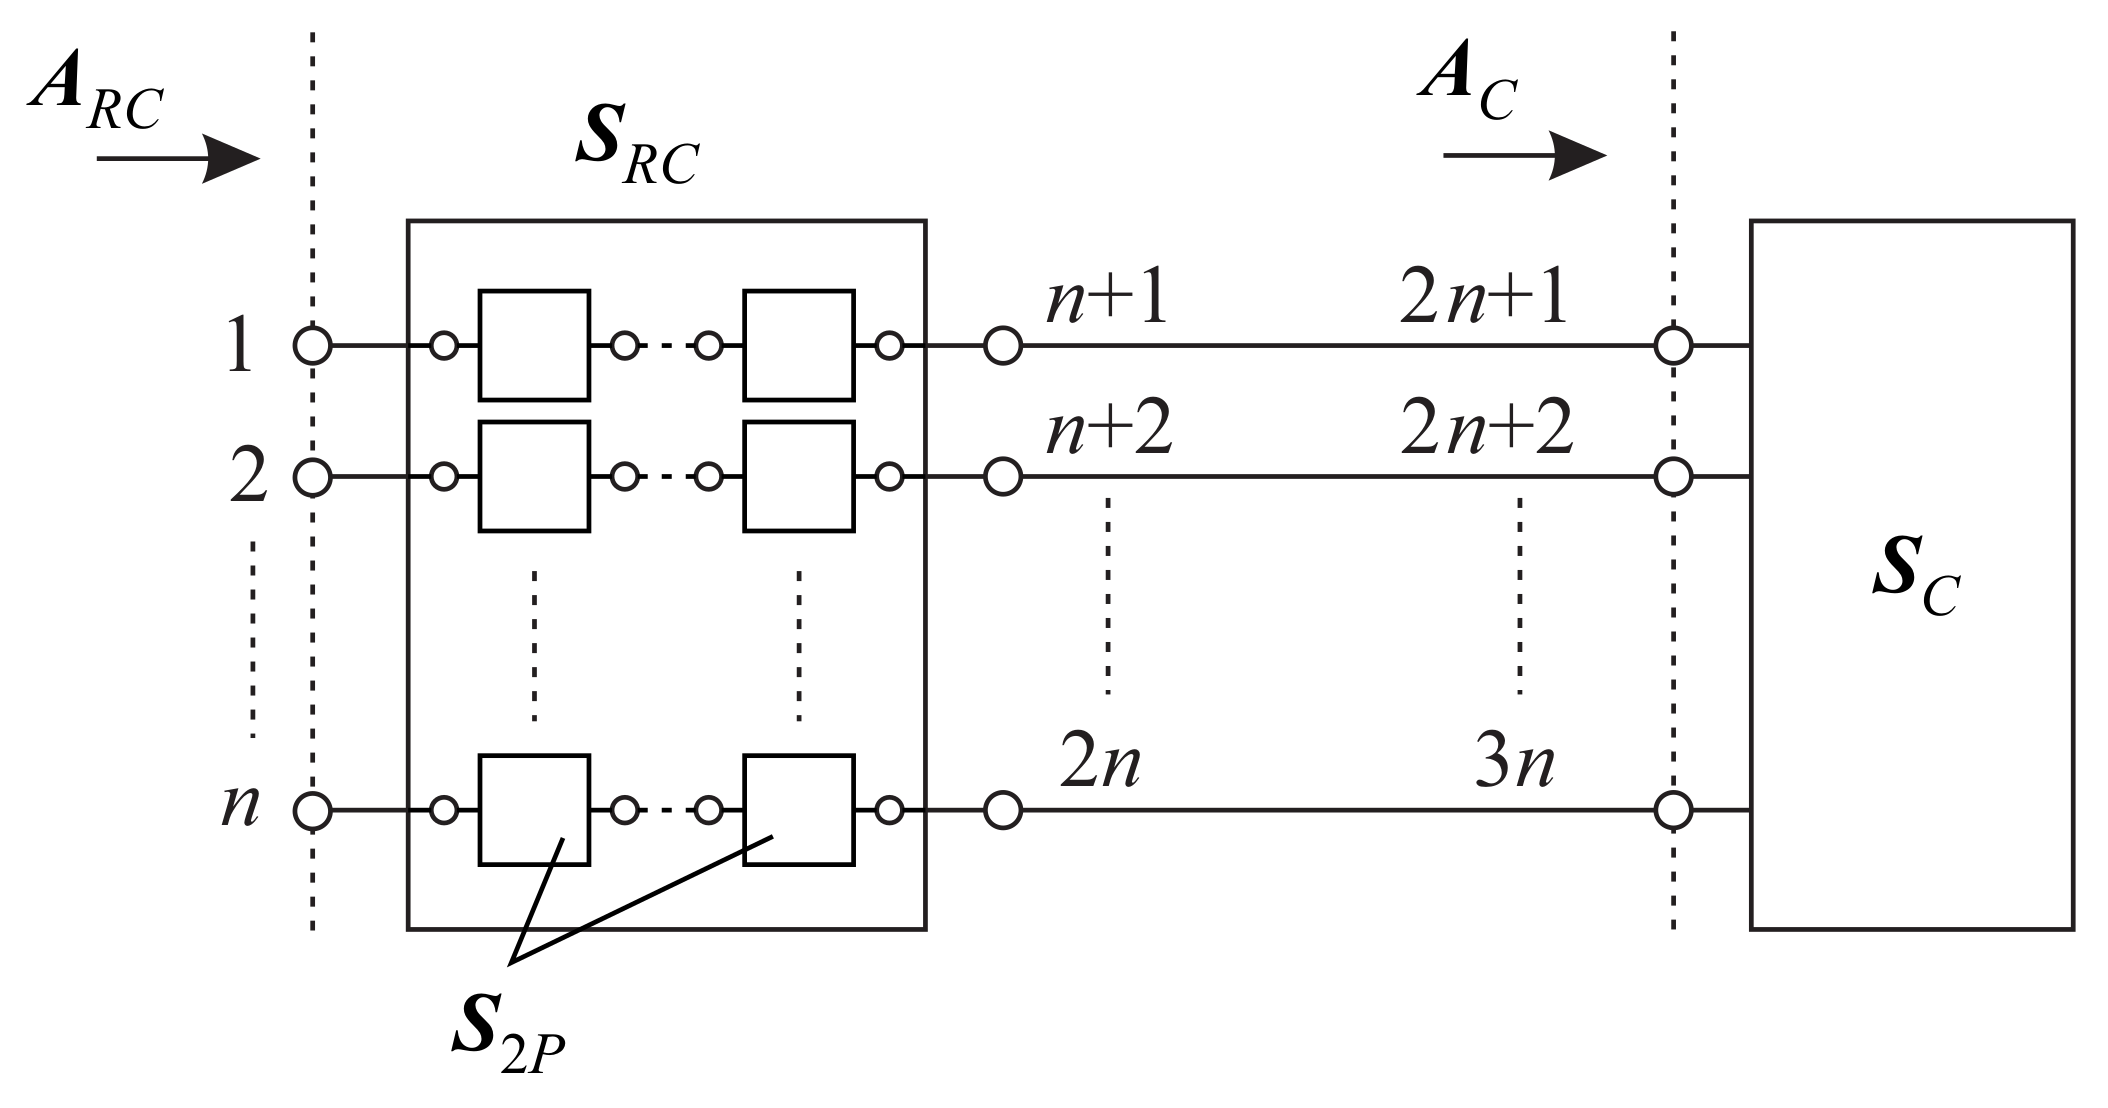
Figure 1. Block diagram of S-parameters of an n-channel coil array S C and receiver chain S R C that are used to model the noise of the network. Incoming wave vectors A R C and A C will be needed to calculate the maximum available signal-to-noise ratio (SNR) of the network by weighing the magnetic field vector B ν ( r ) gathered from an electromagnetic field solver. The individual two-port matrices S 2 P describe the noise of all components of the receiver chain.
Jimaging 04 00067 g001
Figure 2. Composition of S R C : S-parameters of pre-amplifiers S P A , phase shifters S ϕ , matching networks S M N , and coil losses S C L .
Jimaging 04 00067 g002
Figure 3. Noise model of pre-amplifier with a noise current source i n , P A and a noise voltage source u n , P A that can be partially correlated. The noise sources are positioned at the input port of the noise free S-parameter network S n f of the pre-amplifier. The coil signal that is received in the pre-amplifier plane will be modeled as a current source I T . The corresponding source admittance will be denoted as Y T and the reflection coefficient as r T . The noise contribution of the coil is described by the noise source i n , T .
Jimaging 04 00067 g003
Figure 4. Passive noise model for pre-amplifiers in an n-channel coil array. In every channel the pre-amplifiers are modeled as the chain connection of a two-port matching transformer and an attenuator with S-parameters S M T and S A t t , respectively. The S-parameters of the coil network that are transformed into the pre-amplifier plane are denoted as S T .
Jimaging 04 00067 g004
Figure 5. Noise coupling mechanism of pre-amplifier noise model of a two-channel network.
Jimaging 04 00067 g005
Figure 6. Two-channel coil arrangement for variation of coupling: (a) photograph; (b) model of electromagnetic field simulation. The two coils are positioned on a plastic tube and can be slid to change the distance L and therefore the coupling. The coil ports are connected to a pre-amplifier-board including a noise-matching network. In each coil four distributed capacitors are used for frequency tuning, one of which is parallel to the coil port. A saline water phantom is placed in the center of the coils.
Jimaging 04 00067 g006
Figure 7. Four-channel coil array: (a) photograph; (b) model of electromagnetic field simulation. Four planar coil elements on a fiberglass reinforced epoxy laminate (FR-4) substrate are inductively decoupled. Distributed capacitors are used in each element for frequency tuning. The array is placed at d = 13 mm above a saline water phantom.
Jimaging 04 00067 g007
Figure 8. Normalized SNR values B 1 ( r ) / P versus coil distance L of the two-channel coil array of measurement and the model in the phantom center for a calibration factor of K c a l = 780.1 W / μ T . The parameters of the model are F 2 P , m i n = 0.66 dB , F o f f = 0.19 dB , r 2 P , o p t = 0.1 0.36 i for the pre-amplifiers and R C = 0.7   Ω for the coil resistances and for the curve model without F P A F 2 P , m i n = F o f f = 0 dB .
Jimaging 04 00067 g008
Figure 9. Normalized SNR values B 1 ( r ) / P of the four-channel coil array for a calibration factor of K c a l = 270.0 W / μ T in a transversal plane: (a) measurement, (b) model. The parameters of the model are F 2 P , m i n = 0.66 dB , F o f f = 0.19 dB , r 2 P , o p t = 0.1 0.36 i for the pre-amplifiers, R C , l = 2.4   Ω for the coil resistance of the large element, and R C , s = 1.9   Ω for the coil resistance of the small element.
Jimaging 04 00067 g009
Figure 10. Normalized SNR values B 1 ( r ) / P of the four-channel coil of measurement and model for a calibration factor of K c a l = 270.0 W / μ T : (a) y 0 = 100 mm , (b) x 0 = 0 mm . The parameters of the model are F 2 P , m i n = 0.66 dB , F o f f = 0.19 dB , r 2 P , o p t = 0.1 0.36 i for the pre-amplifiers, R C , l = 2.4   Ω for the coil resistance of the large element, and R C , s = 1.9   Ω for the coil resistance of the small element.
Jimaging 04 00067 g010
Table 1. Noise parameter mean values and standard deviation of 20 investigated low noise pre-amplifiers.
Noise ParameterMean ValueStandard Deviation
F P A , m i n [ dB ] 0.470.02
R n [ Ω ] 4.100.58
Re ( r P A , o p t ) 0.100.02
Im ( r P A , o p t ) −0.360.03
Table 2. Transmission coefficients of the four-channel coil array at f = 123.2 MHz .
S-ParameterMeasurementModel
| s 21 | 2 / dB 16.5 15.6
| s 31 | 2 / dB 25.8 28.2
| s 41 | 2 / dB 10.9 11.4
| s 32 | 2 / dB 11.9 12.0
| s 42 | 2 / dB 31.5 28.8
| s 43 | 2 / dB 17.3 16.5