1. Introduction
Nowadays, people spend most of their time indoors. This leads to an increase in the demand for comfortable indoor environmental conditions. The indoor thermal comfort indices, such as the Predicted Mean Vote/Predicted Percentage Dissatisfied (PMV/PPD), the Standard Effective Temperature (SET), and the operative temperature can be computed in order to determine the level of thermal comfort in an indoor environment both in the design stage and for the assessment in the field [
1,
2,
3]. These indices depend on two groups of parameters. As detailed in ASHRAE Standard 55 [
4], in the ISO 7730 Standard [
5], and in the EN 15251 Standard [
6], the first group is composed of the quantifiable parameters, also known as the non-subjective parameters. These parameters are the air temperature, the air speed, the air humidity, and the mean radiant temperature. The second group includes the activity level and the clothing thermal insulation of the occupants. These latter parameters may vary from one occupant to the other and, thus, are highly subjective. While the two subjective parameters are evaluated by questions-answers during the thermal comfort assessment, the four non-subjective parameters can be measured directly using an appropriate instrument.
From the point of view of the spatial dimension, a scientific instrument can be either a 0D instrument or a whole-field measurement instrument. A 0D instrument, also called punctual instrument, gives the value of the measurand at a point. The thermocouple, the anemometer, the hygrometer, and the globe thermometer are some punctual instruments used, respectively, for the measurement of the air temperature, the air speed, the air humidity, and the mean radiant temperature. One can refer to Dell’Isola
et al. [
3], Fraden [
7], and Parsons [
8] for detailed discussions on these sensors.
A whole-field measurement instrument can achieve two complementary and useful tasks; namely, the quantification and the visualization of the spatial distribution of the measurand. As described by Sun and Zhang [
9], as well as Sandberg [
10], particle image velocimetry is one of the whole-field measuring methods used to measure air velocity in 2D and 3D. It uses a high-speed RGB camera in order to follow particles in the fluid. After an appropriate image processing, between two instants, it is possible to determine the displacement of the particles and their velocity. As the particles are chosen such that their density is close to that of the fluid, both have the same velocity. Although this technique gives accurate results and provides a micro scale air velocity pattern, the covered area is less than a square meter and it requires systems for the illumination and the particle injection. So, the technique have a heavy experimental setup and a high computational cost.
In several applications, an infrared camera is used as a 2D temperature sensor. For example, Datcu
et al. [
11] have used an infrared camera to accurately capture the building temperature distribution, Grinzato
et al. [
12,
13], and Balaras and Argiriou [
14] have used an infrared camera for default detection and for thermal isolation assessment of the building envelope. Other authors, Choi
et al. [
15], Korukçu and Kilic [
16], and Shastri
et al. [
17], for example, have used an infrared camera in order to monitor and to evaluate the thermal response of a human under specific environmental conditions.
Some studies, Fokaides
et al. [
18] and Cehlin
et al. [
19], have reported the use of an infrared camera for the measurement and the visualization of the spatial distribution of air temperature in an indoor environment. Since air is transparent, an auxiliary device is used. The thermal energy balance between the auxiliary device and the surrounding air is used to achieve the measurement. Pretto
et al. [
20] have suggested the use of small multipart sensors. Each part of the sensor is used for the measurement of one of the four indoor parameters by the infrared camera. Following the same idea, a complete and successful demonstration has been presented by Djupkep
et al. [
21]. They showed that the temperature history, recorded by an infrared camera, of a single sensor can be used to estimate air temperature, air speed, and the mean radiant temperature after solving an inverse heat transfer problem. A measurement grid, built by arranging several sensors in the field of view of the camera, is used to visualize the spatial distribution of each of these indoor parameters by interpolating punctual measurements given by each sensor. The main objective of this paper is to extend the field of application of infrared thermography to the mapping of the indoor ambient conditions. The proposed instrumentation has four components: A measurement grid, an infrared camera, a pair of stereoscopic cameras and a moving system. Four key points are addressed in order to ensure its reliability: the robust detection of the sensors in the images, the determination of the 3D coordinates of each sensor of the measurement grid, the evaluation in terms of accuracy and robustness of experimental performance achieved by the sensor, and the mapping of the indoor ambient conditions.
The paper is organized as follows: in the next section, we recall the theoretical fundamentals of the sensor. In the third section, we present the experimental validation of the sensor. In the fourth section, the dynamic Hough transform is used as a robust detection tool. We also present the determination of the 3D coordinates of each sensor by triangulation. In the fifth section, some experiments are conducted in order to quantify and to visualize the indoor parameters distribution in 2D and in 3D. The last section is the conclusion of the paper.
3. Experimental Performance of the Sensor
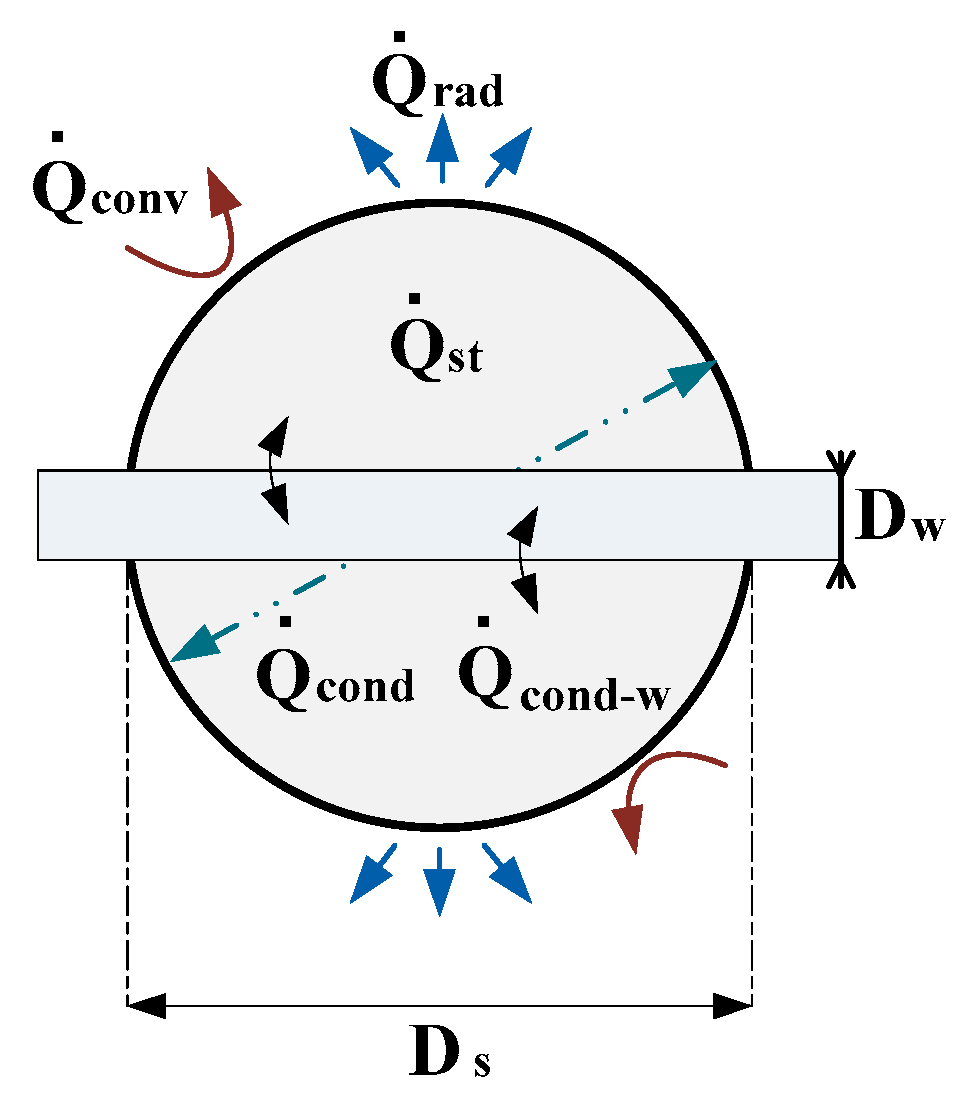
In order to accurately measure the sensor’s temperature using the infrared camera, the sensor, a hollow aluminum sphere, is covered with a high-emissivity acrylic paint (
Figure 3a). The diameter of the sensor is
the metallic part has a thickness of
and the acrylic part has a maximum thickness of
and an emissivity of
The experimental performances of the sensor are evaluated in terms of its reliability and the accuracy achieved on each of the three parameters measured. Our results are compared to the ISO 7726 standard [
23]. The prescriptions of this standard are summarized in
Table 1. The experimental setup (
Figure 3b,c) consists of a fan that can provide air at various speeds and temperatures, a radiant heat source that can modify the amount of heat exchanged by radiation and the IR camera, which records the temperature history of the sensor.
3.1. Validation of the Thermal Model of the Sensor
The objective here is to verify that for all imposed conditions (air temperature, air speed, and MRT), the model (5) fits very well with the experimental data and that the estimated values are very close to the true imposed values. The sensor is heated by the Joule effect such that its temperature increased for at least
Then, the voltage generator is switched off and the sensor enters a transient regime during which its temperature is recorded by the IR camera during 5 min at a rate of five recordings per second.
Figure 4a shows a typical experimental curve as well as the curve corresponding to the estimated parameters. As confirmed by
Figure 4b, the difference between the estimated curve and the experimental curve is such that
When one of the three parameters (air temperature, air speed, and MRT) has a fixed value and the others change, we arrive to the same conclusion: The model (5) describes very well the thermal behavior of the sensor.
3.2. Validation of the Measurement of Air Speed
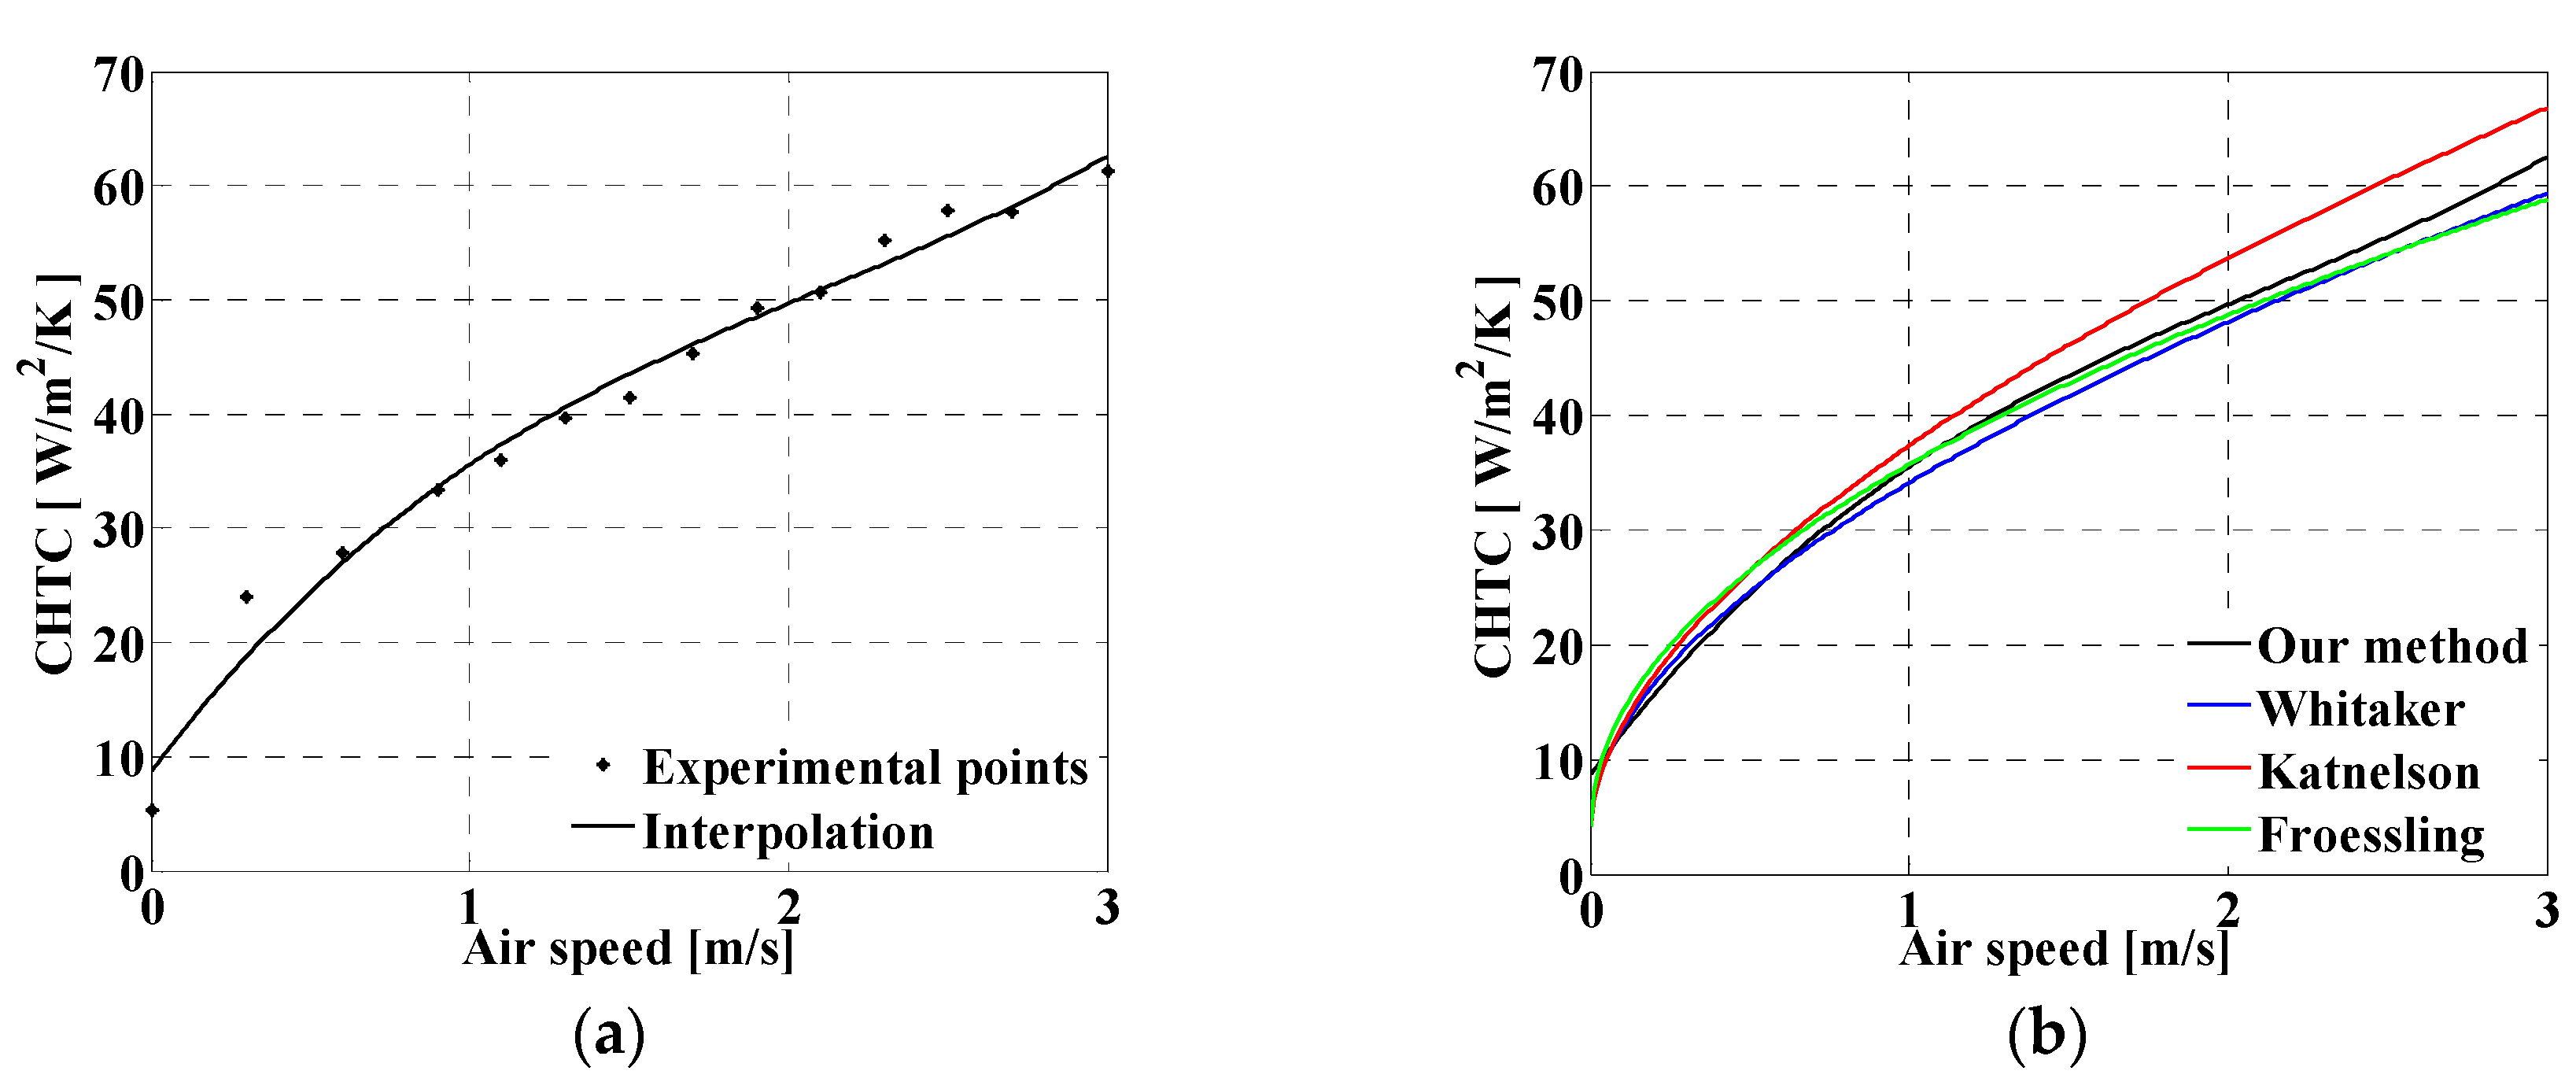
The CHTC
is estimated from the temperature history of the sensor. Air speed is then deduced. The correlation between the CHTC and the air speed has been sufficiently documented (Froessling [
24], Katsnel'son and Timofeyeva [
25], Whitaker [
26]). Using our method, we determined a correlation between the CHTC and the air speed.
Figure 3b,c shows the experimental setup used. A fan provides air flow at various speeds. The sensor is placed at
from the air exit. The value of the air speed is given by a hot wire anemometer having an uncertainty of
and the air temperature is given by a thermocouple having an uncertainty of
The anemometer and the thermocouple have been chosen on the basis of the level of accuracy needed and their costs. For this work our goal was to meet the accuracy requirement of the standard ISO 7726. We achieved that with a low cost hot wire anemometer. During the calibration process, in order to reduce the measurement error resulting from the misalignment of the anemometer (thermocouple) and the air flow provided by the fan, several preliminary tests have been performed. The best position of the anemometer (thermocouple) was when the standard deviation of the measurements given by the anemometer (thermocouple) was less than its uncertainty.
Once the air speed is settled, the sensor is heated such that its temperature increased for at least After that, the IR camera records the sensor temperature history while it cools. The following values of air speed have been imposed: The air temperature has been maintained at
Figure 5a shows the curve, given by the proposed method, of the CHTC
versus the air speed. As presented in
Figure 5b, the resulting correlation is in accordance with existing correlations. The maximum error obtained on the air speed is
This maximum uncertainty is obtained for air speed equal to
For the same air speed, the standard ISO 7726 prescribes a desirable uncertainty of
This is of the same order of magnitude as that of the anemometer and is in accordance with the expected theoretical error for a signal to noise ratio
[
21]. The following relations are then written:
3.3. Validation of the Measurement of Air Temperature and Mean Radiant Temperature
In order to modify the convective effect with respect to the radiative effect on the sensor, the air speed is modified such that two equilibria are created on the sensor. For each equilibrium, the parameters
and
are estimated. Using Equation (4), the air temperature and the mean radiant temperature are then determined respectively by Equation (9) and Equation (10):
Using the experimental setup of
Figure 3b,c, the temperature and the speed of the air supplied by the fan are kept to known values. The amount of heat exchanged by radiation between the sensor and its surrounding depends on the power of the lamp. For each trial, the MRT is kept constant by adjusting the power of the lamp to a constant value. The true value of the triplet
is known and serves as a reference for comparison. For each trial, seven air speeds are considered. The objective is to determine the ratio
for which the best accuracy on the measured parameters is achieved. For each of seven imposed air speeds, the temperature history of the sensor is used to estimate
We then compose the couple
and compute the air temperature and the MRT using Equations (9) and (10), respectively.
Table 2, with
summarizes the experimental data considered.
Figure 6 gives the measurement error on the air temperature. It appears that, as the ratio
increases, the measurement error decreases. Furthermore, the value of
also influences the accuracy of the measurement in that the accuracy is better for a small value of
. In all cases, for
the maximum measurement error is less than
There is a good agreement with the accuracy requirement of ISO 7726 [
23].
During the experiment, the true value of the MRT was not available. In order to validate our result, we made an assumption. As theoretical investigations suggest [
21], there is a minimum value of the ratio
which guarantees a reliable measurement. For any ratio greater than that minimum value, the values found for the MRT must be the same. Consider
Figure 7 showing the estimated MRT
versus the ratio
for each trial. It is clear that the greater the ratio
the better the accuracy as presented in
Table 3. The value of
has also a major influence. When
is high (
Figure 7b,c), the MRT values found, which were expected to be equal, vary significantly. The standard deviation is equal to
for the first trial (
Table 3). However,
Figure 7a shows that for
, the MRT values found are close and show a standard deviation less than
during each trial (
Table 3). Thus, the method gives accurate results when
and
is as small as possible. Of course, the best value of
is the value corresponding to a null air speed.
4. 3D Reconstruction of the Measurement Grid
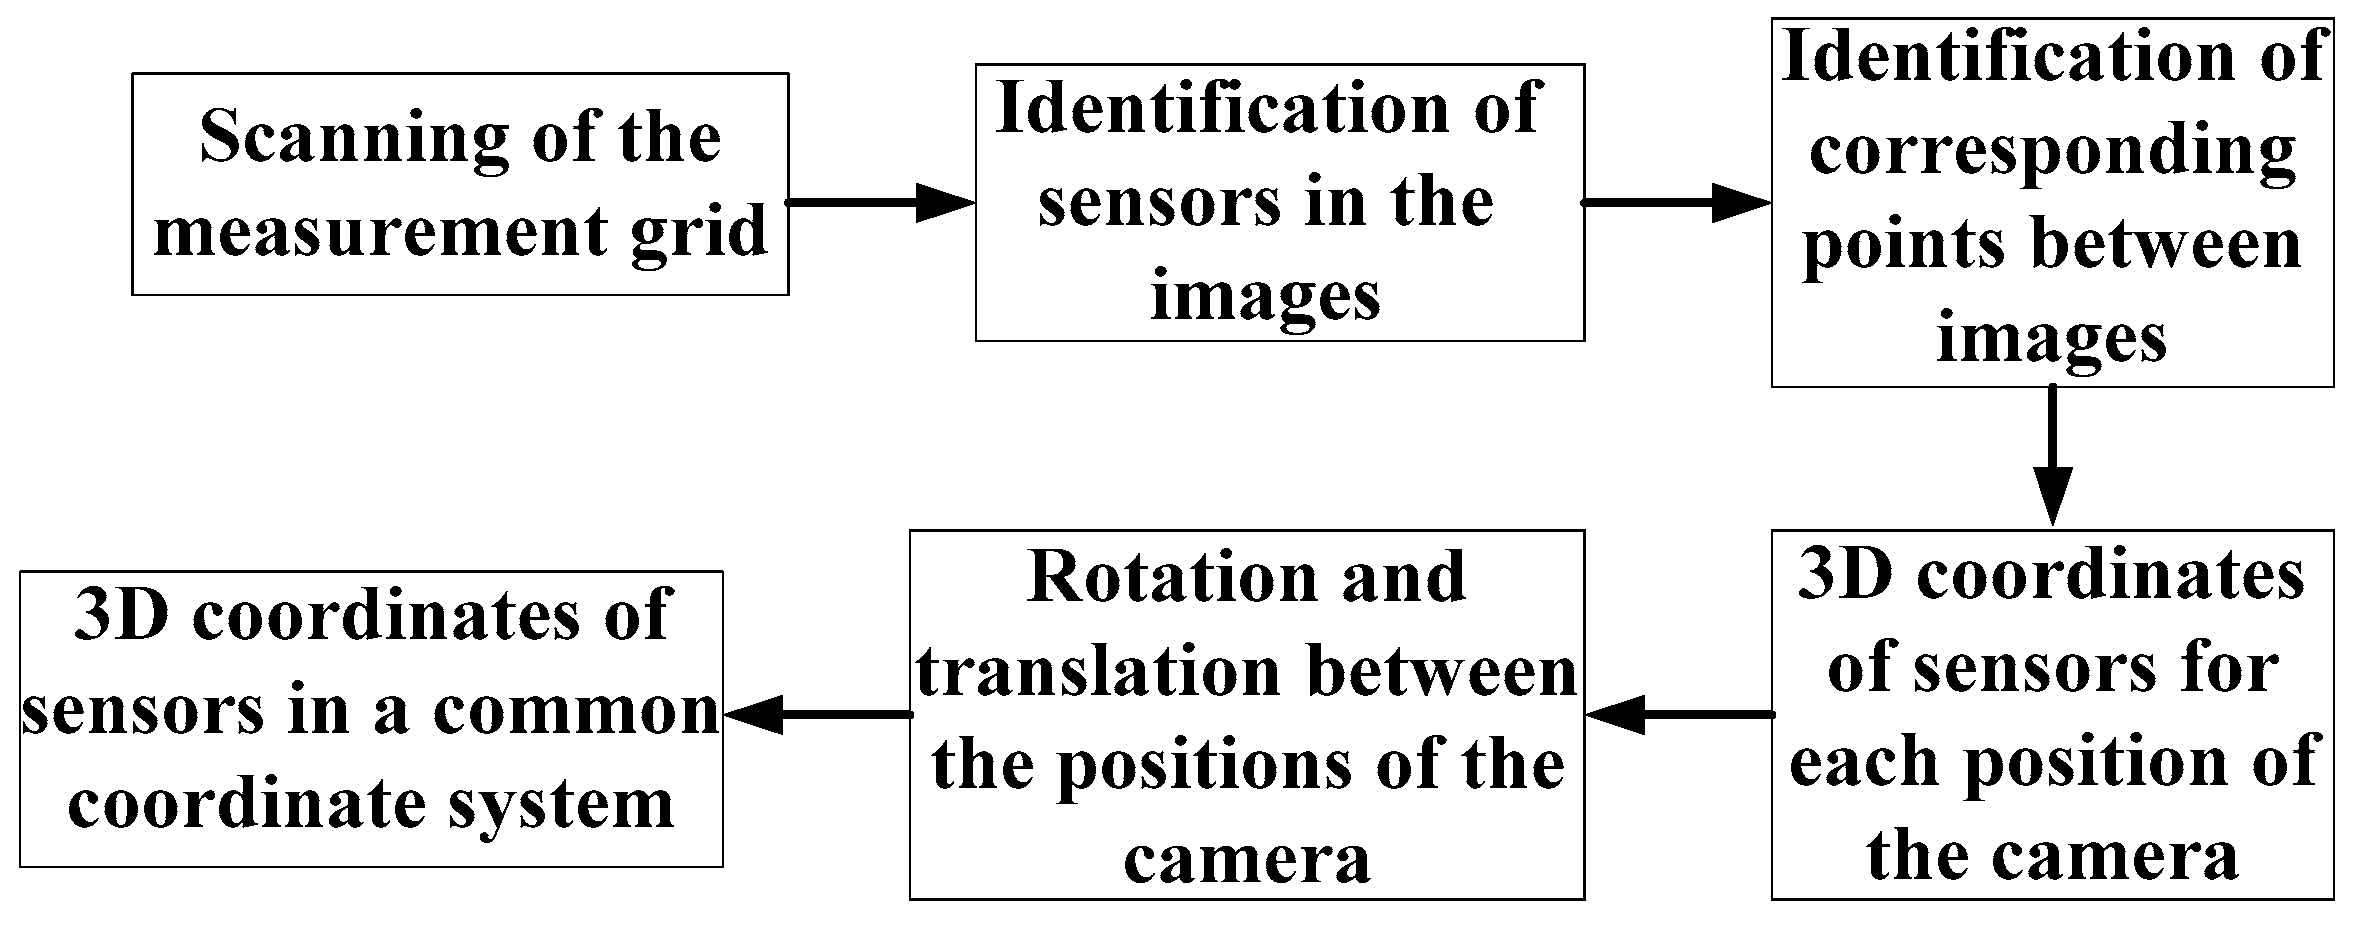
The complete reconstruction of the measurement grid is achieved when the 3D coordinates of all of the sensors are known in a common coordinate system. These 3D coordinates are found by triangulation by stereovision; that is, by using a pair of cameras. The steps to follow in order to finalize the 3D reconstruction of the measurement grid are given in
Figure 8.
4.1. Scanning of the Measurement Grid
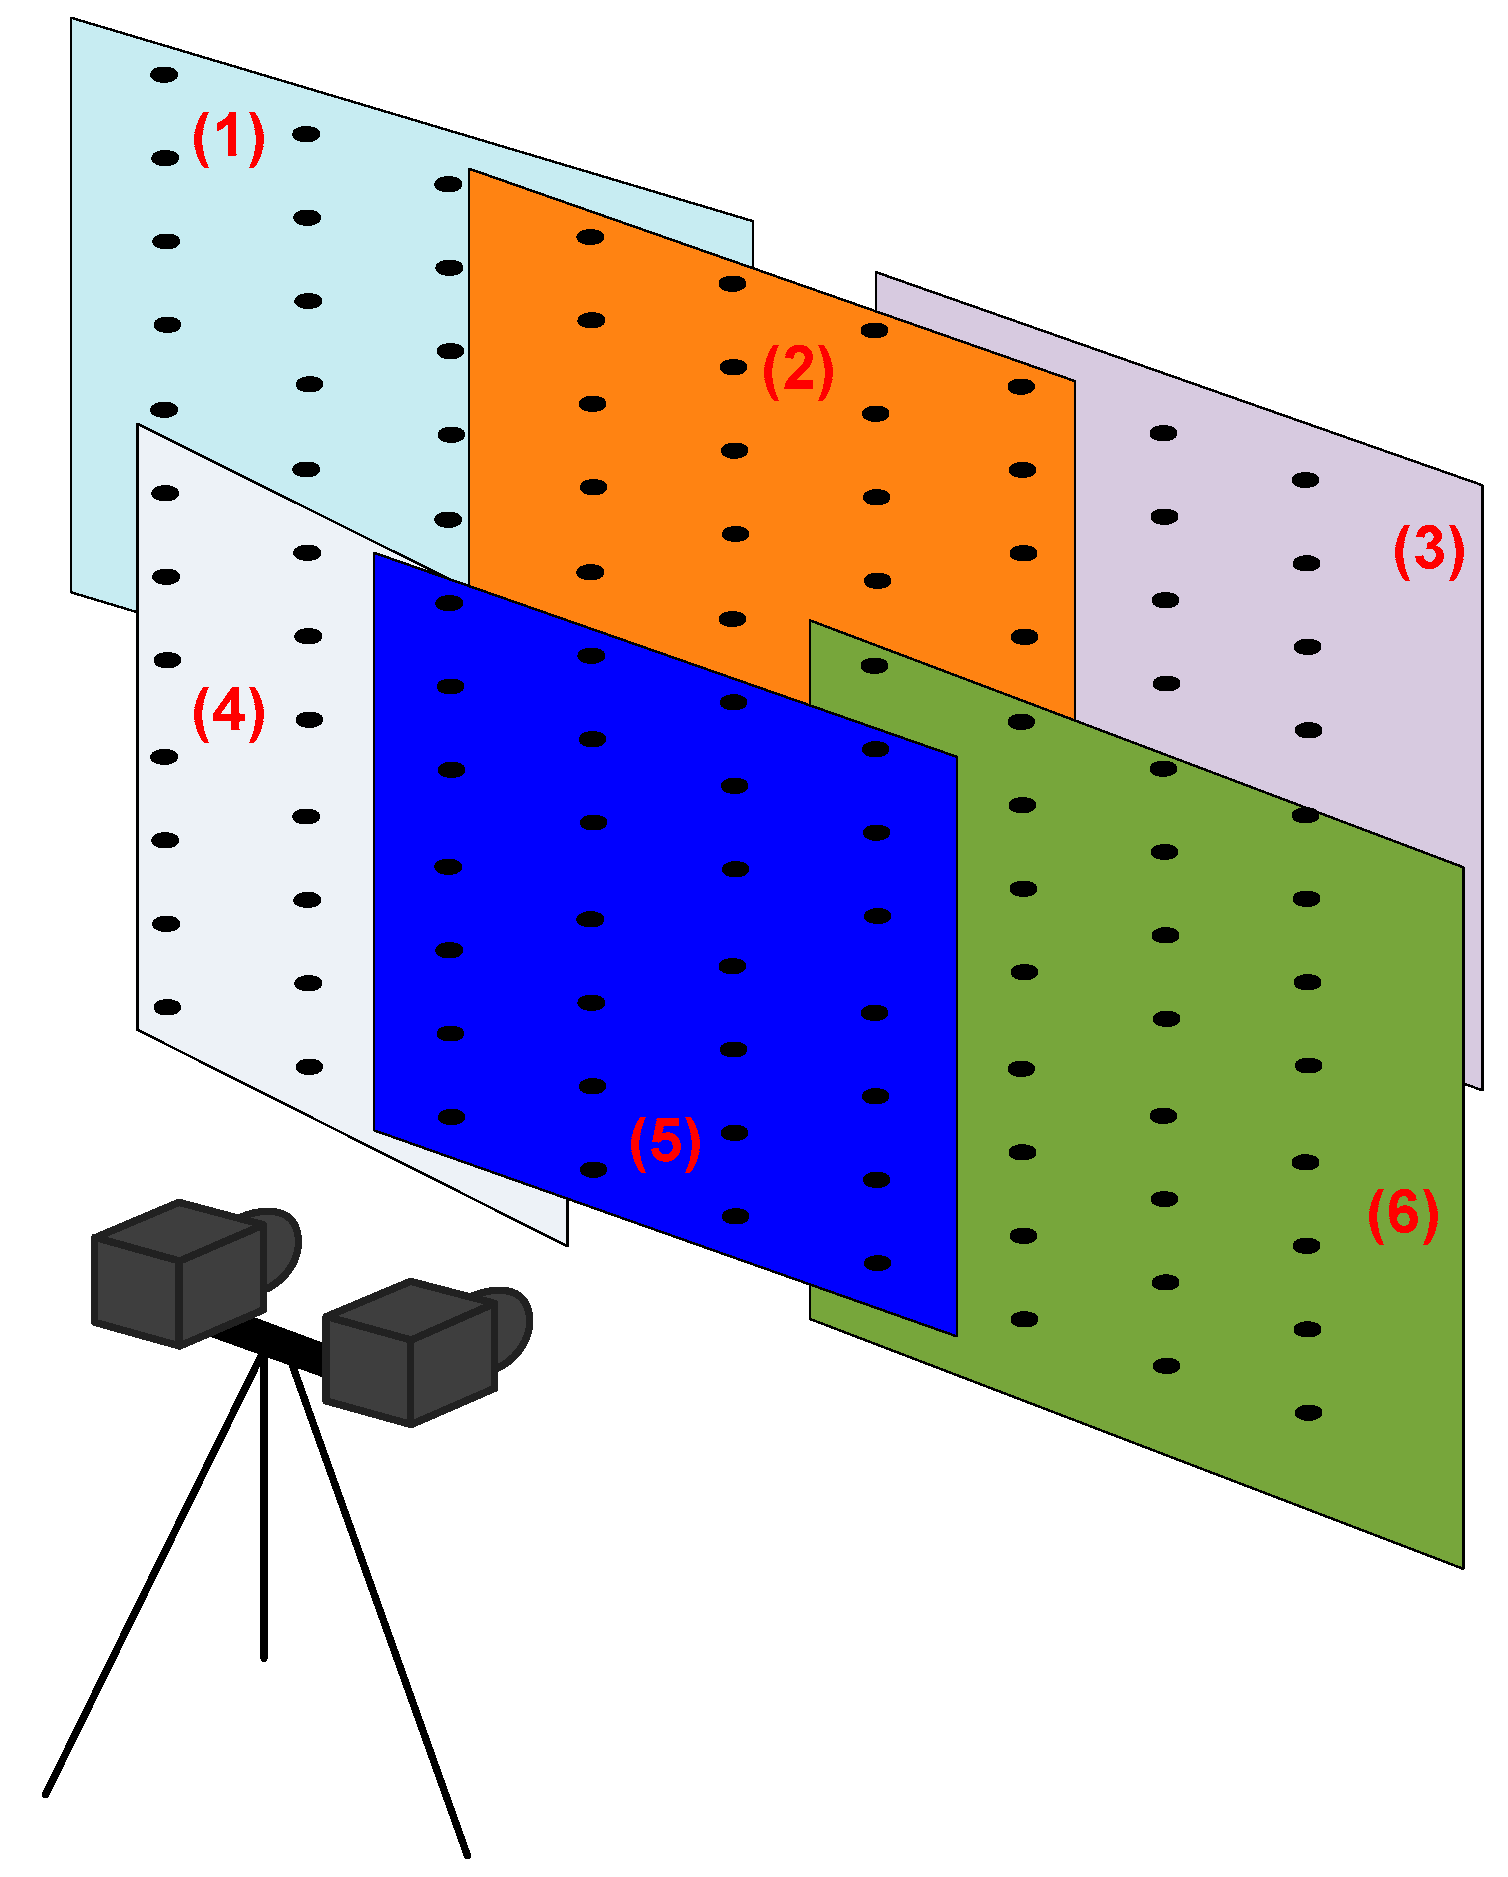
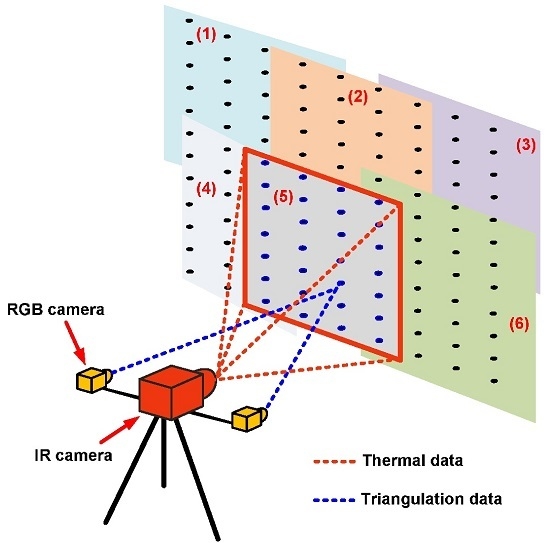
The field of view of the cameras is a limiting factor. Depending on the size of the measurement grid, cameras may not be able to simultaneously capture all of the sensors of the measurement grid. In such a case, the cameras are displaced from one position to the other in order to scan the entire measurement grid.
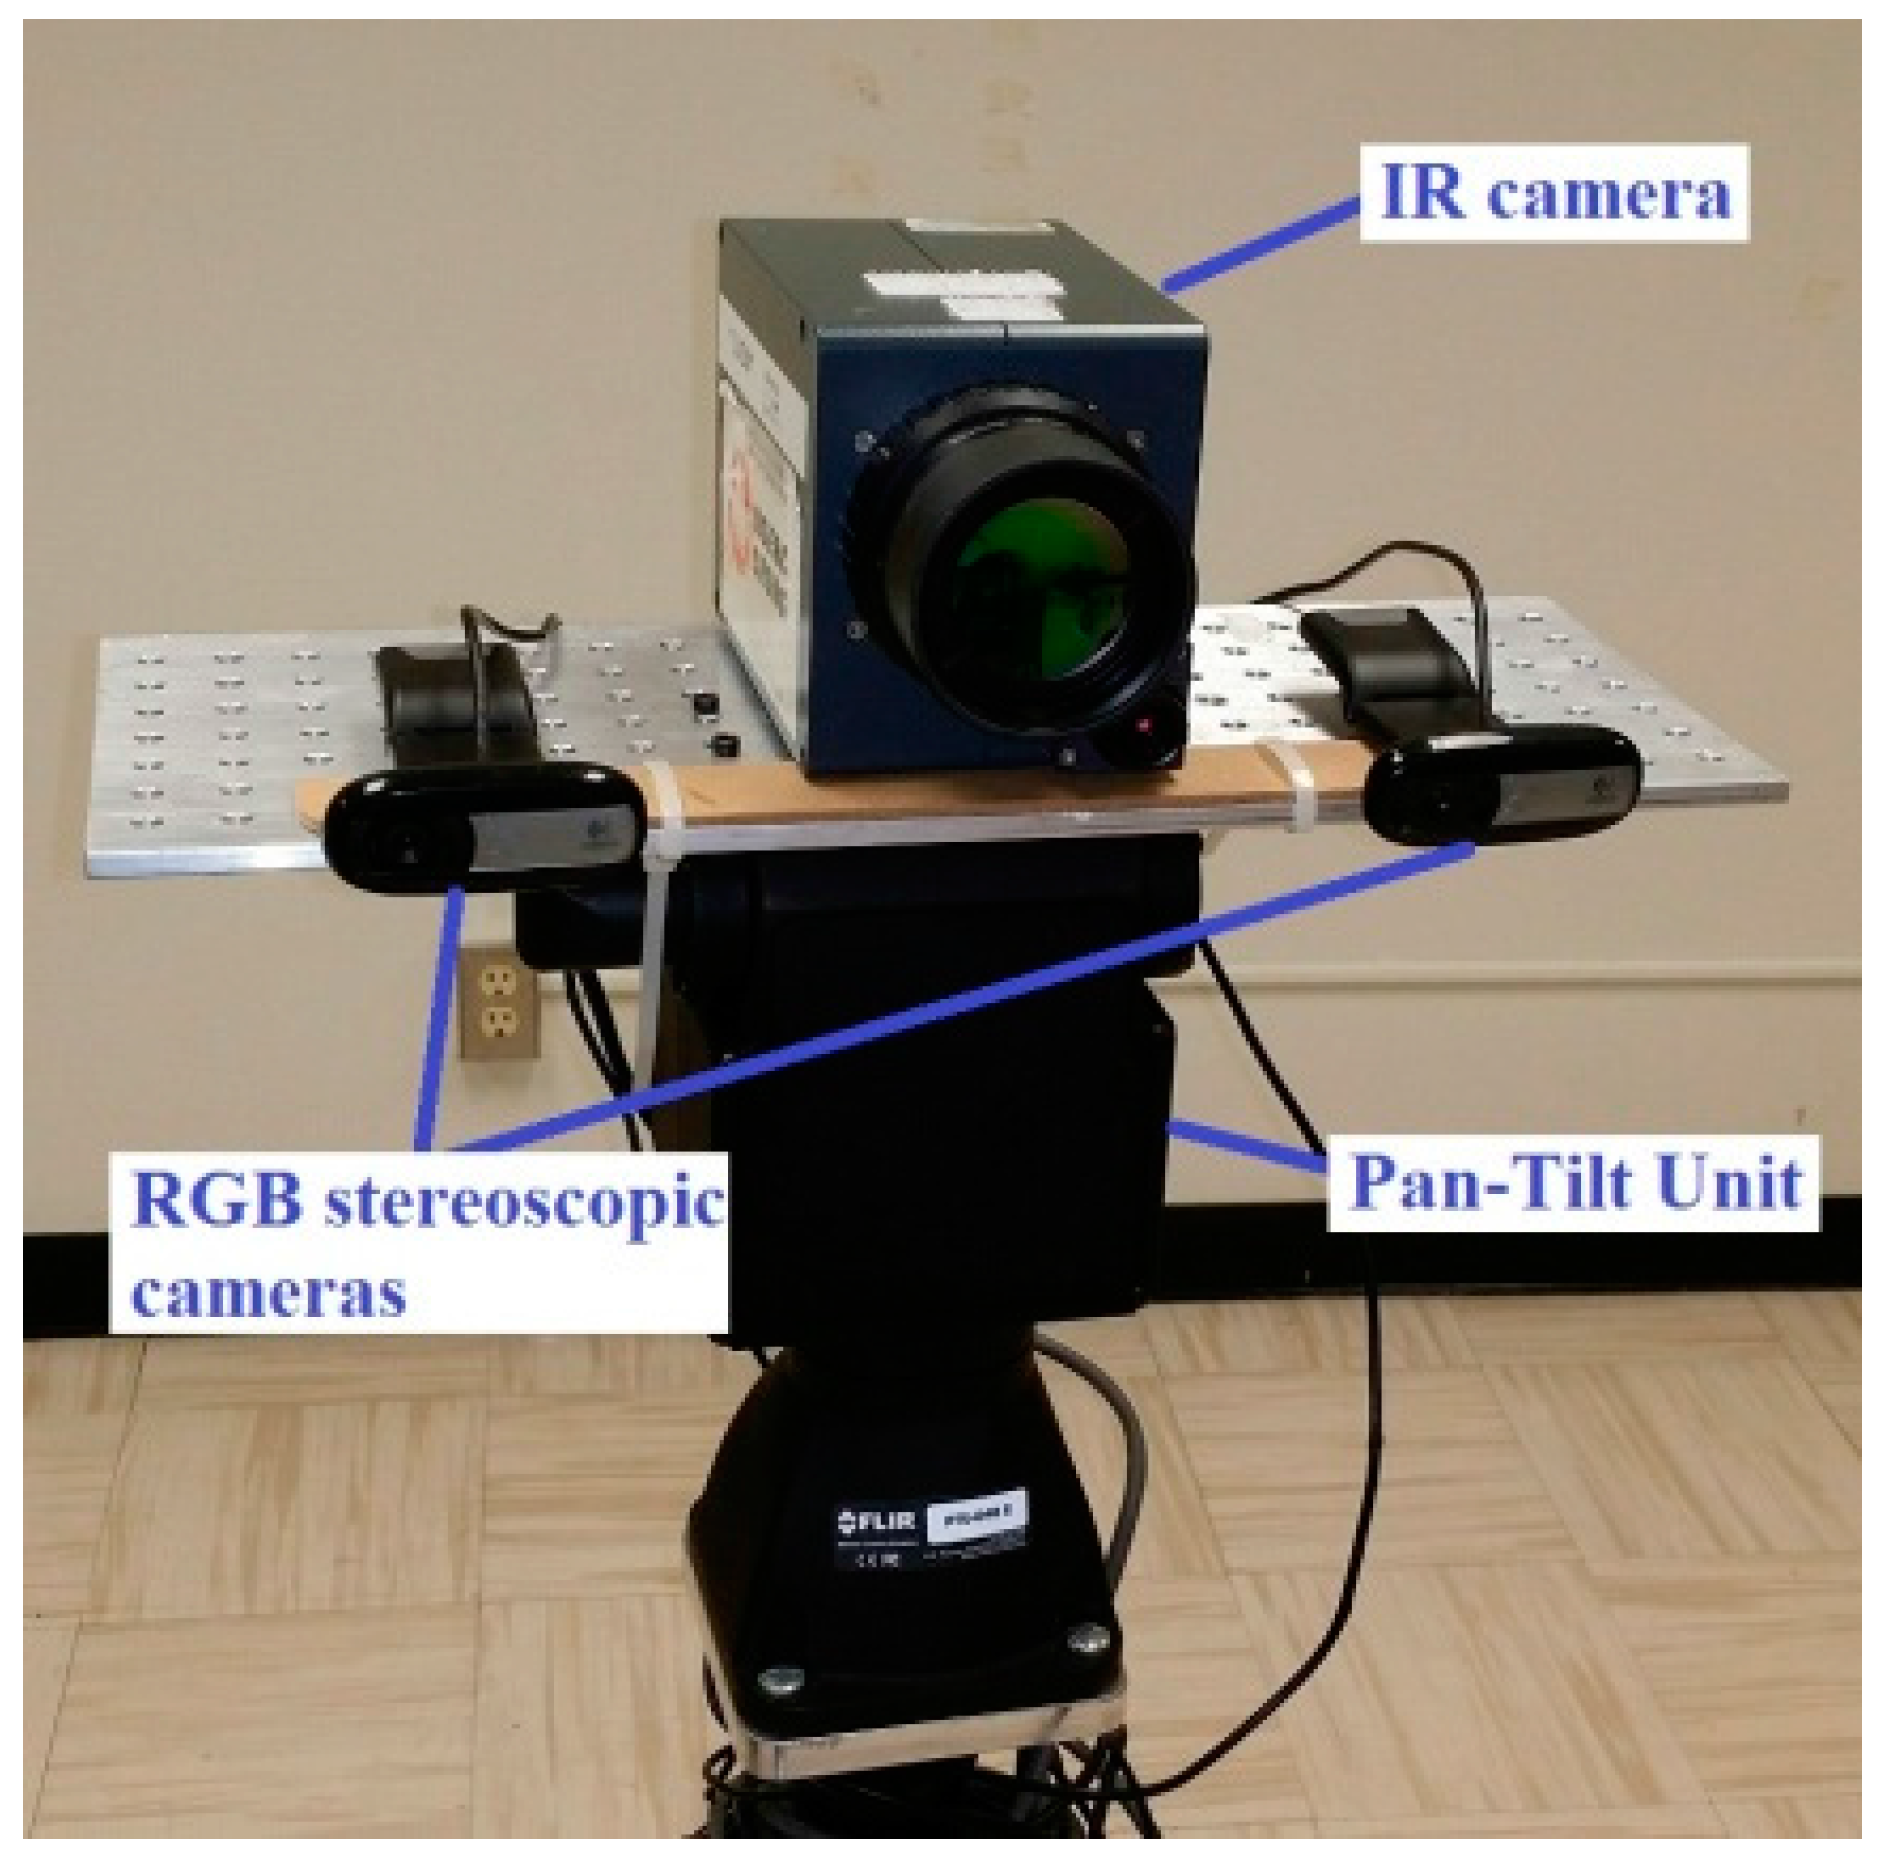
Figure 9 shows an example of successive parts of the measurement grid during the scanning. Thanks to a pan-tilt unit, the motion of the cameras is possible. To complete the next steps, images recorded at two successive positions of the camera must overlap.
4.2. Detection of Sensors in the Images
The detection of the sensors of the measurement grid in the images aims to extract their temperature history and to determine their 3D coordinates. We use the Hough transform (Ioannoua
et al. [
27]) for the detection of our spherical sensors. The Hough transform is an algorithm which is easy to implement and has a high noise tolerance. It represents, in its parameter space, the geometrical shape to detect. To define a circle in a 2D Cartesian coordinate system, three parameters must be known: The coordinates
of the center and the radius
. Thus, in the parameter space, a circle is represented by the point
The first step of the Hough transform is the detection of edge points in the image. Each edge point belongs hypothetically to the boundary of the searched circle. So, each of the detected edge points is represented in the parameter space. An accumulator is used such that each of its pixel coordinates represents a circle and the pixel value is equal to the number of edge points belonging to the searched circle. In the accumulator, the coordinates of local maxima are the representation of a real circle.
Figure 10 shows the result of the sensors detection in an IR image by Hough transform.
4.3. Corresponding Points between Images
A point
in the image
and a point
of the image
are called corresponding points if they represent the same real point [
28]. In order to identify corresponding points between
points in the image
and
points in the image
we can emphasize on the fact that two corresponding points must have a similar neighborhood. The level of similarity is given by the normalized cross correlation coefficient. The normalized cross correlation between the point
and the point
is:
The neighborhood of the pixel includes all of the pixels belonging to a window of a given size centered on is the mean value of these pixels. The corresponding point of is the point such that
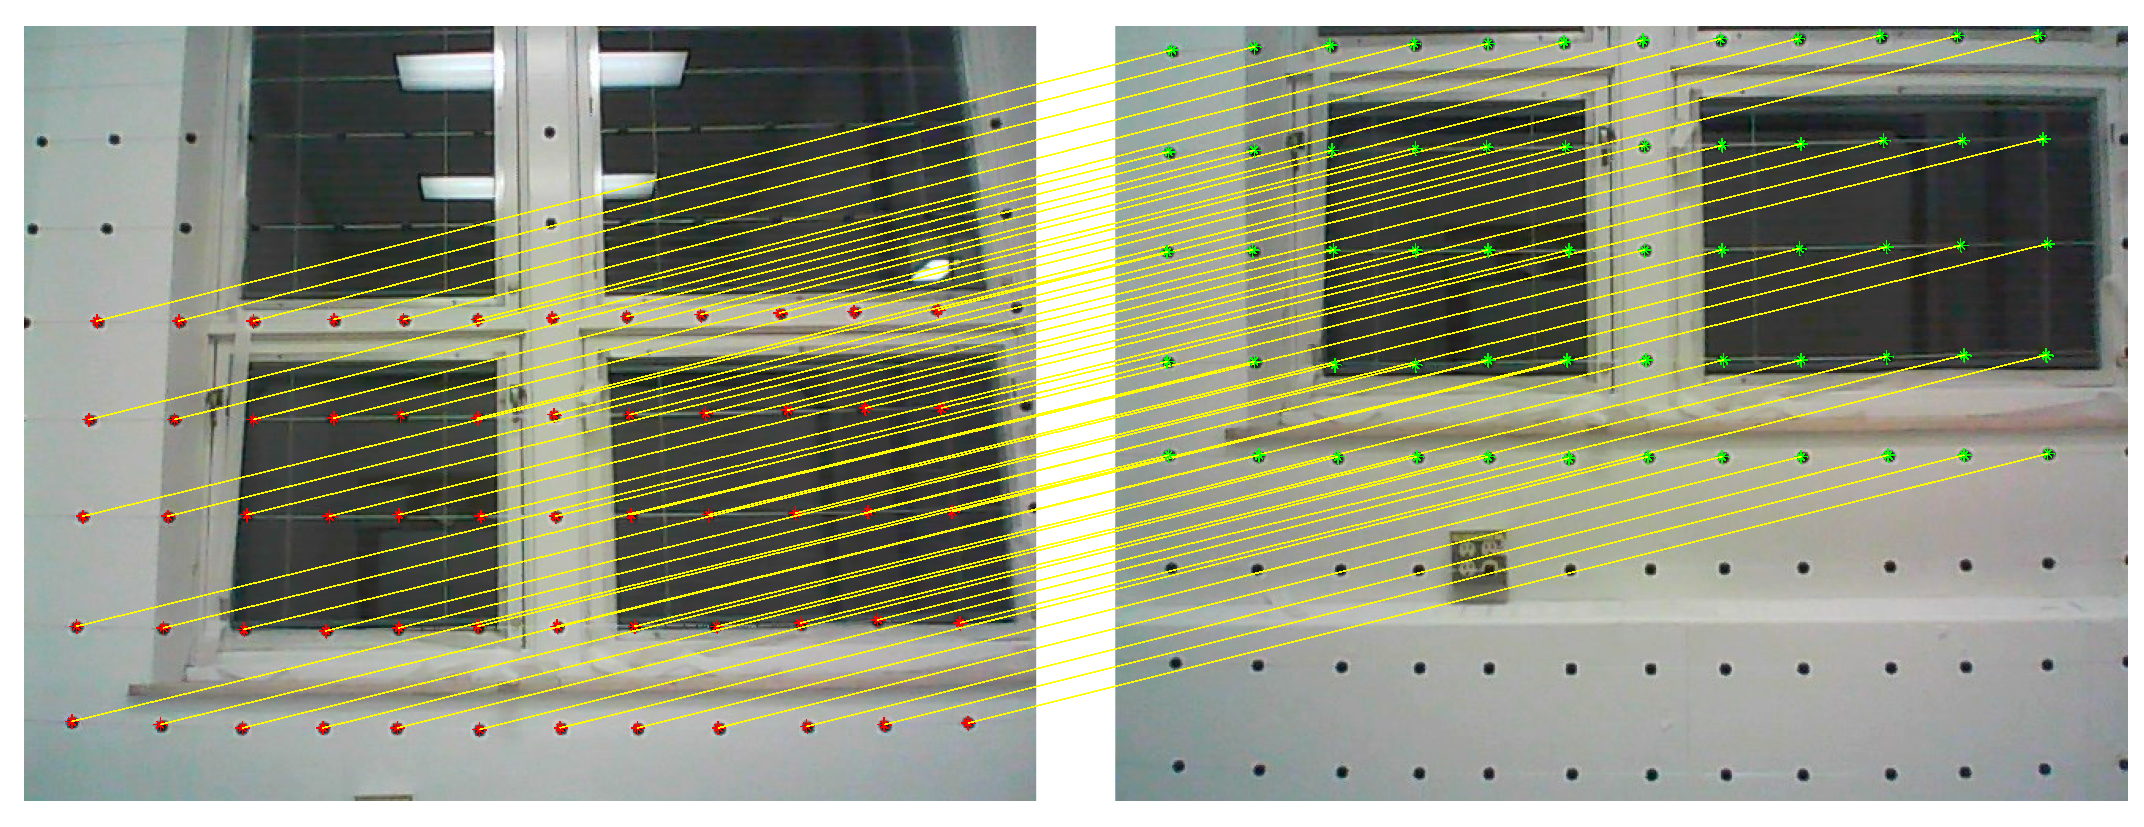
Figure 11 presents an example of corresponding points between two RGB images corresponding to two positions of the camera.
4.4. Geometric Calibration of A Camera
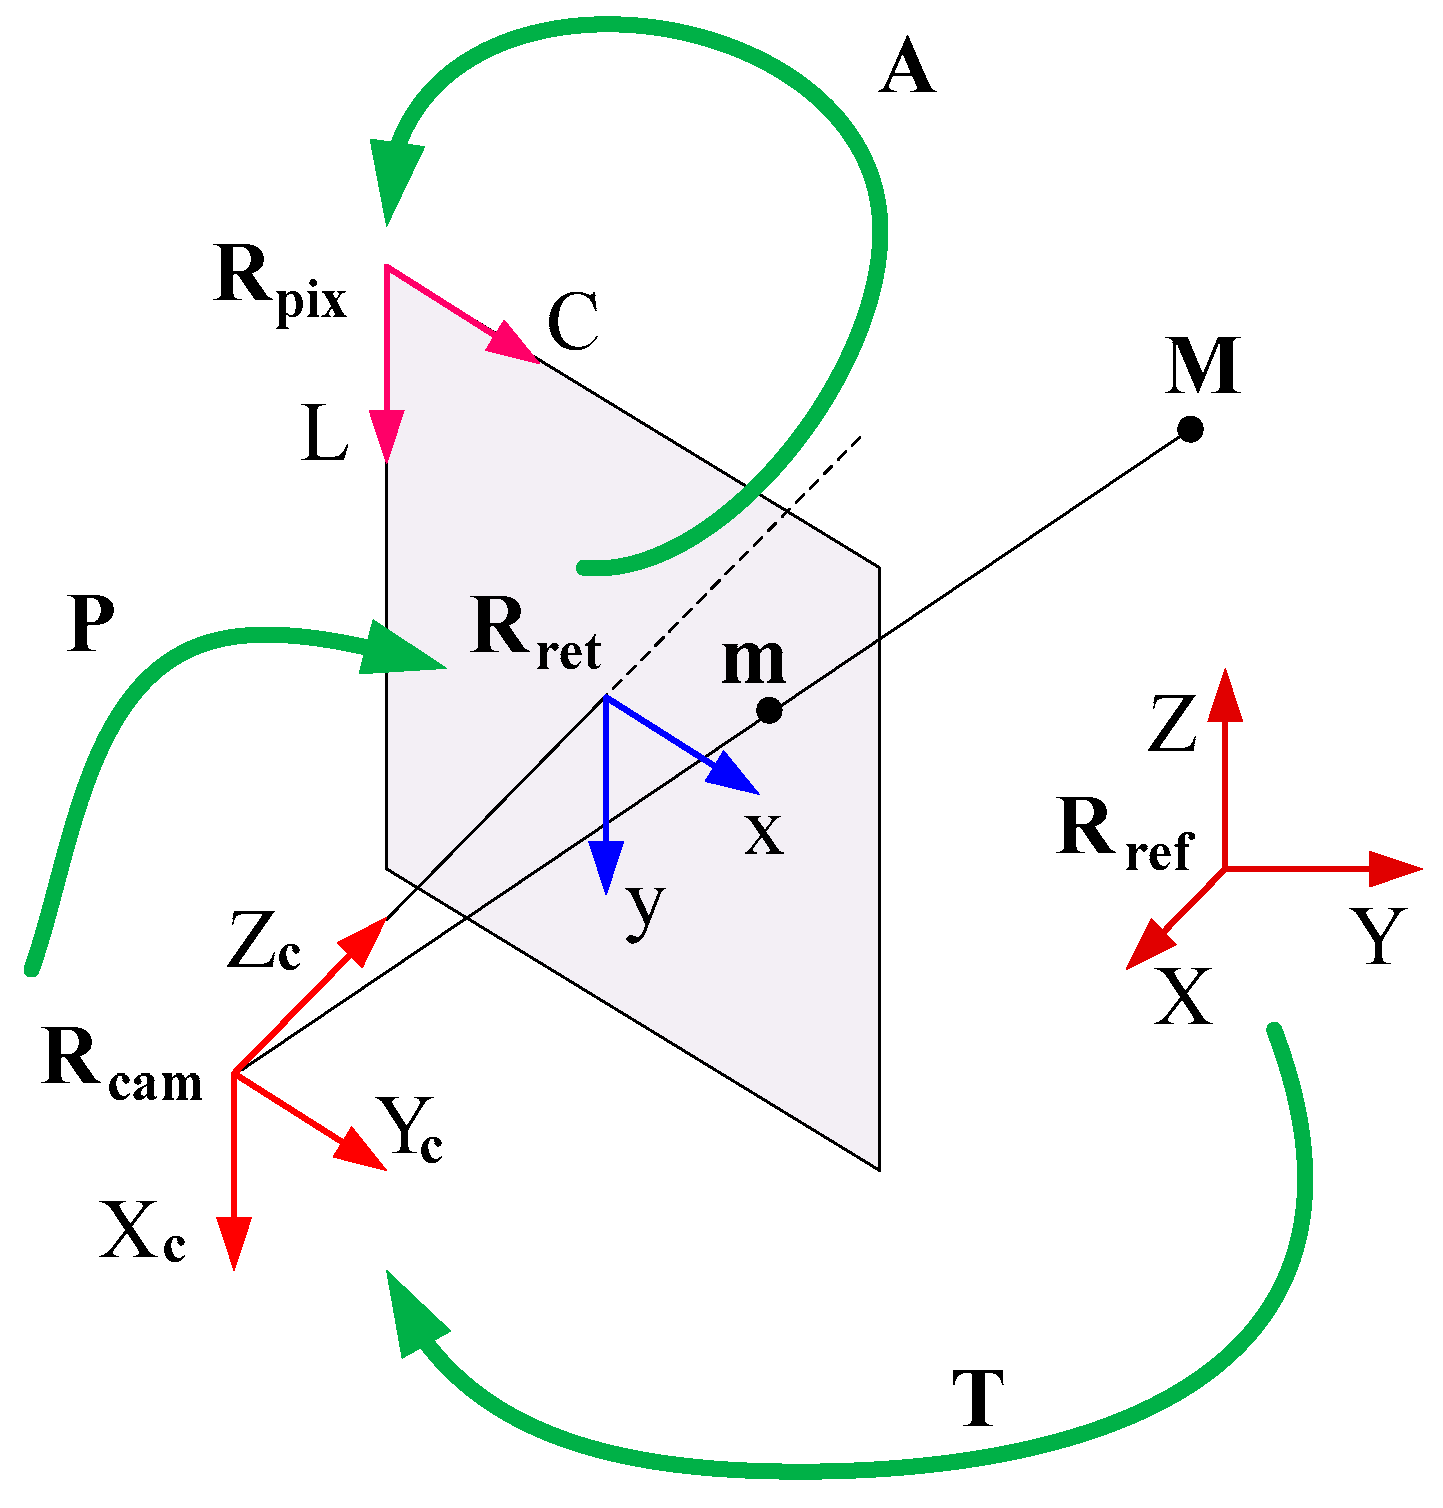
The objective of the geometric calibration of a camera is the identification and the determination of parameters of the mathematical model which exist between the 3D coordinates of a real point and its 2D coordinates in the image. The pinhole model (Hartley and Zisserman [
28]) is the most popular model used to describe a camera. As illustrated in
Figure 12, the camera projects the real point
into the image point
This is possible after three transformations of the coordinate systems
and
which are, respectively, the reference 3D coordinate system, the 3D coordinate system linked to the camera, the 2D retinal coordinate (without and with distortion) system belonging to the image plane, and the 2D pixel coordinate system. We have:
where
is the rotation matrix and
is the translation vector.
where
is the focal length of the camera lens.
where
and
are the distortion parameters.
are the coordinates of the point where the optical axis of the camera lens meets the image plane, is the angle between the x axis and the y axis, and are the number of pixels per unit length. and
Defining the intrinsic vector
and the extrinsic vector
we write
The calibration consists then in determining the vectors
and
from a given set of corresponding points
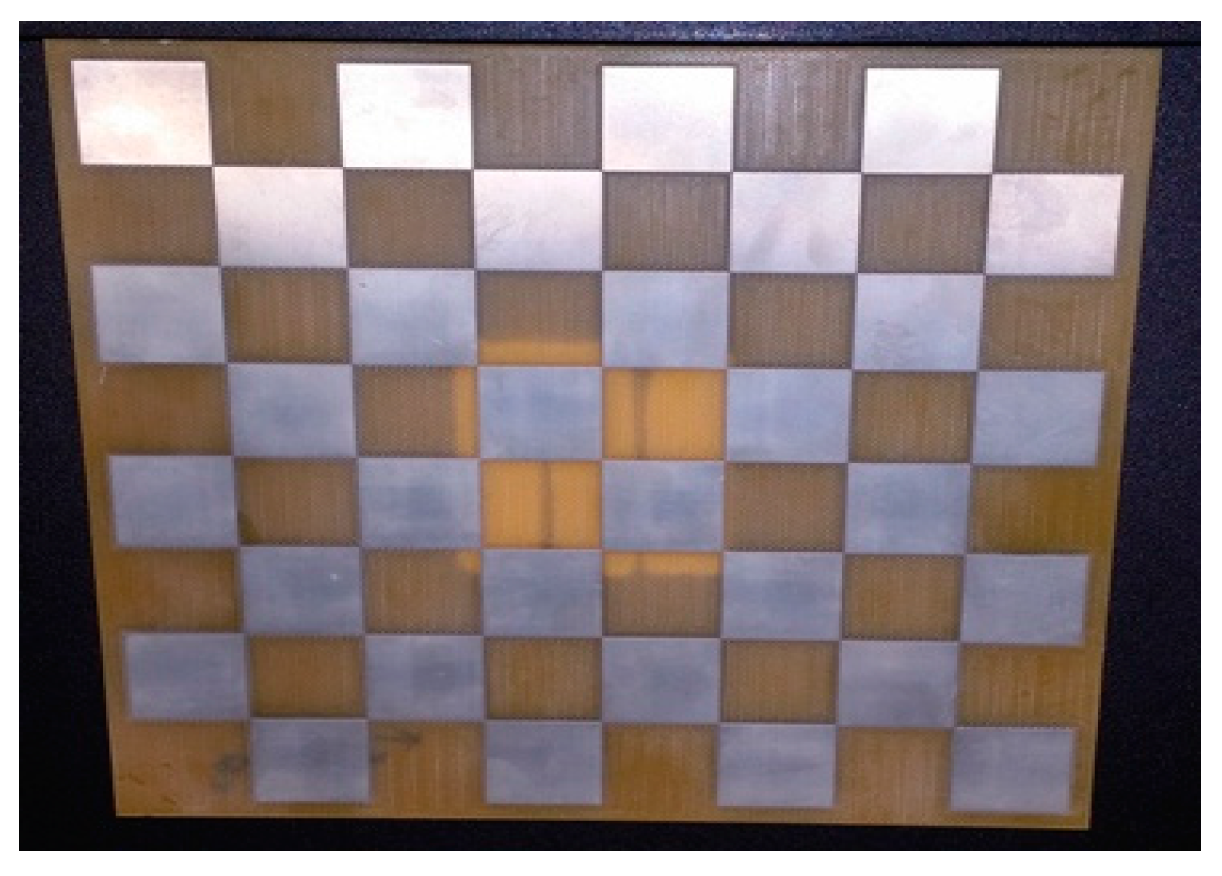
These points are found using a calibration target (
Figure 13). The camera records
different images of the calibration target. The 3D coordinates of
key points of the target (the corners of the squares in
Figure 13) are known in a chosen 3D coordinate system and their 2D coordinates are known in the pixel coordinate system. Vectors
and
are determined such that the sum
has a minimum value (Heikkilä and Silven [
29], Zhang [
30]).
4.5. Triangulation by Stereoscopic Vision
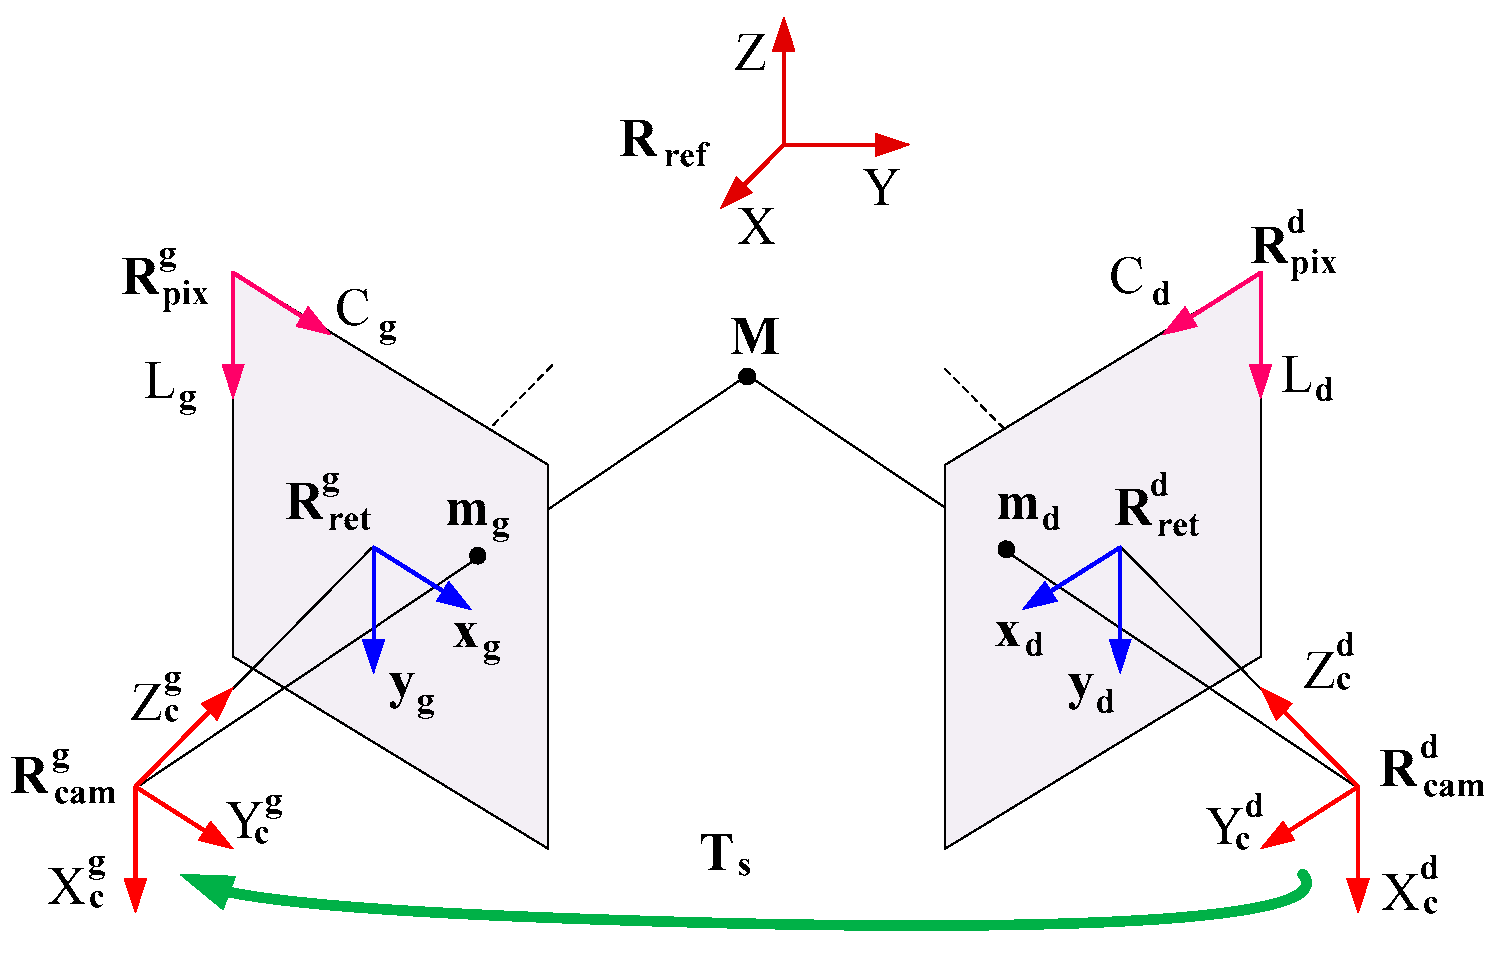
Triangulation by stereoscopic vision is the determination of the 3D coordinates of a point using at least two cameras [
31]. Considering a pair of stereoscopic cameras,
Figure 14 presents the synoptic of the triangulation. The point
must be located simultaneously in the field of view of both cameras. If the point
is projected onto the point
in the left image and onto the point
in the right image, we can write
and
If the intrinsic vectors, the extrinsic vectors, the points
and
are known, the two preceding equations can be solved in order to determine the 3D coordinates of the point
Instead of determining the 3D coordinates of in an arbitrary 3D coordinate system, the coordinate system of one of the cameras can be used. In this case the rotation matrix and the translation vector between the coordinate systems of both cameras are determined by a calibration of the stereoscopic cameras. The calibration data are a set of pairs of images of a calibration target having points. Each pair of images corresponds to a given spatial orientation of the calibration target. For the pair and can be determined using with and
4.6. Rotation and Translation between Two Positions of the Camera
Consider
and
the coordinates of four points in the coordinate systems
and
of the camera, respectively, at the first and the second position. The rotation
and the translation
between coordinate systems
and
are such that
and
are obtained by solving Equations (12).
Suppose that for a complete scanning of the measurement grid, the camera passes through
different positions (
Figure 10). The rotation
and the translation
(
Figure 15) between coordinate systems
and
of the camera, respectively, at positions
and
are given by
and
Thus, if the coordinate system of the camera at position is taken as the common coordinate system, it is possible to determine the 3D coordinates of all of the sensors in that common system if we know all of the rotation matrices the translation vectors and the 3D coordinates of the sensors in the coordinate system of the camera at position
6. Conclusions
An instrumentation devoted to the mapping of the indoor conditions by infrared thermography has been presented. It is associated with a measurement grid built by arranging a set of sensors horizontally and vertically, an IR camera, a pair of stereoscopic RGB cameras and a pan-tilt unit. The sensor, which is used to determine all of the ambient parameters, has been validated experimentally. The results show that a maximum uncertainty of and is achieved, respectively, on air speed, air temperature, and mean radiant temperature, respectively. Image processing tools have been presented. The objectives achieved are the robust detection of sensors in the images through Hough transform, the determination of the 3D coordinates of the sensors by triangulation, and the registration of all of the sensors in a common 3D coordinate system, specifically when the camera is moved in order to scan the entire measurement grid. The full procedure works very well and the mapping of the indoor parameters is possible. Two in situ experiments have been conducted. The first experiment involved the 2D mapping of air temperature and speed above a cooling fan-coil unit, and the second experiment involved the 3D mapping of air temperature and speed around a heating fan-coil unit. Results show that the instrumentation proposed is reliable and can be regarded as both a measurement technique and a visualization technique. All of the experiments presented in this paper have been conducted in office buildings without any occupants. At this time, no experiment has been conducted in the presence of occupants. As the method uses an infrared camera, there must be a free path between the camera and all of the sensors of the measurement grid. This is the main constraint of the proposed method. For the experiments where occupants are present, a difficulty could be to find the best way to place the measurement grid such that it is visible by the camera. Let us remind that, instead of using three different sensors, the proposed method uses a simple metallic spherical sensor for the contactless measurement of three different ambient parameters. From this point of view, the method has a low economic cost, particularly for the mapping of these parameters. A simple distribution of such sensors (measurement grid) in space can provide useful data for the mapping. The use of the dedicated instruments (anemometer, thermocouple, etc.) will result in a point-to-point process which is very time consuming and cumbersome. At this time one drawback of the method is its accuracy level. Although it meets the requirement of accuracy of the standard ISO 7726, some improvements is needed to also meet the desirable accuracy prescribed by the standard. Specifically, a more accurate and sensitive anemometer has to be considered for calibration. Furthermore, a camera with a high spatial resolution may improve the signal-to-noise ratio of the experimental data.

