
Transfer Learning Fusion Approaches for Colorectal Cancer Histopathological Image Analysis

Abstract
1. Introduction
Related Work
2. Materials and Methods
2.1. CNN Architectures with Transfer Learning
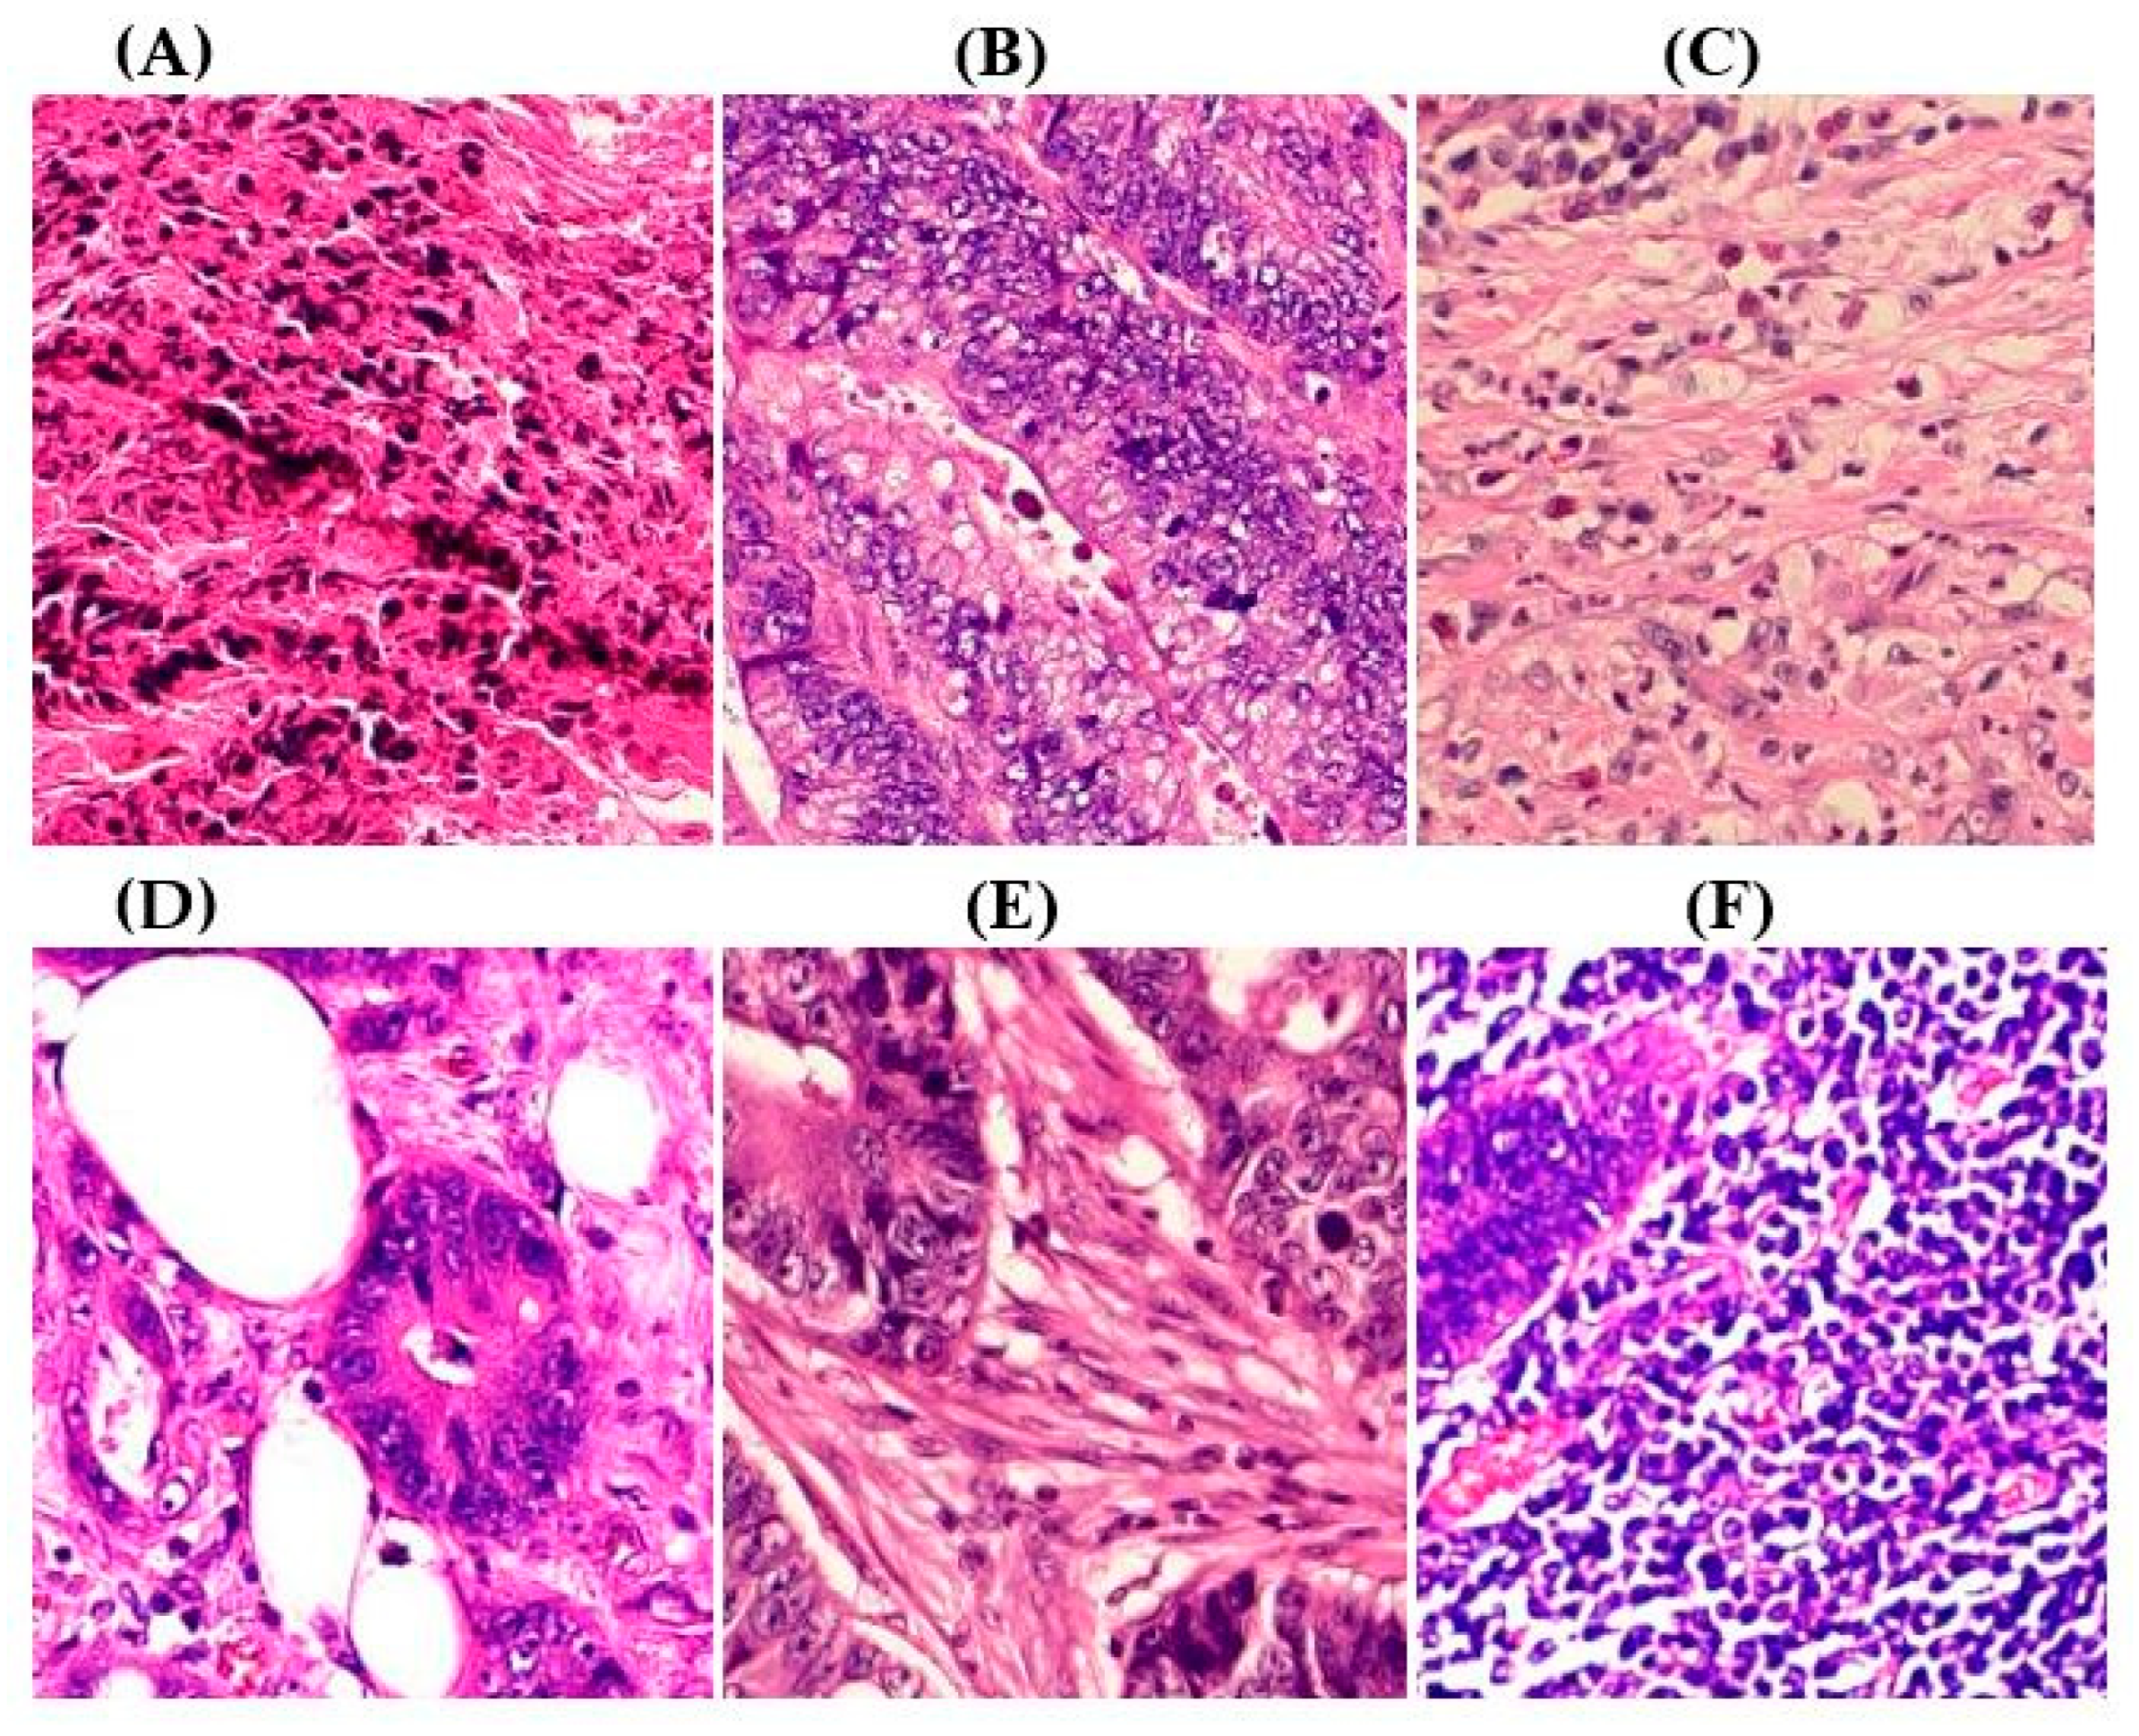
2.2. CRC Histopathological Datasets and Preprocessing
2.3. Performance Metrics
2.4. Model Interpretability
3. Results
3.1. Experimental Setup
3.2. Performance Comparison of Baseline Versus ADFMs
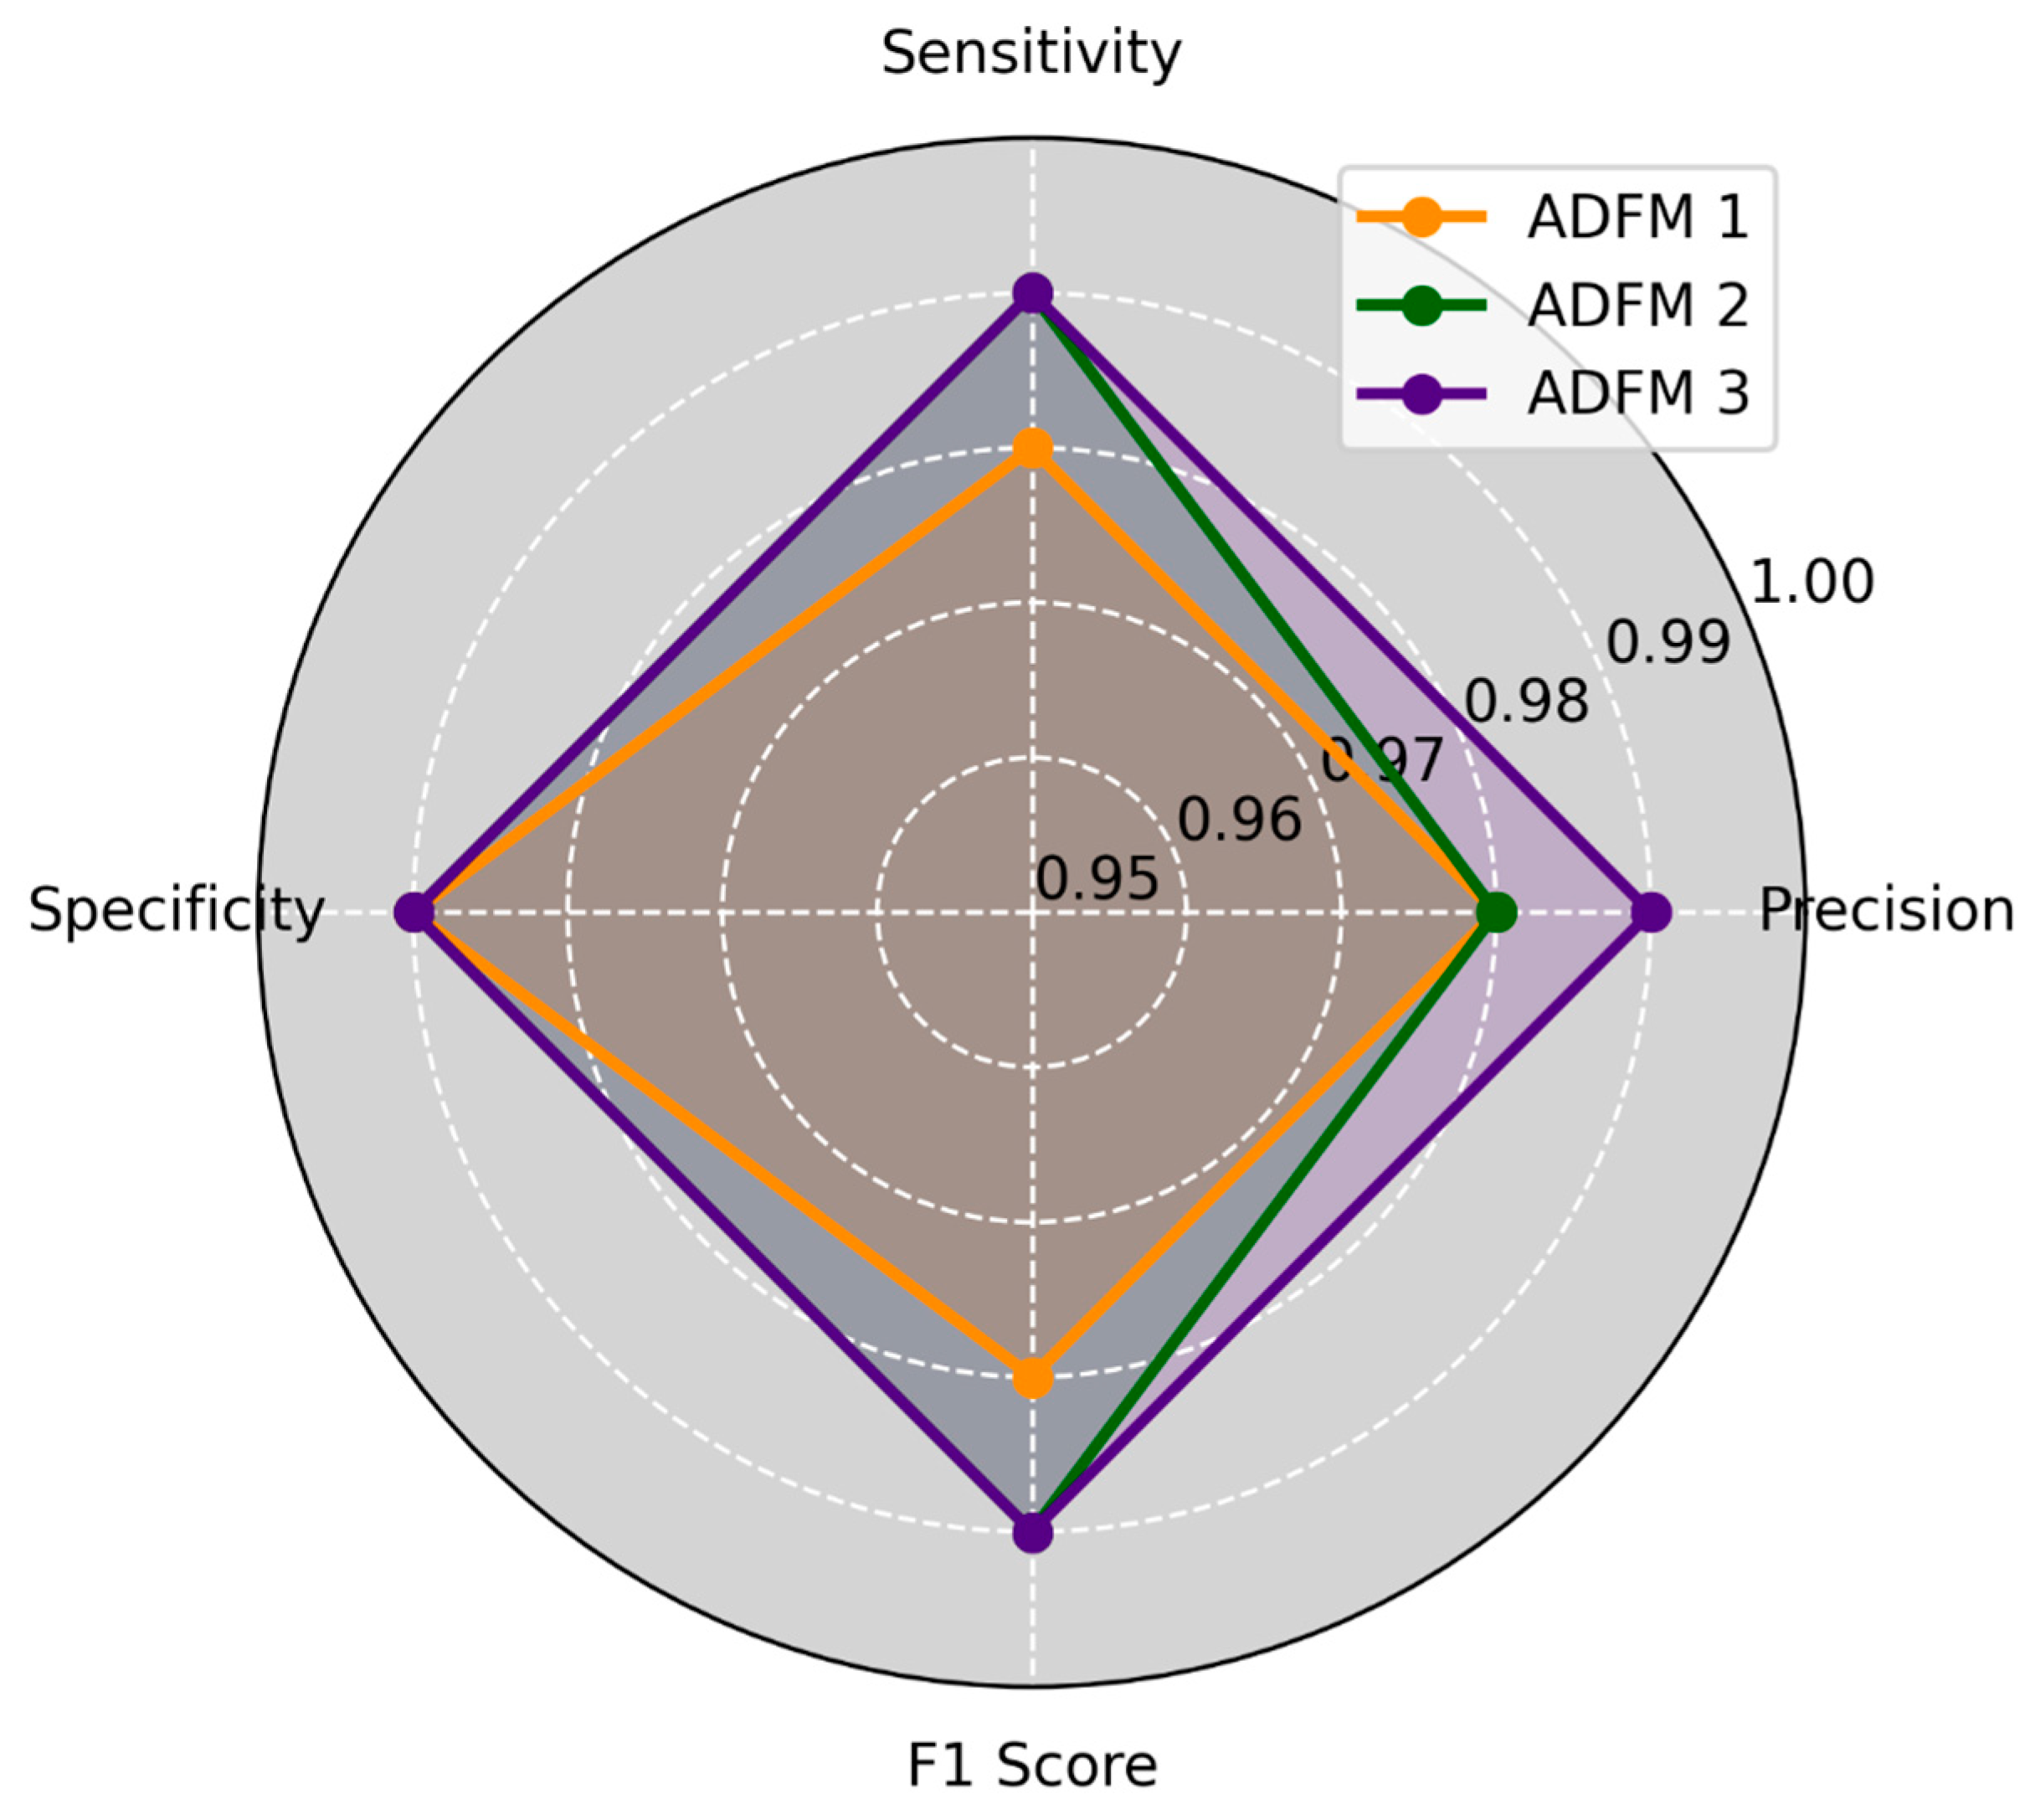
3.3. Proposed Model Performance Metrics by Class Across Six Datasets
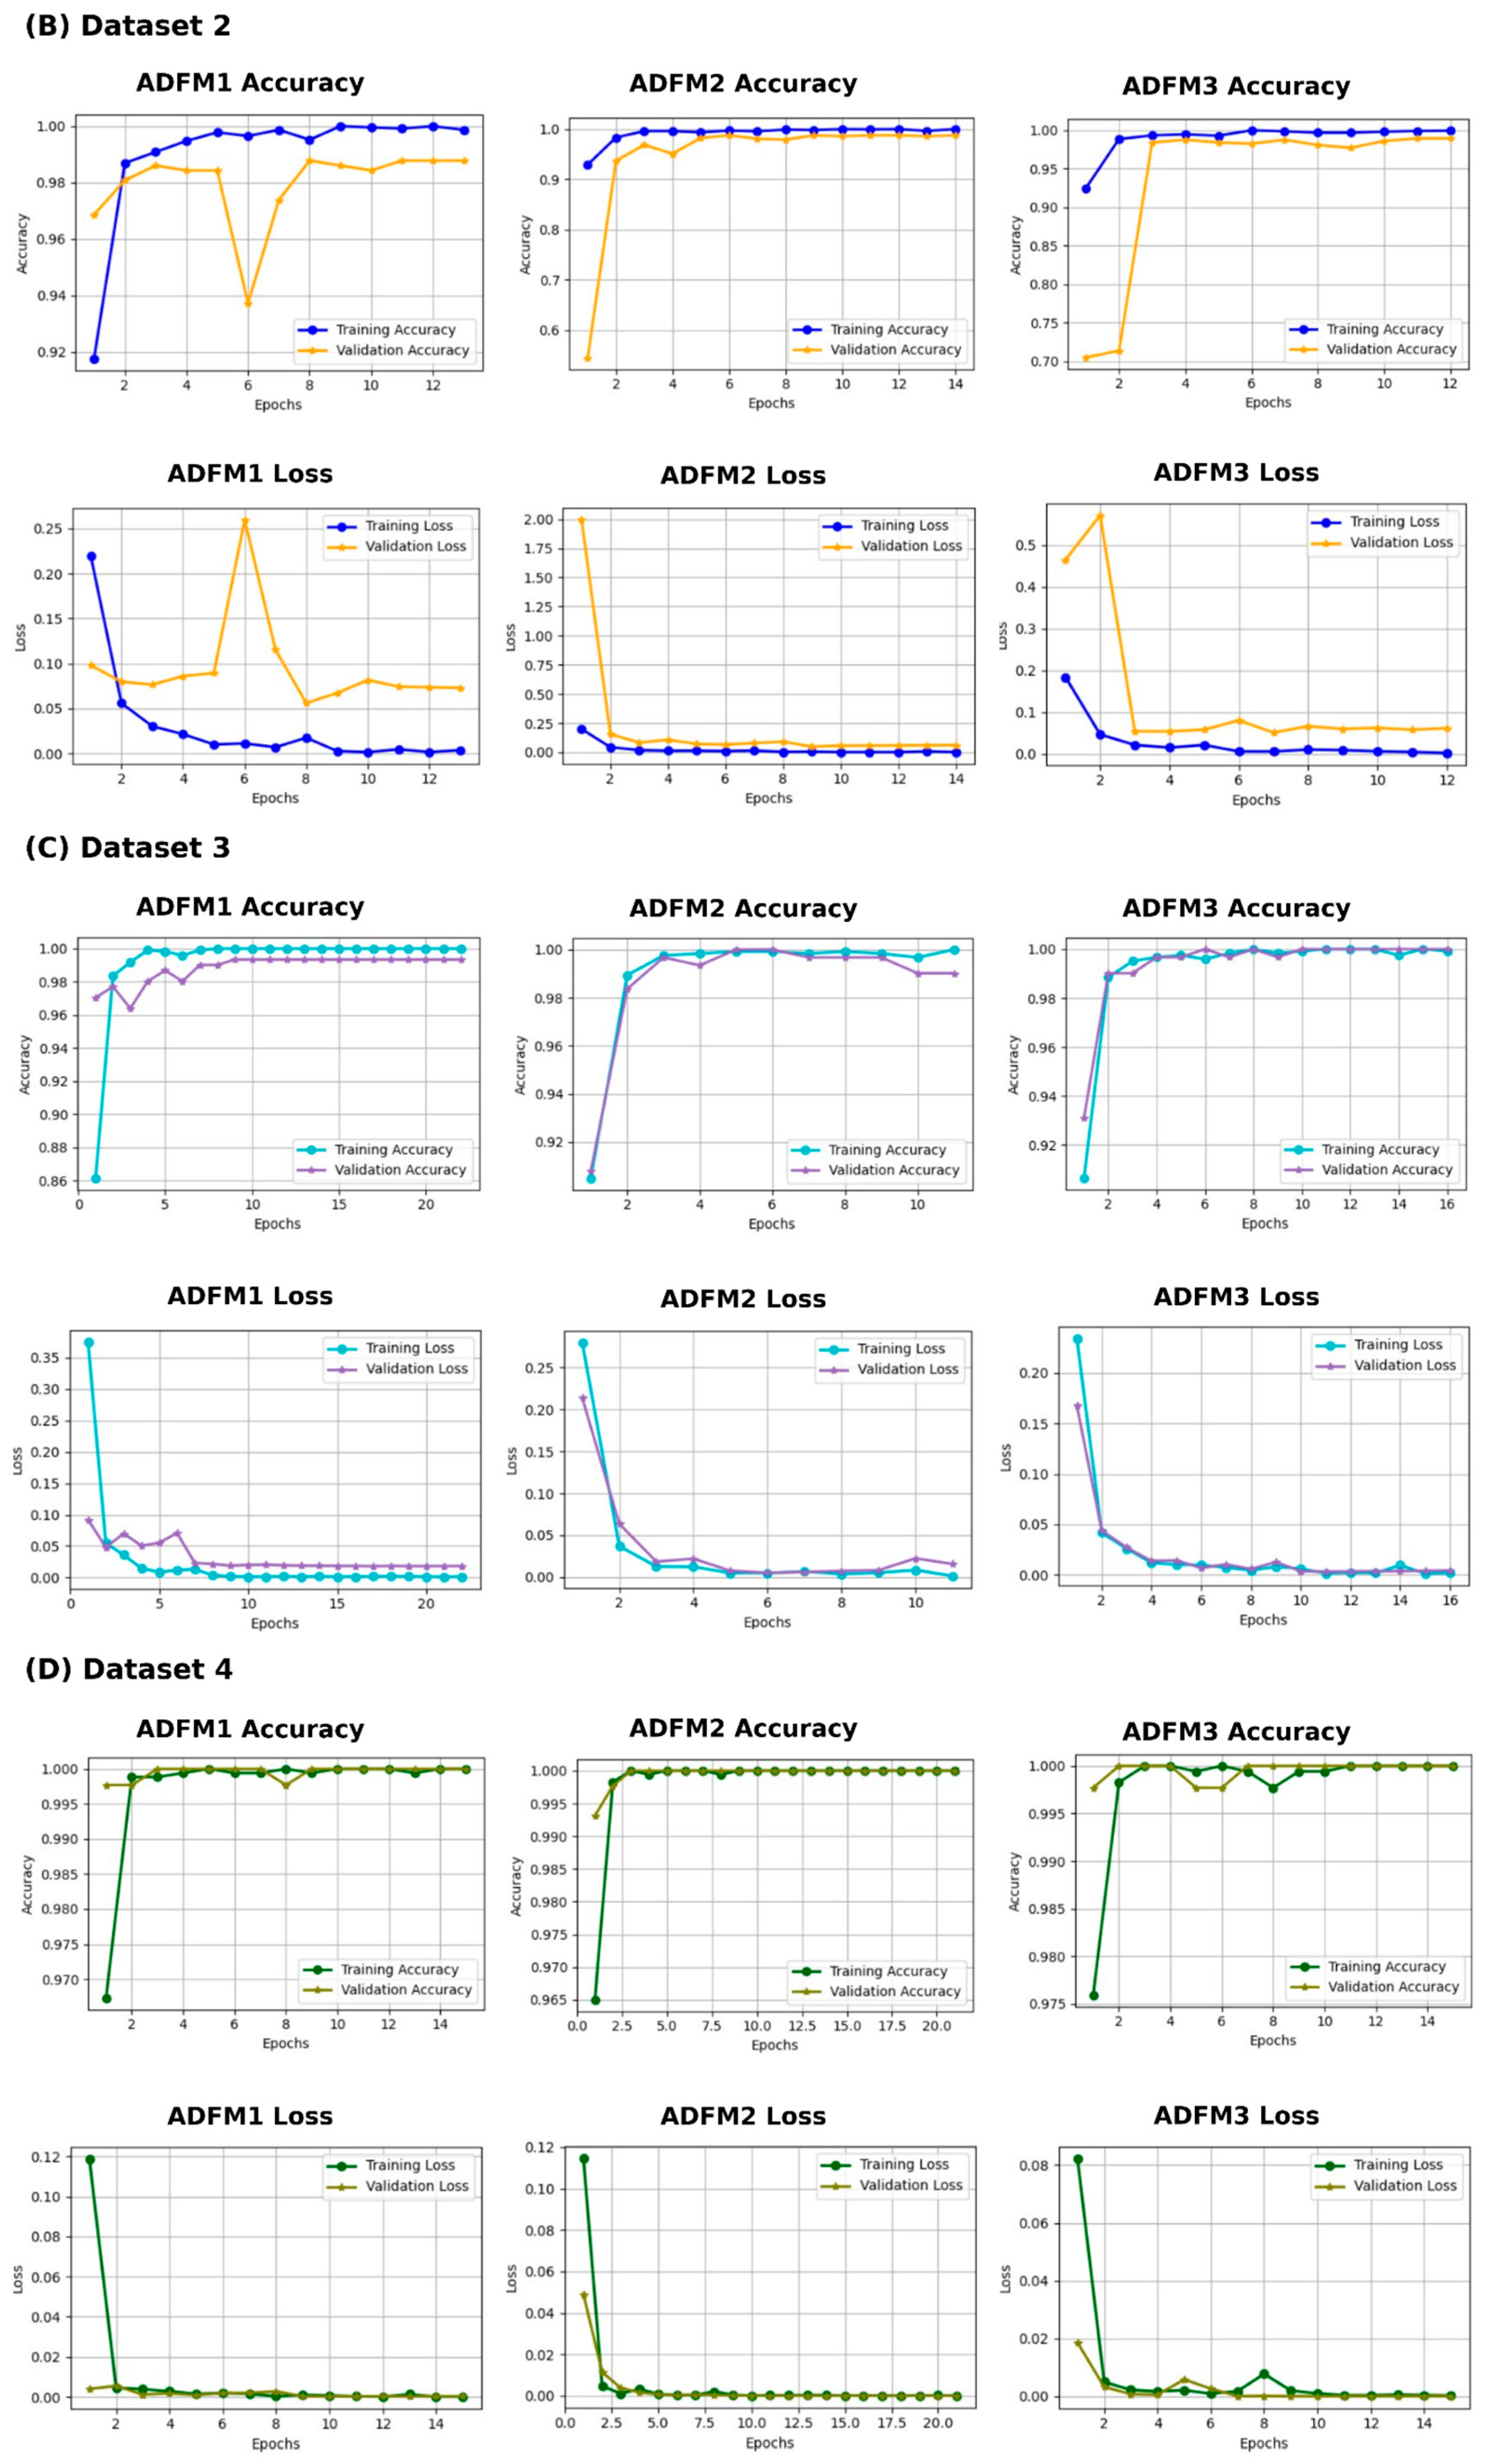
3.4. Experimental Results
3.5. K-Fold Cross-Validation for ADFMs
3.6. Visualizing Interpretability in CRC Classification Using ADFMs
4. Discussion
Author Contributions
Funding
Institutional Review Board Statement
Informed Consent Statement
Data Availability Statement
Acknowledgments
Conflicts of Interest
Abbreviations
| ILSVRC | ImageNet Large Scale Visual Recognition Competition |
| CNN | Convolutional Neural Network |
| CRC | Colorectal Cancer |
| Grade-CAM | Gradient-Weighted Class Activation Mapping |
| ADFM | Attention Decision Fusion Models |
References
- LeCun, Y.; Bengio, Y.; Hinton, G. Deep Learning. Nature 2015, 521, 436–444. [Google Scholar] [CrossRef]
- Krizhevsky, A.; Sutskever, I.; Hinton, G.E. ImageNet Classification with Deep Convolutional Neural Networks. Commun. ACM 2017, 60, 84–90. [Google Scholar] [CrossRef]
- Lecun, Y.; Bottou, L.; Bengio, Y.; Haffner, P. Gradient-Based Learning Applied to Document Recognition. Proc. IEEE 1998, 86, 2278–2324. [Google Scholar] [CrossRef]
- Simonyan, K.; Zisserman, A. Very Deep Convolutional Networks for Large-Scale Image Recognition. arXiv 2014. [Google Scholar] [CrossRef]
- Szegedy, C.; Liu, W.; Jia, Y.; Sermanet, P.; Reed, S.; Anguelov, D.; Erhan, D.; Vanhoucke, V.; Rabinovich, A. Going Deeper with Convolutions. In Proceedings of the 2015 IEEE Conference on Computer Vision and Pattern Recognition (CVPR), Boston, MA, USA, 7–12 June 2015; pp. 1–9. [Google Scholar]
- Chollet, F. Xception: Deep Learning with Depthwise Separable Convolutions. In Proceedings of the 2017 IEEE Conference on Computer Vision and Pattern Recognition (CVPR), Honolulu, HI, USA, 21–26 July 2017; pp. 1800–1807. [Google Scholar]
- He, K.; Zhang, X.; Ren, S.; Sun, J. Deep Residual Learning for Image Recognition. In Proceedings of the 2016 IEEE Conference on Computer Vision and Pattern Recognition (CVPR), Las Vegas, NV, USA, 27–30 June 2016; pp. 770–778. [Google Scholar]
- Howard, A.G.; Zhu, M.; Chen, B.; Kalenichenko, D.; Wang, W.; Weyand, T.; Andreetto, M.; Adam, H. MobileNets: Efficient Convolutional Neural Networks for Mobile Vision Applications. arXiv 2017. [Google Scholar] [CrossRef]
- Arora, R.; Sharma, S.; Kumar, B. Colorectal Cancer: Risk Factors and Potential of Dietary Probiotics in Its Prevention. Proc. Indian Natl. Sci. Acad. 2022, 88, 528–541. [Google Scholar] [CrossRef]
- Chodoff, A.; Smith, K.C.; Shukla, A.; Blackford, A.L.; Ahuja, N.; Johnston, F.M.; Peairs, K.S.; Ngaiza, J.R.; Warczynski, T.; Nettles, B.; et al. Colorectal Cancer Survivorship Care Plans: Variations in Documentation and Posttreatment Surveillance Recommendations. J. Surg. Oncol. 2022, 125, 678–691. [Google Scholar] [CrossRef]
- Xi, Y.; Xu, P. Global Colorectal Cancer Burden in 2020 and Projections to 2040. Transl. Oncol. 2021, 14, 101174. [Google Scholar] [CrossRef]
- Pataki, B.Á.; Olar, A.; Ribli, D.; Pesti, A.; Kontsek, E.; Gyöngyösi, B.; Bilecz, Á.; Kovács, T.; Kovács, K.A.; Kramer, Z.; et al. HunCRC: Annotated Pathological Slides to Enhance Deep Learning Applications in Colorectal Cancer Screening. Sci. Data 2022, 9, 370. [Google Scholar] [CrossRef]
- Hossain, M.S.; Karuniawati, H.; Jairoun, A.A.; Urbi, Z.; Ooi, D.J.; John, A.; Lim, Y.C.; Kibria, K.M.K.; Mohiuddin, A.K.M.; Ming, L.C.; et al. Colorectal Cancer: A Review of Carcinogenesis, Global Epidemiology, Current Challenges, Risk Factors, Preventive and Treatment Strategies. Cancers 2022, 14, 1732. [Google Scholar] [CrossRef]
- Chen, H.; Li, C.; Li, X.; Rahaman, M.M.; Hu, W.; Li, Y.; Liu, W.; Sun, C.; Sun, H.; Huang, X.; et al. IL-MCAM: An Interactive Learning and Multi-Channel Attention Mechanism-Based Weakly Supervised Colorectal Histopathology Image Classification Approach. Comput. Biol. Med. 2022, 143, 105265. [Google Scholar] [CrossRef]
- Ai, S.; Li, C.; Li, X.; Jiang, T.; Grzegorzek, M.; Sun, C.; Rahaman, M.M.; Zhang, J.; Yao, Y.; Li, H. A State-of-the-Art Review for Gastric Histopathology Image Analysis Approaches and Future Development. BioMed Res. Int. 2021, 2021, 6671417. [Google Scholar] [CrossRef] [PubMed]
- De Matos, J.; Ataky, S.; De Souza Britto, A.; Soares De Oliveira, L.; Lameiras Koerich, A. Machine Learning Methods for Histopathological Image Analysis: A Review. Electronics 2021, 10, 562. [Google Scholar] [CrossRef]
- Jansen-Winkeln, B.; Barberio, M.; Chalopin, C.; Schierle, K.; Diana, M.; Köhler, H.; Gockel, I.; Maktabi, M. Feedforward Artificial Neural Network-Based Colorectal Cancer Detection Using Hyperspectral Imaging: A Step towards Automatic Optical Biopsy. Cancers 2021, 13, 967. [Google Scholar] [CrossRef] [PubMed]
- Kumar, N.; Gupta, R.; Gupta, S. Whole Slide Imaging (WSI) in Pathology: Current Perspectives and Future Directions. J. Digit. Imaging 2020, 33, 1034–1040. [Google Scholar] [CrossRef]
- Pacal, I.; Karaboga, D.; Basturk, A.; Akay, B.; Nalbantoglu, U. A Comprehensive Review of Deep Learning in Colon Cancer. Comput. Biol. Med. 2020, 126, 104003. [Google Scholar] [CrossRef]
- Cai, L.; Gao, J.; Zhao, D. A Review of the Application of Deep Learning in Medical Image Classification and Segmentation. Ann. Transl. Med. 2020, 8, 713. [Google Scholar] [CrossRef]
- Atasever, S.; Azginoglu, N.; Terzi, D.S.; Terzi, R. A Comprehensive Survey of Deep Learning Research on Medical Image Analysis with Focus on Transfer Learning. Clin. Imaging 2023, 94, 18–41. [Google Scholar] [CrossRef]
- Goncalves, T.; Rio-Torto, I.; Teixeira, L.F.; Cardoso, J.S. A Survey on Attention Mechanisms for Medical Applications: Are We Moving Toward Better Algorithms? IEEE Access 2022, 10, 98909–98935. [Google Scholar] [CrossRef]
- Pan, S.J.; Yang, Q. A Survey on Transfer Learning. IEEE Trans. Knowl. Data Eng. 2010, 22, 1345–1359. [Google Scholar] [CrossRef]
- Zhou, P.; Cao, Y.; Li, M.; Ma, Y.; Chen, C.; Gan, X.; Wu, J.; Lv, X.; Chen, C. HCCANet: Histopathological Image Grading of Colorectal Cancer Using CNN Based on Multichannel Fusion Attention Mechanism. Sci. Rep. 2022, 12, 15103. [Google Scholar] [CrossRef]
- Sung, H.; Ferlay, J.; Siegel, R.L.; Laversanne, M.; Soerjomataram, I.; Jemal, A.; Bray, F. Global Cancer Statistics 2020: GLOBOCAN Estimates of Incidence and Mortality Worldwide for 36 Cancers in 185 Countries. CA Cancer J. Clin. 2021, 71, 209–249. [Google Scholar] [CrossRef] [PubMed]
- Dif, N.; Elberrichi, Z. A New Deep Learning Model Selection Method for Colorectal Cancer Classification. Int. J. Swarm Intell. Res. 2020, 11, 72–88. [Google Scholar] [CrossRef]
- Kather, J.N.; Krisam, J.; Charoentong, P.; Luedde, T.; Herpel, E.; Weis, C.-A.; Gaiser, T.; Marx, A.; Valous, N.A.; Ferber, D.; et al. Predicting Survival from Colorectal Cancer Histology Slides Using Deep Learning: A Retrospective Multicenter Study. PLoS Med. 2019, 16, e1002730. [Google Scholar] [CrossRef] [PubMed]
- Zhou, S.K.; Greenspan, H.; Davatzikos, C.; Duncan, J.S.; Van Ginneken, B.; Madabhushi, A.; Prince, J.L.; Rueckert, D.; Summers, R.M. A Review of Deep Learning in Medical Imaging: Imaging Traits, Technology Trends, Case Studies With Progress Highlights, and Future Promises. Proc. IEEE 2021, 109, 820–838. [Google Scholar] [CrossRef]
- Vrbancic, G.; Podgorelec, V. Transfer Learning with Adaptive Fine-Tuning. IEEE Access 2020, 8, 196197–196211. [Google Scholar] [CrossRef]
- Naga Raju, M.S.; Rao, B.S. Colorectal Multi-Class Image Classification Using Deep Learning Models. Bull. EEI 2022, 11, 195–200. [Google Scholar] [CrossRef]
- Sarwinda, D.; Paradisa, R.H.; Bustamam, A.; Anggia, P. Deep Learning in Image Classification Using Residual Network (ResNet) Variants for Detection of Colorectal Cancer. Procedia Comput. Sci. 2021, 179, 423–431. [Google Scholar] [CrossRef]
- Yildirim, M.; Cinar, A. Classification with Respect to Colon Adenocarcinoma and Colon Benign Tissue of Colon Histopathological Images with a New CNN Model: MA_ColonNET. Int. J. Imaging Syst. Technol. 2022, 32, 155–162. [Google Scholar] [CrossRef]
- Masud, M.; Sikder, N.; Nahid, A.-A.; Bairagi, A.K.; AlZain, M.A. A Machine Learning Approach to Diagnosing Lung and Colon Cancer Using a Deep Learning-Based Classification Framework. Sensors 2021, 21, 748. [Google Scholar] [CrossRef]
- Sakr, A.S.; Soliman, N.F.; Al-Gaashani, M.S.; Pławiak, P.; Ateya, A.A.; Hammad, M. An Efficient Deep Learning Approach for Colon Cancer Detection. Appl. Sci. 2022, 12, 8450. [Google Scholar] [CrossRef]
- Xu, L.; Walker, B.; Liang, P.-I.; Tong, Y.; Xu, C.; Su, Y.C.; Karsan, A. Colorectal Cancer Detection Based on Deep Learning. J. Pathol. Inform. 2020, 11, 28. [Google Scholar] [CrossRef]
- Tsai, M.-J.; Tao, Y.-H. Deep Learning Techniques for the Classification of Colorectal Cancer Tissue. Electronics 2021, 10, 1662. [Google Scholar] [CrossRef]
- Vidyun, A.S.; Srinivasa Rao, B.; Harikiran, J. Histopathological Image Classification Using Deep Neural Networks with Fine-Tuning. In Data Engineering and Intelligent Computing; Bhateja, V., Satapathy, S.C., Travieso-González, C.M., Aradhya, V.N.M., Eds.; Springer: Singapore, 2021; Volume 1407, pp. 173–180. ISBN 9789811601705. [Google Scholar]
- Sun, K.; Chen, Y.; Bai, B.; Gao, Y.; Xiao, J.; Yu, G. Automatic Classification of Histopathology Images across Multiple Cancers Based on Heterogeneous Transfer Learning. Diagnostics 2023, 13, 1277. [Google Scholar] [CrossRef]
- Karabulut, İ.; Selen, R.; Yağanoğlu, M.; Özmen, S. Recognition of Colon Polyps (Tubular Adenoma, Villous Adenoma) and Normal Colon Epithelium Histomorphology with Transfer Learning. Eurasian J. Med. 2024, 56, 35–41. [Google Scholar] [CrossRef]
- Ilhan, H.O.; Serbes, G.; Aydin, N. Decision and Feature Level Fusion of Deep Features Extracted from Public COVID-19 Data-Sets. Appl. Intell. 2022, 52, 8551–8571. [Google Scholar] [CrossRef] [PubMed]
- Ali, I.; Muzammil, M.; Haq, I.U.; Amir, M.; Abdullah, S. Deep Feature Selection and Decision Level Fusion for Lungs Nodule Classification. IEEE Access 2021, 9, 18962–18973. [Google Scholar] [CrossRef]
- Khayyat, M.M.; Elrefaei, L.A. Manuscripts Image Retrieval Using Deep Learning Incorporating a Variety of Fusion Levels. IEEE Access 2020, 8, 136460–136486. [Google Scholar] [CrossRef]
- El-Ghandour, M.; Obayya, M.; Yousif, B. Breast Cancer Histopathology Image Classification Using an Ensemble of Optimized Pretrained Models with a Trainable Ensemble Strategy Classifier. Res. Biomed. Eng. 2024, 40, 707–729. [Google Scholar] [CrossRef]
- Deng, J.; Dong, W.; Socher, R.; Li, L.-J.; Li, K.; Fei-Fei, L. ImageNet: A Large-Scale Hierarchical Image Database. In Proceedings of the 2009 IEEE Conference on Computer Vision and Pattern Recognition, Miami, FL, USA, 20–25 June 2009; pp. 248–255. [Google Scholar]
- Kavitha, M.S.; Gangadaran, P.; Jackson, A.; Venmathi Maran, B.A.; Kurita, T.; Ahn, B.-C. Deep Neural Network Models for Colon Cancer Screening. Cancers 2022, 14, 3707. [Google Scholar] [CrossRef]
- Kandel, I.; Castelli, M. How Deeply to Fine-Tune a Convolutional Neural Network: A Case Study Using a Histopathology Dataset. Appl. Sci. 2020, 10, 3359. [Google Scholar] [CrossRef]
- Li, J.; Wang, P.; Zhou, Y.; Liang, H.; Lu, Y.; Luan, K. A Novel Classification Method of Lymph Node Metastasis in Colorectal Cancer. Bioengineered 2021, 12, 2007–2021. [Google Scholar] [CrossRef] [PubMed]
- Ohata, E.F.; Chagas, J.V.S.D.; Bezerra, G.M.; Hassan, M.M.; De Albuquerque, V.H.C.; Filho, P.P.R. A Novel Transfer Learning Approach for the Classification of Histological Images of Colorectal Cancer. J. Supercomput. 2021, 77, 9494–9519. [Google Scholar] [CrossRef]
- Szegedy, C.; Vanhoucke, V.; Ioffe, S.; Shlens, J.; Wojna, Z. Rethinking the Inception Architecture for Computer Vision. In Proceedings of the 2016 IEEE Conference on Computer Vision and Pattern Recognition (CVPR), Las Vegas, NV, USA, 27–30 June 2016; pp. 2818–2826. [Google Scholar]
- Bankhead, P.; Loughrey, M.B.; Fernández, J.A.; Dombrowski, Y.; McArt, D.G.; Dunne, P.D.; McQuaid, S.; Gray, R.T.; Murray, L.J.; Coleman, H.G.; et al. QuPath: Open Source Software for Digital Pathology Image Analysis. Sci. Rep. 2017, 7, 16878. [Google Scholar] [CrossRef] [PubMed]
- Selvaraju, R.R.; Cogswell, M.; Das, A.; Vedantam, R.; Parikh, D.; Batra, D. Grad-CAM: Visual Explanations from Deep Networks via Gradient-Based Localization. In Proceedings of the 2017 IEEE International Conference on Computer Vision (ICCV), Venice, Italy, 22–29 October 2017; pp. 618–626. [Google Scholar]
- Shovon, M.S.H.; Islam, M.J.; Nabil, M.N.A.K.; Molla, M.M.; Jony, A.I.; Mridha, M.F. Strategies for Enhancing the Multi-Stage Classification Performances of HER2 Breast Cancer from Hematoxylin and Eosin Images. Diagnostics 2022, 12, 2825. [Google Scholar] [CrossRef]
- Dabass, M.; Vashisth, S.; Vig, R. A Convolution Neural Network with Multi-Level Convolutional and Attention Learning for Classification of Cancer Grades and Tissue Structures in Colon Histopathological Images. Comput. Biol. Med. 2022, 147, 105680. [Google Scholar] [CrossRef]
- Sevilla, J.; Heim, L.; Ho, A.; Besiroglu, T.; Hobbhahn, M.; Villalobos, P. Compute Trends Across Three Eras of Machine Learning. In Proceedings of the 2022 IEEE International Joint Conference on Neural Networks (IJCNN), Padua, Italy, 18–23 July 2022; pp. 1–8. [Google Scholar]
- Steiner, B.; Elhoushi, M.; Kahn, J.; Hegarty, J. MODeL: Memory Optimizations for Deep Learning. In Proceedings of the Proceedings of the 40th International Conference on Machine Learning, PMLR, Honolulu, HI, USA, 23–29 July 2023; pp. 32618–32632. [Google Scholar]


|
| Class/Dataset | Dataset 1 | Dataset 3 | Dataset 5 |
|---|---|---|---|
| Mucosa | 1480 | 1035 | 1200 |
| Debris | 1030 | 339 | 678 |
| Stroma | 1119 | 421 | 842 |
| Class/Dataset | Dataset 2 | Dataset 4 | Dataset 6 |
| Adipose | 1014 | 1338 | 1000 |
| Muscle | 1239 | 592 | 1184 |
| Lymph | 1118 | 634 | 1268 |
| Dataset | InceptionV3 (%) | Xception (%) | MobileNet (%) | Baseline Avg (%) | ADFM Avg (%) |
|---|---|---|---|---|---|
| Dataset 1 | 97.06 | 97.61 | 98.89 | 97.85 | 99.08 |
| Dataset 2 | 97.82 | 97.23 | 98.41 | 97.82 | 99.33 |
| Dataset 3 | 96.29 | 93.70 | 97.77 | 95.92 | 99.13 |
| Dataset 4 | 100.0 | 99.74 | 99.48 | 99.74 | 100.00 |
| Dataset 5 | 96.07 | 95.83 | 97.54 | 96.48 | 99.18 |
| Dataset 6 | 97.49 | 98.06 | 97.49 | 97.68 | 99.55 |
| Hyperparameter | Value |
|---|---|
| Input image shape | (224, 224, 3) |
| Initial learning rate | 10−4 |
| Number of epochs | 50 |
| Batch size | 32 |
| Dropout rate | 0.5 |
| Optimizer | Adam |
| Loss function | Categorical Cross-Entropy |
| Fine-tuning | Enabled (Top layers unfrozen) |
| Number of top layers | 20 (Top layers unfrozen for fine-tuning) |
| Learning rate scheduler | Epoch < 10: No change; Epoch ≥ 10: The learning rate is reduced by a factor of 10 every ten epochs, with a minimum value set to 1 × 10⁻⁶ |
| Early stopping | Monitor validation loss, patience: 10 epochs, restore best weights: yes |
| Metrics (AVG) | ADFM1 | ADFM2 | ADFM3 |
|---|---|---|---|
| Validation Accuracy | 99.36 | 99.54 | 99.53 |
| Test Accuracy | 98.91 | 99.13 | 99.33 |
| Validation Loss | 0.019 | 0.012 | 0.011 |
| Test Loss | 0.024 | 0.027 | 0.018 |
| MCC | 98.29 | 98.61 | 98.95 |
| Kappa | 98.27 | 98.64 | 98.98 |
| Miss-classified Samples | 4.66 | 3.33 | 2.66 |
| Miss Classification Rate | 1.08 | 0.86 | 0.65 |
| Early Stopping (Epoch) | 15.33 | 12.66 | 13.66 |
| Duration per Epoch (Seconds) | 21.66 | 11.83 | 10 |
| Metrics (AVG) | ADFM1 | ADFM2 | ADFM3 |
|---|---|---|---|
| Validation Accuracy | 99.53 | 99.42 | 99.53 |
| Test Accuracy | 99.6 | 99.66 | 99.6 |
| Validation Loss | 0.0267 | 0.0253 | 0.0243 |
| Test Loss | 0.0154 | 0.0073 | 0.0094 |
| MCC | 99.41 | 99.5 | 99.41 |
| Kappa | 99.41 | 99.5 | 99.41 |
| Miss classified Samples | 2 | 1.66 | 2 |
| Miss classification Rate | 0.39 | 0.32 | 0.39 |
| Early Stopping (Epoch) | 26 | 16 | 13.33 |
| Duration per Epoch (Seconds) | 16.11 | 19.83 | 20.16 |
| Model | Total Params (M) | Single Image Time (s) | Batch Time (s) | Avg Inference Time per Image (s) | GPU Memory Usage (MB) | RAM Usage (MB) |
|---|---|---|---|---|---|---|
| ADFM1 | 46,879,070 | 0.1626 | 4.2952 | 0.0099 | 888.81 | 10,079.91 |
| ADFM2 | 27,253,502 | 0.1156 | 2.7973 | 0.0064 | 740.19 | 10,925.62 |
| ADFM3 | 28,194,806 | 0.1398 | 3.6582 | 0.0083 | 695.17 | 10,944.34 |
| Dataset 1 | Dataset 2 | ||||||
|---|---|---|---|---|---|---|---|
| Actual\Predicted | Debris | Mucosa | Stroma | Actual\Predicted | Adipose | Lymph | Muscle |
| Debris | 205 | 0.8 | 0.2 | Adipose | 202.0 | 0.4 | 0.4 |
| Mucosa | 0 | 295.2 | 0.8 | Lymph | 0.2 | 220.4 | 3.0 |
| Stroma | 0 | 0.8 | 223 | Muscle | 0.2 | 2.6 | 245.0 |
| Dataset 3 | Dataset 4 | ||||||
| Actual\Predicted | Debris | Mucosa | Stroma | Actual\Predicted | Adipose | Lymph | Muscle |
| Debris | 67.4 | 0.2 | 0.2 | Adipose | 267.6 | 0.0 | 0.0 |
| Mucosa | 0.2 | 206.2 | 0.6 | Lymph | 0.0 | 126.8 | 0.0 |
| Stroma | 0.0 | 0.6 | 83.6 | Muscle | 0.0 | 0.0 | 118.4 |
| Dataset 5 | Dataset 6 | ||||||
| Actual\Predicted | Debris | Mucosa | Stroma | Actual\Predicted | Adipose | Lymph | Muscle |
| Debris | 134.8 | 0.8 | 0.0 | Adipose | 199.8 | 0.2 | 0.0 |
| Mucosa | 0.2 | 238.6 | 1.2 | Lymph | 0.0 | 253.2 | 0.4 |
| Stroma | 0.0 | 0.2 | 168.2 | Muscle | 0.2 | 0.6 | 236.0 |
| Dataset 1 | Dataset 2 | ||||||
|---|---|---|---|---|---|---|---|
| Actual\Predicted | Debris | Mucosa | Stroma | Actual\Predicted | Adipose | Lymph | Muscle |
| Debris | 205.4 | 0.2 | 0.4 | Adipose | 202.0 | 0.2 | 0.6 |
| Mucosa | 0.4 | 295.0 | 0.6 | Lymph | 0.0 | 221.8 | 1.8 |
| Stroma | 0.8 | 2.0 | 221.0 | Muscle | 0.2 | 0.6 | 247.0 |
| Dataset 3 | Dataset 4 | ||||||
| Actual\Predicted | Debris | Mucosa | Stroma | Actual\Predicted | Adipose | Lymph | Muscle |
| Debris | 67.8 | 0.0 | 0.0 | Adipose | 267.6 | 0.0 | 0.0 |
| Mucosa | 0.0 | 206.8 | 0.2 | Lymph | 0.0 | 126.8 | 0.0 |
| Stroma | 0.4 | 0.4 | 83.4 | Muscle | 0.0 | 0.0 | 118.4 |
| Dataset 5 | Dataset 6 | ||||||
| Actual\Predicted | Debris | Mucosa | Stroma | Actual\Predicted | Adipose | Lymph | Muscle |
| Debris | 135.0 | 0.6 | 0.0 | Adipose | 199.4 | 0.2 | 0.4 |
| Mucosa | 0.2 | 239.2 | 0.6 | Lymph | 0.0 | 253.6 | 0.0 |
| Stroma | 0.4 | 0.6 | 167.4 | Muscle | 0.0 | 0.2 | 236.6 |
| Dataset 1 | Dataset 2 | ||||||
|---|---|---|---|---|---|---|---|
| Actual\Predicted | Debris | Mucosa | Stroma | Actual\Predicted | Adipose | Lymph | Muscle |
| Debris | 205.6 | 0.0 | 0.4 | Adipose | 201.8 | 0.0 | 1.0 |
| Mucosa | 0.2 | 295.2 | 0.6 | Lymph | 0.4 | 220.6 | 2.6 |
| Stroma | 0.4 | 1.4 | 222.0 | Muscle | 0.6 | 1.4 | 245.8 |
| Dataset 3 | Dataset 4 | ||||||
| Actual\Predicted | Debris | Mucosa | Stroma | Actual\Predicted | Adipose | Lymph | Muscle |
| Debris | 67.8 | 0.0 | 0.0 | Adipose | 267.6 | 0.0 | 0.0 |
| Mucosa | 0.0 | 206.8 | 0.2 | Lymph | 0.0 | 126.8 | 0.0 |
| Stroma | 0.0 | 0.2 | 84.0 | Muscle | 0.0 | 0.0 | 118.4 |
| Dataset 5 | Dataset 6 | ||||||
| Actual\Predicted | Debris | Mucosa | Stroma | Actual\Predicted | Adipose | Lymph | Muscle |
| Debris | 135.0 | 0.4 | 0.2 | Adipose | 199.8 | 0.0 | 0.2 |
| Mucosa | 0.2 | 238.8 | 1.0 | Lymph | 0.2 | 252.0 | 1.4 |
| Stroma | 0.2 | 2.0 | 166.2 | Muscle | 0.2 | 1.0 | 235.6 |
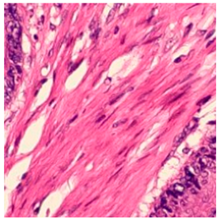
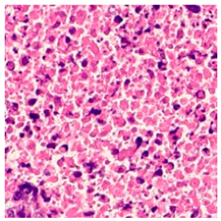
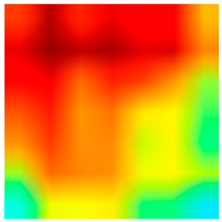
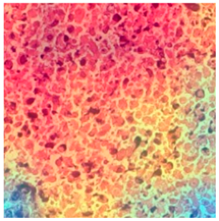
| Tissue Class | Original Image | Heatmaps | Superimposed Image |
|---|---|---|---|
| 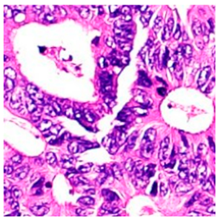 | 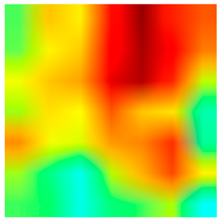 | 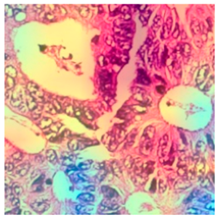 |
|  | 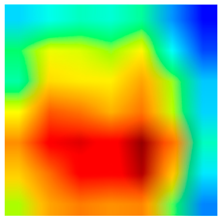 |  |
|  |  |  |
|  |  |  |
| Reference | Method | Dataset | Architecture | Accuracy (%) |
|---|---|---|---|---|
| [24] | Attention mechanism with Transfer Learning | CRC—Private | VGG16 | 87.3 |
| [30] | Transfer Learning | CRC— Public | VGG16, ResNet50, adaptive ResNet152 | 96.16 97.08 98.38 |
| [31] | Transfer Learning | Colon— Public | ResNet50 ResNet18 | 88 85 |
| [32] | Custom CNN | Colon— Public | CNN | 99.75 |
| [33] | Custom CNN | Lung and Colon— Public | CNN | 96.33 |
| [34] | Custom CNN | Lung and Colon—Public | CNN | 56–99.50 |
| [35] | Transfer Learning | CRC—Private | Inception V3 | 95.1 |
| [36] | Transfer Learning | CRC—Public | ResNet50 | 94.86 |
| [37] | Transfer Learning | CRC—Public | VGG19 | 91.2 |
| [38] | Transfer Learning | CRC—Public | ResNet50 | 94.8 |
| [39] | Transfer Learning | Colon—Private | VGG19, DenseNet201, EfficientNetB7 | 94.17 |
| Proposed Models | Spatial attention mechanism and decision fusion with Transfer Learning | CRC—Private CRC—Public | ADFM1 ADFM2 ADFM3 | 98.71–100.00 98.88–100.00 99.25–100.00 |
Disclaimer/Publisher’s Note: The statements, opinions and data contained in all publications are solely those of the individual author(s) and contributor(s) and not of MDPI and/or the editor(s). MDPI and/or the editor(s) disclaim responsibility for any injury to people or property resulting from any ideas, methods, instructions or products referred to in the content. |
© 2025 by the authors. Licensee MDPI, Basel, Switzerland. This article is an open access article distributed under the terms and conditions of the Creative Commons Attribution (CC BY) license (https://creativecommons.org/licenses/by/4.0/).
Share and Cite
ALGhafri, H.S.; Lim, C.S. Transfer Learning Fusion Approaches for Colorectal Cancer Histopathological Image Analysis. J. Imaging 2025, 11, 210. https://doi.org/10.3390/jimaging11070210
ALGhafri HS, Lim CS. Transfer Learning Fusion Approaches for Colorectal Cancer Histopathological Image Analysis. Journal of Imaging. 2025; 11(7):210. https://doi.org/10.3390/jimaging11070210
Chicago/Turabian StyleALGhafri, Houda Saif, and Chia S. Lim. 2025. "Transfer Learning Fusion Approaches for Colorectal Cancer Histopathological Image Analysis" Journal of Imaging 11, no. 7: 210. https://doi.org/10.3390/jimaging11070210
APA StyleALGhafri, H. S., & Lim, C. S. (2025). Transfer Learning Fusion Approaches for Colorectal Cancer Histopathological Image Analysis. Journal of Imaging, 11(7), 210. https://doi.org/10.3390/jimaging11070210