6. Results and Discussion
This section presents and analyzes the results obtained from the different approaches implemented for image detection and classification. We compare methods based on the direct use of images, feature extraction through CNNs, and traditional signal processing techniques, evaluating their performance using relevant metrics. Each subsection details specific experiments and is accompanied by tables summarizing the quantitative outcomes.
The tables include standard classification metrics such as precision, sensitivity, F1 score, and accuracy, along with the absolute counts of true positives, false negatives, false positives, and true negatives for each class. The global accuracy is identical for both classes because it reflects the total proportion of correct classifications across all samples.
6.1. Direct Image-Based Models with OCSVM and CNN
In this section, we present and analyze the performance of different classification models applied directly to raw medical images. The aim is to evaluate the effectiveness of using standard pixel-level input, without handcrafted or deep feature extraction, for distinguishing between healthy and tumorous samples. The results provide insight into the strengths and limitations of traditional classifiers like OCSVM when compared with data-driven models such as CNN.
As shown in
Table 3, OCSVM applied directly to raw images yielded poor performance, particularly in detecting tumorous cases. With a sensitivity of only 47.34% for the tumorous class and a global accuracy of 63.04%, the model struggled to generalize from pixel-level intensities. These results suggest that OCSVM is not well suited to this type of high-dimensional input without prior feature learning or reduction.
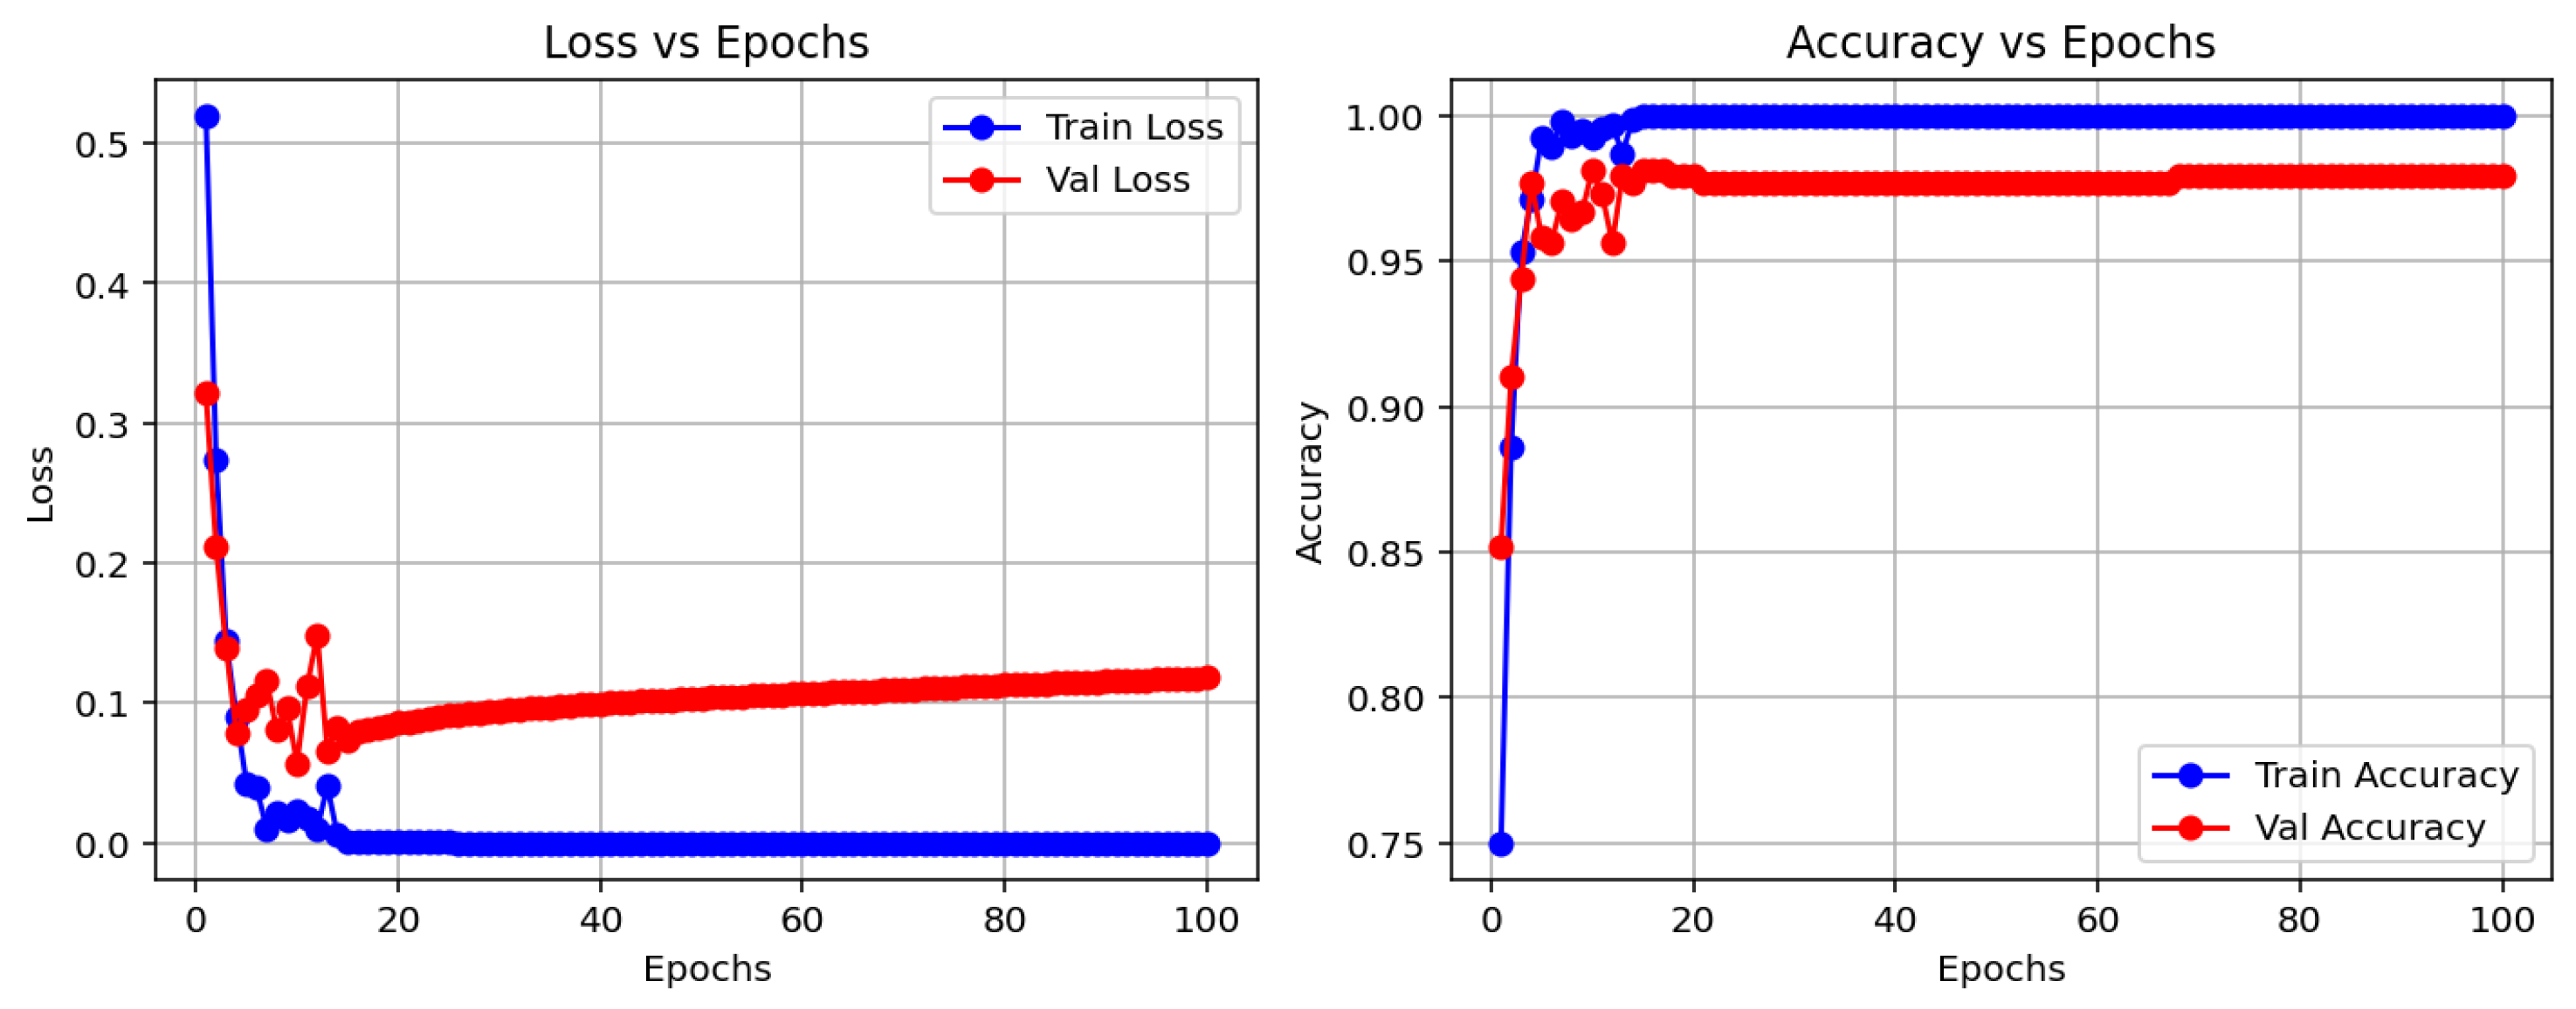
In contrast, the CNN model demonstrated substantially better performance. It achieved an accuracy of 97.83%, with high and balanced precision and recall values across both classes. This confirms the capacity of CNNs to learn complex visual patterns from raw data, making them especially suitable for medical image analysis tasks where spatial features are critical.
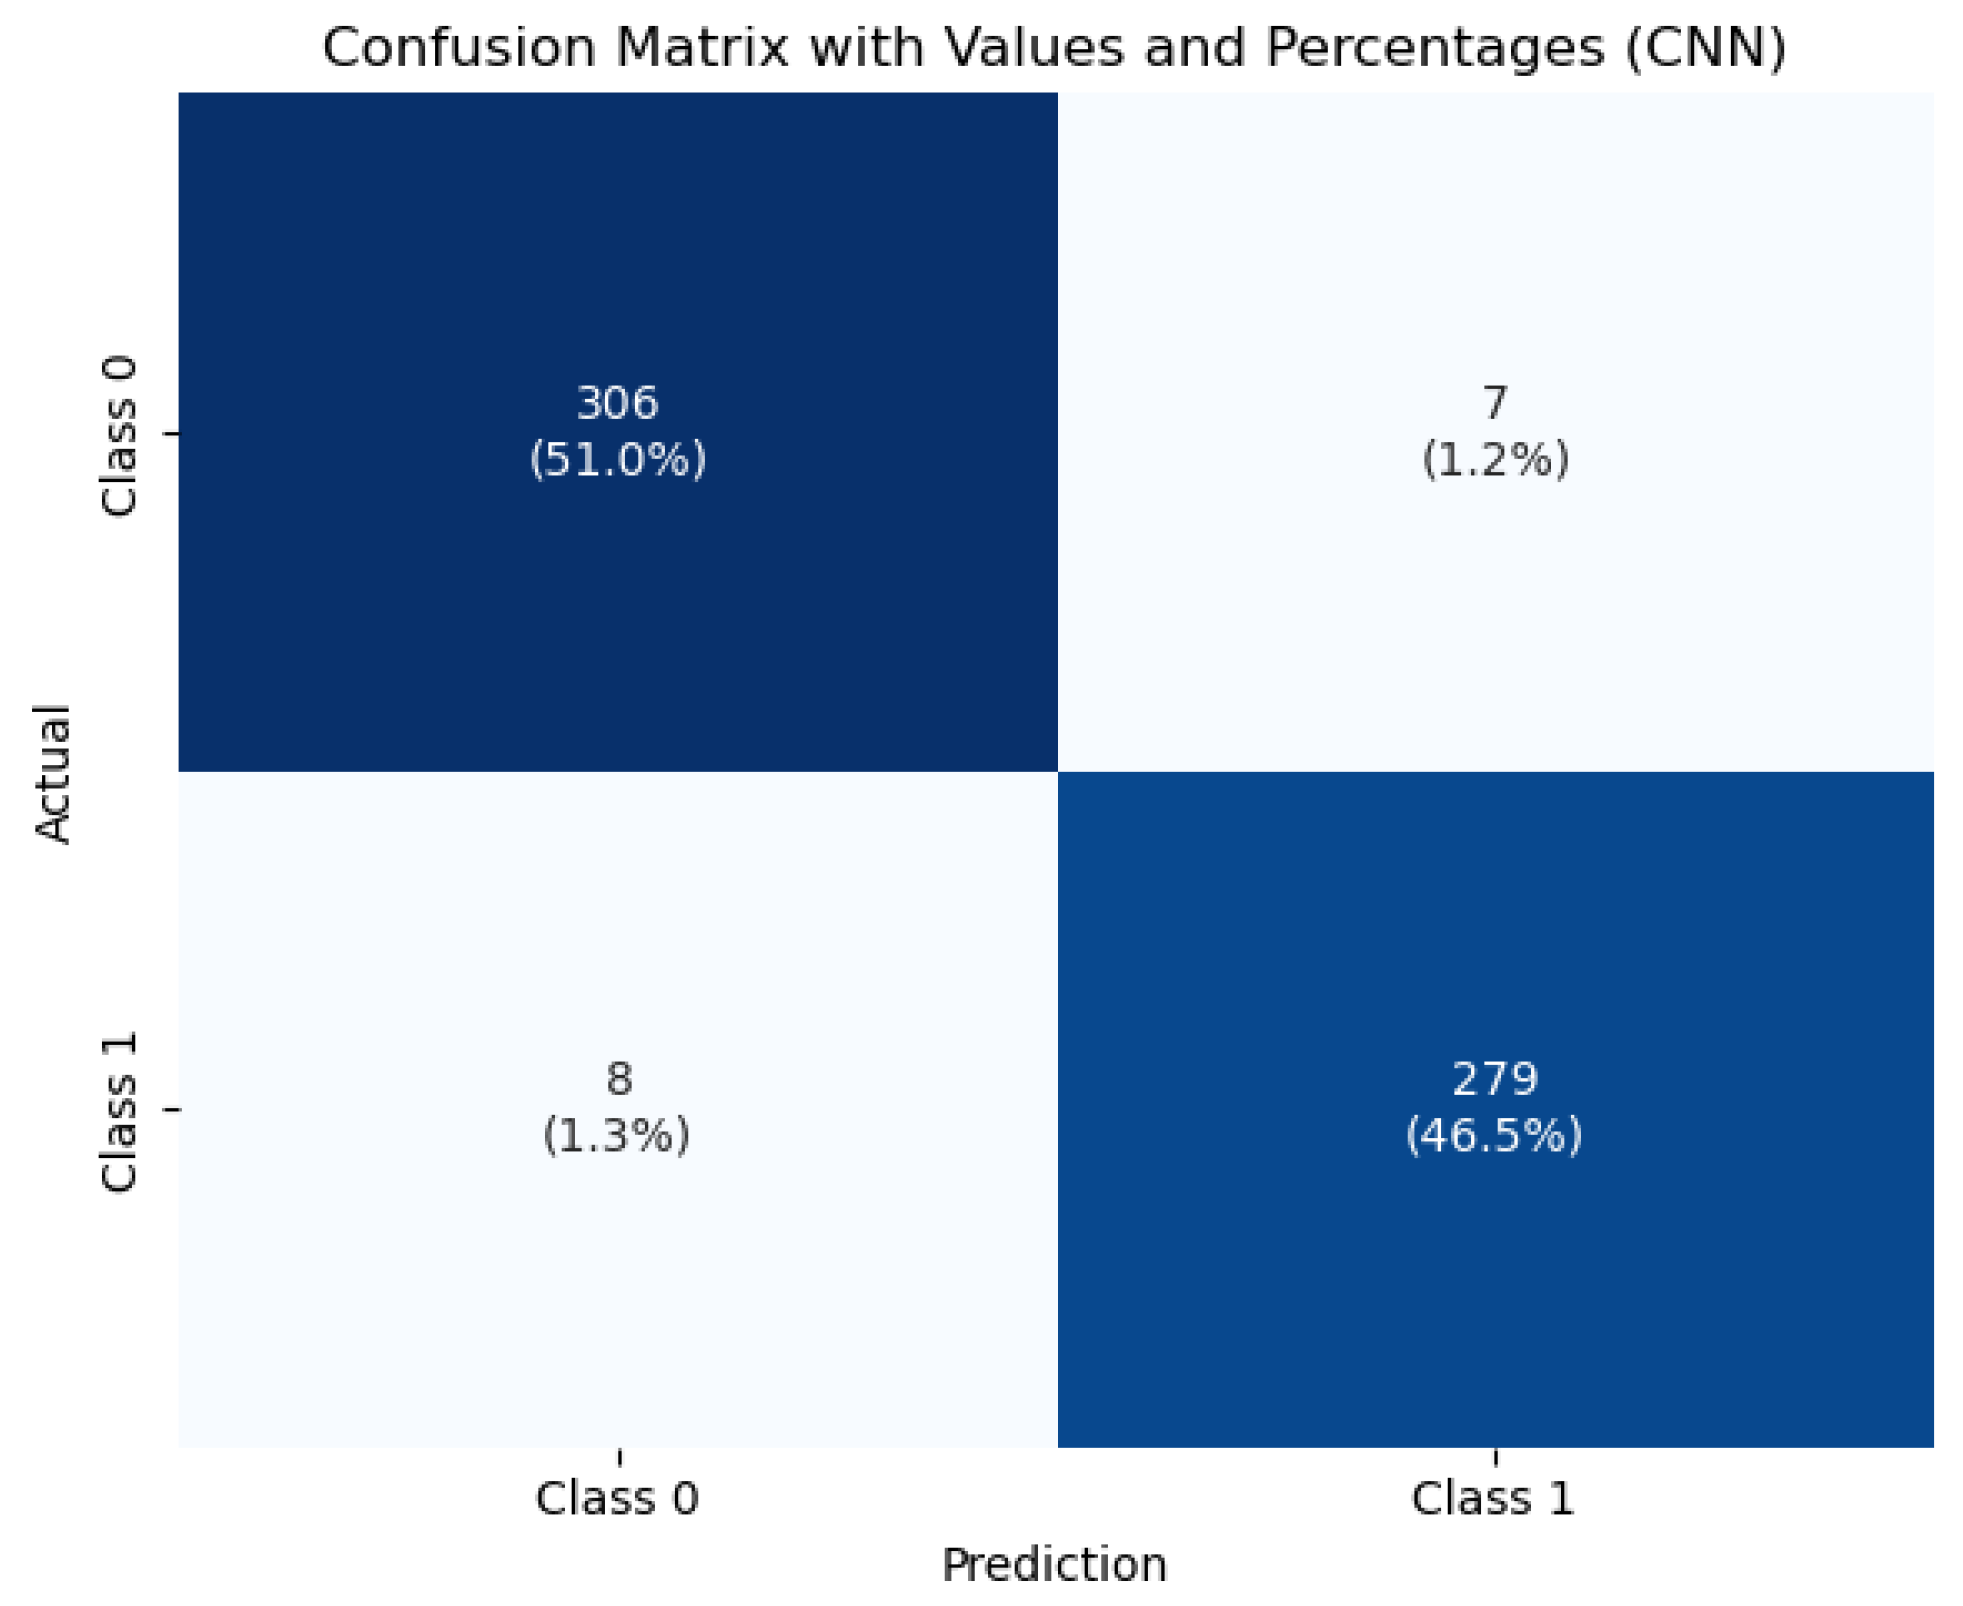
To visualize the classification behavior of the CNN model,
Figure 7 displays the confusion matrix obtained on the test set. The model correctly classified 396 healthy and 279 tumorous cases, with only 15 misclassifications out of 690 total instances. This strong performance—characterized by low false positive and false negative rates—demonstrates the model’s robustness and reliability, which are crucial attributes for clinical diagnostic systems.
These initial results serve as a baseline for evaluating the performance of more advanced architectures and hybrid techniques discussed in the following sections.
6.2. Feature Extraction Using Deep Learning + OCSVM
The performance metrics for the classification of healthy and tumorous cases using various deep learning algorithms are summarized in
Table 4.
All the models achieved high precision and sensitivity values for the healthy class, with DenseNet121 and VGG16 showing the best overall performance, reaching precision values above 91% and sensitivities exceeding 99%. Tumorous class detection was more variable; DenseNet121 and VGG16 also led with precision above 98% and sensitivity close to 90%.
MobileNetV2 demonstrated competitive results with precision and sensitivity above 86% for the tumorous class. The CNN model, used as a baseline, showed lower performance compared with the deep feature extraction models, particularly in the tumorous class sensitivity (68.29%), indicating a higher rate of false negatives.
Overall accuracy values were consistent with the trends in precision and sensitivity, with VGG16 and DenseNet121 achieving the highest accuracies above 94%.
The confusion matrix components (TP, FN, FP, TN) further illustrate the models’ effectiveness in distinguishing between healthy and tumorous samples, confirming the superior discriminative capacity of models like DenseNet121 and VGG16.
6.3. Benchmarking Traditional Feature Extraction with OCSVM
To compare the proposed approach, several classical feature extraction methods combined with OCSVM were evaluated.
Table 5,
Table 6 and
Table 7 show the performance metrics obtained for each method, reporting values for both Healthy and Tumorous classes.
Table 5 presents the performance of two dimensionality reduction methods—Embedded and PCA combined with OCSVM—for classifying healthy and tumorous cases.
Embedded + OCSVM achieved high sensitivity (98.61%) and moderate precision (21.82%) for the tumorous class, indicating that the model is highly sensitive to anomalies but produces many false positives. For the healthy class, the model demonstrated excellent precision (99.18%) but very low sensitivity (32.40%), meaning that while most predicted healthy cases are correct, it fails to identify many true healthy cases. The F1-scores further reflect this imbalance (48.91% for healthy, 35.74% for tumorous). The overall accuracy was low (43.04%), indicating poorly balanced classification across both classes. This configuration tends to overclassify normal cases as anomalies, resulting in many false alarms that reduce its clinical reliability.
PCA + OCSVM, on the other hand, presented moderate precision (81.17%) and sensitivity (74.46%) for the healthy class, showing a better capacity to detect normal samples. However, its performance on the tumorous class was still very poor, with precision at 6.82% and sensitivity at 9.76%, resulting in a very low F1-score (8.01%) for anomalies. Although the overall accuracy was higher (64.11%) than that of Embedded + OCSVM, this is misleading, as the classifier is clearly biased towards the majority class (healthy).
Overall, these results indicate that neither method achieves balanced performance across both classes. This highlights the limitations of traditional dimensionality reduction approaches combined with one-class classification, and emphasizes the need for more powerful techniques—such as deep learning-based feature extraction—to achieve clinically reliable tumor detection.
Table 6 compares the performance of gradient- and histogram-based feature extraction methods combined with OCSVM.
The Gradient + OCSVM method shows a high sensitivity (86.75%) for the tumorous class, indicating some ability to detect anomalies. However, its precision is very low for both classes—only 13.20% for the healthy class—reflecting many false positives and negatives. The overall accuracy is just 25.00%, close to the random classification, highlighting poor discriminative power.
Histogram + OCSVM achieves better results for the healthy class, with high sensitivity (93.40%) and precision (83.81%), indicating the strong detection of normal samples. Yet, its performance in the tumorous class remains weak, with both sensitivity and precision below 23%, showing difficulty in detecting anomalies. Despite a higher overall accuracy of 79.44%, this is influenced by class imbalance and does not fully represent the model’s effectiveness for the minority class.
In summary, both traditional feature-based methods face challenges in imbalanced and anomaly detection tasks, reinforcing the need for deep learning approaches to improve tumor classification accuracy and robustness.
The evaluation metrics for FFT, Wavelet, and Hartley methods combined with OCSVM (see
Table 7) reveal significant differences in performance across these classical frequency domain techniques.
Hartley + OCSVM showed extremely low sensitivity for the healthy class, correctly detecting only 4.00%, which implies a very high number of false negatives. Although its precision for the healthy class was 71.43%, this value is misleading due to the overwhelming imbalance and misclassification. The tumorous class, on the other hand, was recognized with a high sensitivity of 91.63%, suggesting effective detection of anomalies. However, the very low precision of 15.45% again reflects excessive false positives. The overall accuracy reached only 18.07%, indicating poor general performance.
Wavelet + OCSVM showed similar patterns. For the healthy class, it reached a sensitivity of 4.27% and a precision of 64.64%, with a modest F1-score of 7.91%. Meanwhile, the tumorous class had a sensitivity of 87.80% and a precision of 14.93%, yielding an F1-score of 25.46%. Despite this, the overall accuracy remained low at 17.68%, again due to imbalance and poor classification of the majority class.
FFT + OCSVM demonstrated slightly better overall behavior. For the healthy class, sensitivity was 8.27%, with a precision of 90.51% and an F1-score of 15.05%. The tumorous class was recognized with a high sensitivity of 88.50% and a precision of 15.58%, leading to an F1-score of 26.42%. Still, the overall accuracy was just 21.14%, limited by the model’s poor detection of healthy instances.
In summary, while these traditional frequency-domain methods combined with OCSVM show some effectiveness in identifying tumorous cases—especially FFT and Hartley—they all suffer from very low sensitivity for the healthy class and high false positive rates. This imbalance severely limits their practical utility. These findings underscore the advantage of deep learning-based feature extraction techniques, which can offer more balanced, robust, and clinically reliable tumor detection.
6.4. Execution Time and Computational Complexity
Table 8 presents a comparison of the average feature extraction time, prediction time per image, and computational complexity (measured in FLOPs) for each deep learning backbone combined with OCSVM.
Among the evaluated models, MobileNetV2 demonstrates the highest efficiency in terms of inference speed, requiring only 4.64 ms for feature extraction and 0.012 ms for prediction per image. This makes MobileNetV2 highly suitable for real-time or resource-constrained applications.
In contrast, VGG16 shows the longest feature extraction time at 91.09 ms, which could hinder its deployment in latency-sensitive scenarios despite its potentially higher accuracy. DenseNet121 and InceptionV3 offer a balance with moderate extraction times and computational demands.
Regarding computational complexity, VGG16 demands the most FLOPs (), reflecting its deeper and more complex architecture. InceptionV3 and DenseNet121 require a moderate number of FLOPs (), while MobileNetV2 stands out as the most lightweight model, with just FLOPs, confirming its advantage for embedded and mobile applications.
It is important to note that the reported prediction times correspond to the OCSVM classifier when combined with the deep learning backbone features. For models operating as pure CNN classifiers without OCSVM, the prediction time reflects the direct inference time of the CNN. Additional processing steps, such as filtering, localization, or masking, are not included in these timings as they are considered separate from feature extraction and classification.
Overall, these metrics highlight the trade-offs between accuracy, speed, and computational cost, offering valuable guidance for selecting appropriate models based on the constraints and requirements of specific deployment environments.
6.5. Visual Evaluation and Additional Metrics
The visual evaluation presented in
Figure 8,
Figure 9,
Figure 10,
Figure 11 and
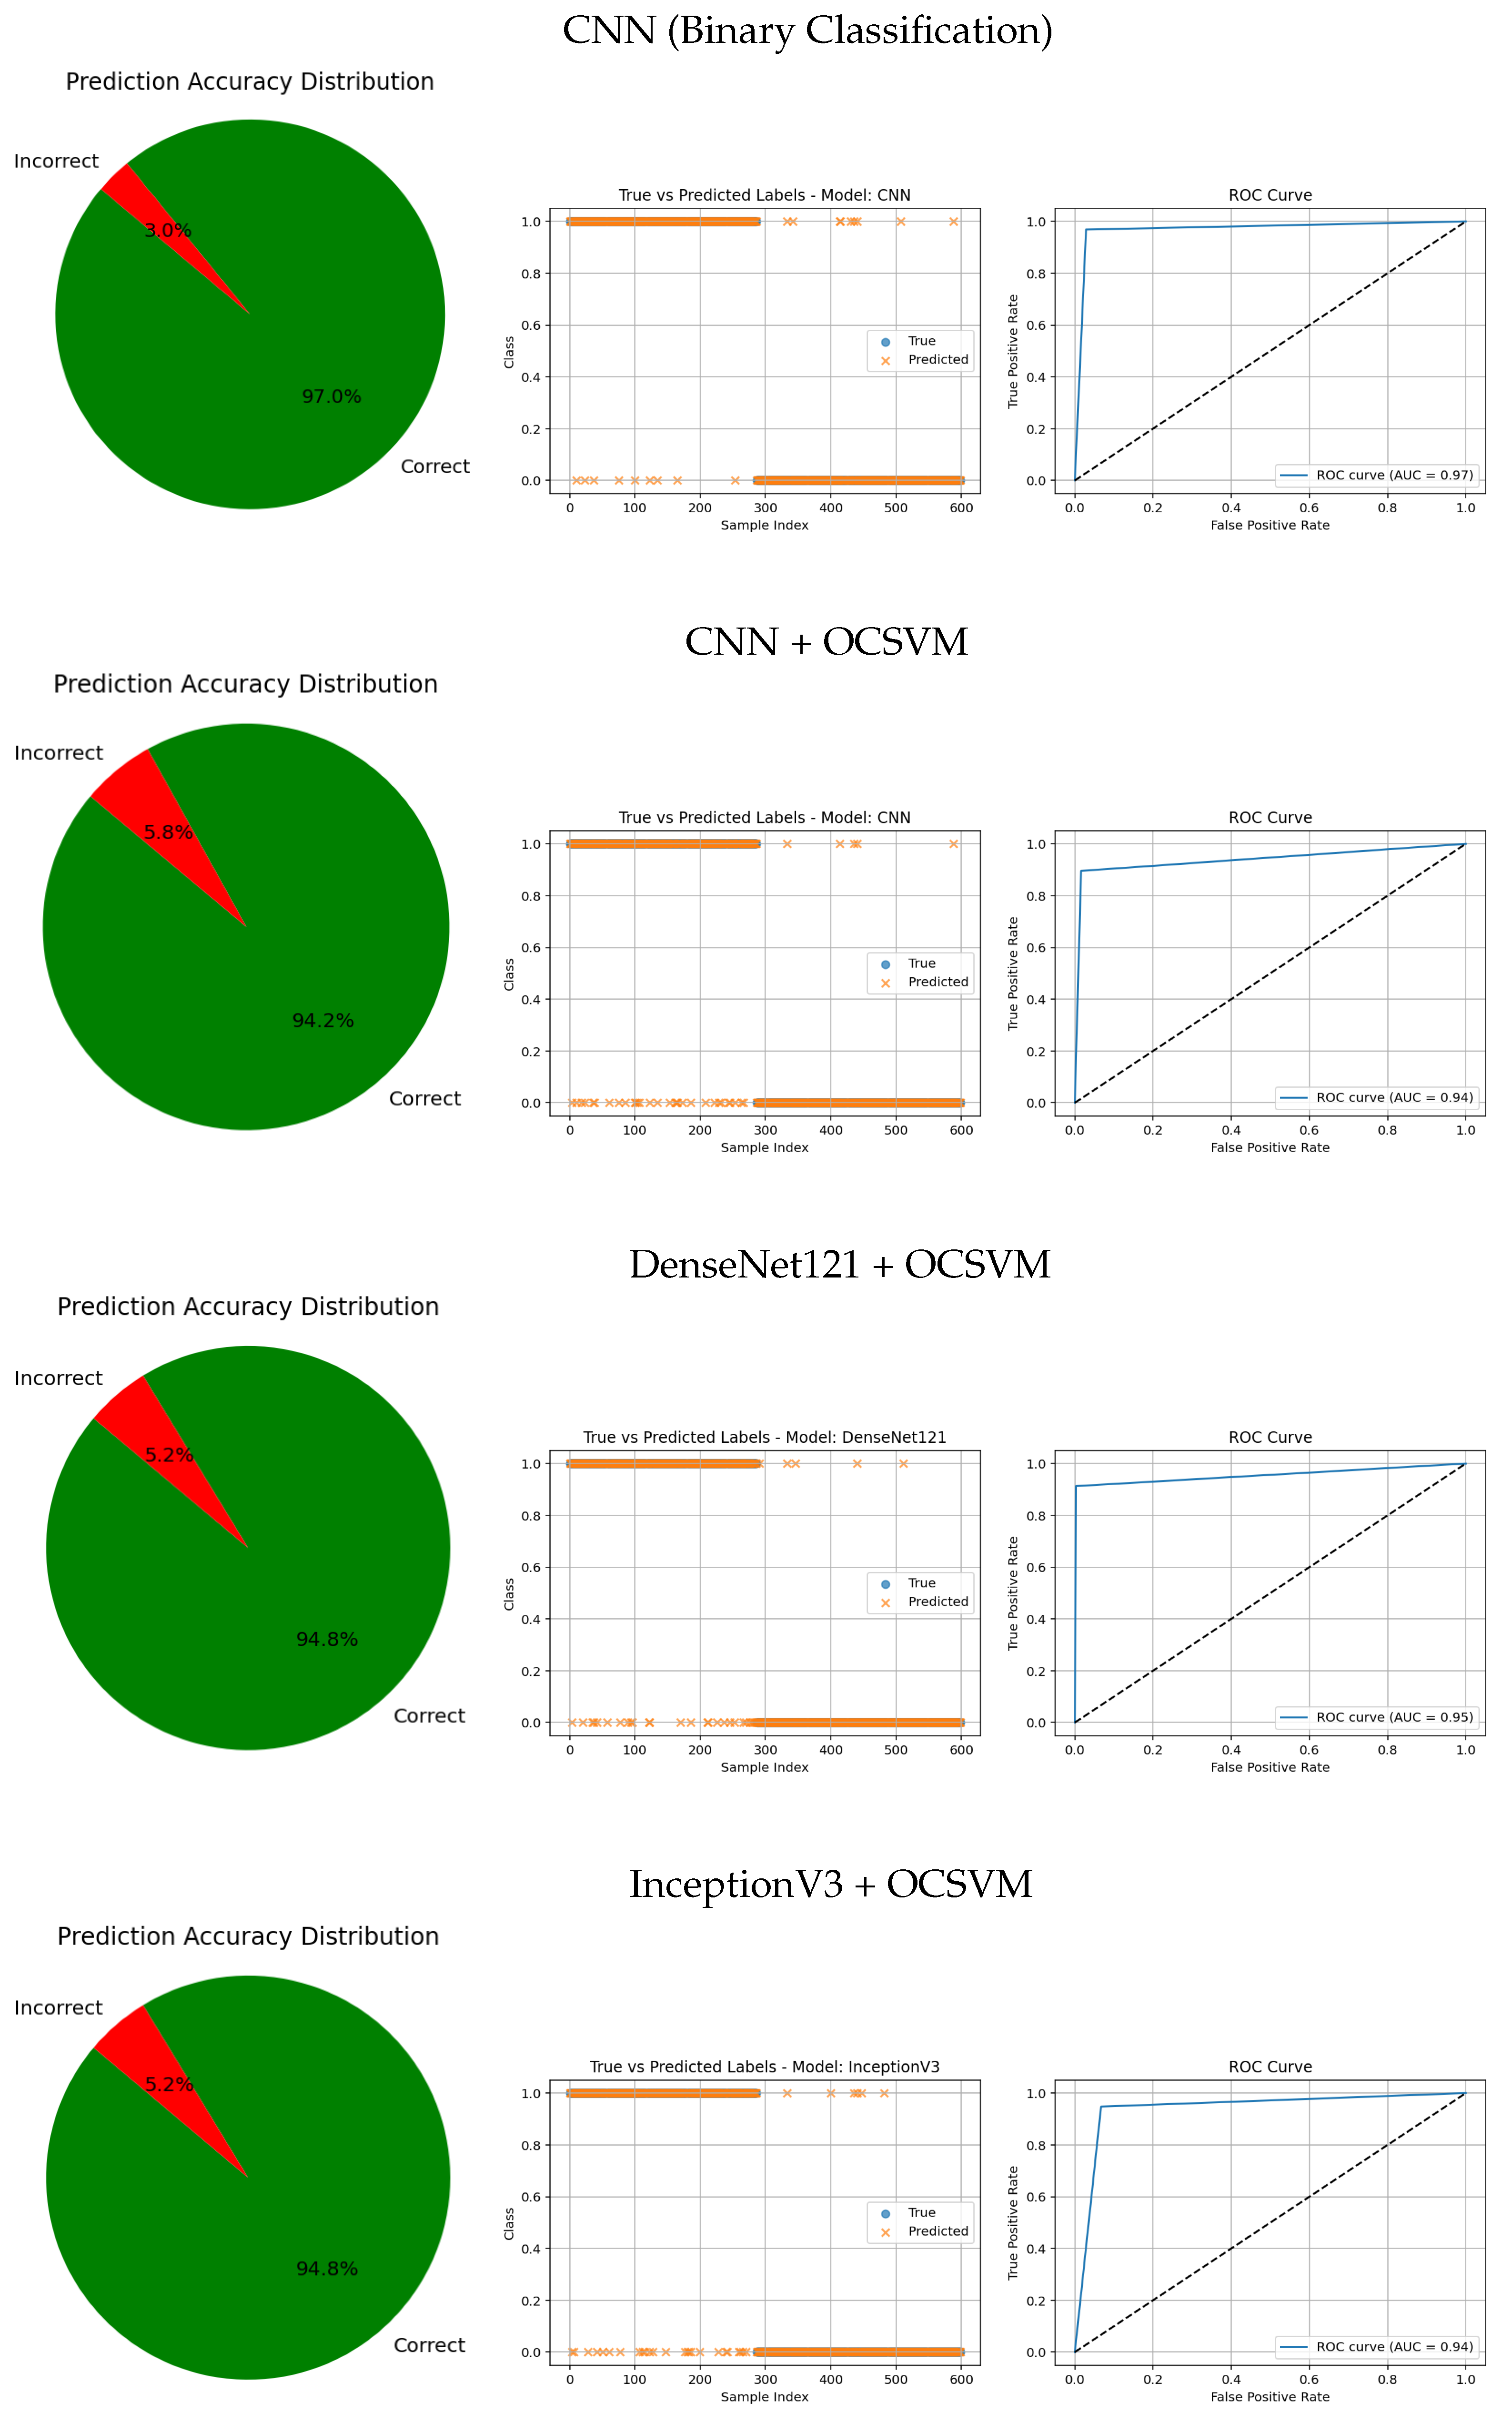
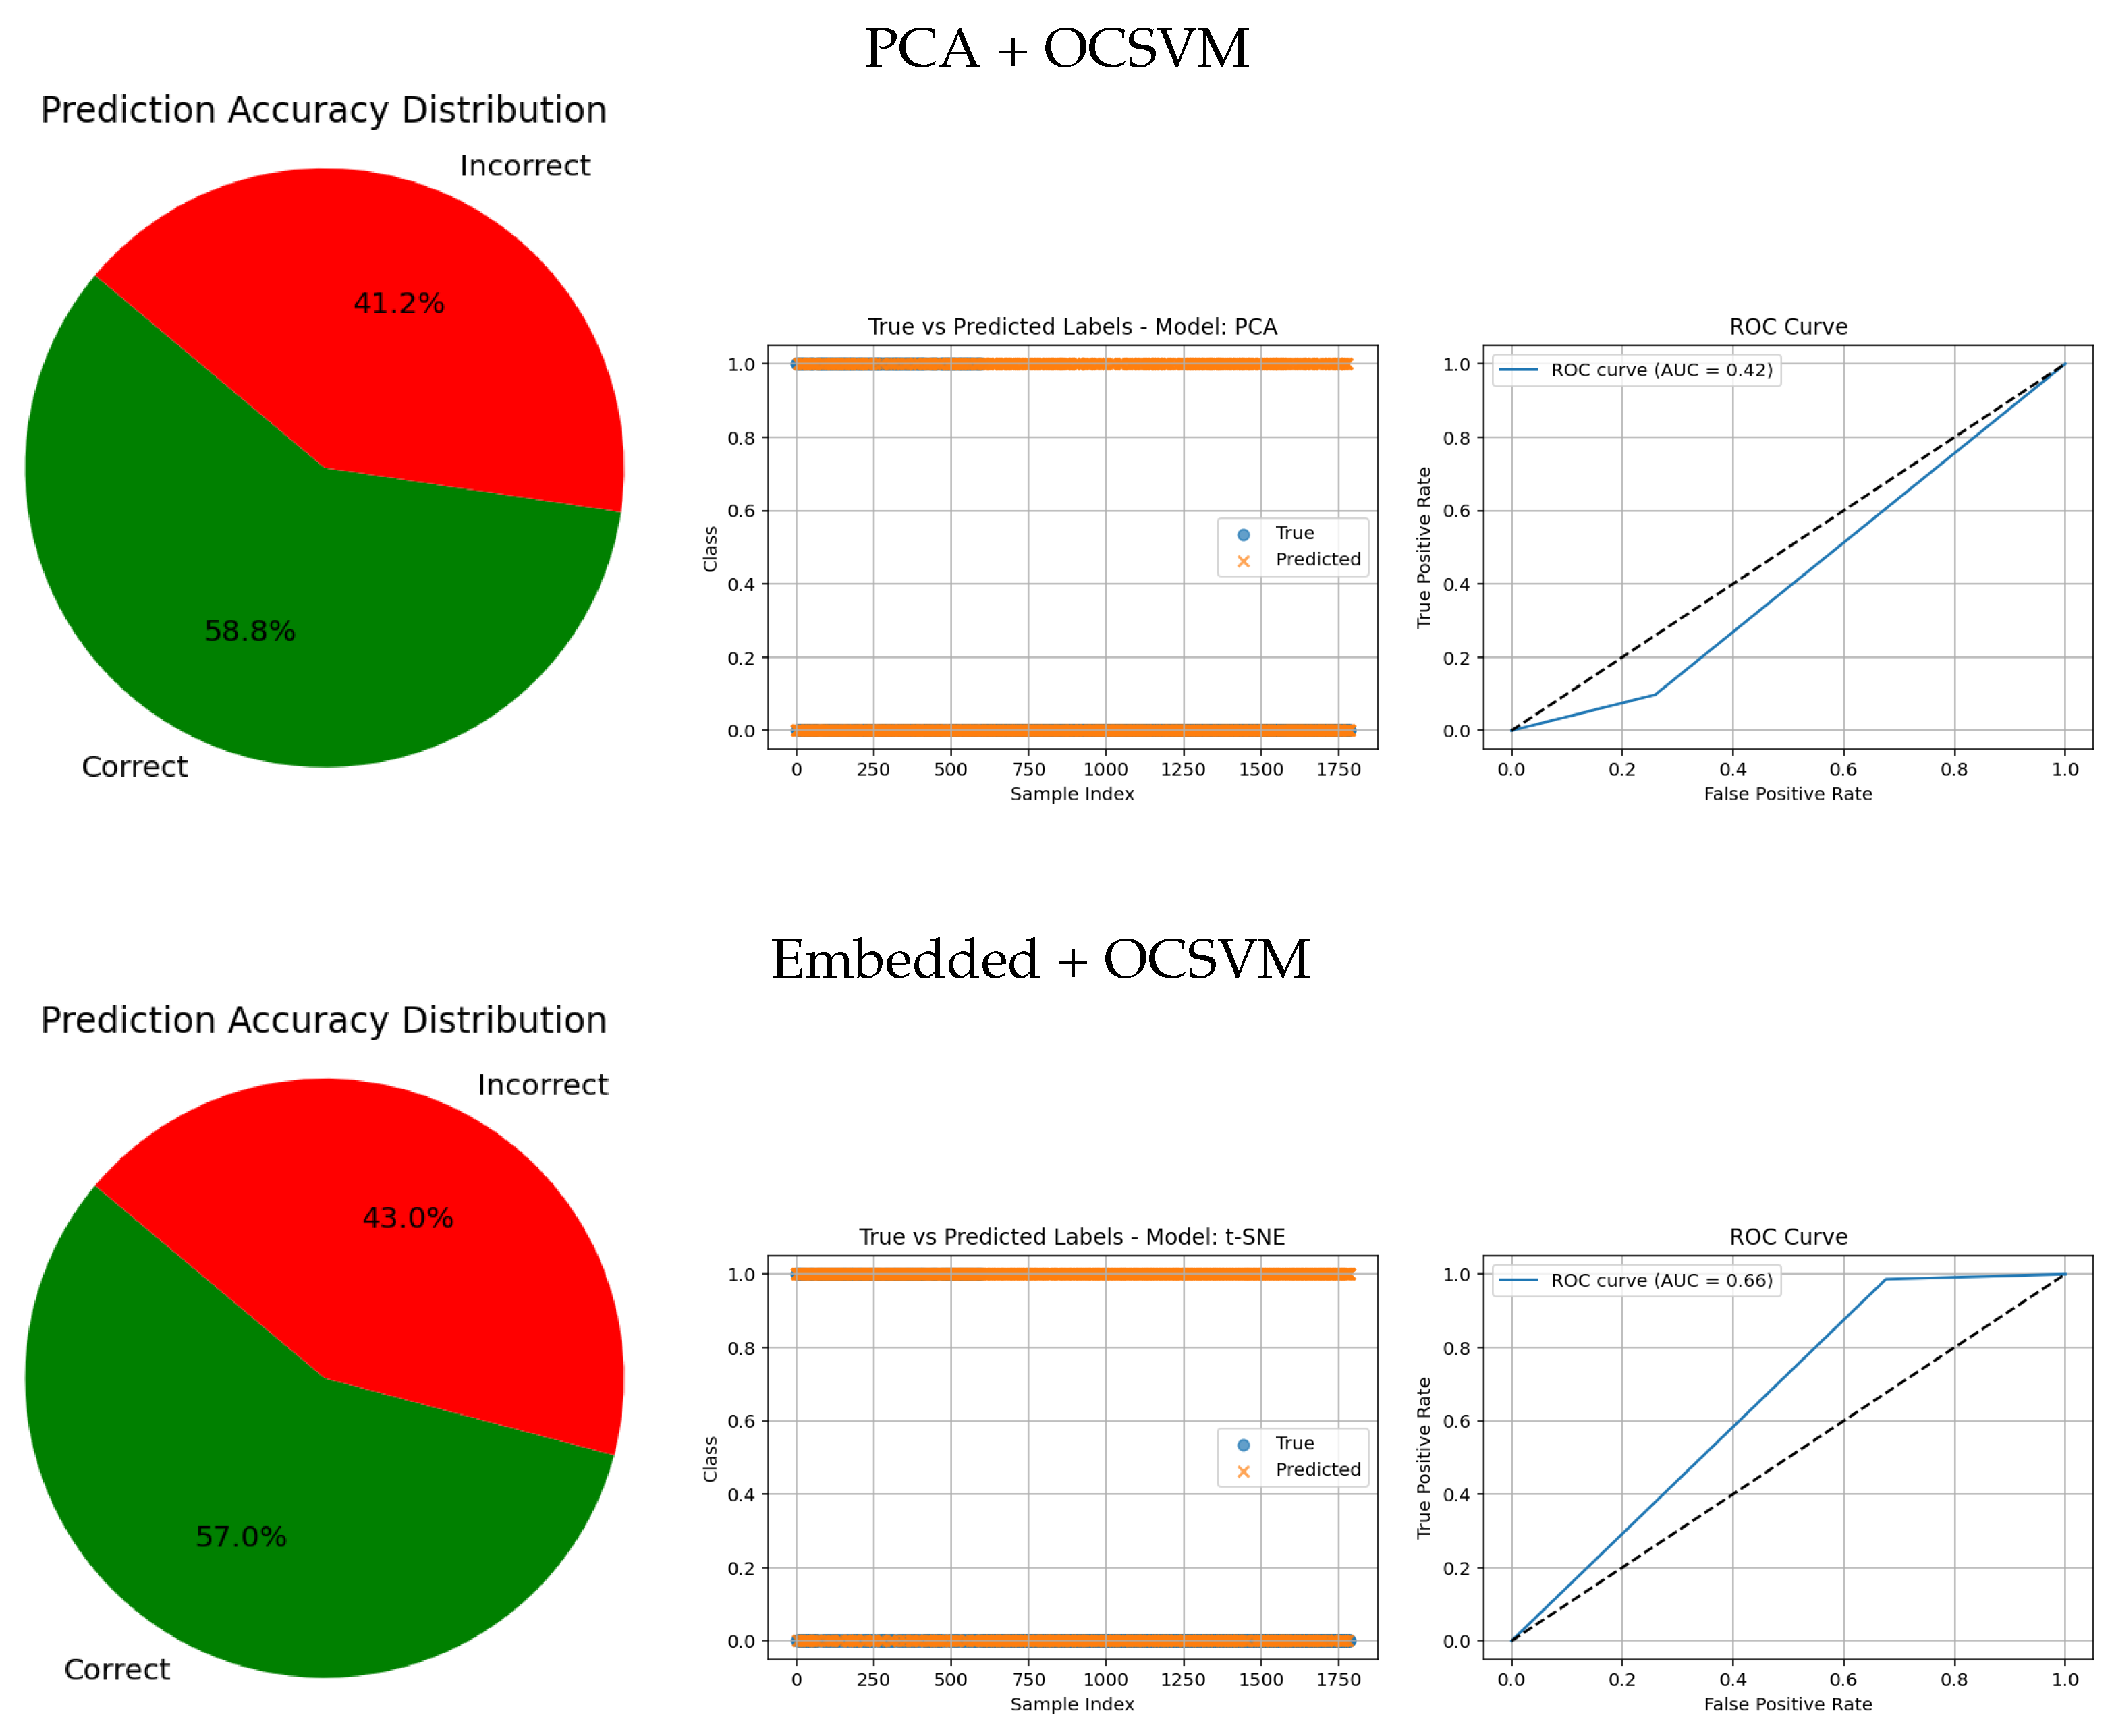
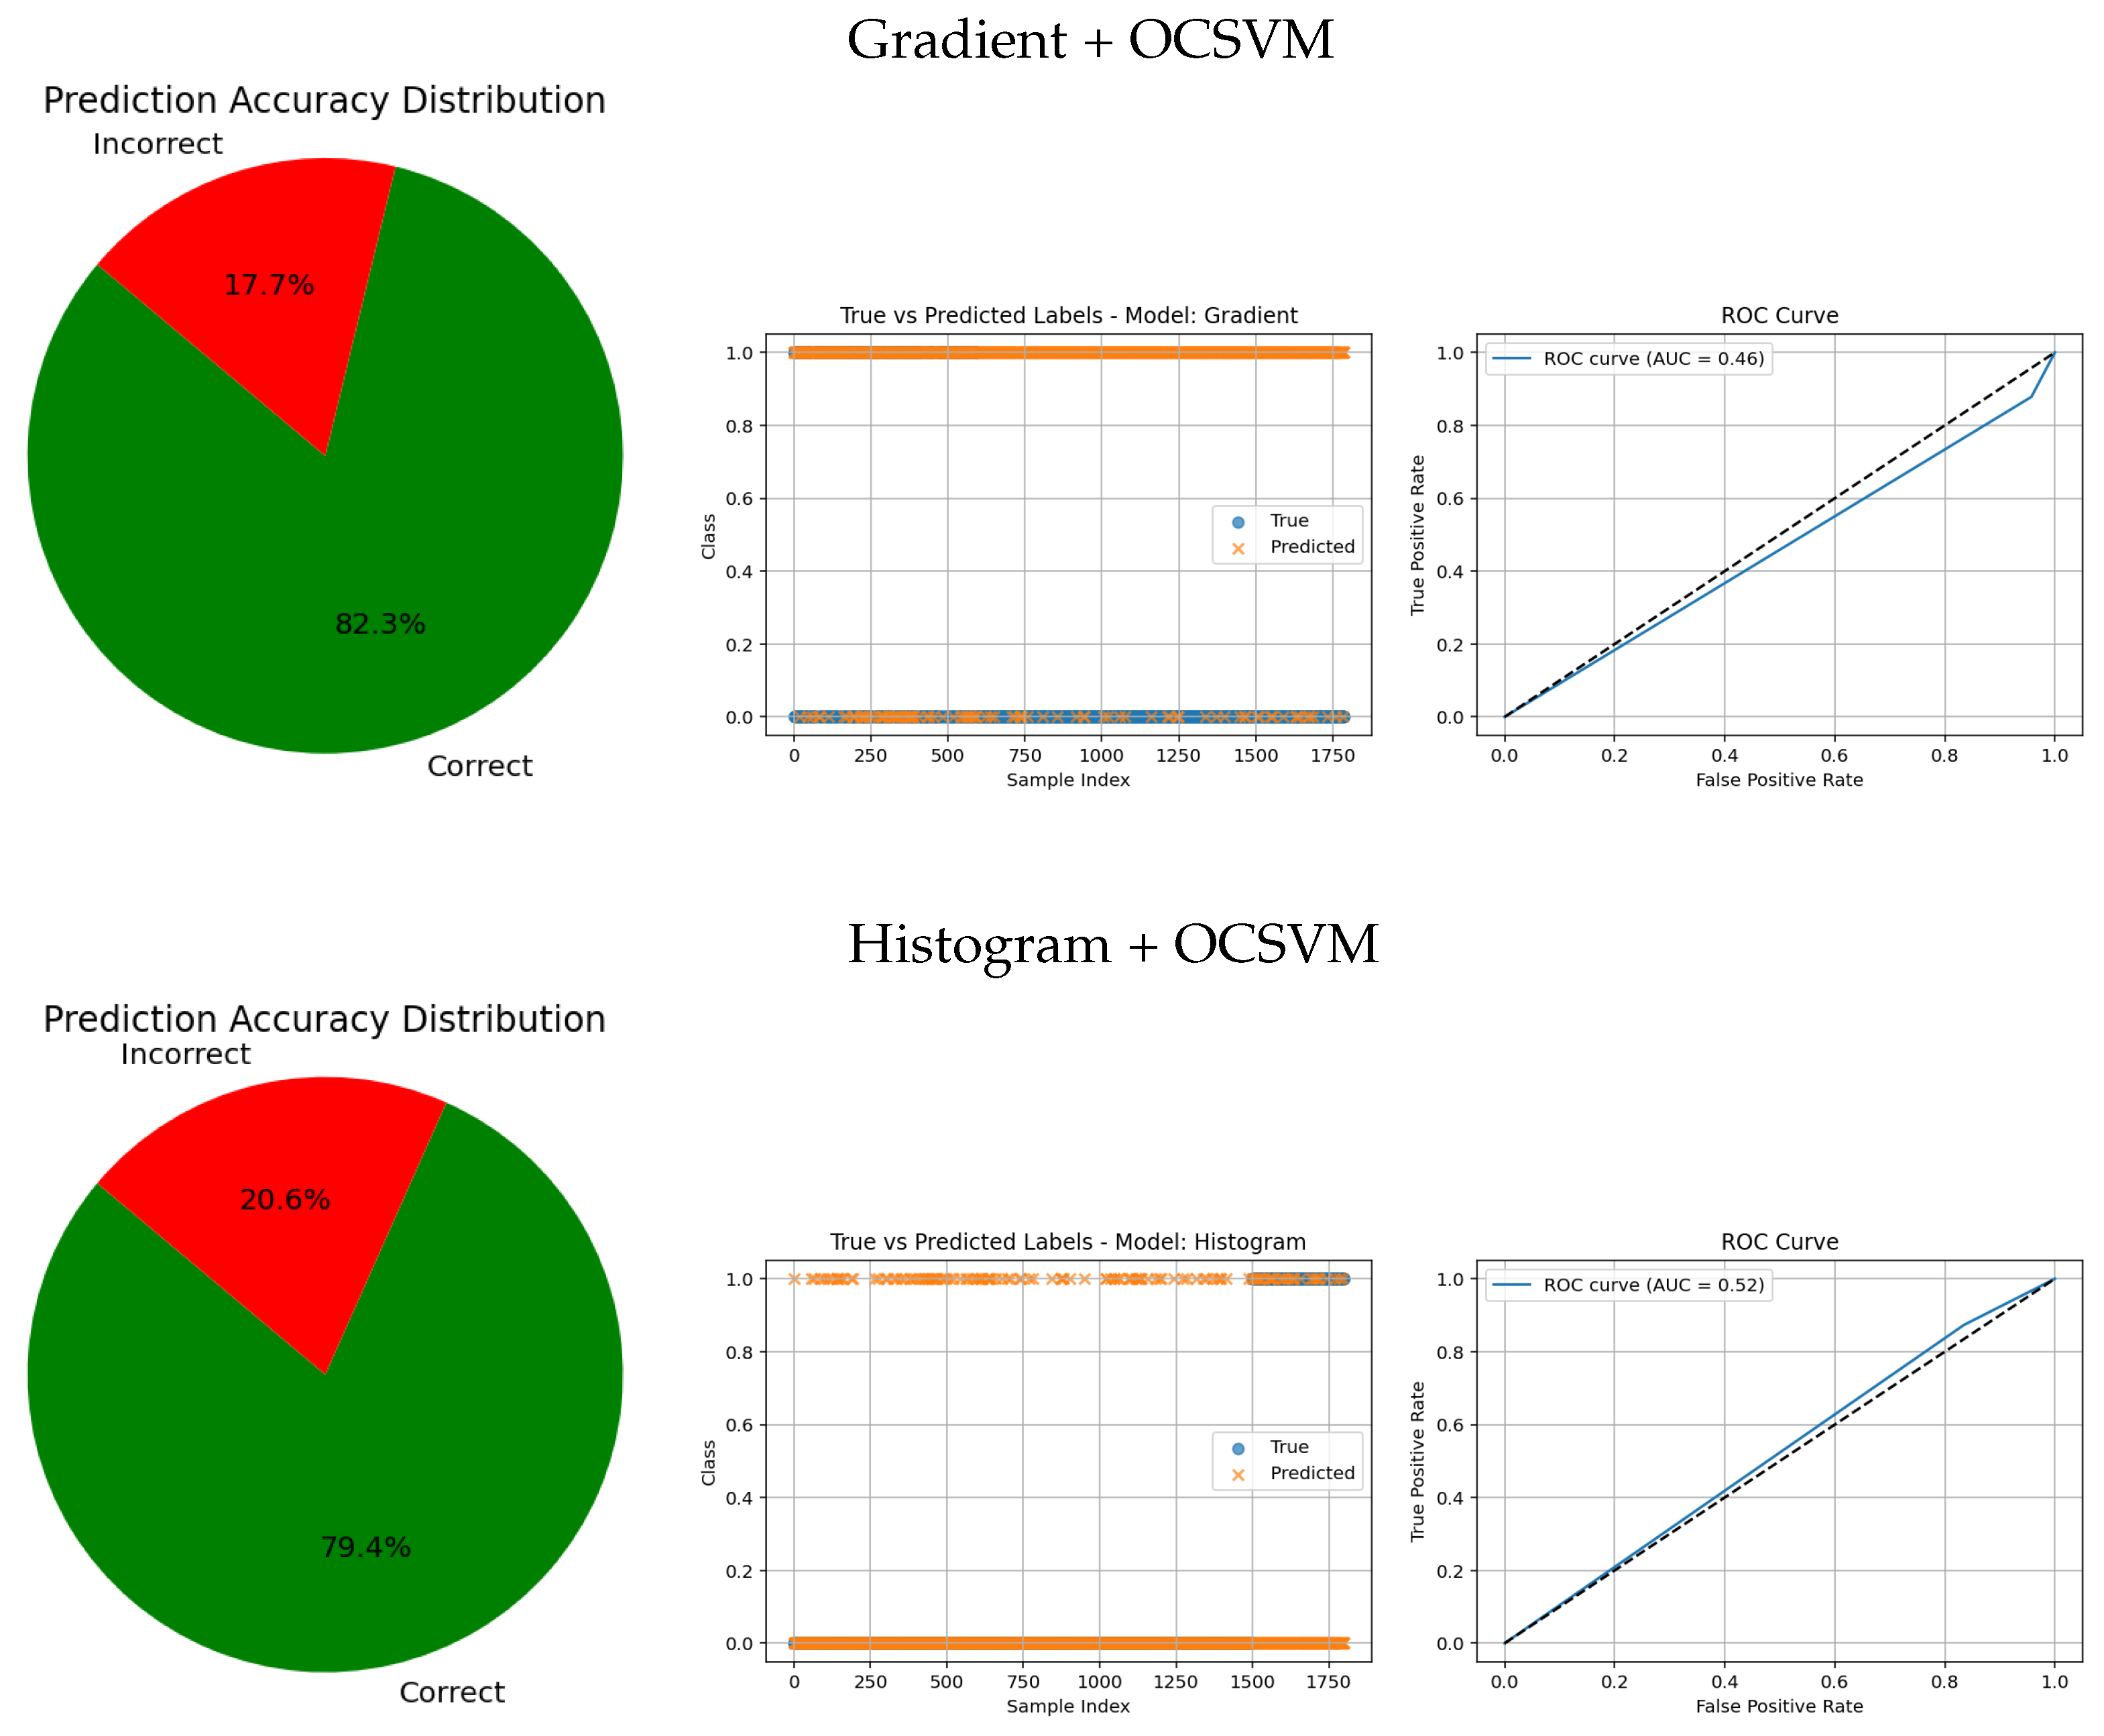
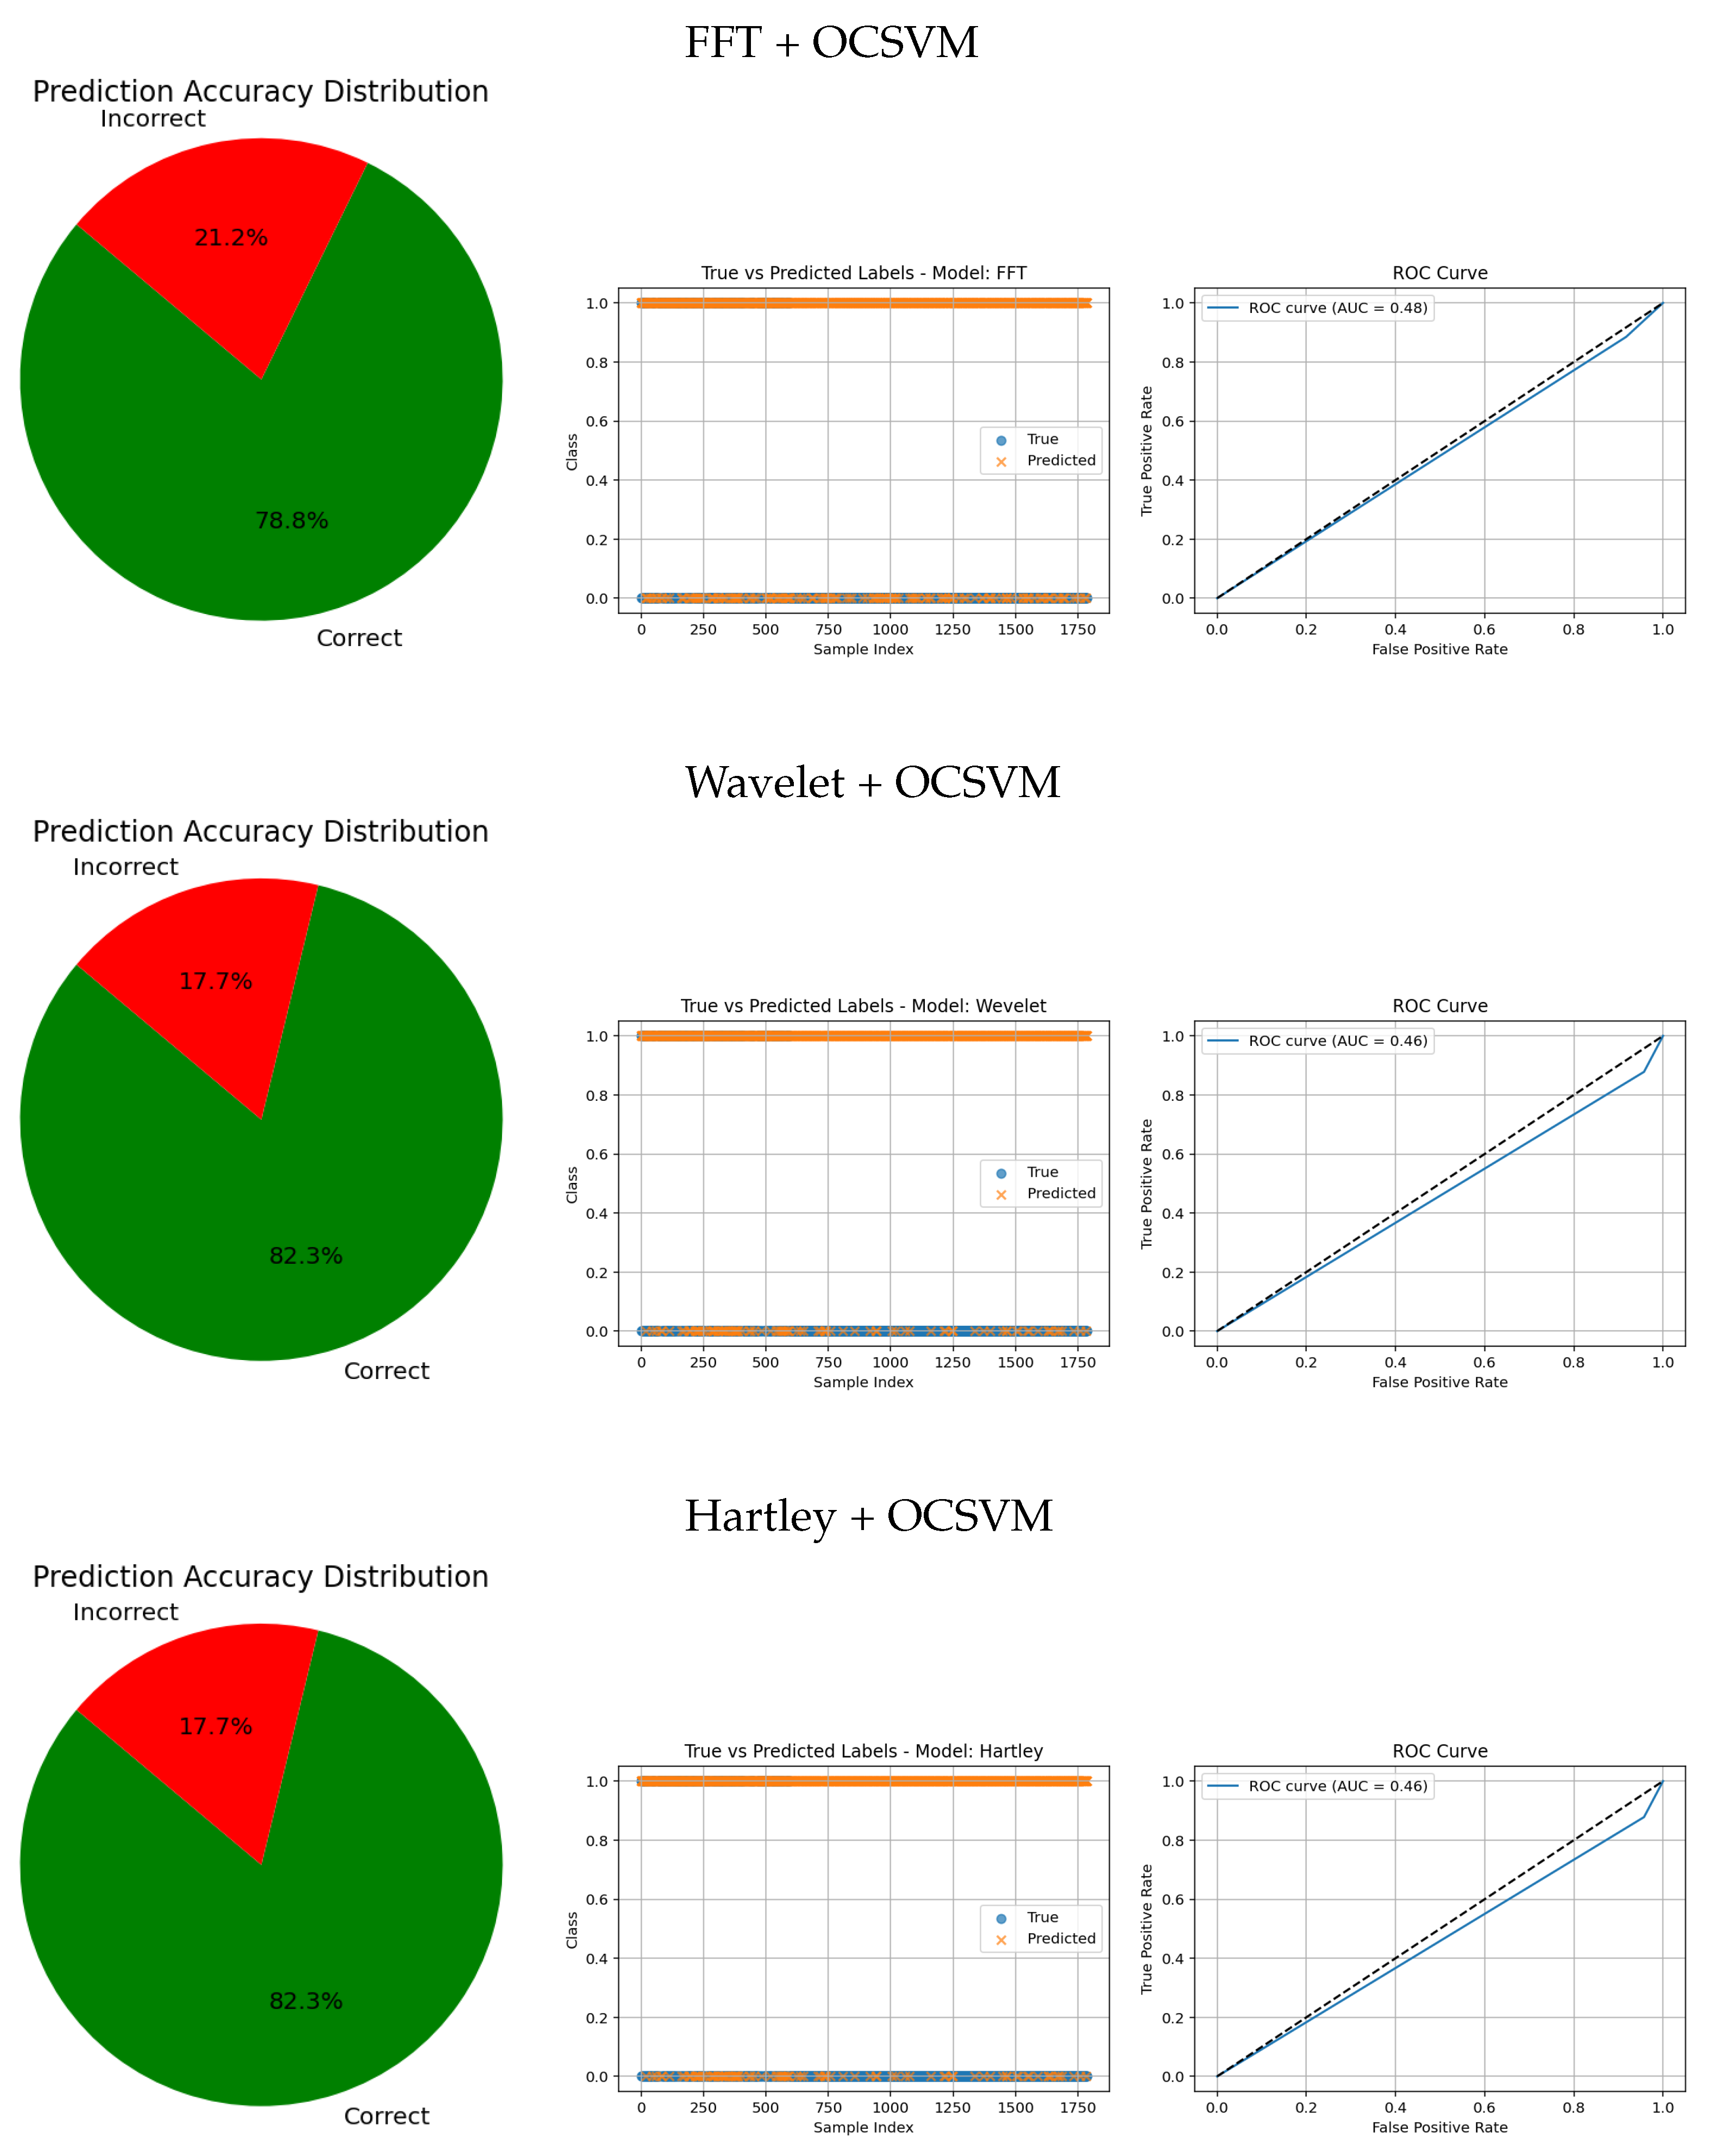
Figure 12 complements the quantitative results by showing the ROC curves, true versus predicted label distributions, and prediction accuracy distributions for all evaluated models.
Models with higher AUC values in the ROC curves, such as the CNN (AUC = 0.97), DenseNet121 (AUC = 0.95), and VGG16 (AUC = 0.95), also exhibit strong alignment between true and predicted labels, confirming robust discriminative capability. Their prediction accuracy distributions reveal a high proportion of correct classifications and a very small angle of error, reflecting precise model performance.
In contrast, traditional feature-based methods like PCA (AUC = 0.42), Gradient (AUC = 0.46), Histogram (AUC = 0.52), FFT (AUC = 0.48), Hartley (AUC = 0.46), and Wavelet (AUC = 0.46) demonstrate poor ROC performance, which is further corroborated by low similarity in the true vs predicted plots and wider error angles in the accuracy distributions. These observations indicate limited anomaly detection ability and less reliable classification.
Intermediate results, such as those from MobileNetV2 + OCSVM (AUC = 0.92) and InceptionV3 + OCSVM (AUC = 0.94), suggest a balance between computational efficiency and predictive accuracy, which is consistent across all three visual representations.
Overall, these graphical analyses reinforce the superiority of deep learning backbone networks combined with OCSVM for tumor classification tasks over traditional feature extraction methods, both in terms of accuracy and reliability.
6.6. Analysis of Methods and Comparison with Other Studies
To evaluate the effectiveness of the proposed method, a comparative analysis was conducted against existing approaches that use similar datasets.
Table 9 provides a detailed summary of the performance metrics from various studies, allowing for a clear comparison of the accuracy, precision, and other relevant measures. Ismael et al. [
32] introduced a neural network framework tailored for brain tumor classification. By incorporating statistical descriptors within the architecture, their model achieved a diagnostic accuracy of 91.9%, showcasing the importance of statistical features for enhancing performance. Cheng et al. [
33] proposed a strategy aimed at enhancing brain tumor classification accuracy through the combined use of data augmentation and region partitioning. Their evaluation involved techniques such as intensity histograms, grey-level co-occurrence matrices (GLCM), and a bag-of-words (BoW) method. Applied to a dataset consisting of 3064 brain MRI scans, their approach achieved a classification accuracy of 91.3%. Afshar et al. [
34] presented a capsule network architecture (CapsNet) for brain tumor classification. This model improved precision by capturing spatial hierarchies between tumors and surrounding structures, addressing a limitation of conventional CNNs. CapsNet achieved an accuracy of 86.7% with segmentation and 78% without it, outperforming other models, such as those in [
35,
36,
37]. Tahir et al. [
35] developed a classification method using MRI data, which employed a two-dimensional discrete wavelet transform (DWT) combined with Daubechies wavelet-based features. This approach demonstrated an accuracy of 86%, emphasizing the significance of wavelet-based spatial information in medical image analysis. Paul et al. [
38] leveraged deep learning, specifically CNNs, to create a model for brain tumor classification. Their approach achieved a classification accuracy of 90.3%, and they noted that reducing image resolution could improve training efficiency, benefiting clinical workflows. A refined version of CapsNet was later introduced by Afshar et al. [
39], offering superior performance to CNN-based models while requiring fewer training samples. This second-generation CapsNet demonstrated robustness to variations, such as affine transformations and rotations, achieving a classification accuracy of 90.9%. However, its reliance on segmented data added to its architectural complexity. Zhou et al. [
40] employed a method that utilized automated region segmentation guided by recurrent neural networks. This technique effectively identified axial slices for classification, achieving an accuracy of 92.1%, which confirmed its suitability for clinical tumor detection. Pashaei et al. [
41] adopted a hybrid approach, using CNNs for feature extraction and a Kernel Extreme Learning Machine (KELM) for classification. Their model achieved an impressive accuracy of 93.7%, outperforming other machine learning algorithms, such as SVM, KNN, and RBFNN. Zhou et al. [
40] employed a method that utilized automated region segmentation guided by recurrent neural networks. This technique effectively identified axial slices for classification, achieving an accuracy of 92.1%, which confirmed its suitability for clinical tumor detection. In a separate approach, Abiwinanda et al. [
36] implemented several CNN architectures, totaling seven, without using image segmentation. Among these, the second configuration outperformed the others, achieving a training accuracy of 98.5% and a testing accuracy of 84.2%. Despite these impressive results, simpler CNN models often struggle to capture complex patterns, limiting overall performance due to their lack of expressive power. Navid et al. [
42] proposed a multi-class classification system utilizing a generative adversarial network (GAN), with a neural network functioning as the discriminator. This GAN-based architecture augmented the dataset and helped mitigate overfitting. Modified fully connected layers and tumor classification tasks were trained using 5-fold cross-validation, yielding accuracies of 93.0% for inserted splits and 95.6% for random splits. Guo et al. [
37] combined CNNs with graph-based representations, applying the model to PET scans for Alzheimer’s disease classification. Their CNN-graph hybrid achieved an accuracy of 93% in binary classification and 77% in three-class classification on the ADNI dataset, demonstrating its strength in neuroimaging-based diagnostics.
In this study, the pure CNN model achieved an accuracy of 97.83%, while the VGG16 network combined with OCSVM obtained 95.33%. Both results significantly outperform several methods previously reported in the literature. These figures demonstrate the effectiveness of deep neural network-based approaches for brain tumor classification. The CNN stands out for its ability to robustly extract discriminative features directly from magnetic resonance images, whereas the combination of VGG16 with OCSVM provides a hybrid strategy that can enhance detection in specific contexts. Together, these results highlight the great potential of deep learning techniques to improve automated and early diagnosis of brain tumors in clinical settings.
6.7. Discussion
The results clearly demonstrate that using deep learning models as feature extractors significantly enhances anomaly detection performance compared with directly using raw images or traditional handcrafted features.
In particular, DenseNet121 and VGG16 provided an excellent balance between accuracy, sensitivity, and computational efficiency. DenseNet121 achieved an accuracy of 98.45% and a sensitivity of 89.90% for detecting anomalies, substantially outperforming traditional approaches like PCA + OCSVM, which only reached approximately 10.0% accuracy and 0.1% recall. This highlights the advantage of deep feature representations in capturing complex data patterns relevant to anomalies.
The choice of the parameter in OCSVM had a critical impact on sensitivity. Lower values tended to bias the model toward the majority (normal) class, while higher values improved anomaly detection capabilities, as observed with Wavelet + OCSVM (). This illustrates the importance of careful hyperparameter tuning in OCC.
From a computational perspective, MobileNetV2 demonstrated superior efficiency, with a total feature extraction plus prediction time of only 0.00464 s per image. This suggests MobileNetV2 is highly suitable for real-time or resource-constrained environments where speed is critical.
ROC curve analyses reinforced these findings, with models that effectively separated classes achieving higher AUC scores. However, some models exhibited signs of slight overfitting, performing exceptionally well on the normal class but showing reduced generalization to anomalies. This suggests potential room for improvement in regularization or data augmentation strategies.
Traditional handcrafted feature-based methods (Histogram, Gradient, FFT, Hartley) and classical dimensionality reduction techniques like PCA and Embedded feature extraction generally showed poor performance in both detection accuracy and sensitivity. Their inability to capture intricate data structures likely led to low discriminative power, consistent with the relatively poor ROC and prediction-actual label comparisons.
In summary, deep learning-based feature extraction methods consistently outperformed other approaches across all evaluation metrics, underscoring their effectiveness and value for unsupervised anomaly detection tasks in complex image datasets.
6.8. Application in Real Clinical Settings
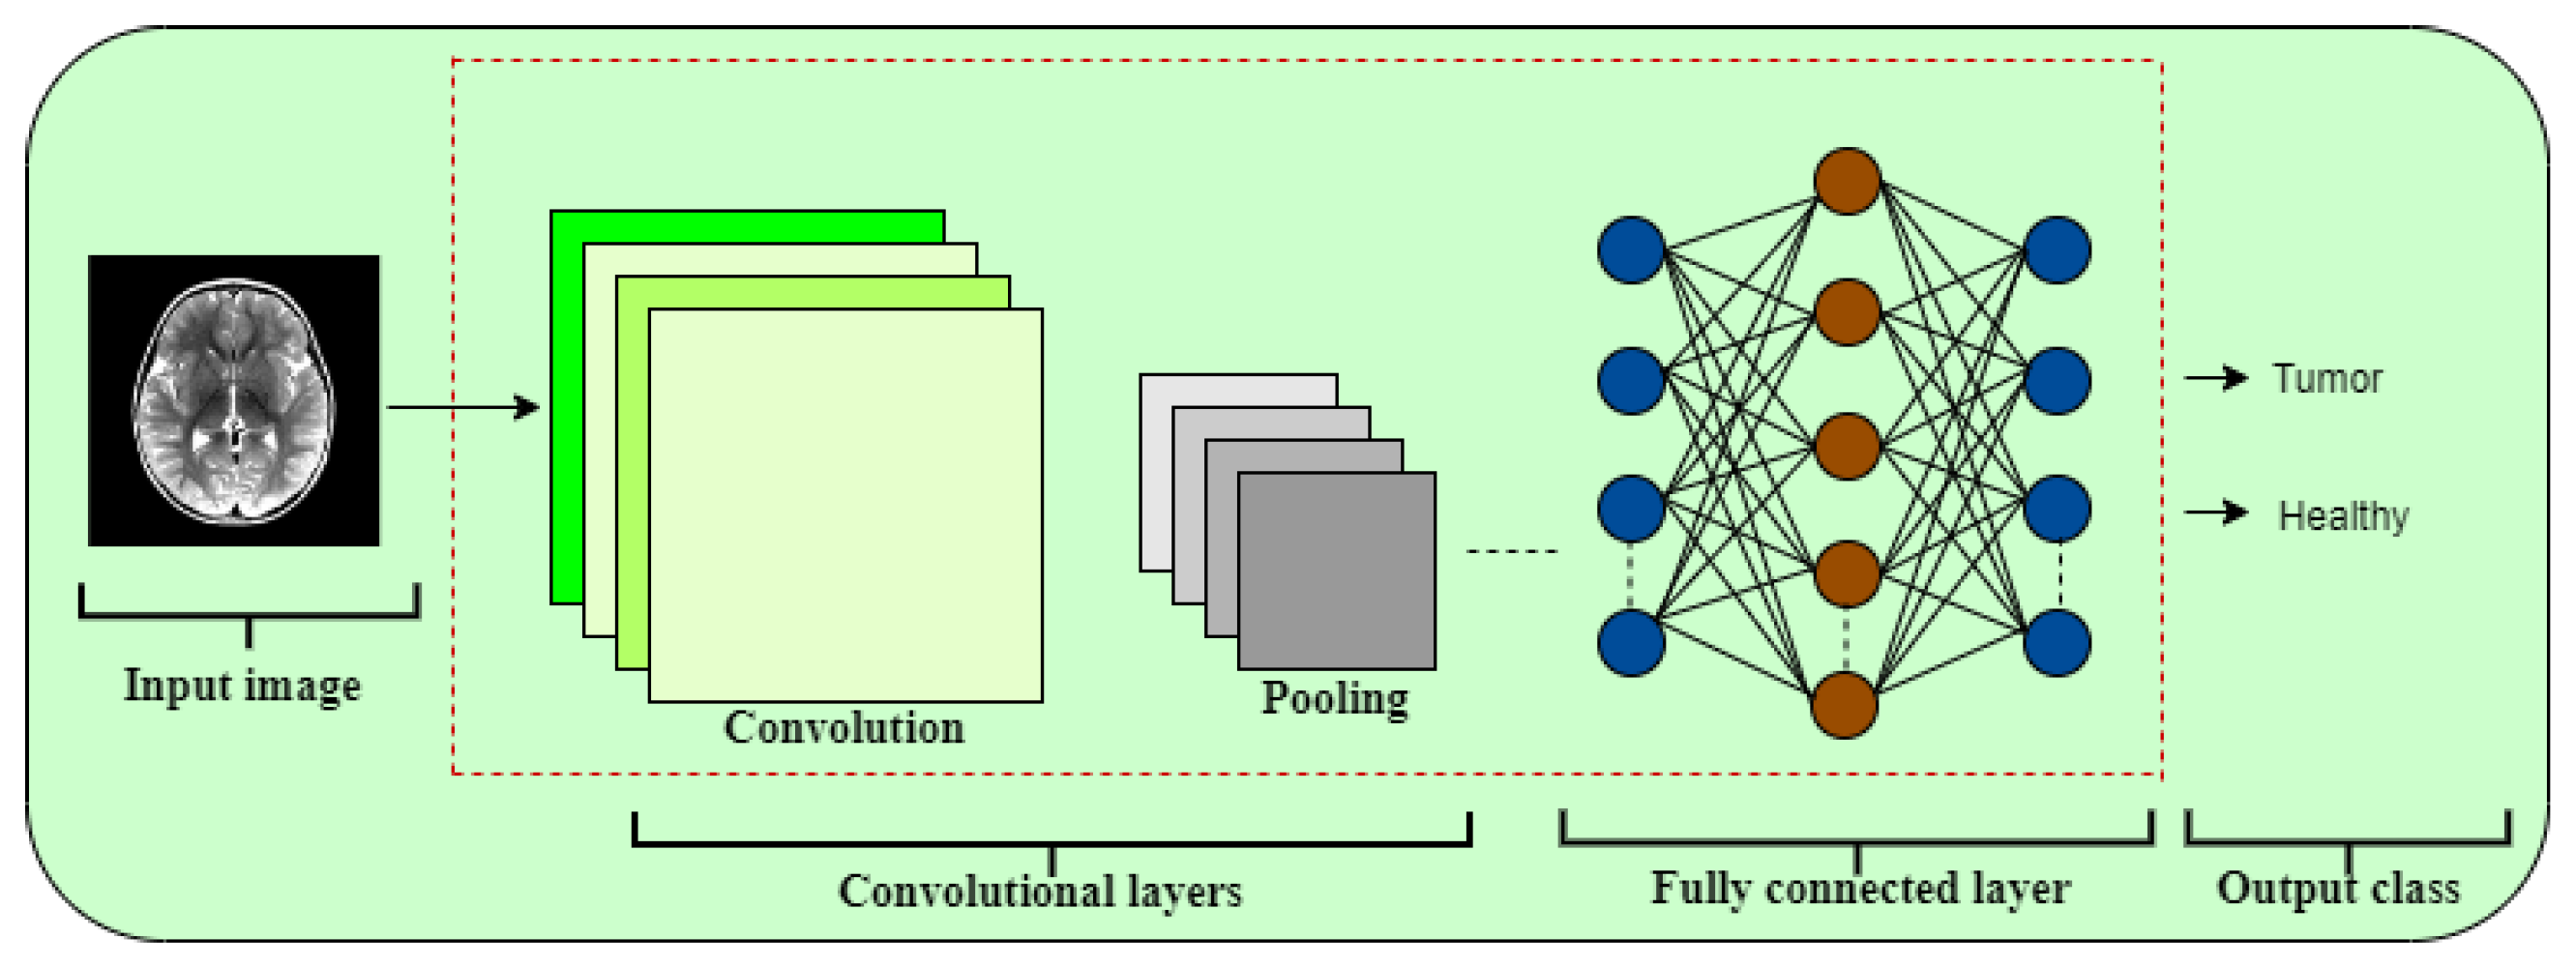
Artificial intelligence (AI), particularly convolutional neural networks (CNNs), holds significant promise for improving patient care by enabling automated tumor detection in medical imaging. By analyzing MRI, CT, and other imaging modalities, AI supports radiologists in diagnostic workflows through accurate and efficient identification of abnormalities. AI models trained on tumor patterns can outperform manual interpretations, providing valuable assistance in clinical decision-making. Moreover, AI-driven monitoring systems can continuously assess imaging data in critical care, promptly alerting healthcare professionals to potential tumors—an especially vital capability in intensive care units.
In addition to enhancing diagnostic accuracy, AI-based detection improves healthcare efficiency by facilitating patient prioritization according to clinical urgency. Successful deployment requires addressing challenges, such as rigorous clinical validation and regulatory approval, to ensure patient safety. Close collaboration among radiologists, data scientists, and regulatory bodies is essential for responsible and safe integration of AI into routine practice.
Recent advances in deep neural networks and dimensionality reduction techniques have shown strong potential for precise tumor localization. Combining feature extraction methods like the Fast FFT and Wavelet Transform with OCC approaches has proven effective for anomaly detection while maintaining low computational demands.
Ongoing research is crucial to refine these algorithms further. This study demonstrates that real-time tumor detection can be achieved without heavy computational overhead, indicating that the approach is adaptable to diverse medical imaging modalities for clinical use.
7. Conclusions
This study presents an effective strategy for brain tumor detection based on the integration of deep learning models for feature extraction with OCC through OCSVM. The experimental results, summarized in
Table 4, demonstrate that deep architectures, such as DenseNet121 and VGG16, achieve a robust balance between accuracy, precision, and sensitivity. DenseNet121 achieved an overall accuracy of 94.83%, with a precision of 99.23% and a sensitivity of 89.97% for tumor detection—outperforming other models like ResNet50 and CNN with accuracies below 85%. VGG16 also showed competitive performance (accuracy of 95.33%, precision of 98.87%, sensitivity of 91.32%).
Furthermore, MobileNetV2 offered a strong trade-off between efficiency and accuracy (92.83%), with the lowest computational cost, making it well-suited for real-time or resource-constrained applications. Interestingly, the standalone CNN model achieved a high accuracy of 97.83% without OCSVM, underscoring the strong discriminative power of convolutional networks trained end-to-end.
These findings confirm that deep learning-based feature extraction substantially outperforms traditional handcrafted methods in the context of unsupervised brain tumor detection. The hybrid approach of combining CNN-based features with OCSVM proved particularly useful in imbalanced or semi-supervised scenarios.
This work highlights the clinical relevance of AI systems in supporting early and accurate diagnosis of brain tumors, particularly when integrated into medical imaging workflows. However, future studies should focus on improving generalization to unseen data, optimizing inference speed, and validating the model across multicenter, heterogeneous datasets. Moreover, integrating explainability techniques and real-time feedback mechanisms will be critical for increasing physician trust and facilitating regulatory approval.
In conclusion, the results reinforce the potential of deep learning methods not only to enhance diagnostic accuracy but also to pave the way for safer, faster, and more accessible clinical decision-making tools in oncology and beyond.


