CSA-Net: Channel and Spatial Attention-Based Network for Mammogram and Ultrasound Image Classification


Abstract
:1. Introduction
2. Related Work
2.1. CNN-Based Models
2.2. Attention-Based CNN Models
2.3. Breast Cancer Classification Challenges
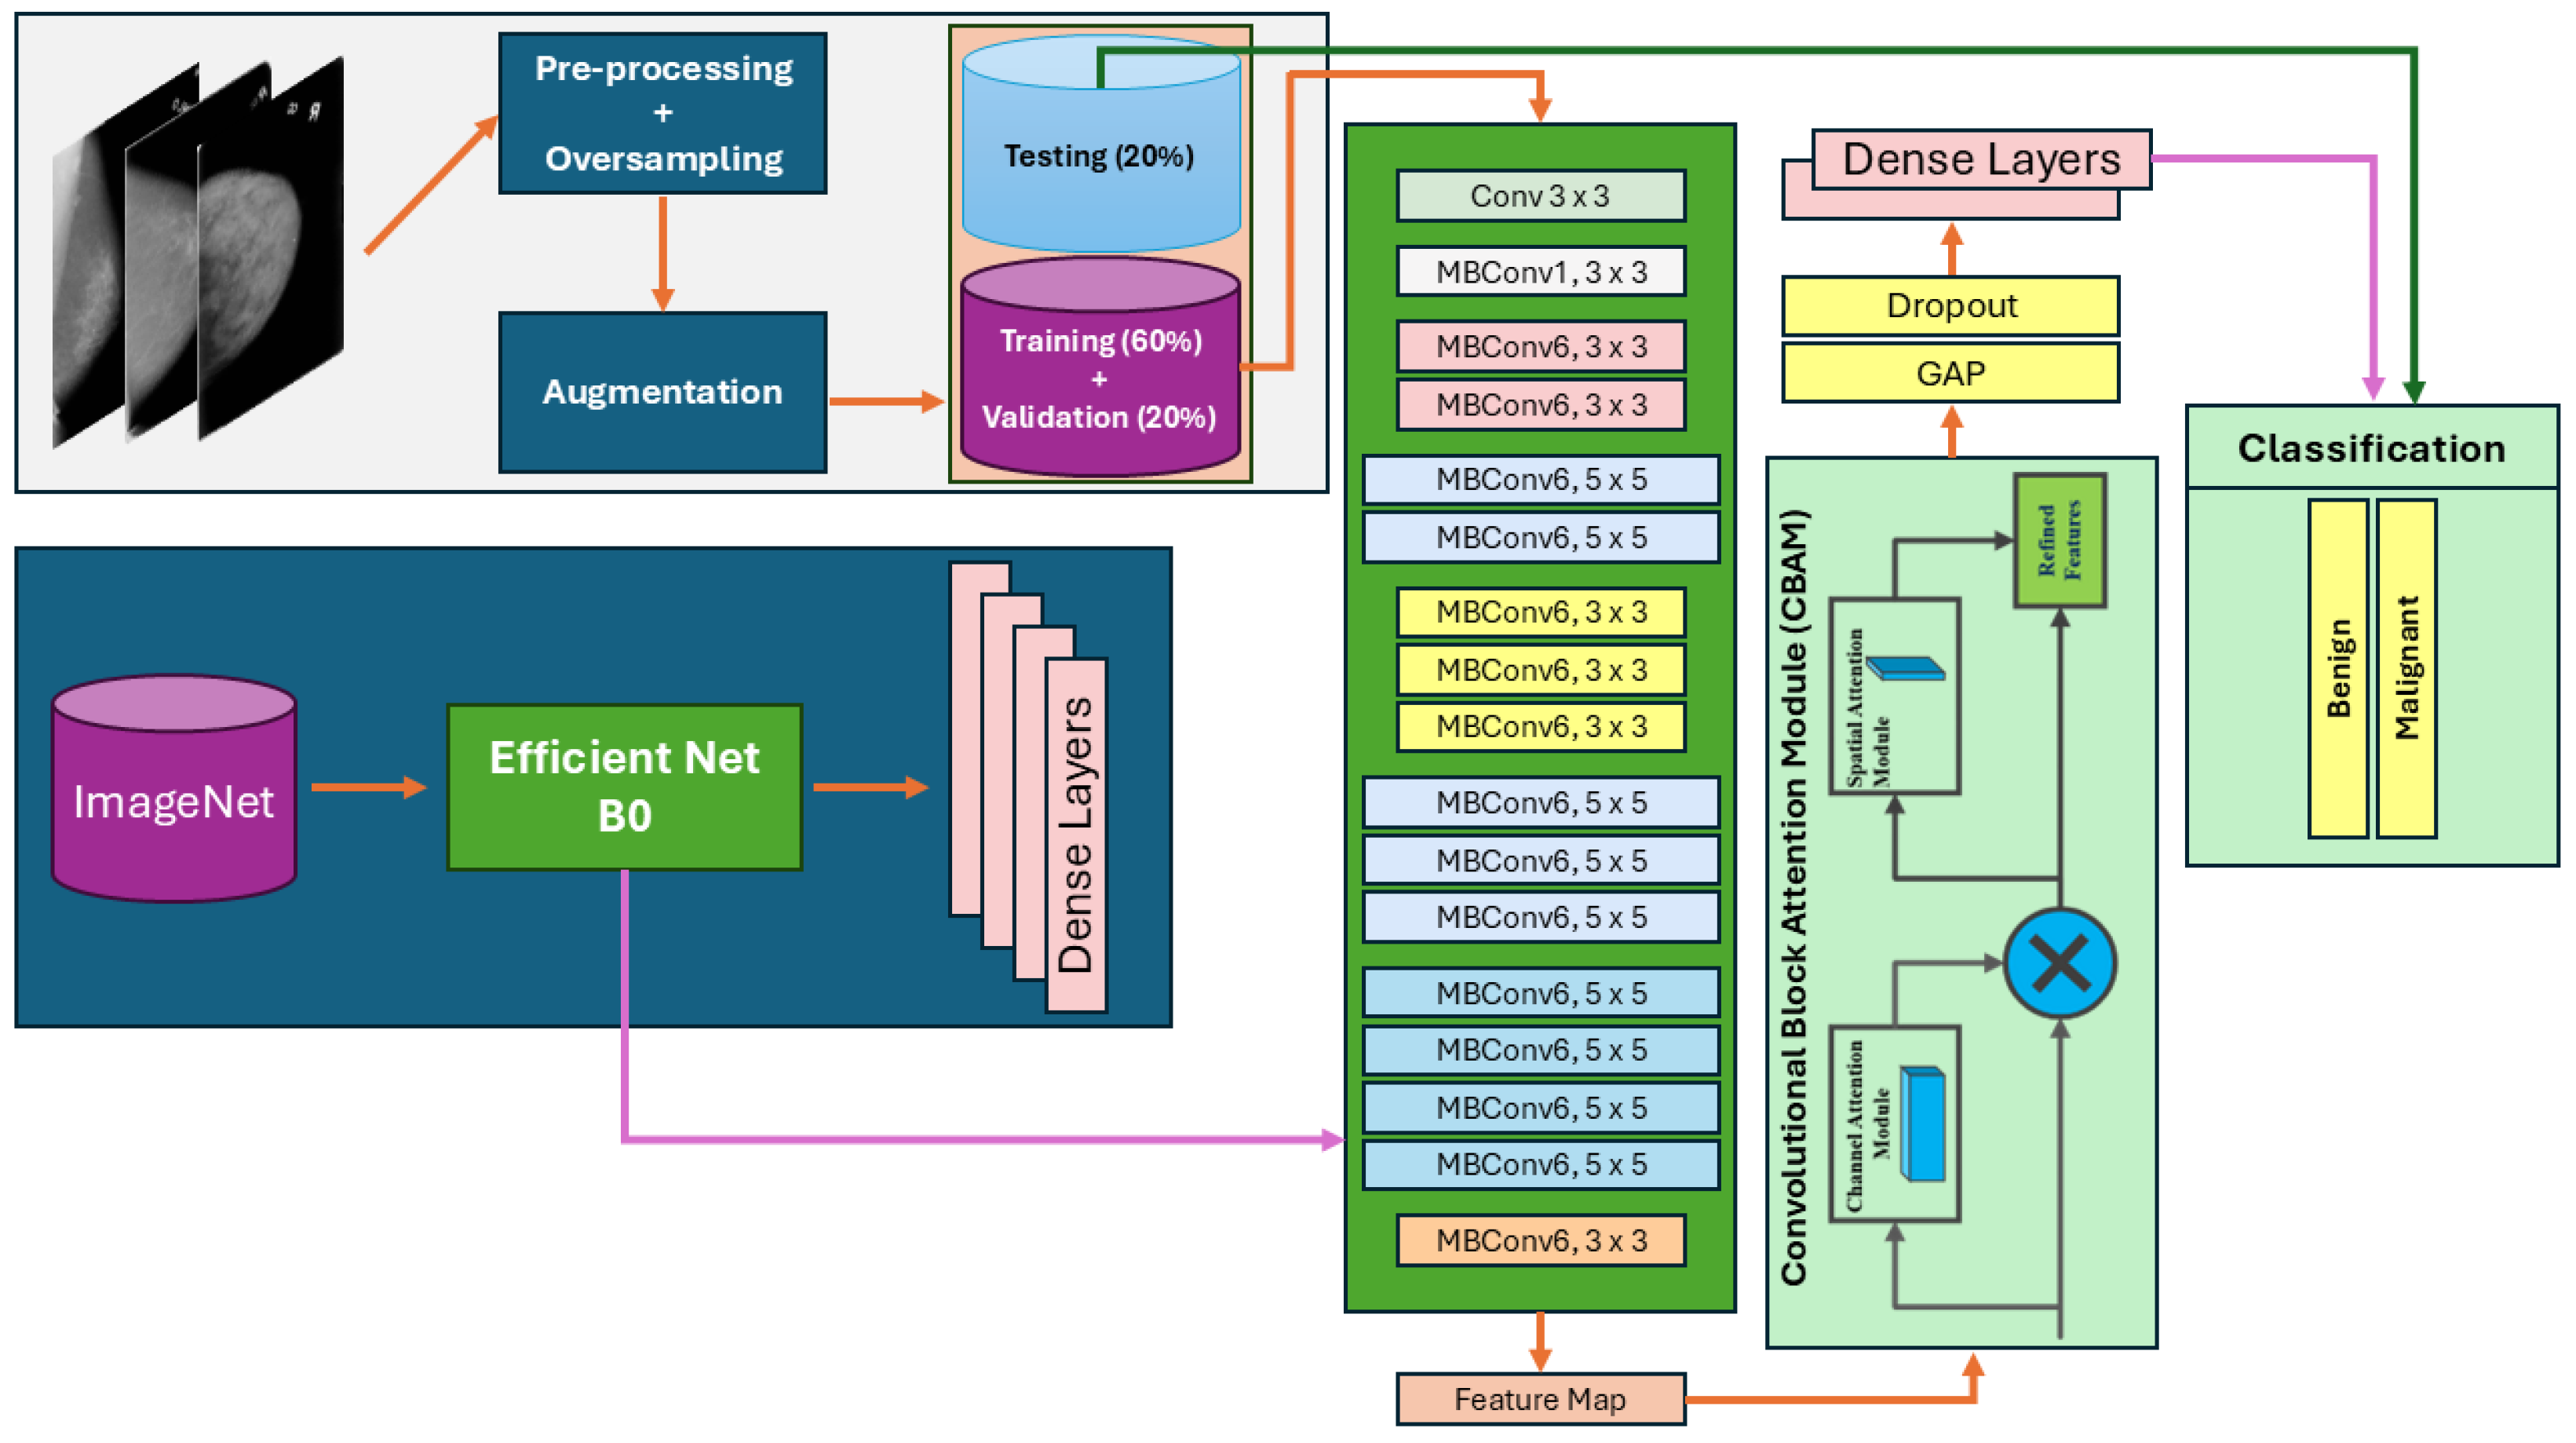
3. Methodology
3.1. Proposed Architecture Overview
| Algorithm 1 Algorithm of Proposed Model |
|

| Network | Mean Av. Precision | Mean Av. Recall | Mean Av. Accuracy | Mean Av. ROC | Mean Av. Specificity | Mean Av. F1-Score |
|---|---|---|---|---|---|---|
| DenseNet-121 [54] | 0.522 | 0.541 | 0.541 | 0.693 | 0.847 | 0.531 |
| DenseNet-169 [54] | 0.461 | 0.475 | 0.475 | 0.631 | 0.825 | 0.468 |
| DenseNet-201 [54] | 0.508 | 0.534 | 0.534 | 0.691 | 0.845 | 0.521 |
| ResNet-101 [55] | 0.404 | 0.435 | 0.435 | 0.500 | 0.812 | 0.419 |
| ResNet152V2 [55] | 0.401 | 0.506 | 0.506 | 0.468 | 0.835 | 0.447 |
| InceptionResNetV2 [56] | 0.530 | 0.533 | 0.533 | 0.700 | 0.844 | 0.531 |
| EfficientNet-B0 [53] | 0.744 | 0.748 | 0.748 | 0.905 | 0.916 | 0.746 |
| EfficientNet-B1 [53] | 0.734 | 0.736 | 0.736 | 0.909 | 0.912 | 0.735 |
| EfficientNetV2-B0 [53] | 0.610 | 0.620 | 0.620 | 0.832 | 0.873 | 0.615 |

3.1.1. Channel and Spatial Attention Mechanisms
3.1.2. Loss Function
4. Results
4.1. Materials
4.1.1. Dataset
4.1.2. Experimental Setup
4.1.3. Data Augmentation
4.1.4. Evaluation Measures
4.2. Ablation Study
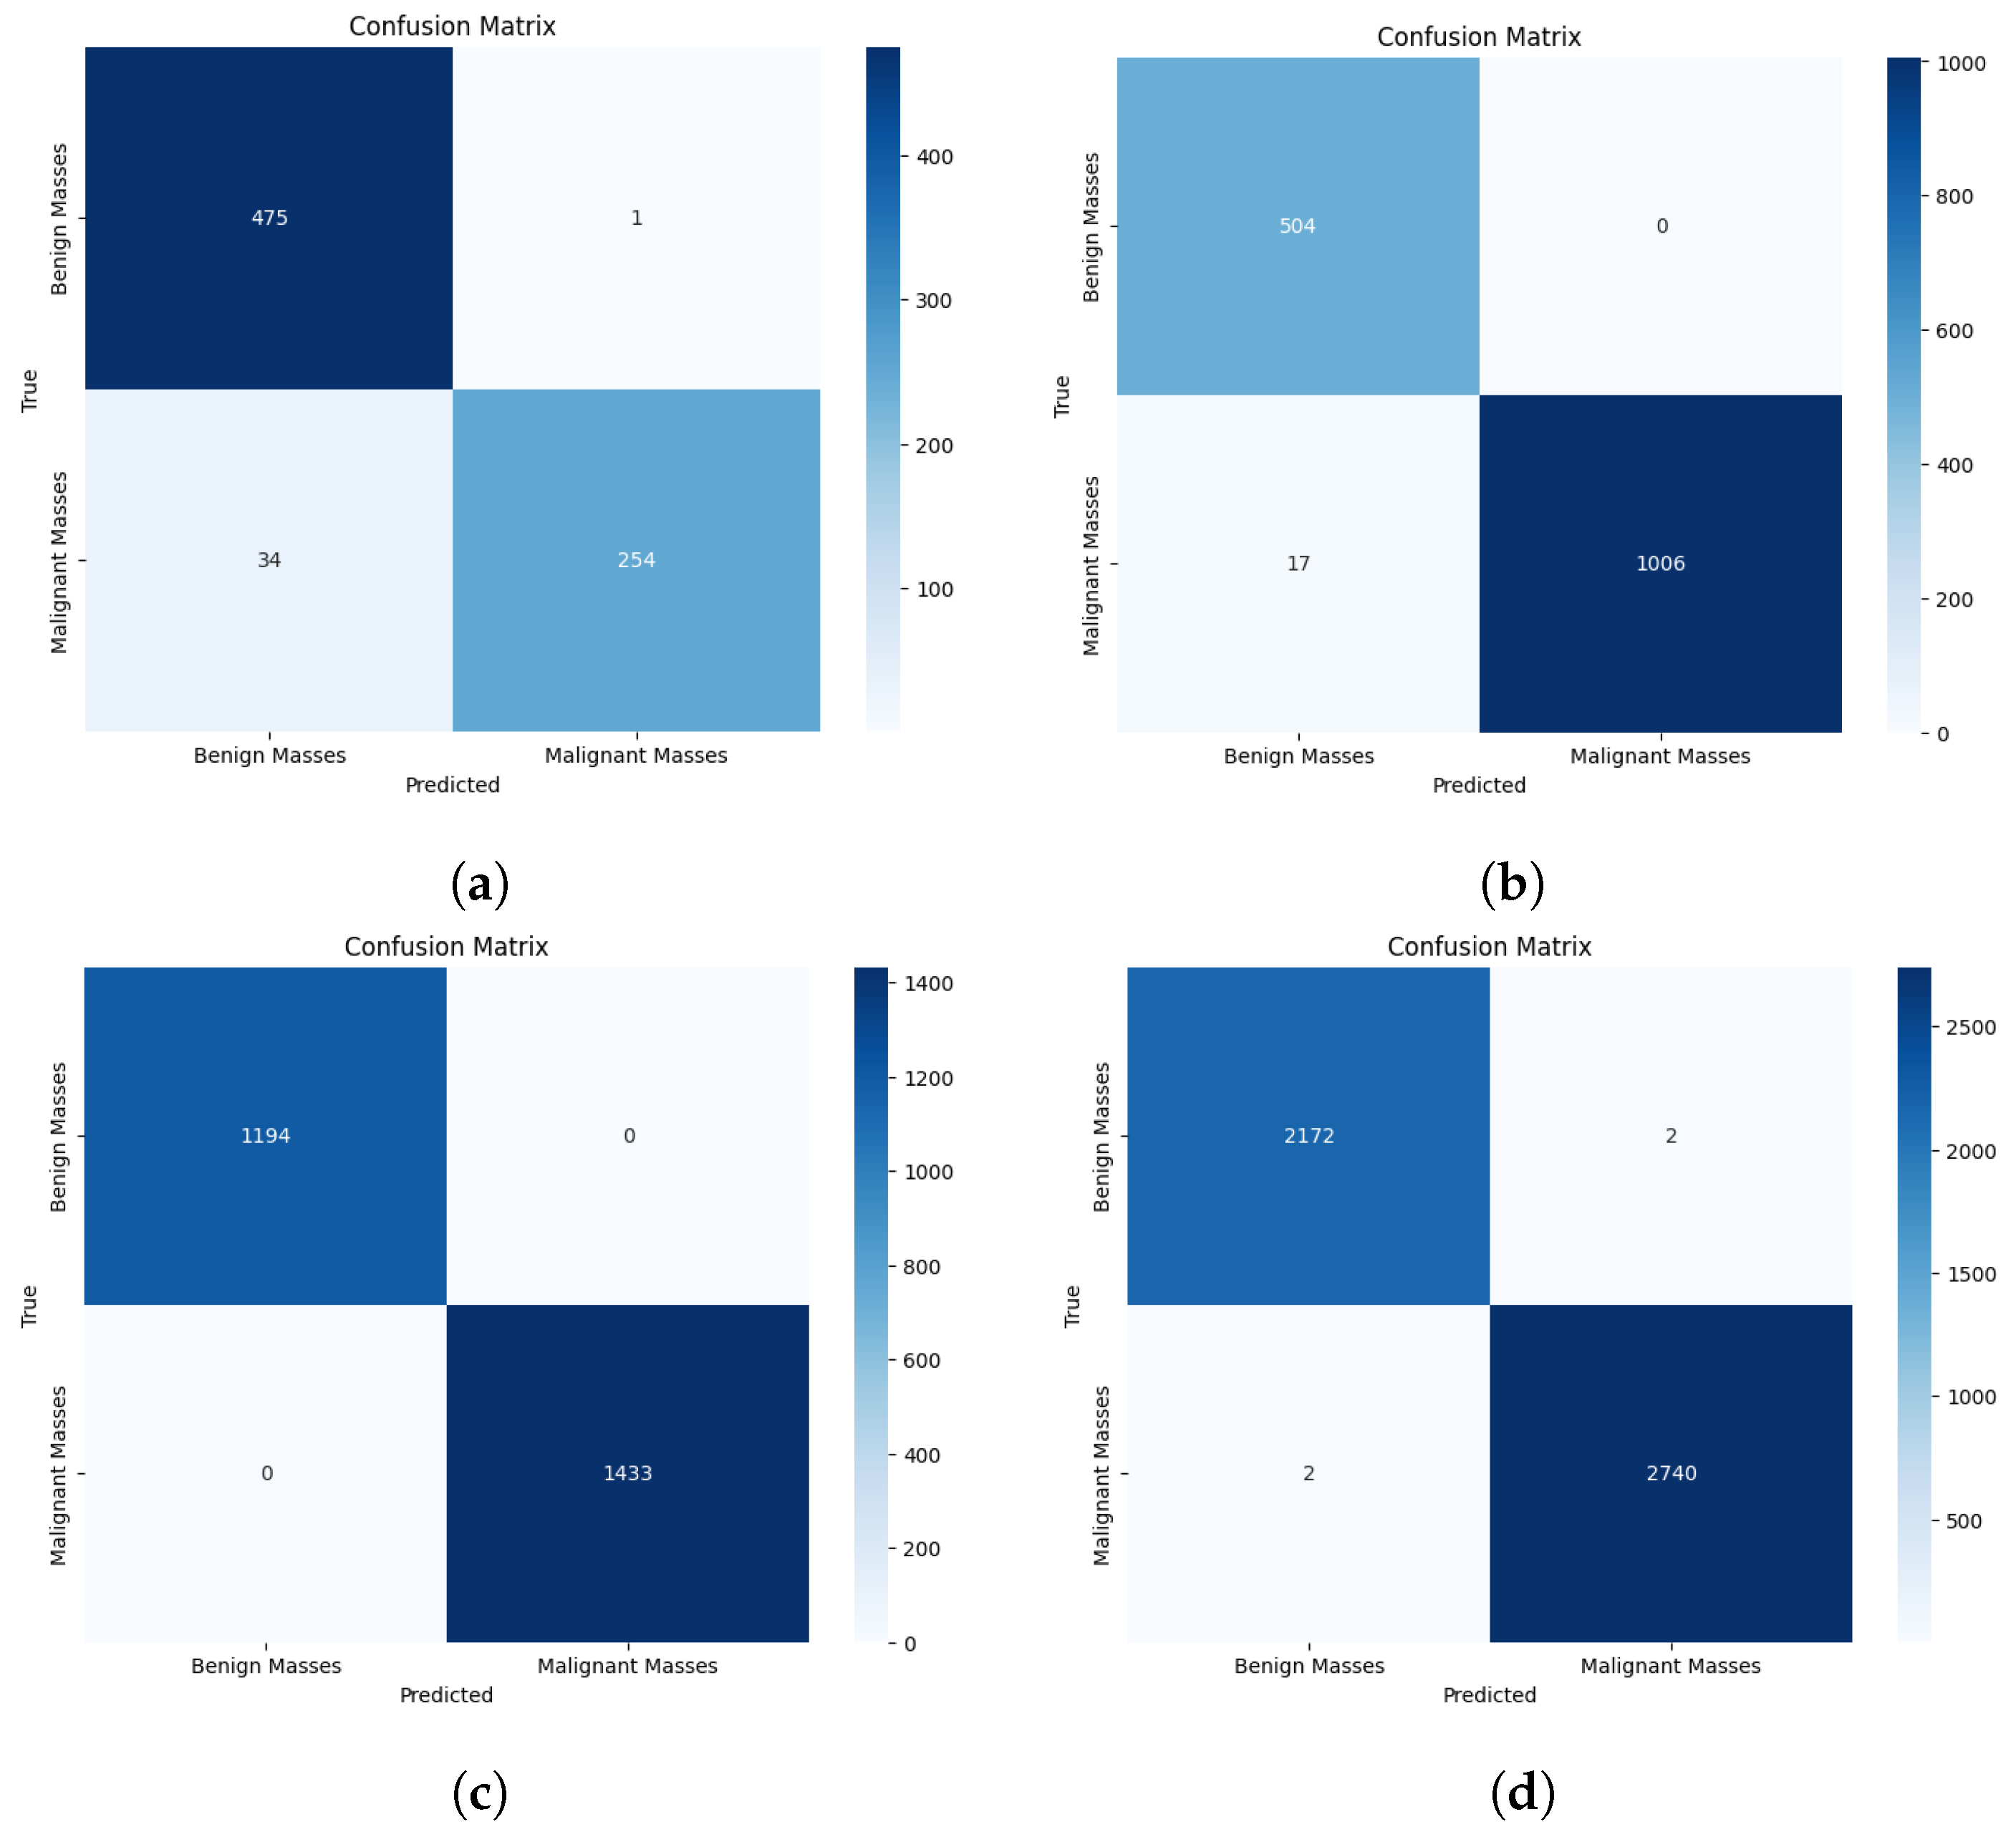
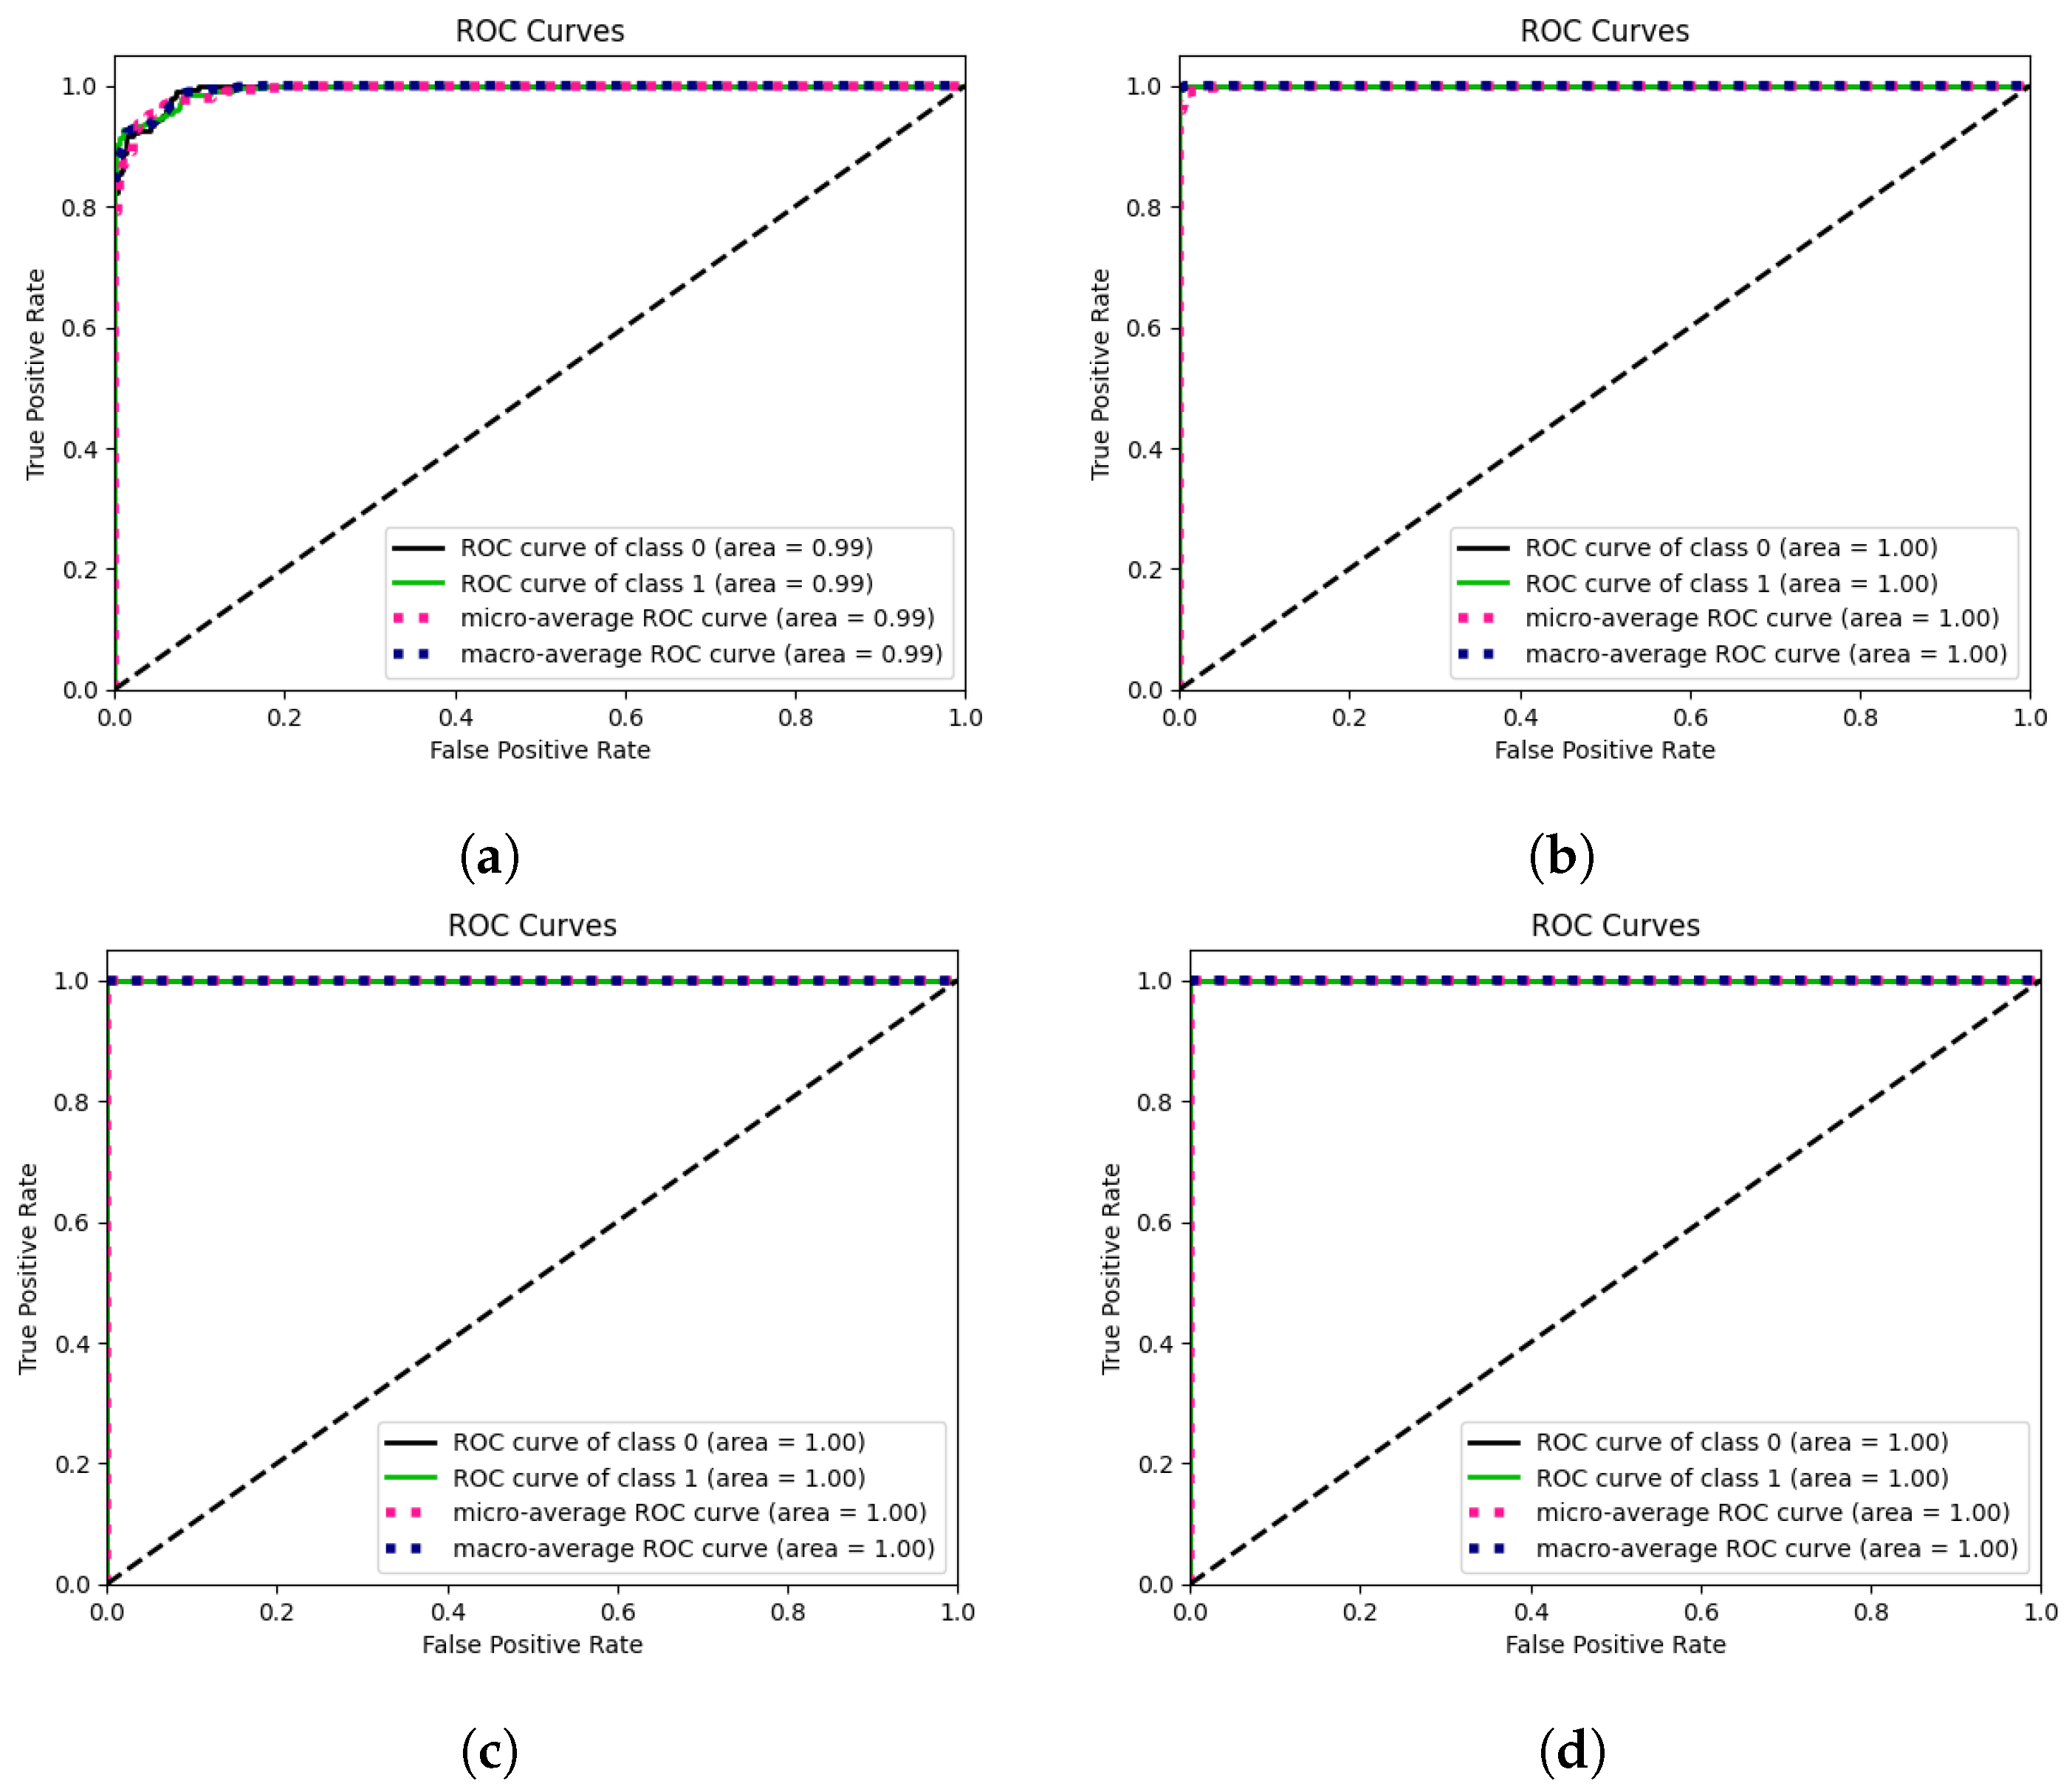
4.2.1. Binary Classification
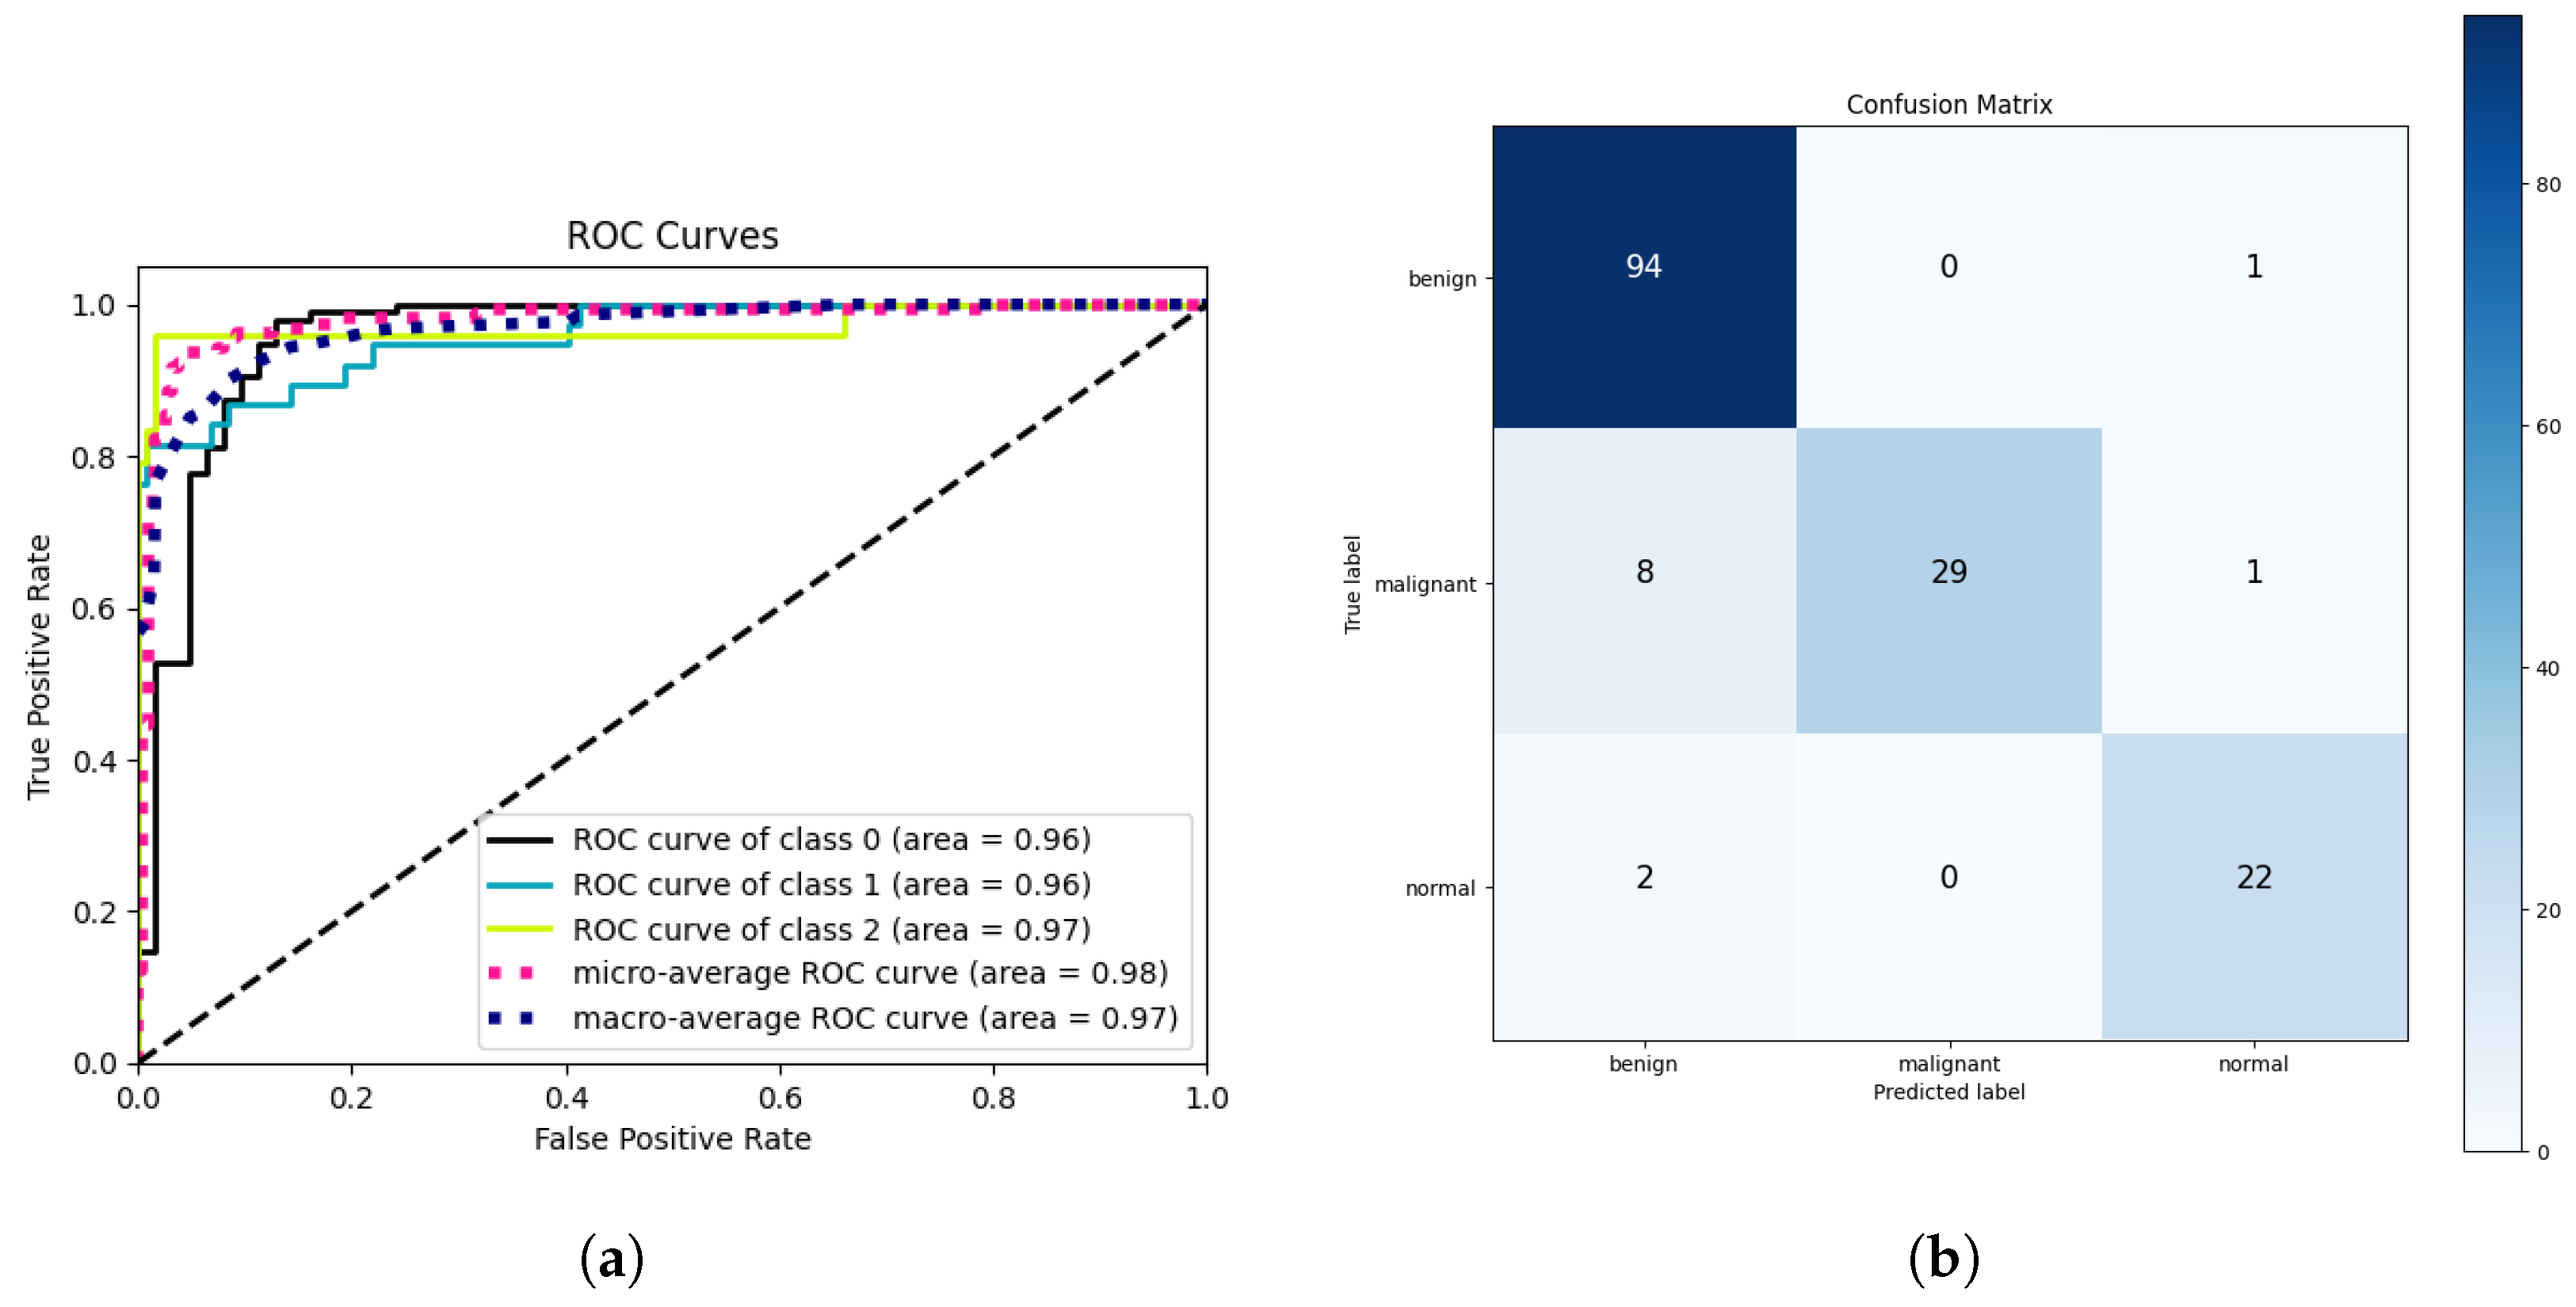
4.2.2. Cross-Modality Multi-Class Classification Results Using Ultrasound Images
5. Discussion
5.1. Comparison of Results before and after Using Attention Mechanism
| Dataset | Mean Av. Precision | Mean Av. Recall | Mean Av. Accuracy | Mean Av. ROC | Mean Av. Specificity | Mean Av. F1-Score |
|---|---|---|---|---|---|---|
| Without Attention | ||||||
| Inbreast | 0.810 | 0.777 | 0.777 | 0.888 | 0.777 | 0.793 |
| MIAS | 0.867 | 0.867 | 0.867 | 0.932 | 0.867 | 0.867 |
| CBIS-DDSM | 0.985 | 0.984 | 0.984 | 0.999 | 0.984 | 0.984 |
| CIM | 0.989 | 0.989 | 0.989 | 0.998 | 0.989 | 0.989 |
| With Attention 1 | ||||||
| Inbreast | 0.989 | 0.988 | 0.988 | 0.999 | 0.988 | 0.989 |
| MIAS | 0.956 | 0.954 | 0.954 | 0.994 | 0.954 | 0.955 |
| CBIS-DDSM | 0.999 | 0.999 | 0.999 | 0.999 | 0.999 | 0.999 |
| CIM | 0.999 | 0.999 | 0.999 | 0.999 | 0.999 | 0.999 |


5.2. Cross-Modality Multi-Class Classification Results Using Breast Ultrasound Dataset
6. Conclusions
Author Contributions
Funding
Institutional Review Board Statement
Informed Consent Statement
Data Availability Statement
Conflicts of Interest
References
- Bianconi, E.; Piovesan, A.; Facchin, F.; Beraudi, A.; Casadei, R.; Frabetti, F.; Vitale, L.; Pelleri, M.C.; Tassani, S.; Piva, F.; et al. An estimation of the number of cells in the human body. Ann. Hum. Biol. 2013, 40, 463–471. [Google Scholar] [CrossRef] [PubMed]
- Sciencefocus. What Cells in the Human Body Live the Longest? Available online: http://www.sciencefocus.com/the-human-body/what-cells-in-the-human-body-live-the-longest/ (accessed on 4 April 2020).
- Cancercenter. What Is Cancer? Available online: https://www.cancercenter.com/what-is-cancer (accessed on 26 December 2019).
- Ferlay, J.; Ervik, M.; Lam, F.; Laversanne, M.; Colombet, M.; Mery, L. Global Cancer Observatory: Cancer Today, Version 1.1; International Agency for Research on Cancer: Lyon, France, 2024; Available online: https://gco.iarc.who.int/today (accessed on 23 March 2024).
- Naeem, O.B.; Saleem, Y.; Khan, M.; Khan, A.R.; Saba, T.; Bahaj, S.A.; Ayesha, N. Breast Mammograms Diagnosis Using Deep Learning: State of Art Tutorial Review. In Archives of Computational Methods in Engineering; Springer: Berlin, Germany, 2024; pp. 1–19. [Google Scholar]
- Ahmed, L.; Iqbal, M.M.; Aldabbas, H.; Khalid, S.; Saleem, Y.; Saeed, S. Images data practices for semantic segmentation of breast cancer using deep neural network. J. Ambient. Intell. Humaniz. Comput. 2023, 14, 15227–15243. [Google Scholar] [CrossRef]
- International Agency for Research on Cancer. Global Cancer Observatory; International Agency for Research on Cancer: Lyon, France, 2018. [Google Scholar]
- Ferlay, J.; Ervik, M.; Lam, F.; Colombet, M.; Mery, L.; Piñeros, M.; Znaor, A.; Soerjomataram, I.; Bray, F. Global Cancer Observatory: Cancer Today; International Agency for Research on Cancer: Lyon, France, 2020. [Google Scholar]
- Heenaye-Mamode Khan, M.; Boodoo-Jahangeer, N.; Dullull, W.; Nathire, S.; Gao, X.; Sinha, G.; Nagwanshi, K.K. Multi-class classification of breast cancer abnormalities using Deep Convolutional Neural Network (CNN). PLoS ONE 2021, 16, e0256500. [Google Scholar] [CrossRef]
- Hinton, B.; Ma, L.; Mahmoudzadeh, A.P.; Malkov, S.; Fan, B.; Greenwood, H.; Joe, B.; Lee, V.; Kerlikowske, K.; Shepherd, J. Deep learning networks find unique mammographic differences in previous negative mammograms between interval and screen-detected cancers: A case-case study. Cancer Imaging 2019, 19, 41. [Google Scholar] [CrossRef]
- Arefan, D.; Mohamed, A.A.; Berg, W.A.; Zuley, M.L.; Sumkin, J.H.; Wu, S. Deep learning modeling using normal mammograms for predicting breast cancer risk. Med. Phys. 2020, 47, 110–118. [Google Scholar] [CrossRef]
- Al-Antari, M.A.; Al-Masni, M.A.; Kim, T.S. Deep learning computer-aided diagnosis for breast lesion in digital mammogram. In Deep Learning in Medical Image Analysis: Challenges and Applications; Springer: Berlin, Germany, 2020; pp. 59–72. [Google Scholar]
- Yu, X.; Pang, W.; Xu, Q.; Liang, M. Mammographic image classification with deep fusion learning. Sci. Rep. 2020, 10, 14361. [Google Scholar] [CrossRef]
- Shen, L.; Margolies, L.R.; Rothstein, J.H.; Fluder, E.; McBride, R.; Sieh, W. Deep learning to improve breast cancer detection on screening mammography. Sci. Rep. 2019, 9, 12495. [Google Scholar] [CrossRef]
- Carneiro, G.; Nascimento, J.; Bradley, A.P. Unregistered multiview mammogram analysis with pre-trained deep learning models. In Proceedings of the International Conference on Medical Image Computing and Computer-Assisted Intervention, Munich, Germany, 5–9 October 2015; Springer: Berlin/Heidelberg, Germany, 2015; pp. 652–660. [Google Scholar]
- Carneiro, G.; Nascimento, J.; Bradley, A.P. Automated analysis of unregistered multi-view mammograms with deep learning. IEEE Trans. Med. Imaging 2017, 36, 2355–2365. [Google Scholar] [CrossRef]
- Wu, N.; Phang, J.; Park, J.; Shen, Y.; Huang, Z.; Zorin, M.; Jastrzębski, S.; Févry, T.; Katsnelson, J.; Kim, E.; et al. Deep neural networks improve radiologists’ performance in breast cancer screening. IEEE Trans. Med. Imaging 2019, 39, 1184–1194. [Google Scholar] [CrossRef]
- Shu, X.; Zhang, L.; Wang, Z.; Lv, Q.; Yi, Z. Deep neural networks with region-based pooling structures for mammographic image classification. IEEE Trans. Med. Imaging 2020, 39, 2246–2255. [Google Scholar] [CrossRef]
- Zhang, F.; Luo, L.; Sun, X.; Zhou, Z.; Li, X.; Yu, Y.; Wang, Y. Cascaded generative and discriminative learning for microcalcification detection in breast mammograms. In Proceedings of the IEEE/CVF Conference on Computer Vision and Pattern Recognition, Long Beach, CA, USA, 15–20 June 2019; pp. 12578–12586. [Google Scholar]
- Liu, W.; Wen, Y.; Yu, Z.; Li, M.; Raj, B.; Song, L. Sphereface: Deep hypersphere embedding for face recognition. In Proceedings of the IEEE Conference on Computer Vision and Pattern Recognition, Honolulu, HI, USA, 21–26 July 2017; pp. 212–220. [Google Scholar]
- Deng, J.; Guo, J.; Xue, N.; Zafeiriou, S. Arcface: Additive angular margin loss for deep face recognition. In Proceedings of the IEEE/CVF Conference on Computer Vision and Pattern Recognition, Long Beach, CA, USA, 15–20 June 2019; pp. 4690–4699. [Google Scholar]
- Wang, H.; Wang, Y.; Zhou, Z.; Ji, X.; Gong, D.; Zhou, J.; Li, Z.; Liu, W. Cosface: Large margin cosine loss for deep face recognition. In Proceedings of the IEEE Conference on Computer Vision and Pattern Recognition, Salt Lake City, UT, USA, 18–22 June 2018; pp. 5265–5274. [Google Scholar]
- Wang, Y.; Wang, Z.; Feng, Y.; Zhang, L. WDCCNet: Weighted Double-Classifier Constraint Neural Network for Mammographic Image Classification. IEEE Trans. Med. Imaging 2022, 41, 559–570. [Google Scholar] [CrossRef] [PubMed]
- Leibig, C.; Allken, V.; Ayhan, M.S.; Berens, P.; Wahl, S. Leveraging uncertainty information from deep neural networks for disease detection. Sci. Rep. 2017, 7, 17816. [Google Scholar] [CrossRef] [PubMed]
- Carneiro, G.; Pu, L.Z.C.T.; Singh, R.; Burt, A. Deep learning uncertainty and confidence calibration for the five-class polyp classification from colonoscopy. Med. Image Anal. 2020, 62, 101653. [Google Scholar] [CrossRef] [PubMed]
- Kaur, P.; Singh, G.; Kaur, P. Intellectual detection and validation of automated mammogram breast cancer images by multi-class SVM using deep learning classification. Inform. Med. Unlocked 2019, 16, 100151. [Google Scholar] [CrossRef]
- Sannasi Chakravarthy, S.R.; Bharanidharan, N.; Rajaguru, H. Multi-Deep CNN based Experimentations for Early Diagnosis of Breast Cancer. IETE J. Res. 2023, 69, 7326–7341. [Google Scholar] [CrossRef]
- He, K.; Gan, C.; Li, Z.; Rekik, I.; Yin, Z.; Ji, W.; Gao, Y.; Wang, Q.; Zhang, J.; Shen, D. Transformers in medical image analysis. Intell. Med. 2023, 3, 59–78. [Google Scholar] [CrossRef]
- Wang, J.; Lu, L.; Zhang, Z.; Slam, N. A novel deep convolution neural network model for ct image classification based on covid-19. In Proceedings of the 2022 3rd International Conference on Computer Vision, Image and Deep Learning & International Conference on Computer Engineering and Applications (CVIDL & ICCEA), Changchun, China, 20–22 May 2022; IEEE: Piscataway, NJ, USA, 2022; pp. 15–20. [Google Scholar]
- Deeb, A.; Debow, A.; Mansour, S.; Shkodyrev, V. COVID-19 diagnosis with Deep Learning: Adjacent-pooling CTScan-COVID-19 Classifier Based on ResNet and CBAM. Biomed. Signal Process. Control 2023, 86, 105285. [Google Scholar] [CrossRef]
- Naveed, A.; Naqvi, S.S.; Khan, T.M.; Razzak, I. PCA: Progressive class-wise attention for skin lesions diagnosis. Eng. Appl. Artif. Intell. 2024, 127, 107417. [Google Scholar] [CrossRef]
- Loizidou, K.; Elia, R.; Pitris, C. Computer-aided breast cancer detection and classification in mammography: A comprehensive review. Comput. Biol. Med. 2023, 153, 106554. [Google Scholar] [CrossRef]
- Zou, L.; Yu, S.; Meng, T.; Zhang, Z.; Liang, X.; Xie, Y. A technical review of convolutional neural network-based mammographic breast cancer diagnosis. Comput. Math. Methods Med. 2019, 2019, 6509357. [Google Scholar] [CrossRef]
- Niu, J.; Li, H.; Zhang, C.; Li, D. Multi-scale attention-based convolutional neural network for classification of breast masses in mammograms. Med. Phys. 2021, 48, 3878–3892. [Google Scholar] [CrossRef] [PubMed]
- Lou, Q.; Li, Y.; Qian, Y.; Lu, F.; Ma, J. Mammogram classification based on a novel convolutional neural network with efficient channel attention. Comput. Biol. Med. 2022, 150, 106082. [Google Scholar] [CrossRef] [PubMed]
- Alshehri, A.; AlSaeed, D. Breast cancer detection in thermography using convolutional neural networks (cnns) with deep attention mechanisms. Appl. Sci. 2022, 12, 12922. [Google Scholar] [CrossRef]
- Rashed, E.; El Seoud, M.S.A. Deep learning approach for breast cancer diagnosis. In Proceedings of the 8th International Conference on Software and Information Engineering, Cairo, Egypt, 9–12 April 2019; pp. 243–247. [Google Scholar]
- Montelius, L.; Rezkalla, G. Providing Mass Context to a Pretrained Deep Convolutional Neural Network for Breast Mass Classification, 2019, Thesis. Available online: https://kth.diva-portal.org/smash/record.jsf?pid=diva2%3A1354169&dswid=-9683 (accessed on 1 July 2024).
- Ragab, D.A.; Sharkas, M.; Marshall, S.; Ren, J. Breast cancer detection using deep convolutional neural networks and support vector machines. PeerJ 2019, 7, e6201. [Google Scholar] [CrossRef]
- Kumar, A.; Mukherjee, S.; Luhach, A.K. Deep learning with perspective modeling for early detection of malignancy in mammograms. J. Discret. Math. Sci. Cryptogr. 2019, 22, 627–643. [Google Scholar] [CrossRef]
- Gao, Y.; Geras, K.J.; Lewin, A.A.; Moy, L. New frontiers: An update on computer-aided diagnosis for breast imaging in the age of artificial intelligence. AJR Am. J. Roentgenol. 2019, 212, 300. [Google Scholar] [CrossRef]
- Falconí, L.G.; Pérez, M.; Aguilar, W.G. Transfer learning in breast mammogram abnormalities classification with mobilenet and nasnet. In Proceedings of the 2019 International Conference on Systems, Signals and Image Processing (IWSSIP), Osijek, Croatia, 5–7 June 2019; IEEE: Piscataway, NJ, USA, 2019; pp. 109–114. [Google Scholar]
- Abdelhafiz, D.; Yang, C.; Ammar, R.; Nabavi, S. Deep convolutional neural networks for mammography: Advances, challenges and applications. BMC Bioinform. 2019, 20, 281. [Google Scholar] [CrossRef]
- Tsochatzidis, L.; Costaridou, L.; Pratikakis, I. Deep learning for breast cancer diagnosis from mammograms—A comparative study. J. Imaging 2019, 5, 37. [Google Scholar] [CrossRef]
- Rampun, A.; López-Linares, K.; Morrow, P.J.; Scotney, B.W.; Wang, H.; Ocaña, I.G.; Maclair, G.; Zwiggelaar, R.; Ballester, M.A.G.; Macía, I. Breast pectoral muscle segmentation in mammograms using a modified holistically-nested edge detection network. Med. Image Anal. 2019, 57, 1–17. [Google Scholar] [CrossRef]
- Xi, P.; Shu, C.; Goubran, R. A Unified Deep Learning Framework for Multi-Modal Multi-Dimensional Data. In Proceedings of the 2019 IEEE International Symposium on Medical Measurements and Applications (MeMeA), Istanbul, Turkey, 26–28 June 2019; IEEE: Piscataway, NJ, USA, 2019; pp. 1–6. [Google Scholar]
- Ting, F.F.; Tan, Y.J.; Sim, K.S. Convolutional neural network improvement for breast cancer classification. Expert Syst. Appl. 2019, 120, 103–115. [Google Scholar] [CrossRef]
- Panda, S.; Jangid, M. Improving the model performance of deep convolutional neural network in MURA dataset. In Proceedings of the Smart Systems and IoT: Innovations in Computing: Proceeding of SSIC 2019; Springer: Singapore, 2020; pp. 531–541. [Google Scholar]
- Li, C.; Wang, X.; Liu, W.; Latecki, L.J.; Wang, B.; Huang, J. Weakly supervised mitosis detection in breast histopathology images using concentric loss. Med. Image Anal. 2019, 53, 165–178. [Google Scholar] [CrossRef] [PubMed]
- Chougrad, H.; Zouaki, H.; Alheyane, O. Multi-label transfer learning for the early diagnosis of breast cancer. Neurocomputing 2020, 392, 168–180. [Google Scholar] [CrossRef]
- Castro, E.; Pereira, J.C.; Cardoso, J.S. Weight Rotation as a Regularization Strategy in Convolutional Neural Networks. In Proceedings of the 2019 41st Annual International Conference of the IEEE Engineering in Medicine and Biology Society (EMBC), Berlin, Germany, 23–27 July 2019; IEEE: Piscataway, NJ, USA, 2019; pp. 2106–2110. [Google Scholar]
- Rampun, A.; Wang, H.; Scotney, B.; Morrow, P.; Zwiggelaar, R. Classification of mammographic microcalcification clusters with machine learning confidence levels. In Proceedings of the 14th International Workshop on Breast Imaging (IWBI 2018), Atlanta, GA, USA, 8–11 July 2018; SPIE: Kuala Lumpur, Malaysia, 2018; Volume 10718, pp. 345–352. [Google Scholar]
- Tan, M.; Le, Q. Efficientnet: Rethinking model scaling for convolutional neural networks. In Proceedings of the International Conference on Machine Learning, Long Beach, CA, USA, 9–15 June 2019; PMLR; 2019. pp. 6105–6114. [Google Scholar]
- Huang, G.; Liu, Z.; Van Der Maaten, L.; Weinberger, K.Q. Densely connected convolutional networks. In Proceedings of the IEEE Conference on Computer Vision and Pattern Recognition, Honolulu, HI, USA, 21–26 July 2017; pp. 4700–4708. [Google Scholar]
- He, K.; Zhang, X.; Ren, S.; Sun, J. Deep residual learning for image recognition. In Proceedings of the IEEE Conference on Computer Vision and Pattern Recognition, Las Vegas, NV, USA, 27–30 June 2016; pp. 770–778. [Google Scholar]
- Szegedy, C.; Ioffe, S.; Vanhoucke, V.; Alemi, A. Inception-v4, inception-resnet and the impact of residual connections on learning. In Proceedings of the AAAI conference on artificial intelligence, San Francisco, CA, USA, 4–9 February 2017; Volume 31. [Google Scholar]
- Woo, S.; Park, J.; Lee, J.Y.; Kweon, I.S. Cbam: Convolutional block attention module. In Proceedings of the European Conference on Computer Vision (ECCV), Munich, Germany, 8–14 September 2018; pp. 3–19. [Google Scholar]
- Moreira, I.C.; Amaral, I.; Domingues, I.; Cardoso, A.; Cardoso, M.J.; Cardoso, J.S. Inbreast: Toward a full-field digital mammographic database. Acad. Radiol. 2012, 19, 236–248. [Google Scholar] [CrossRef]
- Suckling, J.; Parker, J.; Dance, D.; Astley, S.; Hutt, I.; Boggis, C.; Ricketts, I.; Stamatakis, E.; Cerneaz, N.; Kok, S.; et al. Mammographic Image Analysis Society (Mias) Database v1. 21; Apollo—University of Cambridge Repository: Cambridge, UK, 2015. [Google Scholar]
- Sawyer-Lee, R.; Gimenez, F.; Hoogi, A.; Rubin, D. Curated Breast Imaging Subset of Digital Database for Screening Mammography (CBIS-DDSM) [Data set]. The Cancer Imaging Archive. 2016. Available online: https://www.cancerimagingarchive.net/collection/cbis-ddsm/ (accessed on 1 July 2024).
- Huang, M.L.; Lin, T.Y. Dataset of breast mammography images with masses. Data Brief 2020, 31, 105928. [Google Scholar] [CrossRef]
- Al-Dhabyani, W.; Gomaa, M.; Khaled, H.; Fahmy, A. Dataset of breast ultrasound images. Data Brief 2020, 28, 104863. [Google Scholar] [CrossRef]
- Lin, T.Y.; Goyal, P.; Girshick, R.; He, K.; Dollár, P. Focal loss for dense object detection. In Proceedings of the IEEE International Conference on Computer Vision, Venice, Italy, 22–29 October 2017; pp. 2980–2988. [Google Scholar]
- Grandini, M.; Bagli, E.; Visani, G. Metrics for multi-class classification: An overview. arXiv 2020, arXiv:2008.05756. [Google Scholar]

| Dataset | Classes | Class Names | Total Images | Benign | Malignant |
|---|---|---|---|---|---|
| INbreast | 2 | BM/MM | 7632 | 2520 | 5112 |
| MIAS | 2 | BM/MM | 3816 | 2376 | 1440 |
| CIM 1 | 2 | BM/MM | 24,576 | 10,866 | 13,710 |
| CBIS-DDSM | 2 | BM/MM 2 | 13,128 | 5970 | 7158 |
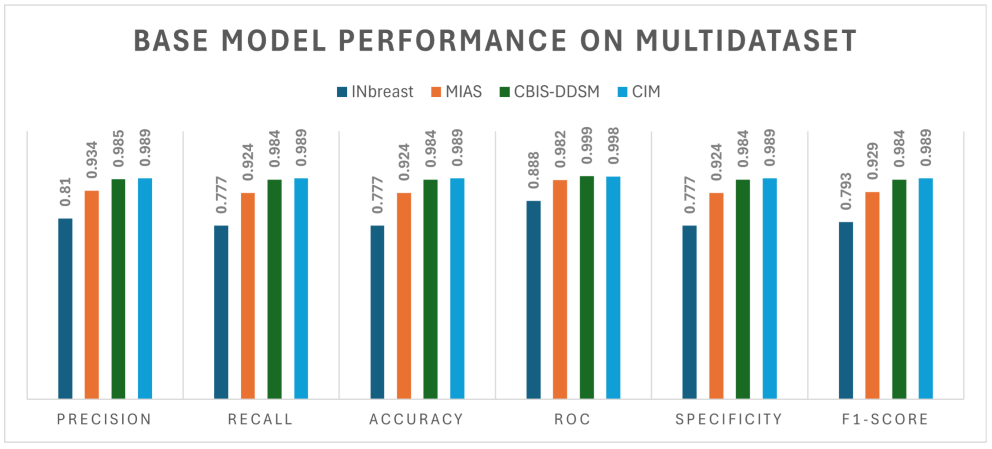
| Dataset | Classes | Class Names | Precision | Recall | Accuracy | ROC | Specificity |
|---|---|---|---|---|---|---|---|
| INbreast | 2 | BM/MM 2 | 0.810 | 0.777 | 0.777 | 0.888 | 0.777 |
| MIAS | 2 | BM/MM | 0.934 | 0.924 | 0.924 | 0.982 | 0.924 |
| CBIS-DDSM | 2 | BM/MM | 0.985 | 0.984 | 0.984 | 0.999 | 0.984 |
| CIM 1 | 2 | BM/MM | 0.989 | 0.989 | 0.989 | 0.998 | 0.989 |
| Citation | Dataset | Precision | Recall | Accuracy | ROC | Specificity | F1-Score |
|---|---|---|---|---|---|---|---|
| SphereFace [20] | INbreast | 0.864 | 0.766 | 0.912 | 0.923 | - | 0.809 |
| ArcFace [21] | INbreast | 0.871 | 0.738 | 0.912 | 0.914 | - | 0.796 |
| NSL [22] | INbreast | 0.839 | 0.778 | 0.905 | 0.924 | - | 0.797 |
| DCC [23] | INbreast | 0.814 | 0.833 | 0.912 | 0.940 | - | 0.822 |
| WDCC [23] | INbreast | 0.896 | 0.832 | 0.934 | 0.947 | - | 0.859 |
| CBAM-Res2Net [34] | INbreast/DDSM | - | 0.931 | 0.933 | 0.923 | - | - |
| ECA-Net50 [35] | INbreast | 0.883 | 0.928 | 0.929 | 0.960 | - | - |
| CNN-SL [36] | DMR-IR | 0.991 | 0.995 | 0.993 | 0.999 | 0.995 | 0.993 |
| CNN-HD [36] | DMR-IR | 0.992 | 0.997 | 0.994 | 0.999 | 0.997 | 0.994 |
| CNN-SF [36] | DMR-IR | 0.995 | 0.992 | 0.993 | 0.999 | 0.992 | 0.993 |
| CSA-Net | INbreast | 0.989 | 0.988 | 0.988 | 0.999 | 0.988 | 0.989 |
| CSA-Net | MIAS | 0.956 | 0.954 | 0.954 | 0.994 | 0.954 | 0.955 |
| CSA-Net | CBIS-DDSM | 0.999 | 0.999 | 0.999 | 0.999 | 0.999 | 0.999 |
| CSA-Net | CIM | 0.999 | 0.999 | 0.999 | 0.999 | 0.999 | 0.999 |
| Dataset | Classes | Precision | Recall | Accuracy | ROC | Specificity | F1-Score |
|---|---|---|---|---|---|---|---|
| Breast Ultrasound | 3 | 0.929 | 0.923 | 0.923 | 0.960 | 0.961 | 0.921 |
Disclaimer/Publisher’s Note: The statements, opinions and data contained in all publications are solely those of the individual author(s) and contributor(s) and not of MDPI and/or the editor(s). MDPI and/or the editor(s) disclaim responsibility for any injury to people or property resulting from any ideas, methods, instructions or products referred to in the content. |
© 2024 by the authors. Licensee MDPI, Basel, Switzerland. This article is an open access article distributed under the terms and conditions of the Creative Commons Attribution (CC BY) license (https://creativecommons.org/licenses/by/4.0/).
Share and Cite
Naeem, O.B.; Saleem, Y. CSA-Net: Channel and Spatial Attention-Based Network for Mammogram and Ultrasound Image Classification. J. Imaging 2024, 10, 256. https://doi.org/10.3390/jimaging10100256
Naeem OB, Saleem Y. CSA-Net: Channel and Spatial Attention-Based Network for Mammogram and Ultrasound Image Classification. Journal of Imaging. 2024; 10(10):256. https://doi.org/10.3390/jimaging10100256
Chicago/Turabian StyleNaeem, Osama Bin, and Yasir Saleem. 2024. "CSA-Net: Channel and Spatial Attention-Based Network for Mammogram and Ultrasound Image Classification" Journal of Imaging 10, no. 10: 256. https://doi.org/10.3390/jimaging10100256
APA StyleNaeem, O. B., & Saleem, Y. (2024). CSA-Net: Channel and Spatial Attention-Based Network for Mammogram and Ultrasound Image Classification. Journal of Imaging, 10(10), 256. https://doi.org/10.3390/jimaging10100256