Abstract
Water bottles are widely used in the Gulf countries. One estimate indicates that the water bottle usage in the United Arab Emirates (UAE) may reach up to 250 L of water per person annually. Generally, the water bottles are made of polyethylene terephthalate (PET), a recyclable material. Because of the non-availability of a powerful incentive system, these recyclable water bottles are often disposed of in landfills. This paper proposes a feasibility study of building a Deposit–Refund System (DRS) to encourage the closed-loop recycling of 0.5 L PET water bottles in the UAE waste disposal system. Water bottles are collected by a reverse vending machine (RVM) and recycled to produce PET bottles, and the proposed system will reward consumers with 0.04 United Arab Emirates Dirham (AED) per deposited water bottle. Additionally, this study calculates the cost of 100% virgin polyethylene terephthalate (vPET) and 60% recycled polyethylene terephthalate (rPET) bottles based on the UAE population, data obtained from local water bottle companies, and existing research. Adopting this DRS will cut down on waste, protect the environment, improve the manufacturing process of water bottles, and boost the local economy.
1. Introduction
The Earth’s climate, air, and water have suffered critical consequences from the greenhouse gas (GHG) emissions generated by human activities. Among the results of human activities, waste is accumulated in landfills and decomposes into GHGs. The increased concern regarding this issue has pushed relevant authorities to work towards establishing recycling solutions. Recycling is converting waste into new products to reduce the GHG emissions generated from the production of virgin materials and waste accumulation in landfills. Different waste disposal policies have been initiated worldwide to minimize littering and encourage recycling instead. In general, the Middle East, and the UAE specifically, has become one of the focal points for research in the last few years [1,2,3,4,5,6,7,8,9,10]. In the UAE, incentives towards ensuring a cleaner environment have been vital, with an ultimate target of zero landfills. Immense efforts have been made in sorting and recycling waste using the existing policies in the UAE. However, the recycling rate of domestic waste in Dubai is still low, and was approximately 32% in the third quarter of 2018 [11]. Thus, a need for an efficient system to increase recycling rates arises. A Deposit–Refund System (DRS) is a waste disposal policy implemented in countries such as Sweden and Germany, where high recycling rates have been achieved [12]. In this system, an extra deposit or surcharge is placed on items, which will be given back to consumers once the items are returned after usage via a reverse vending machine (RVM).
A DRS results in the minimization of contamination in collected containers. Hence, they will be source-separated, resulting in less time, effort, and cost spent on cleaning and sorting [13]. Due to the geographical features and climate characteristics of the UAE as a hot desert zone, the UAE population has a high consumption of water bottles, especially 0.5 L bottles. Such bottles are made of polyethylene terephthalate (PET), a strong, clear, and lightweight thermoplastic made from crude oil. Plastic rubbish accumulates in landfills and starts sloughing off slowly in nature, taking a long time to degrade. Such landfills have a negative impact on the environment and need immediate attention. Therefore, this study aims to assess the feasibility of building and implementing a DRS for the closed-loop recycling of PET 0.5 L water bottles and evaluate how this will positively affect the UAE’s environment and landfill buildup. As the current prices of water bottles include the cost of the plastic bottle itself, the proposed system will not have an extra deposit on the price of the water bottles. Rather, a certain percentage of the cost of manufacturing the water bottle, which represents the material cost, will be refunded to consumers as a motivation for them to return the empty bottles. These bottles will be the input for closed-loop recycling in order to produce new water bottles that will be sold again on the market.
2. Literature Review
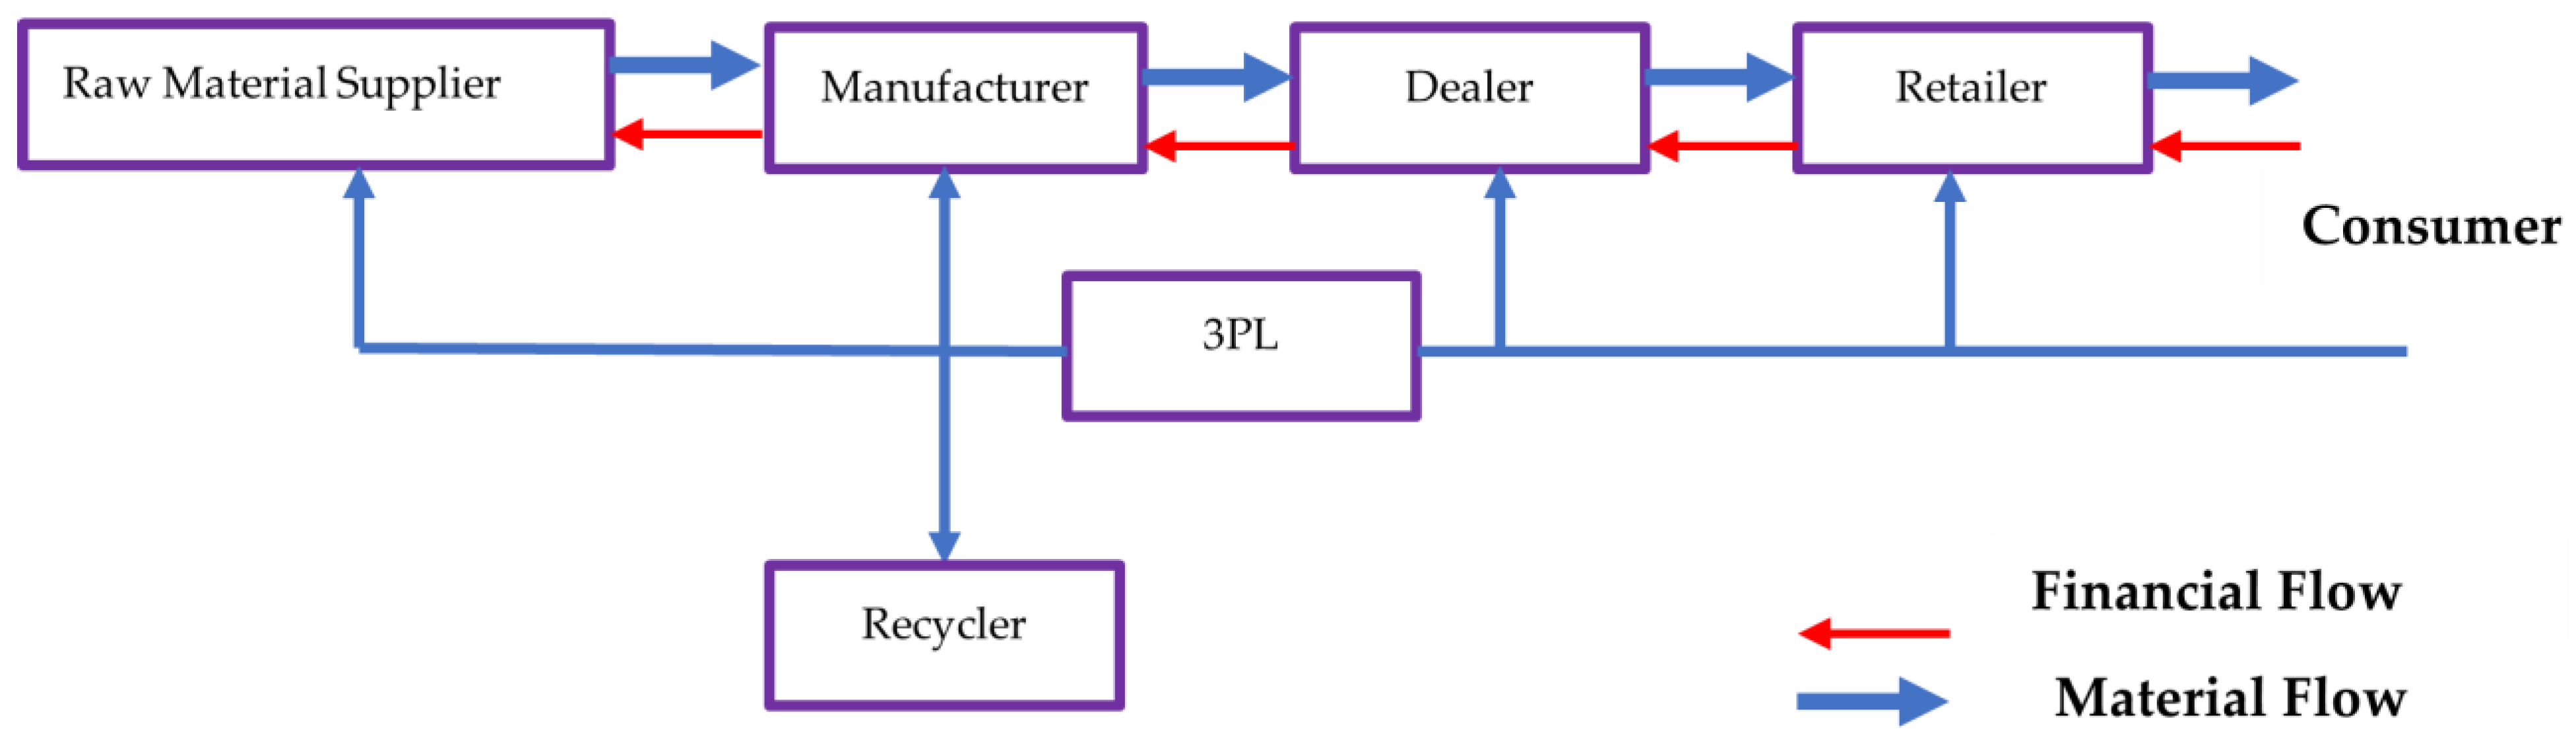
Reverse supply chain management can be invoked from consumers to the manufacturer/recycler through a third-party logistics (3PL) service provider to realize a DRS using RVMs. The close-loop forward supply chain management from raw material supplier to consumer, and in the reverse direction for recycling, is shown in Figure 1.
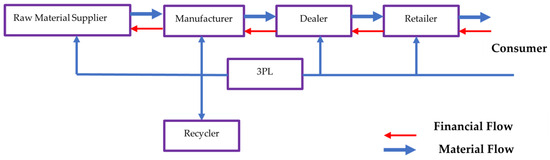
Figure 1.
Close-loop forward/reverse supply chain of water bottles for recycling.
2.1. Deposit–Refund System (DRS)
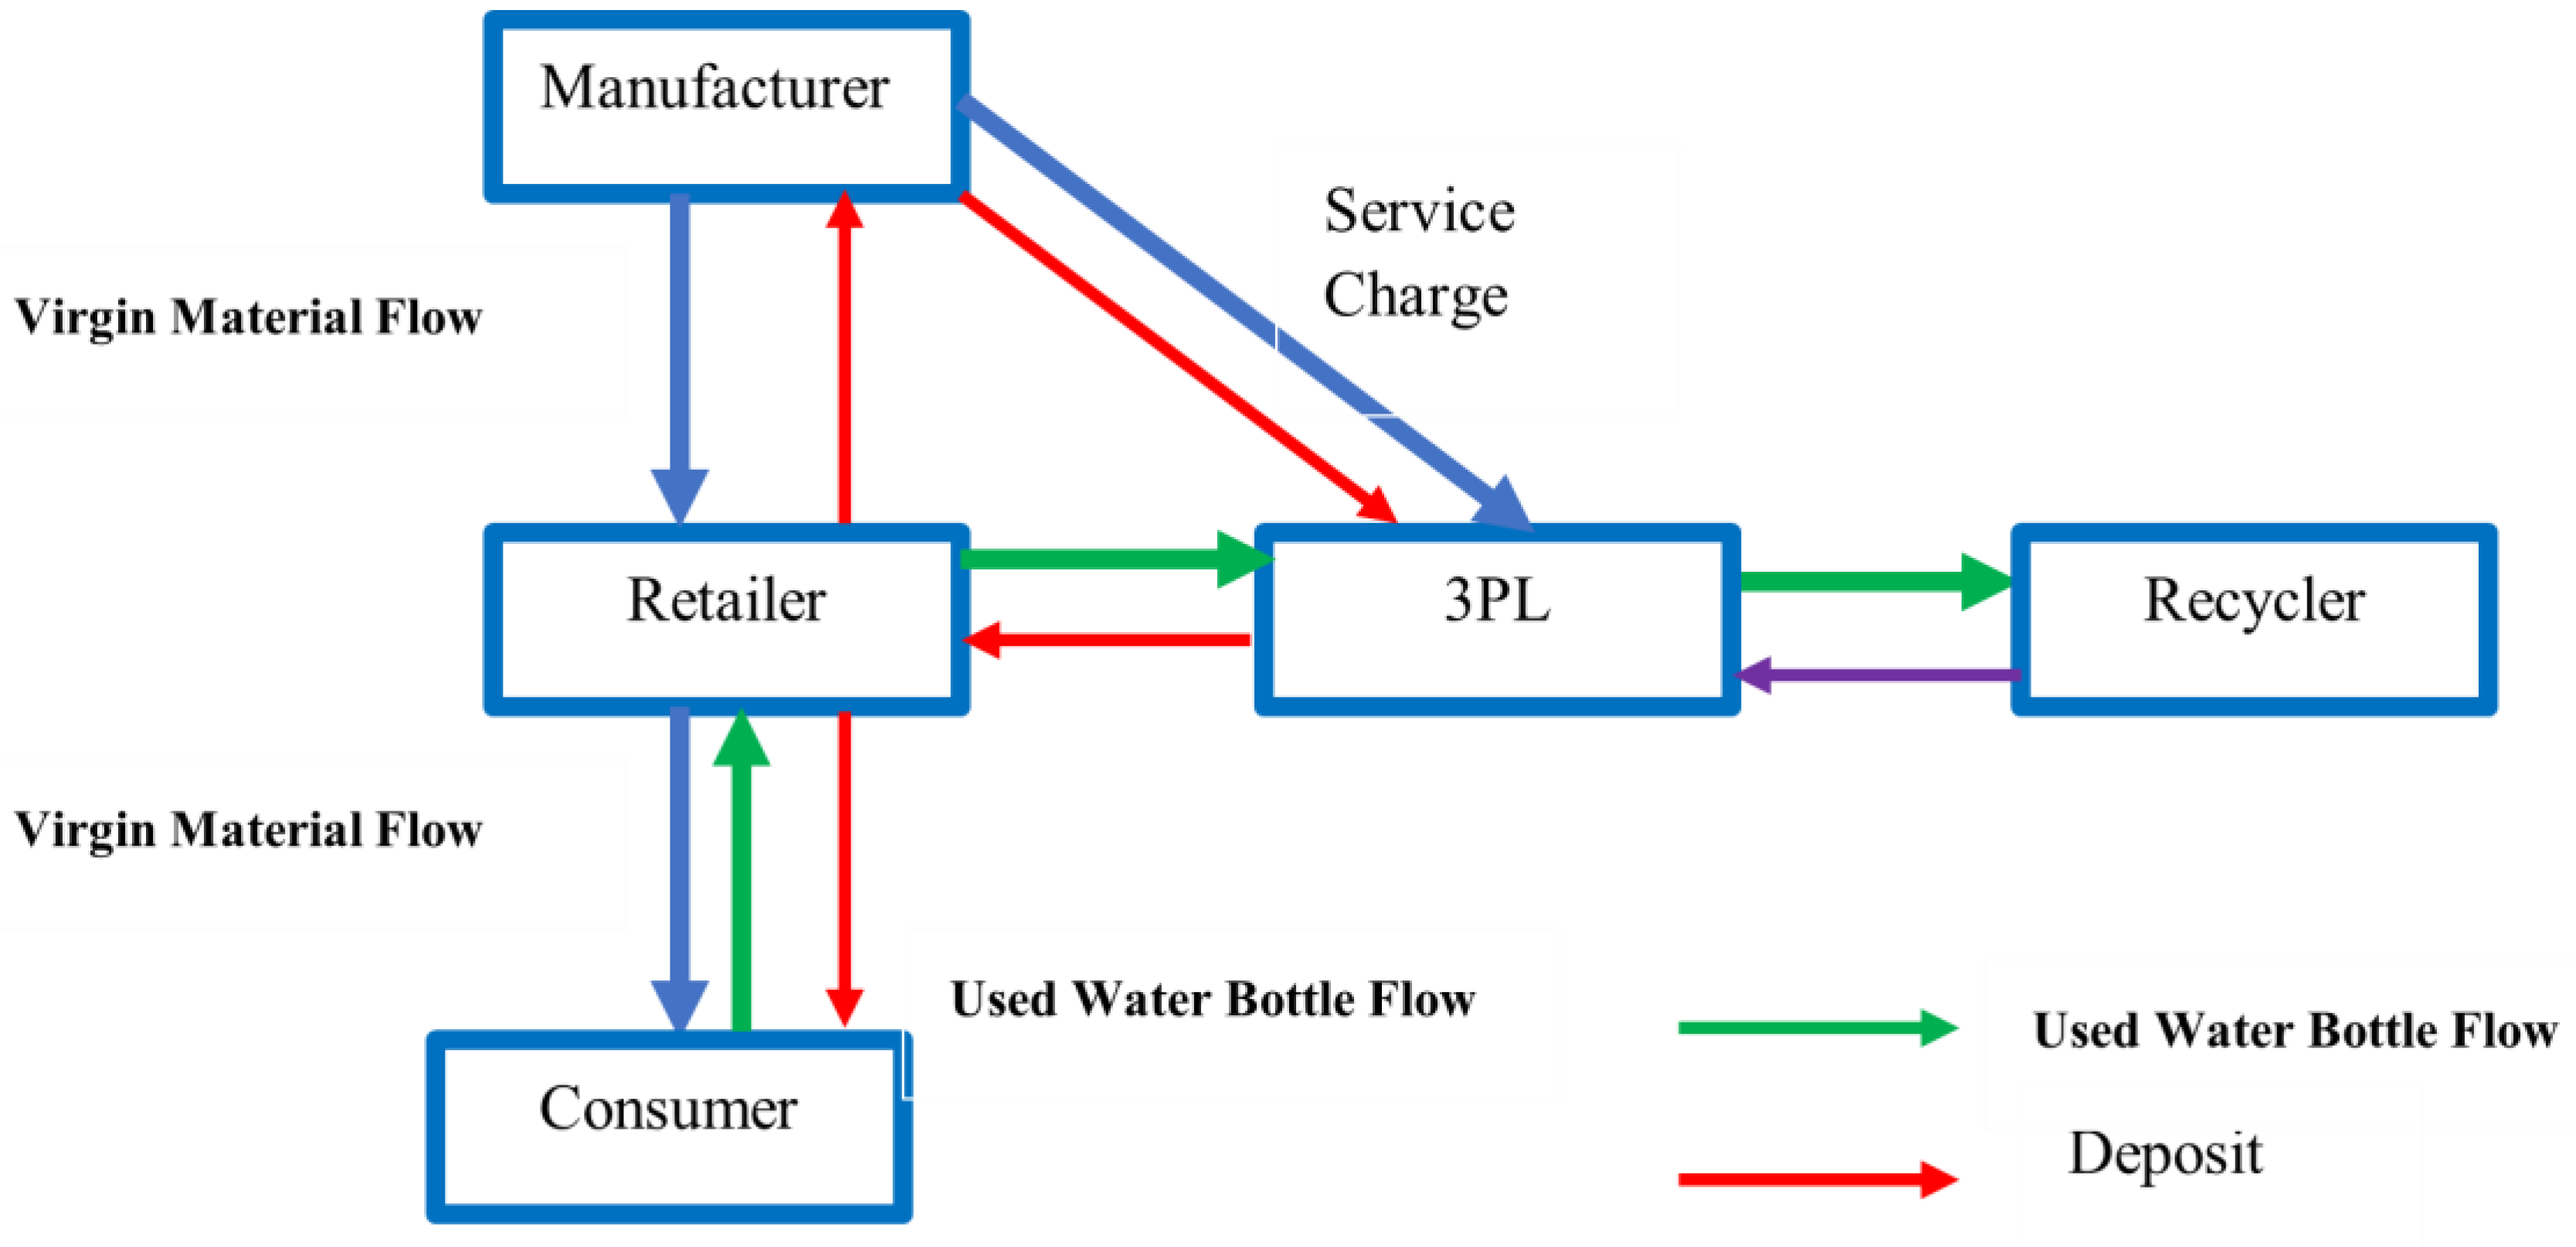
Figure 2 illustrates the water bottle deposit–refund system, wherein various material flows (virgin water bottles and used water bottles) and deposit flows are depicted. Used water bottles are routed to a recycler via a channel initiated by a retailer or a third-party logistics service provider.
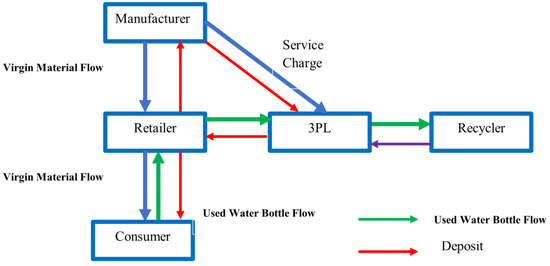
Figure 2.
Water bottle Deposit Refund System (DRS) showing the used bottles and deposit flows.
In an attempt to compare the DRS with other waste disposal policies, in 2011, Walls presented a summary of existing studies, whose results were confirmed in calibrated models of US waste and recycling [14]. Such results show that the proposed DRS is superior in reducing the volume of products generated and the increment in recycling rates. An understanding of how this policy has worked in the countries where it has been used is needed to back up this policy’s benefits.
The return rates of PET bottles in Sweden and Norway were 83% and 95%, respectively, in 2016. Both Sweden and Norway adopted the system almost at the beginning of the 1990s [15]. Similarly, in Finland, plastic bottle return rates reached 92% in 2015 [16]. Moreover, implementing the system in Lithuania in 2016 showed positive results within seven months. Since the DRS recorded positive results, researchers and concerned authorities worldwide have been motivated to study the proposed system’s feasibility in their countries. In Belarus in 2016, Kalinovskaya [16] evaluated the possibility of implementing the system in terms of several factors, including political, economic, technological, and environmental. The evaluation was carried out to identify the context for the implementation of this system. One suggested recommendation was to utilize the DRS as a financial source to cover the high initial cost.
In Latvia in 2013, Dace et al. [17] estimated the cost of implementing the DRS for packaging in a period up to 2020 and compared such a cost with the existing curbside system’s cost. The results indicated that implementing such a system would be environmentally feasible; however, the implementation would also be costly due to Latvia’s low beverage consumption. Deprez studied the cost–benefit analysis of the system conducted by OVAM in 2015 in Belgium [18]. Similarly, the results showed a significant impact on the environment, but it was costly. By taking the implementation policy of DRS in Kiribati and Palau as an evaluation framework, Nashfa [19] analyzed the political and economic feasibility of PET bottle implementation for one year in Male, Maldives. The results revealed the possibility of economic viability. In the UK in 2010, an examination of the environmental benefits of introducing the DRS was performed by Hogg et al. [20], which attained savings of 607 kt CO2 equivalent per annum, associated with a benefit of around GBP 69 million. The study recommended implementing the system, which, in March 2018, the UK Government announced that it would adopt, in addition to the Scottish Government’s announcement in 2017 [12]. In New Zealand, Davies conducted a benefit–cost analysis over a ten-year study period, showing that the benefits are higher than the costs when implementing the DRS [21]. In 2011, research conducted in Dubai by Acharya on recycling attitudes and policies was followed by the suggestion of a proposed recycling program and a revised one based on stakeholders’ feedback [13]. The revised system included a volume-based pricing system with a fixed amount of free disposal of organic waste. For recyclables, residents will be rewarded based on the weight recycled.
2.2. Closed-Loop Recycling
The end market for recyclables might produce other, less valuable product types or reproduce the same type as the virgin one. This situation applies to recycled PET (rPET), whose global market is growing due to its various applications and the increased demand for packaging products [22]. It has been utilized to produce fiber, fabric, films, straps, and food and non-food containers. According to Welle [23], the first direct food contact application of rPET was in the USA in 1991, and it was used in European countries after that. He also mentioned various reasons that make PET material strongly applicable to bottle recycling or so-called closed-loop recycling, such as an inert polymer. Considering the progress of this recycling process, well summarized are the super-clean recycling technologies used to decontaminate the postconsumer containers and bring the concentration levels of rPET to those of the virgin ones. Hopewell et al. [24] mentioned that a clear PET container is ideal for closed-loop recycling when it is effectively purified and stabilized against degradation during reprocessing. Therefore, such food-grade rPET is widely used at 30–50% of virgin PET replacement and 100% in some bottles. Based on the Wrap Plastics Market Situation Report in 2016, the European Food Safety Authority has established guidelines regarding the utilization of rPET in food packaging [25]. It says that at least 95% of the input PET material must have been used for food contact in its early life [25]. Due to the need for clean postconsumer bottles for closed-loop recycling, collecting such bottles via RVMs in the DRS acts as a prerequisite for recycling.
2.3. Life Cycle Assessment
Considering the environmental impact of recycling and other waste management methods, life cycle assessments (LCA) have been conducted by researchers to quantify the GHG emissions generated from the proposed disposal methods. Foolmaun and Ramjeawon [26] studied the environmental impact of PET bottles’ disposal via five different scenarios in Mauritius. It was shown that 100% landfilling is the worst scenario. Similarly, Perugini et al. [27] showcased the outperformance of different recycling types over other waste management methods concerning six impact categories, such as energy consumption. The results highlighted the energy, crude oil, and CO2 emissions savings as a result of recycling.
2.4. Current Disposal Policy
The weaknesses of the current similar system in other cities in the UAE like Sharjah, Dubai, and Abu Dhabi should be recognized before proceeding with the proposed system. A similar policy to the paper’s proposed system was initiated in 2017 by the Bee’ah Sharjah Environment Company. The policy is named Bee’ah Rewards, and it uses RVMs to motivate recyclers to deposit empty containers, receive a receipt with each deposit, and enter a monthly draw of prizes. The system has succeeded in increasing the number of recyclables within the first half of 2018 to about 250,000, including aluminum cans and plastic bottles. However, the number of recyclables is relatively low compared to the high consumption of such containers. This low return is related to the fact that the RVMs were installed in only six locations in the involved emirates. Therefore, the returned containers would only be used by the population during their visits to those locations. It is impractical to carry what has been consumed during the week to be returned to specific, limited locations. Moreover, this would increase the amount of GHG emissions generated from the increased transportation required in producing the containers. Consequently, a more practical and environment-friendly policy is needed for the DRS. The proposed system would repay each recycler for every returned PET water bottle, creating win–win scenarios for the parties involved. The RVM will be installed in all major markets and malls. This would allow more environmentally friendly and convenient trips to return containers associated with the weekly shopping trips. Moreover, the returned bottles will be inputs for bottle-to-bottle recycling (closed-loop recycling) rather than bottle-to-fiber recycling (open-loop recycling), as Bee’ah does. Both recycling types protect the environment; however, what happens to the recycled product after usage is critical. In the first type, bottles are recycled in an infinite loop, while the latter may have two possibilities. The possibilities are either that the fiber is recycled or ends up in landfills. According to Welle [23], recycling the fiber is not enough to utilize and absorb the large amounts of collected bottles. In this case, bottle-to-bottle recycling is preferable. This study aims to build a Deposit Refund System (DRS) for the closed-loop recycling of 0.5 L PET and investigate the feasibility of implementing the DRS to collect 0.5 L PET water bottles.
3. Materials and Methods
3.1. Data Collection
Some of the data used in this study were provided by local bottled drinking water companies in the UAE. The provided data include the daily production of 0.5 L water bottles, virgin PET price, and rPET price assumption. Moreover, the measured data were obtained by weighing the 0.5 L water bottles produced by the top four water bottle companies in the UAE. Table 1 shows the average cap, label, body, and total weight of the bottle. However, most of the data used were obtained from previous research and studies relating to RVM daily capacity and PET containers’ carbon footprints.

Table 1.
Segmentation of 0.5 L PET water bottle weights.
3.2. Proposed System Model
The proposed DRS for recycling water bottles consists of several stages forming a closed loop, as shown in Figure 3. First, the water bottles are transported from bottled drinking water companies to the recycler’s distribution centers, whose role is to distribute the bottles to retailers. Meanwhile, the consumer should purchase the water bottles, and then return the empty plastic bottles after usage to the RVM. The RVM will be installed in a leading market/retailer. Each consumer will have a card that records a reward of AED 0.04 for each deposit made via the machine. Based on the retailers’ and RVM’s storage capacities, collectors will collect the compacted bottles, which have already been sorted and counted by the machine without being contaminated. The collectors would be the distributors who initially transported the unconsumed bottles to retailers. This is an advantage in reducing logistics costs, as the party concerned with distributing and collecting the bottles will perform both actions within one trip to the consumer [28]. These bottles will be transported to recycling plants to be recycled into rPET resins using super clean recycling processes. Such a critical approach is needed to produce a food-grade rPET with the same properties as the virgin one. There is a need for a backup of virgin PET resin from the vPET manufacturer to meet the demand for water bottle consumption. Both rPET and vPET will be used to create the product used by bottled drinking water companies to form the water bottle. A further illustration of the needed proportions of vPET and rPET to make one water bottle’s content will be discussed in the next section.
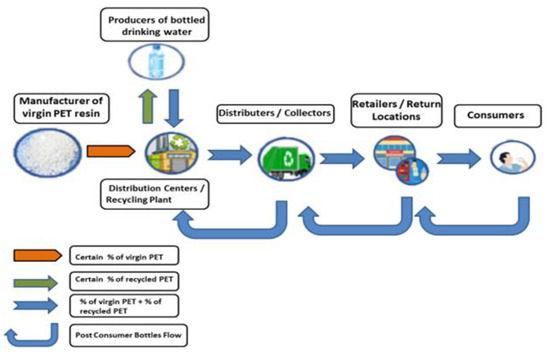
Figure 3.
Proposed DRS model for recycling water bottles.
3.3. Reproduction of 0.5 L Water Bottle Model
A measurement of water bottle consumption in the UAE is needed to make an economic and environmental evaluation of the proposed closed-loop recycling method. The daily production numbers of 0.5 L and 1.5 L water bottles were provided by one of the local bottled drinking water companies in the UAE. The production of 0.5 L bottles is almost double the production of 1.5 L bottles. Therefore, to simplify the calculation needed, the study will collect and recycle the most-consumed water bottles. The annual demand for 0.5 L water bottles was obtained by using the company’s position in the market and multiplying it by the number of days per year. To verify the proposed method’s findings, an industry report about the UAE bottled water market states that the annual average consumption of bottled water in the UAE is 250 L per person [29]. This number equals 500 × 0.5 L water bottles. By multiplying the UAE population’s obtained number in the first quarter of 2019 [30], the resultant annual 0.5 L water bottle demand approximates 5 billion. This numerical value is very close to the number calculated using the first method.
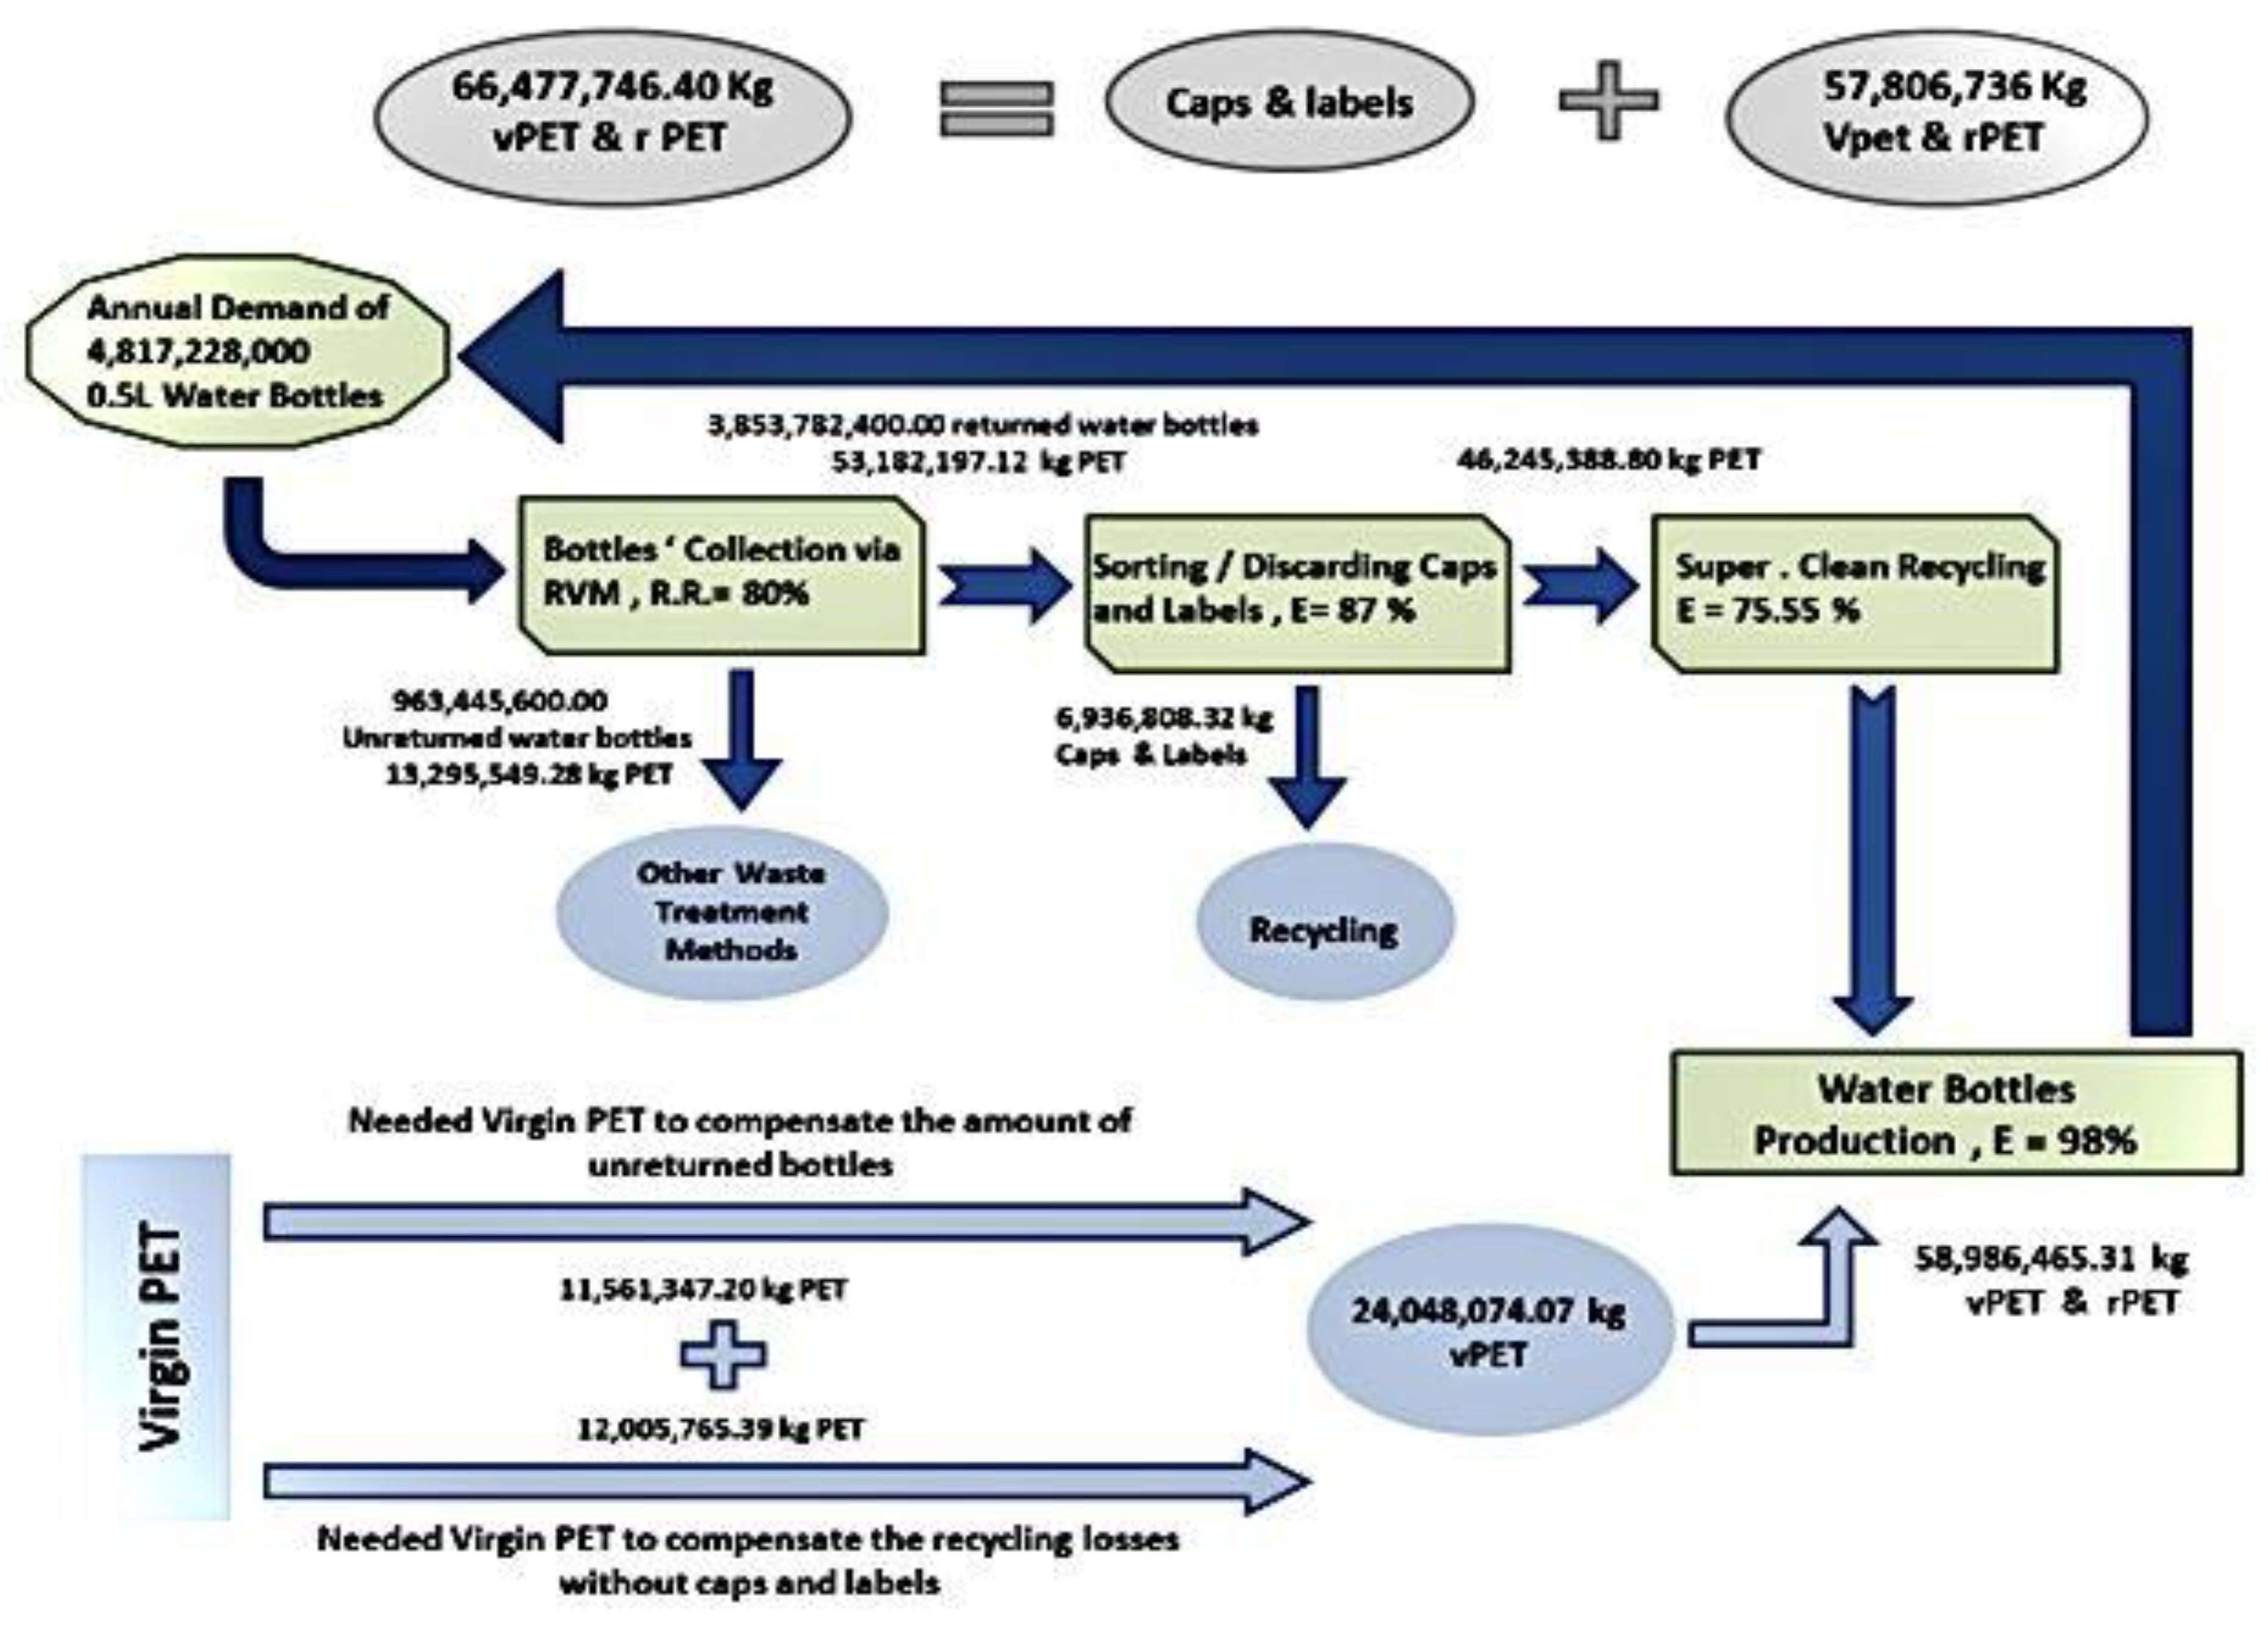
It is assumed that 80% of the consumed bottles will be returned by residents via RVMs through the proposed DRS out of the total demand. Such bottles will be collected with their caps and labels at the recycling plant, where they will be sorted to recycle each part independently. The assumed efficiency of this step is about 87%. This efficiency is based on the cap and label weight percentage, which is about 13% of the total bottle weight, as shown in Table 1. Next, the PET bottles will be recycled using conventional recycling processes in addition to the super-clean process to achieve a close resemblance of the properties of rPET to those of vPET [31]. The efficiency of the whole recycling process is 75.55%, according to Valentino [31]. As a result, the output will be about 35 million kg of food-grade rPET. The output is not adequate to meet the annual demand of 5 billion bottles, or 57,806,736 kg, excluding caps and labels. Thus, the total amount of vPET needed to compensate for the unreturned bottles and the recycling losses is about 24 million kg. This value takes into consideration that the bottle production efficiency is 98% [31]. The vPET and rPET will be combined to make the pellets to produce the final shape of bottles. These steps of closed-loop recycling are illustrated in Figure 4. Based on the obtained amounts of vPET, rPET, and the demand in kg, the acquired recycled water bottle’s cost and carbon footprint were calculated.
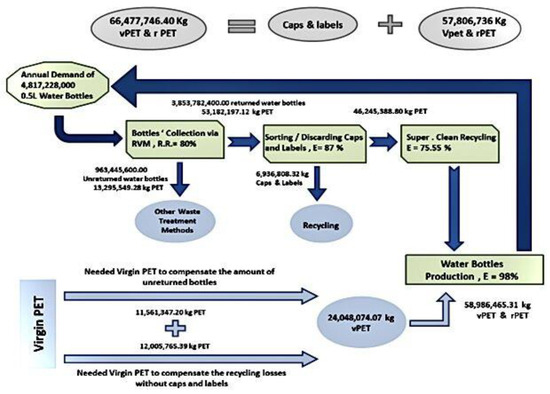
Figure 4.
Reproduction of 0.5 L water bottle model.
3.4. Mathematical Model Building
A model was built using MS Excel based on the model in Figure 4 to quantify the rPET and vPET production amounts, their costs, and their carbon footprint. These quantities will be automatically calculated after inserting parameters such as daily bottle production, weight, and production efficiency. A bottled drinking water company provides the inputs with the assistance of a recycling plant. The carbon footprint values are approximated to show the environmental benefits of closed-loop recycling. It should be noted that a life cycle assessment (LCA) should be performed under one of the local water bottle company’s conditions to obtain the exact numbers. This research highlights the vital contribution of DRS and closed-loop recycling to protect the UAE’s environment.
3.5. Research Findings
Using the calculated amounts of vPET and rPET out of the annual demand, the maximum recycled content that can be reached is about 60%. Based on these findings, the system model was evaluated from an economic point of view.
3.5.1. Economic Evaluation
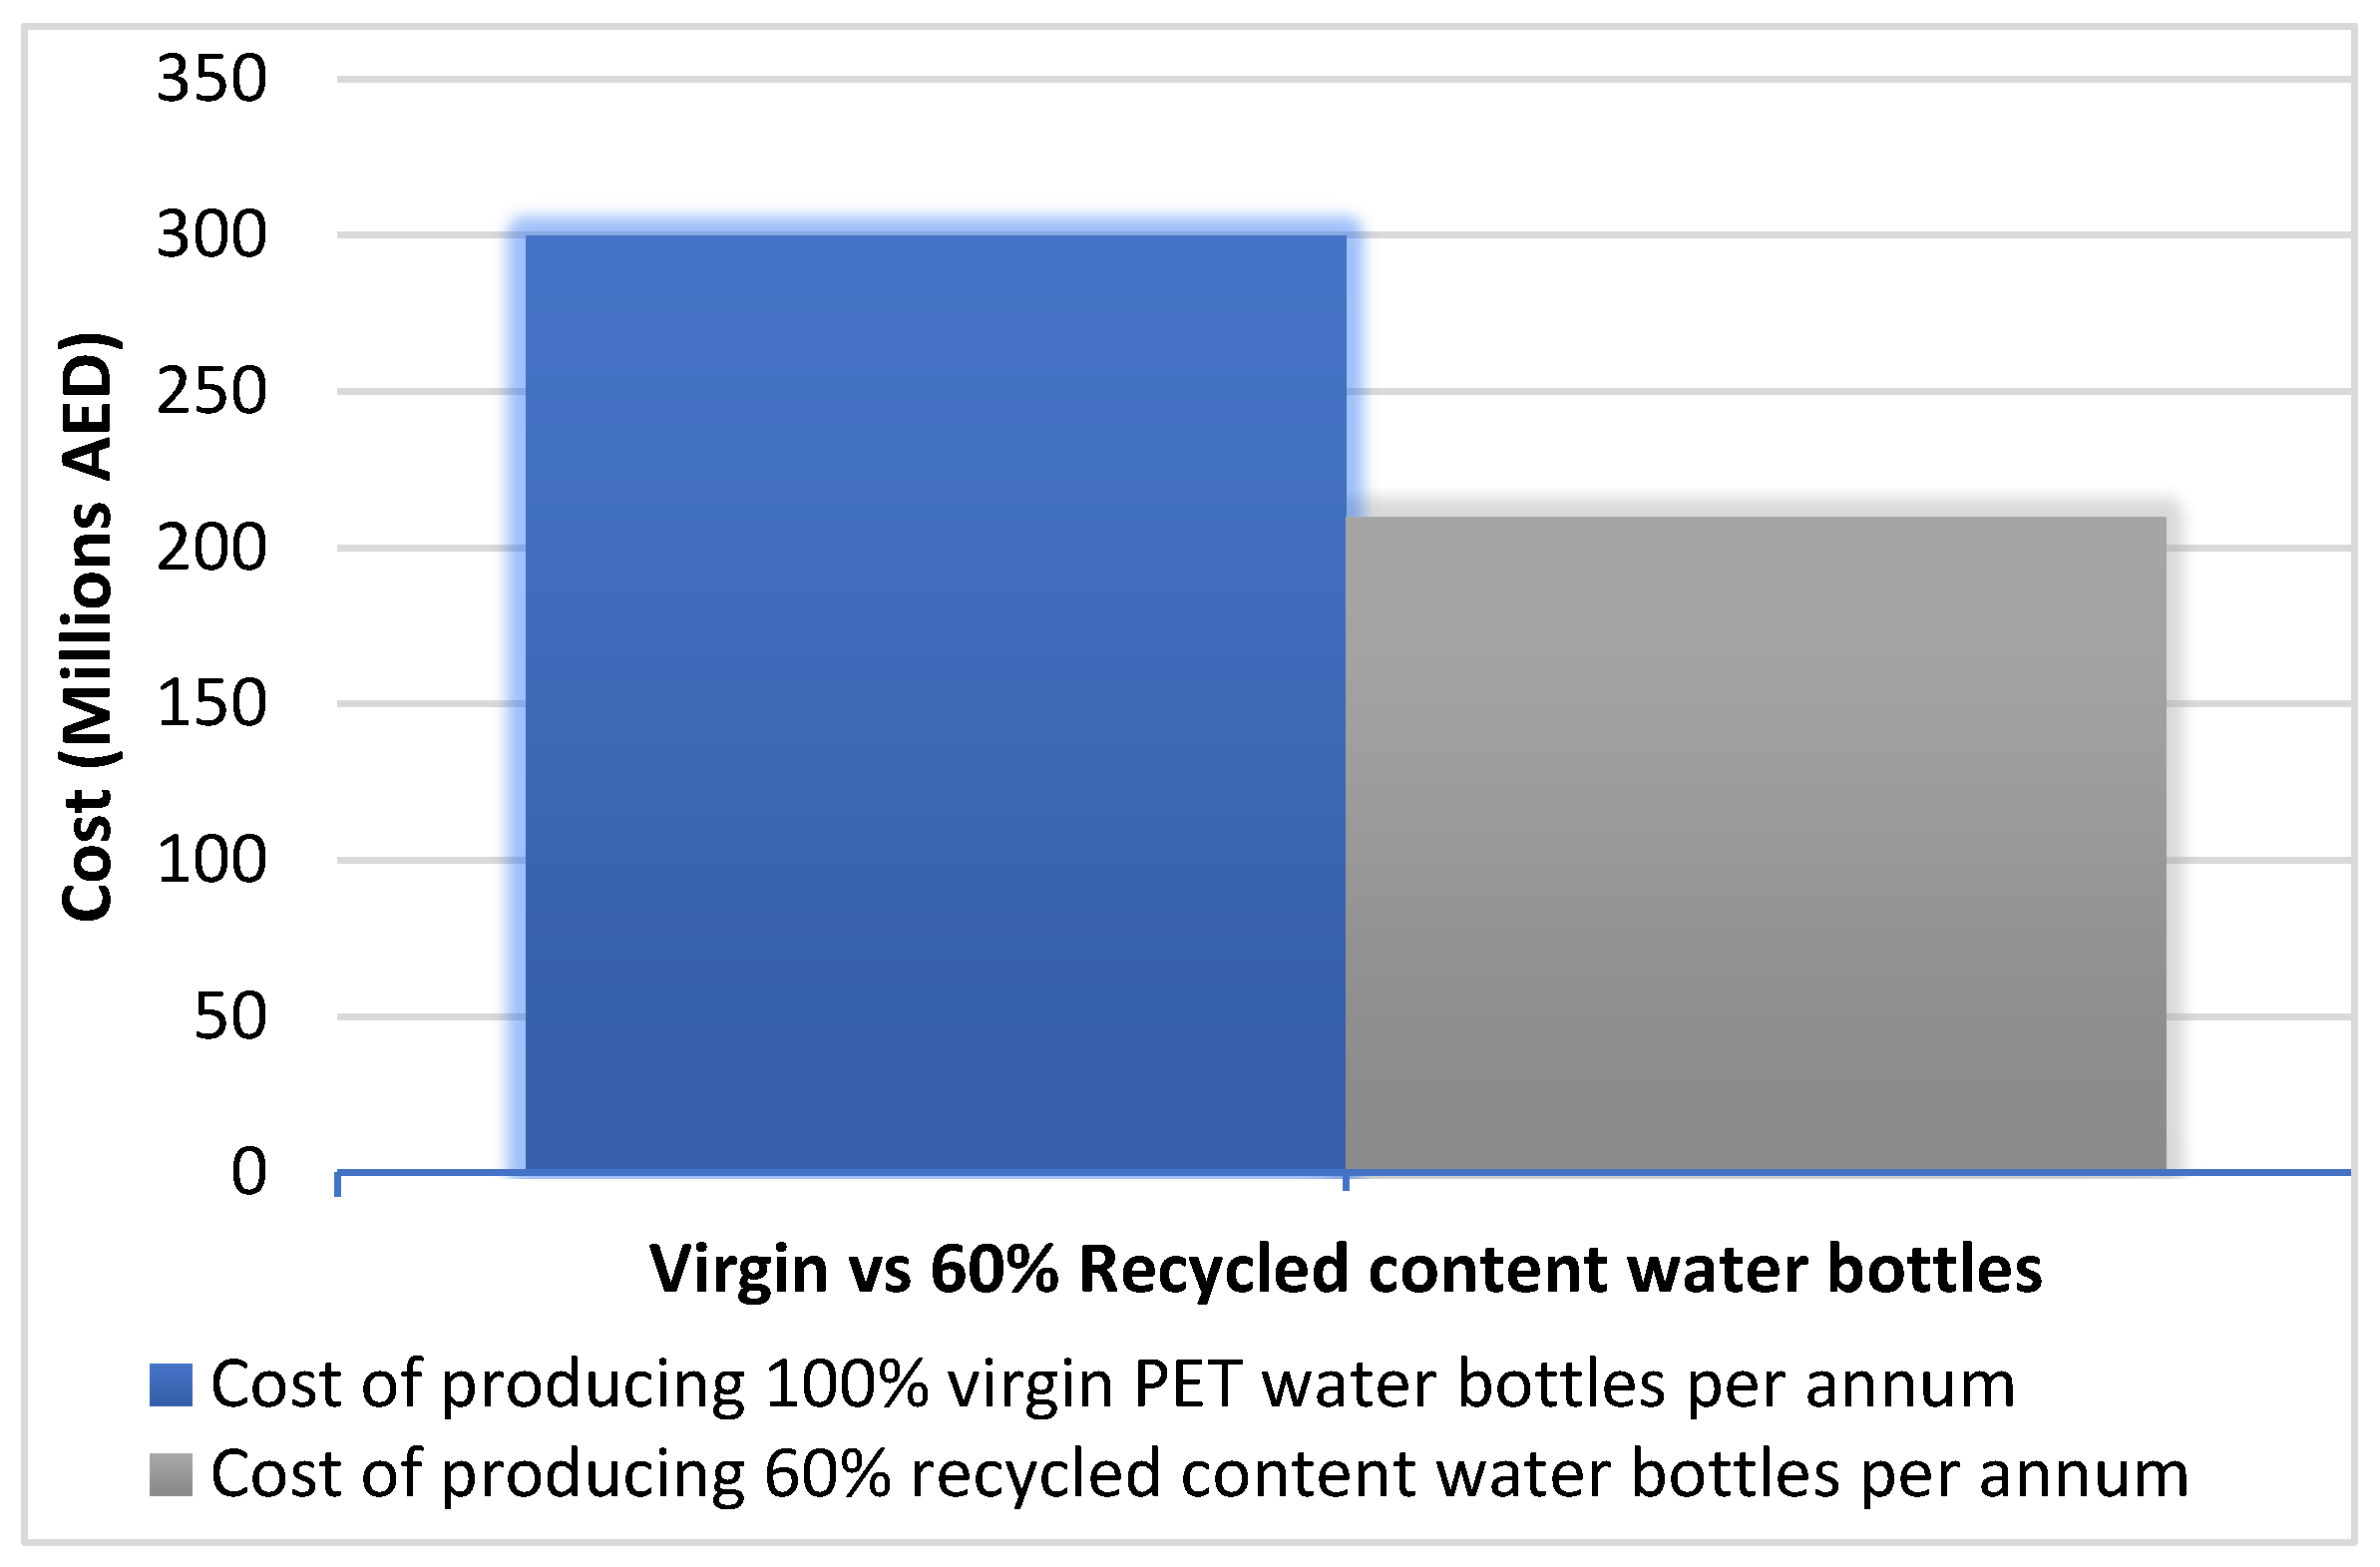
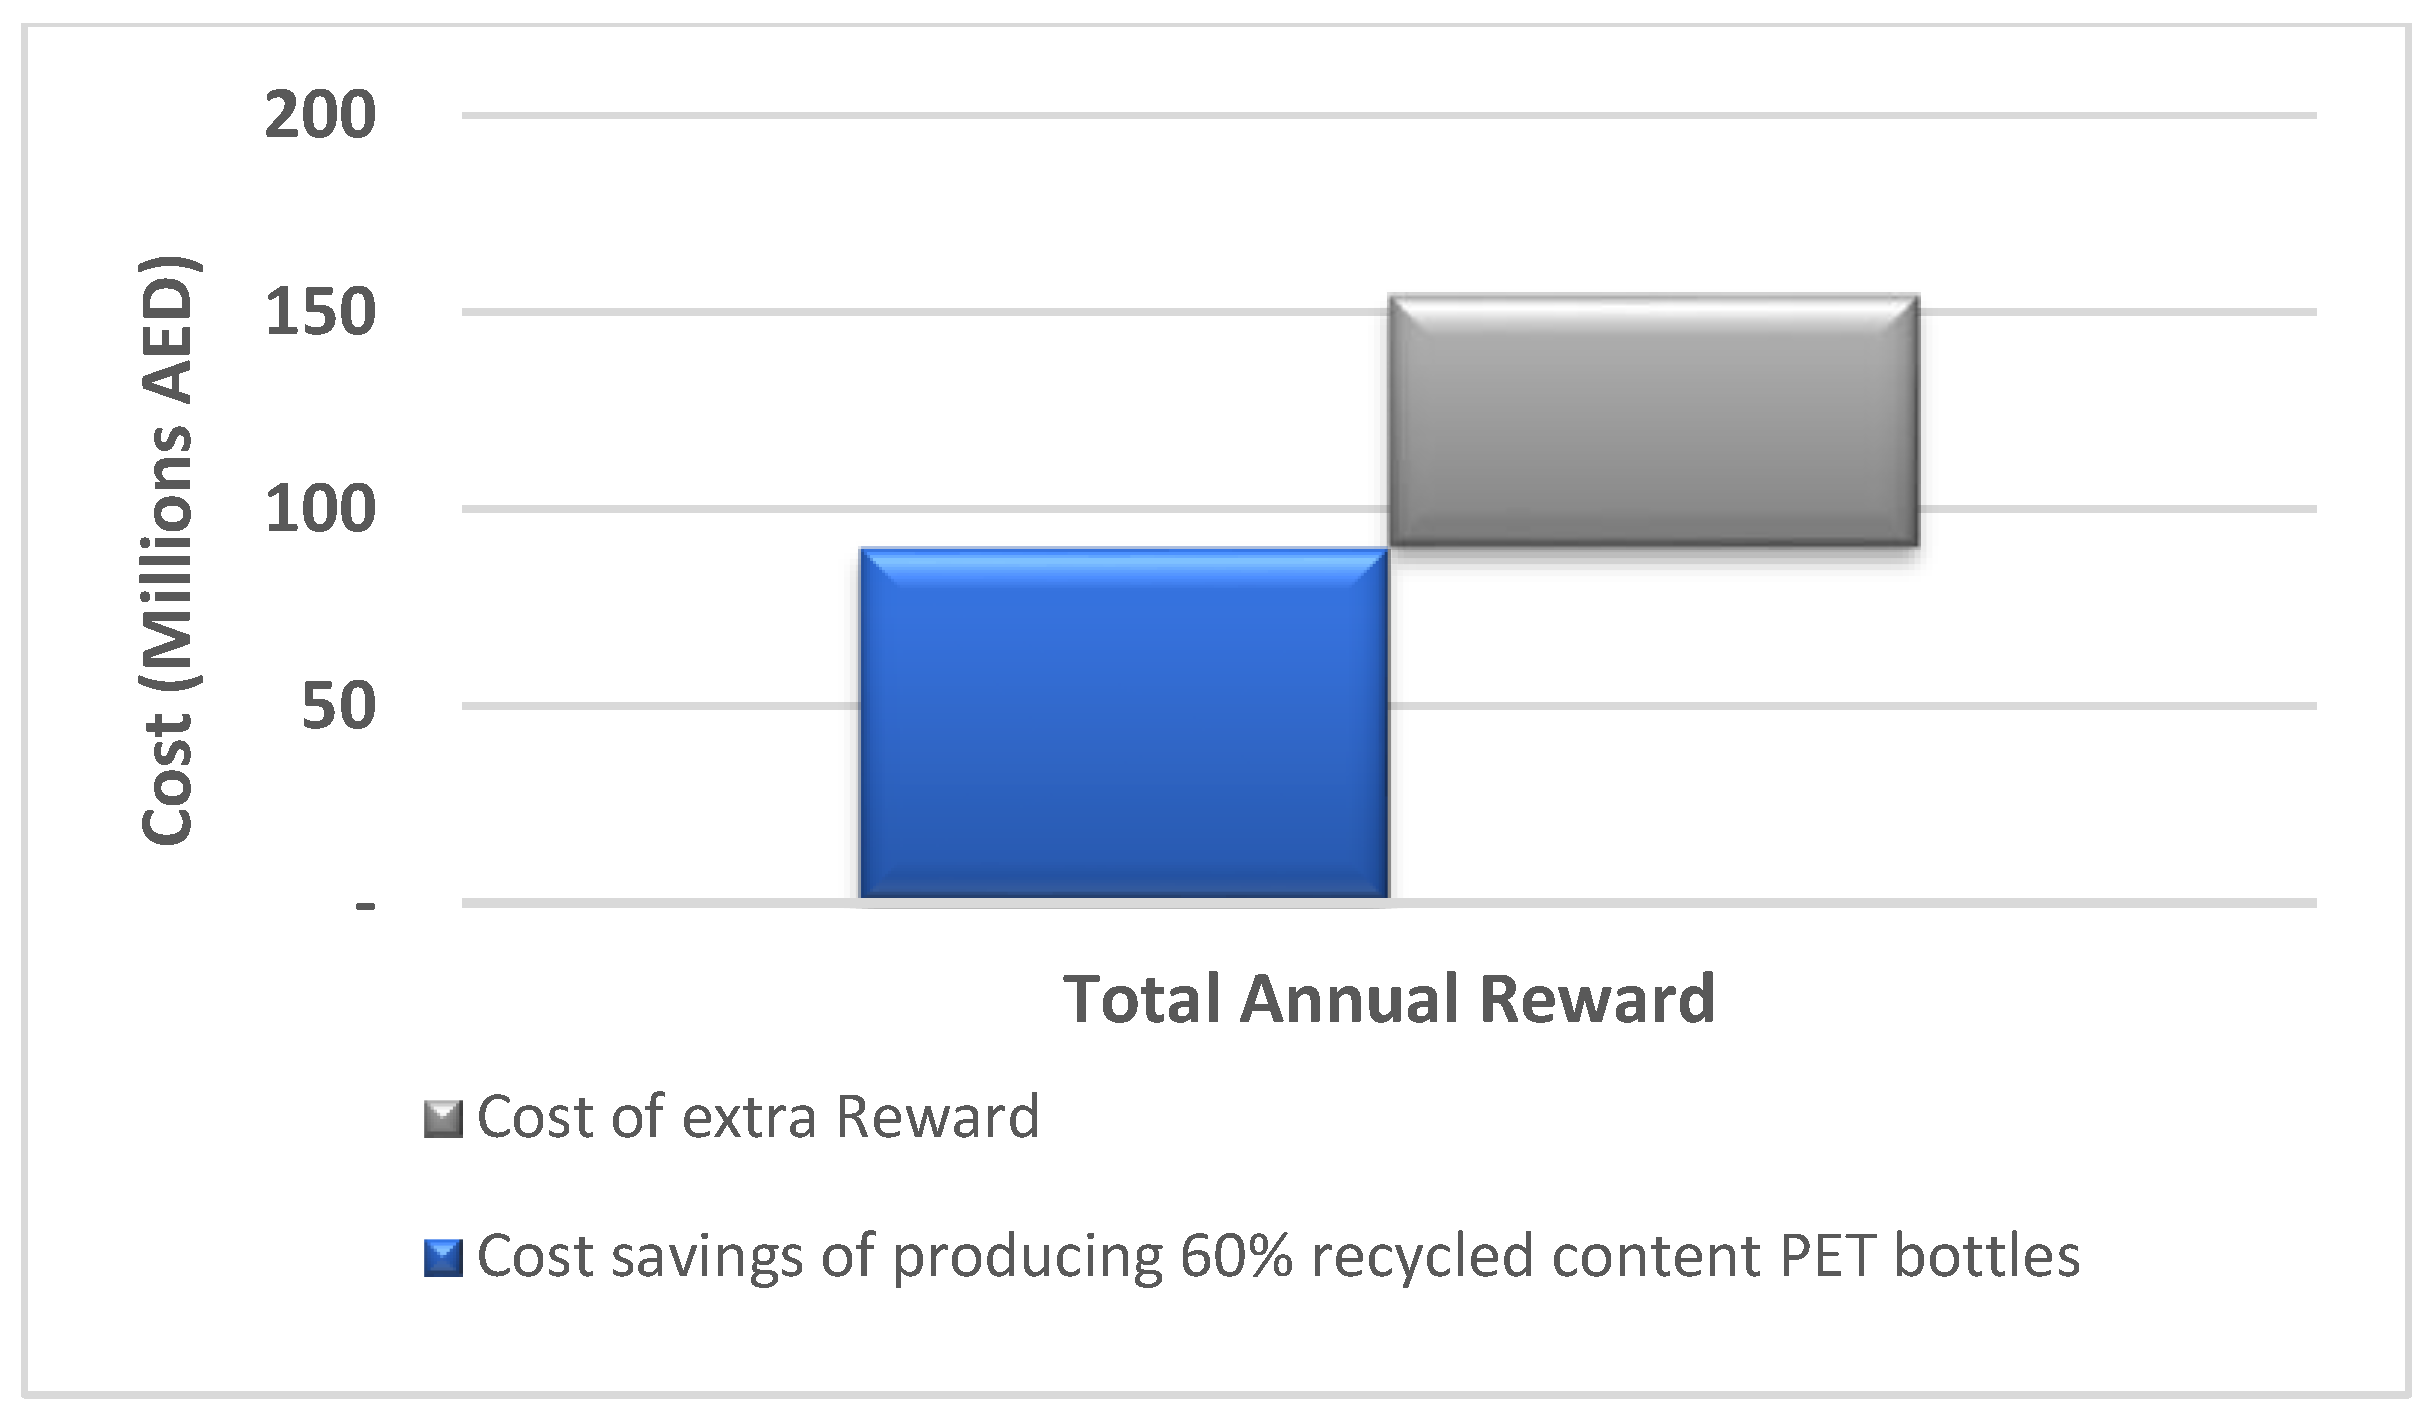
According to the local bottled drinking water companies that were contacted, the cost range of rPET is 30–50% of the value of vPET. As a result, 50% was chosen in order to obtain a high-quality rPET. However, in the end, it depends on the supply chain relationship between stakeholders and on their desire to protect the environment. As shown in Figure 5, since 60% of a water bottle consists of rPET, the total annual cost of producing almost 5 billion water bottles is 30% less than the current cost of using only vPET. Such a cost is the total cost for all local bottled drinking water companies to purchase the final rPET and vPET pellets from the recycling facility. When the 60% recycled content is used, the savings achieved will be part of the returned postconsumer bottle’s AED 0.04 reward per deposit. This amount contributes to more than 50% of the reward. The rest of the reward will be paid by the recycling plant, as shown in Figure 6. The selection of AED 0.04 as the reward is because it represents the cost of making the 60% rPET preform bottle. Hence, since the consumer is returning the bottle, it is appropriate to refund its price as a reward.

Figure 5.
Production cost comparison.

Figure 6.
Annual reward segmentation.
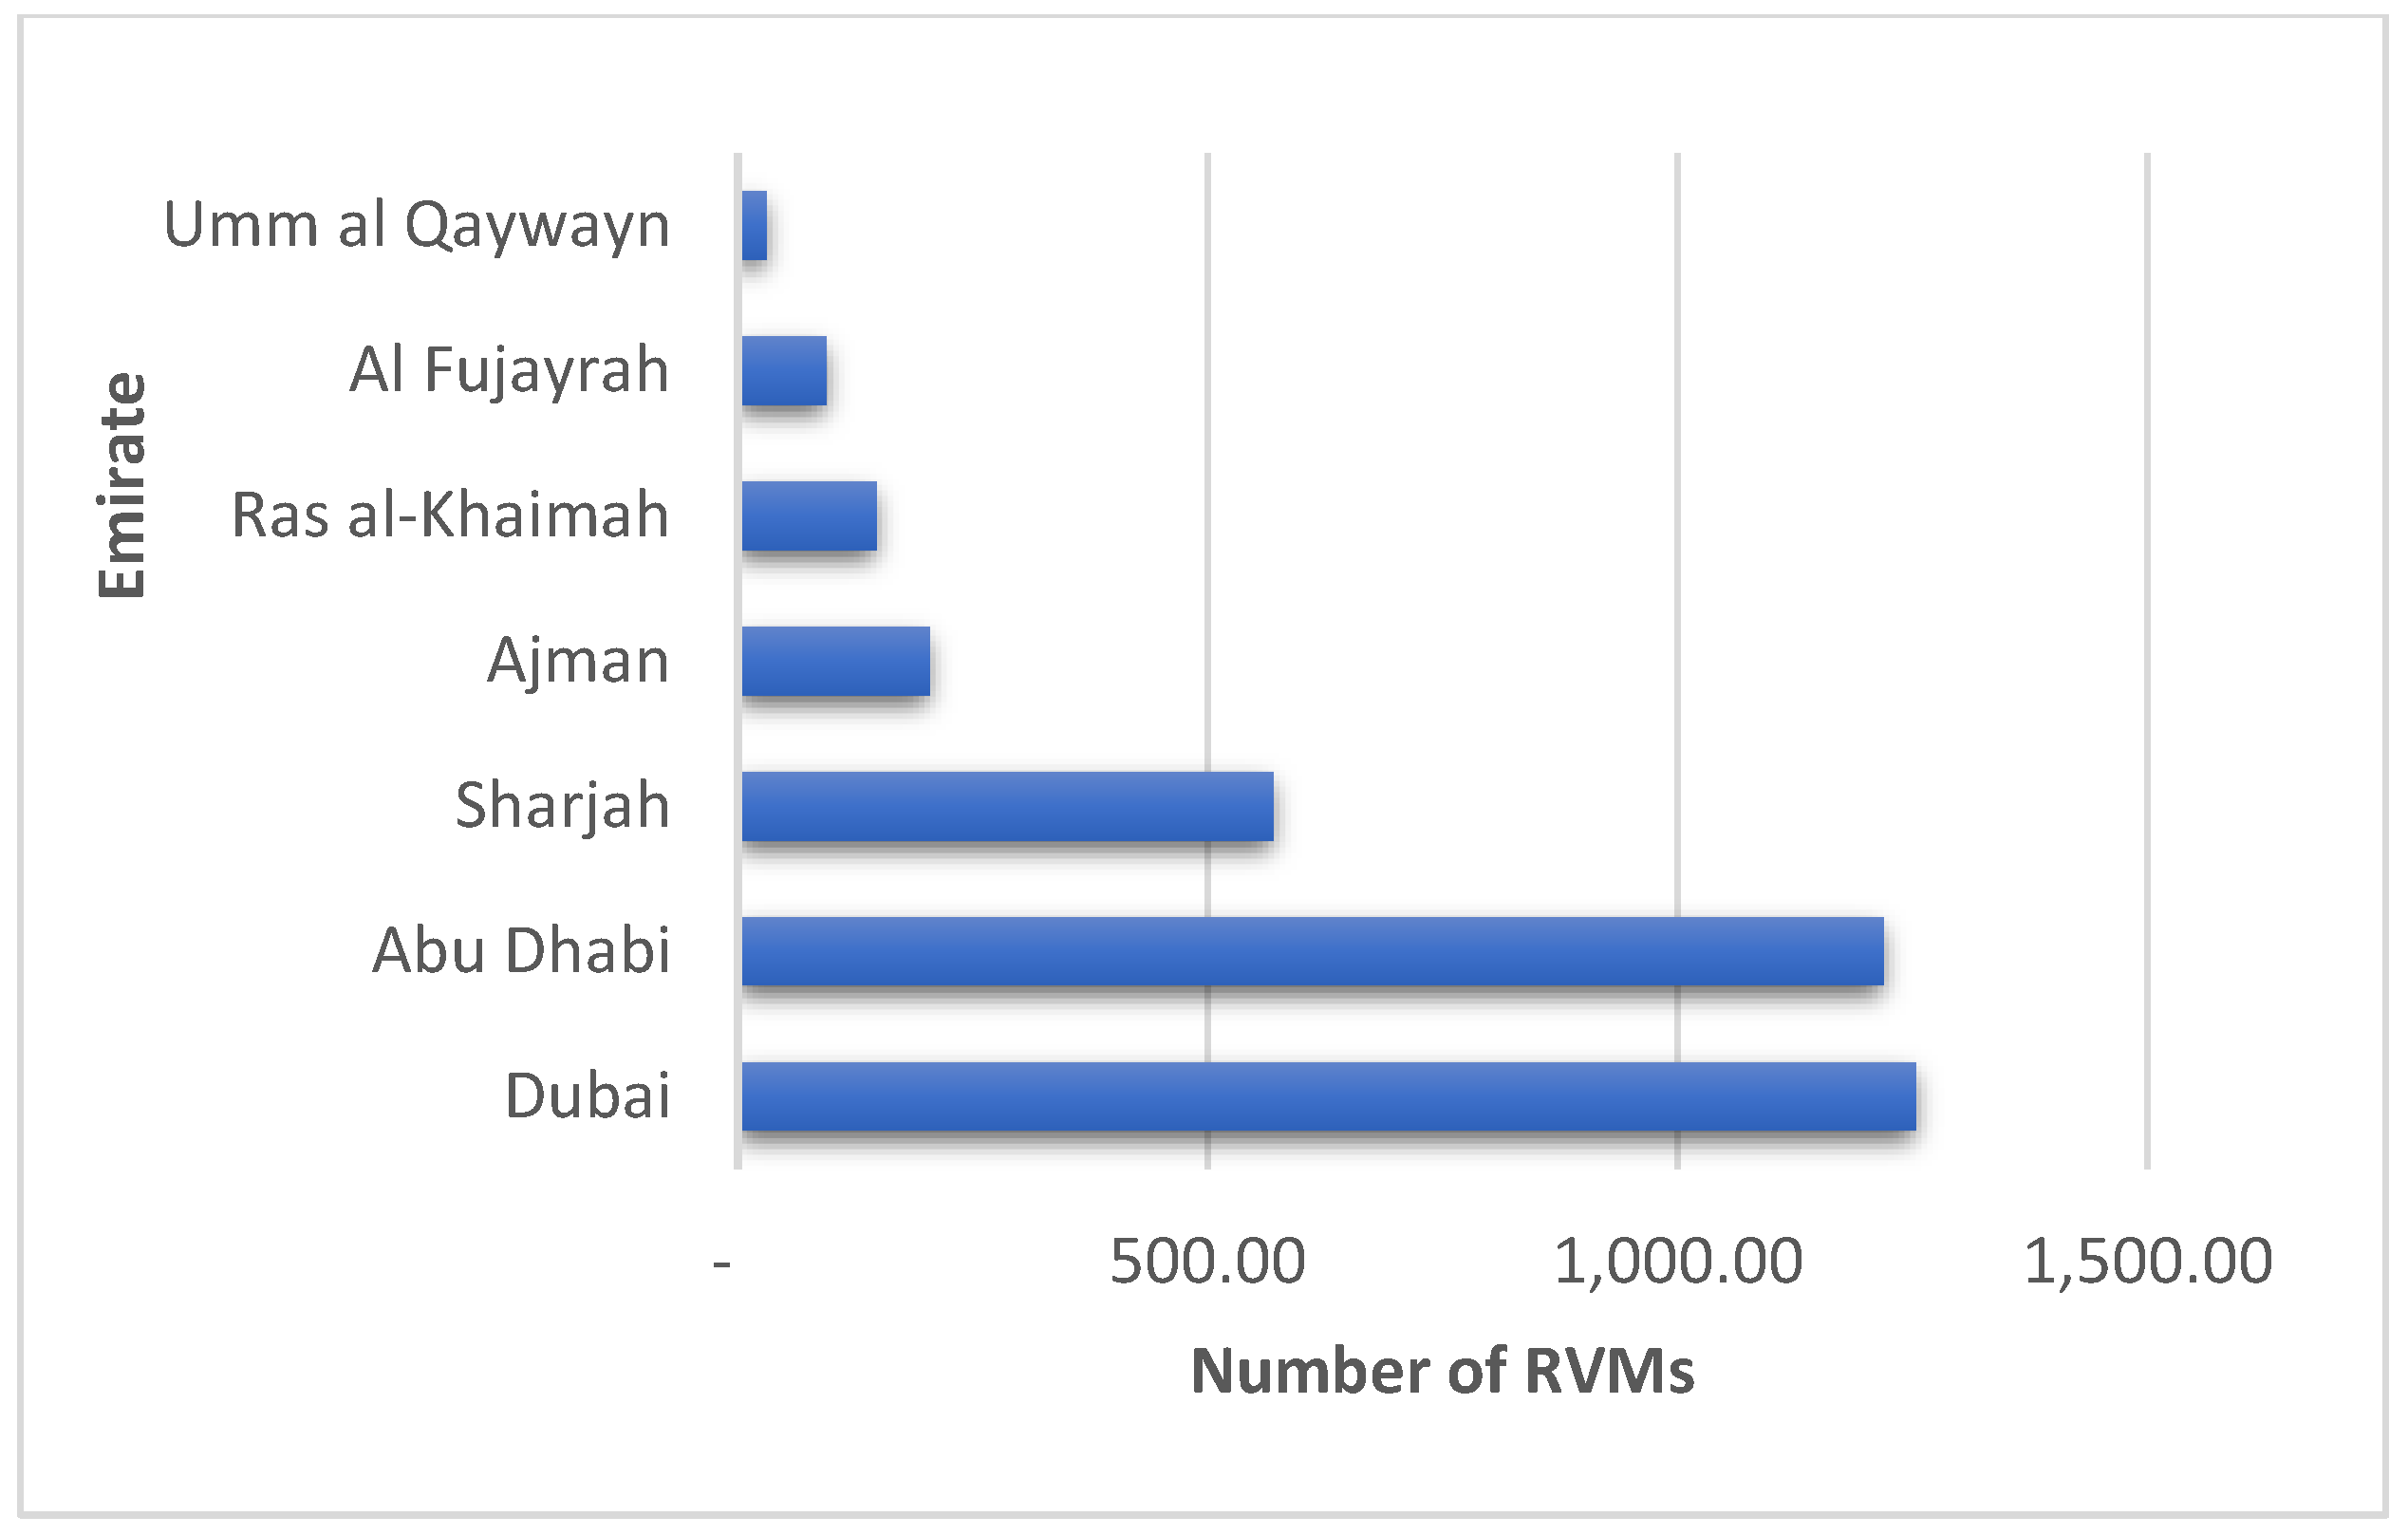
To recoup the assumed 80% of the daily demand, an adequate number of RVMs should be installed all over the country. The number of RVMs needed in each emirate is displayed in Figure 7. The number is based on the current population in each emirate, 80% of the daily consumption of 0.5 L water bottles, and the RVM daily capacity of 3000 containers [32]. The number of RVMs required across the UAE totals more than 3500 RVMs. The RVM cost range is between GBP 4500 and GBP 17,000 [20] and has recently reached GBP 30,000 [28]. The cost variation depends on the desired capacity, consumer friendliness, and other factors. The proposed system’s assumed cost is close to the current one, at about AED 150,000 per machine, including the installation cost.

Figure 7.
Number of RVMs to be installed in each emirate.
An additional cost that was quantified is the storage cost. The storage cost represents the space needed to install the RVM and store the compacted bottle bales from the machine until the collection takes place. The total storage area required varies from 5 to 9 m2 [20]. According to Hogg [20], the bulk density of compacted PET bottle bales is 27 kg/m3, which corresponds to almost 2000 bottles per cubic meter. Consequently, this high number will optimize logistics costs [20]. Despite the high RVM’s initial cost, it outperforms the regular collection bins in the curbside waste disposal policy. Utilizing an RVM eliminates the need for counting centers. In addition to that, the bottles will not be contaminated. This is a critical factor in ensuring high-quality inputs for closed-loop recycling. An additional cost is also placed on the extra super-cleaned recycling process needed for bottle-to-bottle recycling, which is about AED 22 million per super-cleaning reactor [33].
3.5.2. Effect on Landfill Buildup
According to the Federal Competitiveness and Statistics Authority in the UAE, 72% of municipal waste went to landfills in the UAE in 2017 [34]. The photodegradation mechanism can degrade plastics in landfills. In other words, the UV sunlight activates the oxygen atoms in the polymer, leading to thermo-oxidative degradation [35]. Then, microorganisms will convert the carbon in the polymer chains to carbon dioxide, which takes at least 50 years. Consequently, plastics are accumulated in landfills to reach their full capacities. At this point, related authorities will have two choices: either to find new landfills or recycle. In the long run, a landfill by itself is a problem other than the emitted GHGs. Plastics pollute soil and are digested by animals, leading to their death.
3.5.3. Evaluation of the Environmental Impact
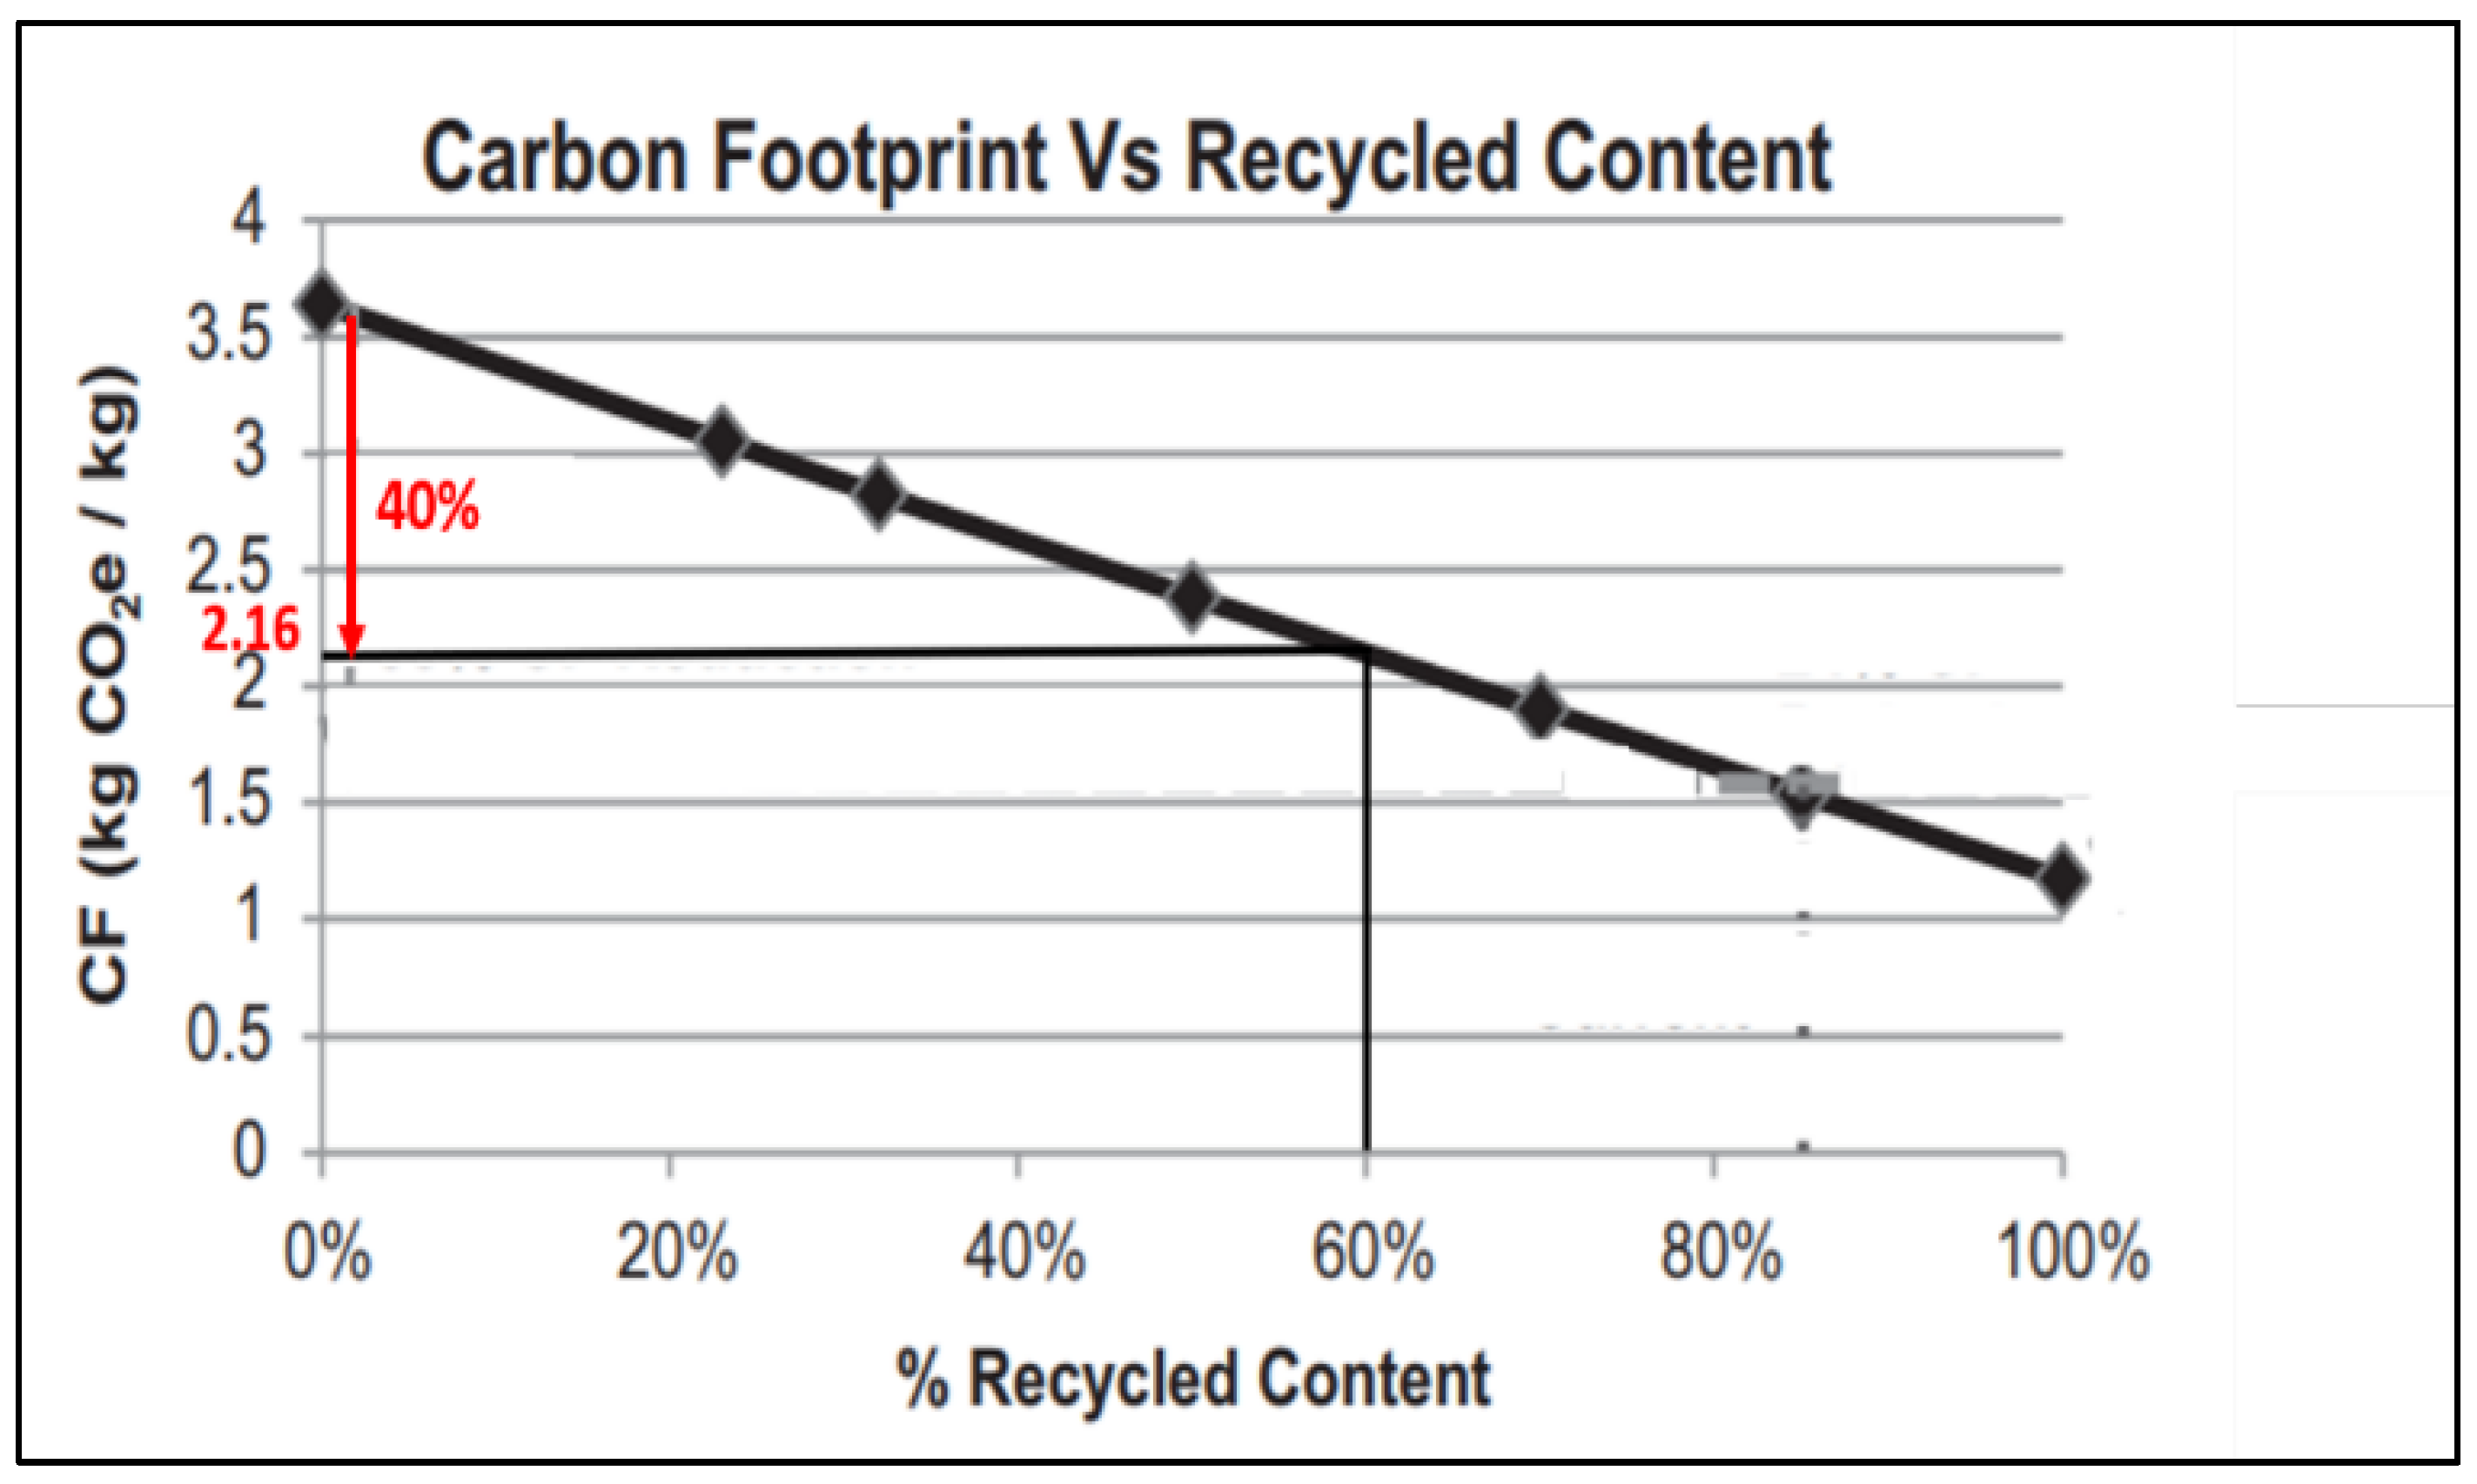
The 60% recycled content achieved affects the carbon footprint of the bottle. Based on the life cycle assessment (LCA) carried out by Dormer et al. [36] for PET trays, the 60% rPET water bottle has a carbon footprint of 40% less than the 100% virgin bottle. As shown in Figure 8 [36], the value corresponds to 2.16 kg CO2e/kg. Accordingly, the total amount of CO2e emissions generated from producing the current annual 0.5 L water bottles’ demand using 60% rPET approximates 125,000 metric tons. This is clearly shown in Figure 9 compared to the current production of 100% virgin content.
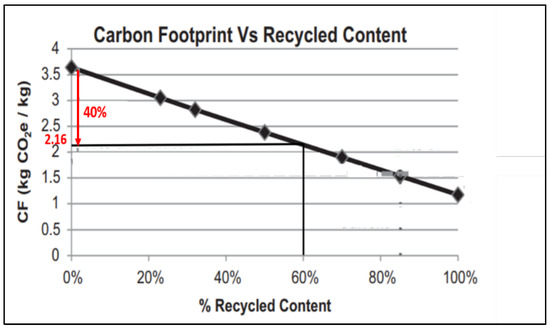
Figure 8.
Carbon footprint value of 60% recycled content PET bottle [36].
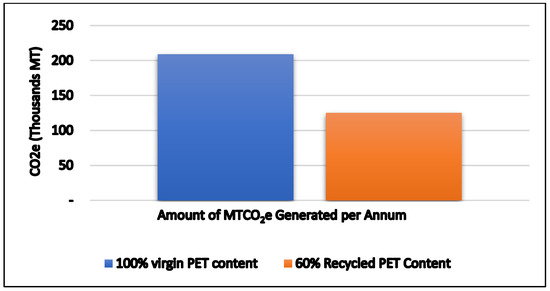
Figure 9.
Difference in the amount of CO2e emitted from vPET production and 60% rPET production.
It should be noted that such a footprint value consists of the PET resin production, manufacturing of trays, secondary packaging, transport, and end-of-life stages, which represent 45%, 38%, 5%, 3%, and 9%, respectively [36]. By comparing the contribution of PET production and end-of-life stages, the former emits higher GHGs than landfilling and incineration with energy recovery, as per the study. PET production involves high energy-consuming processes, including the extraction of crude oil [35]. Consequently, recycling outperforms other waste treatment methods in protecting the environment. Both recycling types, open and closed, replace the virgin PET amount with the recycled PET amount. Therefore, less crude oil and energy consumption will be attained.
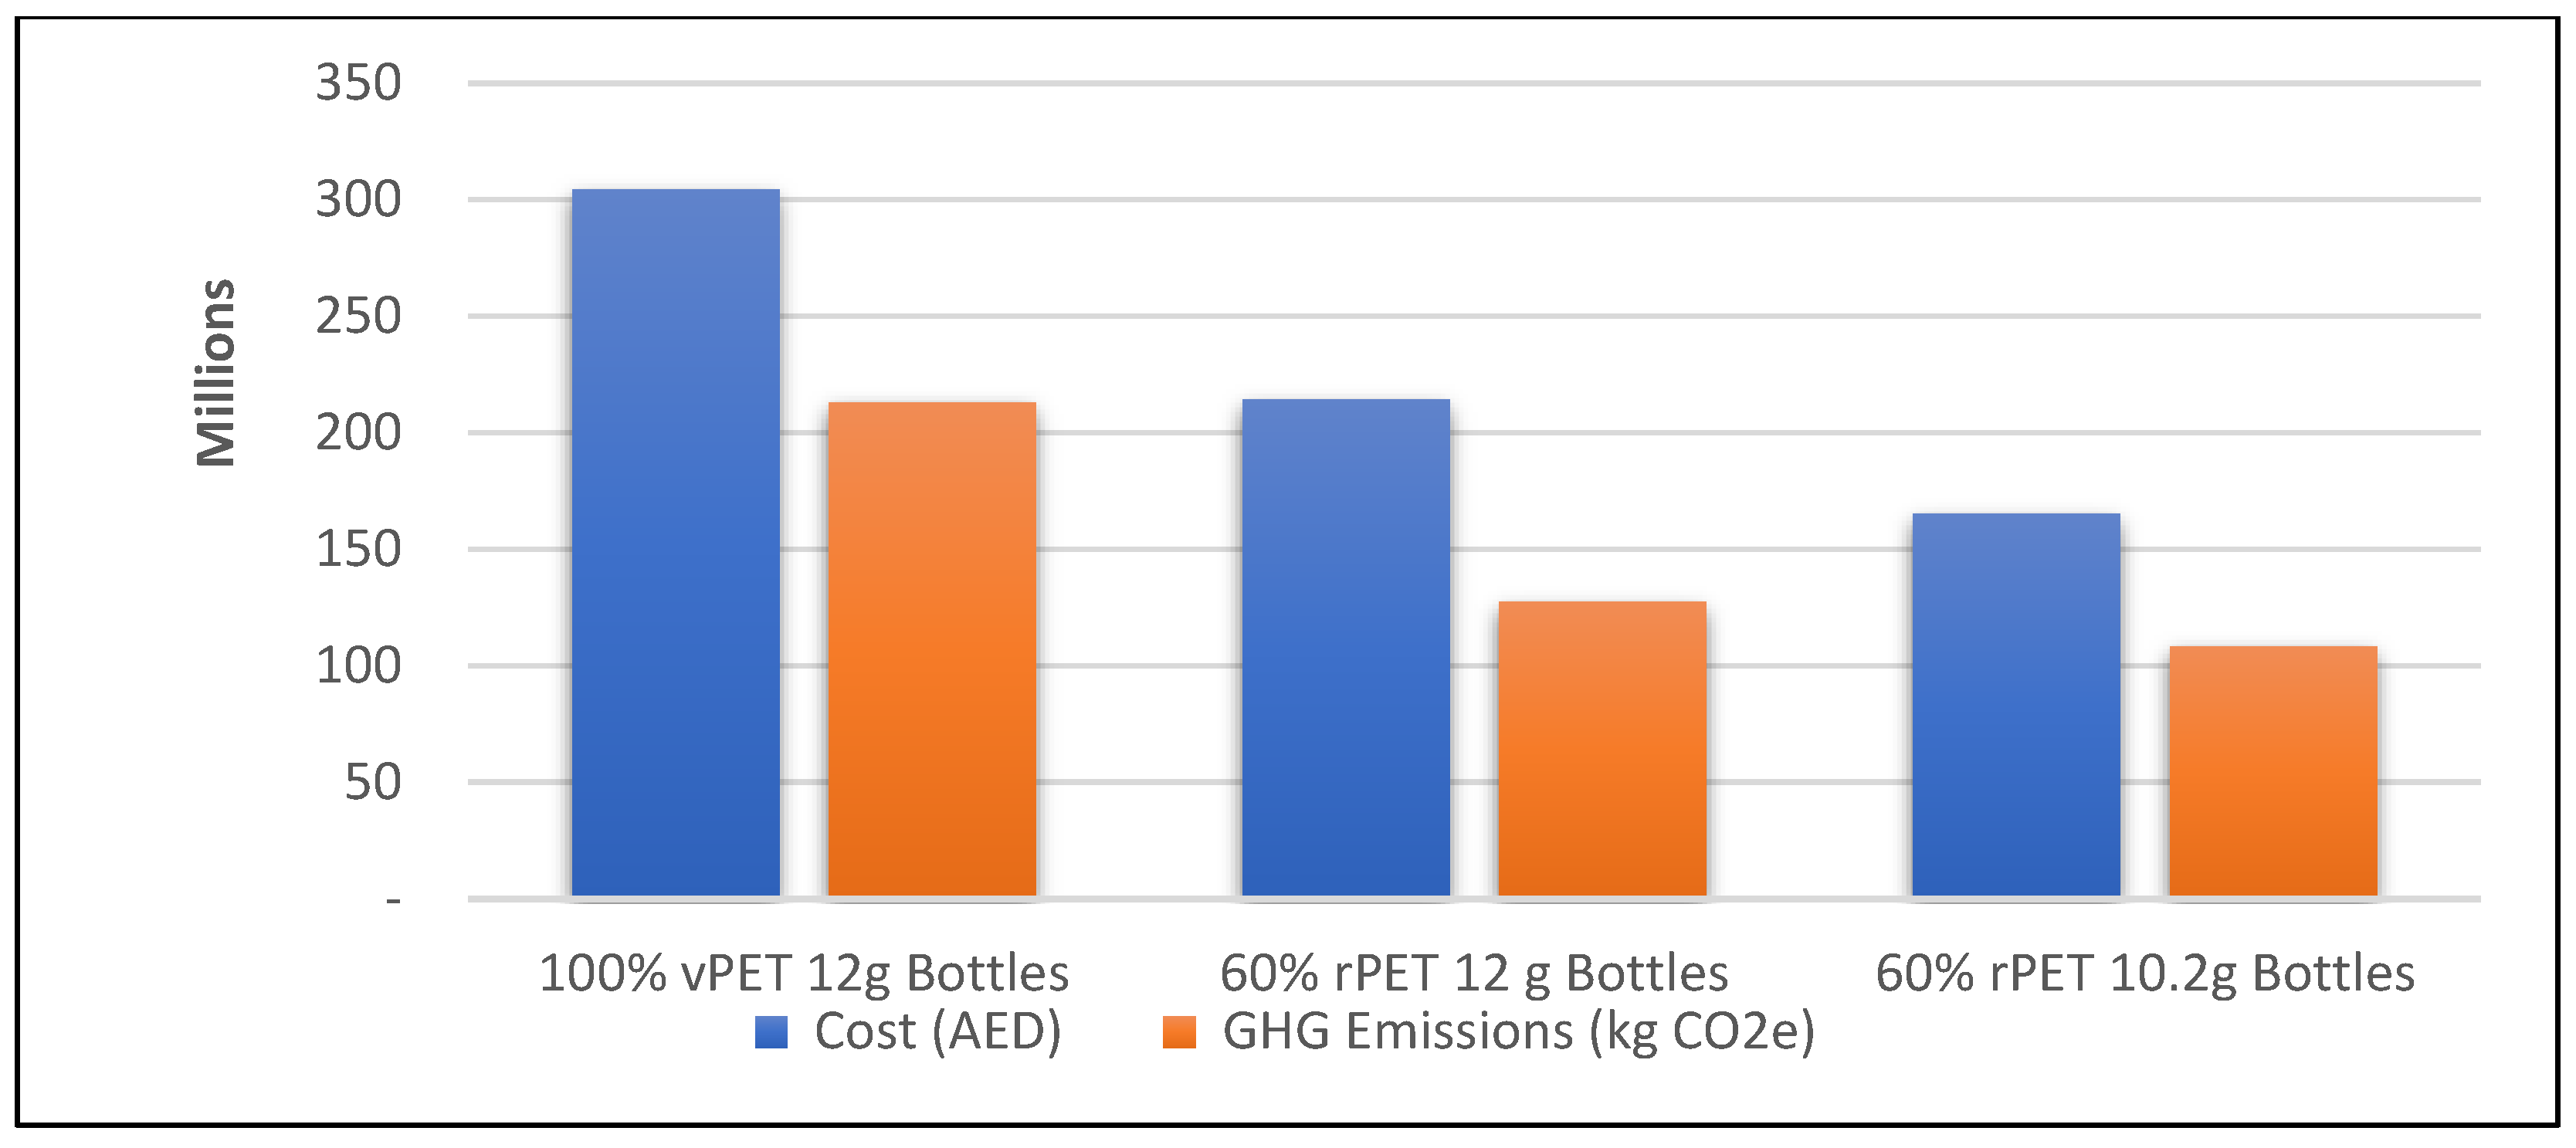
Since vPET production has the highest environmental impact, it is recommended that the bottle weight be decreased [36]. The weight range of water bottles in the UAE is between 10.2 g and 12.7 g. Similar bottles for sparkling water and still water have different wall thicknesses and therefore different weights. Carbonated water bottles are heavier because they cannot deform under the pressure of carbon dioxide. Accordingly, Figure 10 shows what happens to the cost and carbon footprint if the bottle weight decreases to 10.2 g. While the overall cost reduction is about 46%, the carbon footprint reduction is about 50%. In this case, the cost saving accounts for AED 0.036 per bottle as part of the reward. This tends to increase the possibility of increasing the reward for the DRS.
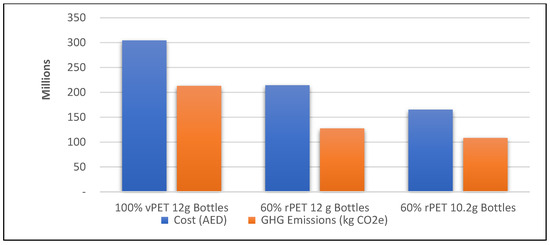
Figure 10.
Cost and GHGs emissions summary emphasizing the effect of weight reduction.
4. Conclusions
This research proposes a deposit refund system to collect PET water bottles. The collected bottles will be the input for closed-loop recycling. This type of recycling can produce water bottles using combinations of food-grade rPET and vPET. Based on the research findings, the following conclusions are made:
The maximum recycled content that can be reached using 80% of the 0.5 L water bottle demand is 60%. Therefore, other PET containers should be collected and recycled to reproduce such water bottles and achieve higher recycled content levels.
The rPET bottles have a 30% reduction in reproduction costs compared to the current production of vPET bottles.
The research shows a high initial cost for the proposed system. However, by considering the savings in crude oil and energy and the benefits of eliminating landfills and decreasing GHG emissions, the benefits may outweigh the cost.
The proposed deposit–refund system could have a positive impact on the local economy by reducing the manufacturing costs of water bottles and reducing landfill buildup. Therefore, building such a DRS might have some financial rewards for residents who return used water bottles to RVMs.
Consequently, it is recommended that a detailed cost–benefit analysis of the proposed system be performed to decide whether the benefits outweigh the cost. Additionally, other factors, including social ones, should be considered to measure the UAE population’s willingness to use the DRS and closed-loop recycling, which would help predict the recycling rate before the implementation occurs.
Author Contributions
Conceptualization, W.A.J.; project administration, W.A.J.; methodology, W.A.J.; formal analysis, W.A.J.; funding acquisition and writing—review and editing, W.A.J.; data curation, E.A.; investigation and validation of the proposed system, E.A. All authors have read and agreed to the published version of the manuscript.
Funding
APC was partially funded by Abu Dhabi University, UAE.
Data Availability Statement
All available data are included in the manuscript.
Conflicts of Interest
The authors declare no conflict of interest.
References
- Abu Jadayil, W.; Khraisat, W.; Shakoor, M. Statistical analysis for the main factors causing car accidents. ARPN J. Eng. Appl. Sci. 2020, 15, 696–715. [Google Scholar]
- Abu Jadayil, W.; Shakoor, M.; Bashir, A.; Selmi, H.; Qureshi, M. Using SERVIQUAL to investigate the quality of provided wireless communication services in UAE. Int. J. Qual. Serv. Sci. 2020, 12, 109–132. [Google Scholar] [CrossRef]
- Fouad, R.; Abu Jadayil, W.; Shakoor, M. Applying quality improvement tools for a canning plant. ARPN J. Eng. Appl. Sci. 2018, 13, 4956–4965. [Google Scholar]
- Shakoor, M.; Al-Nasra, M.; Abu Jadayil, W.; Jaber, N.; Abu Jadayil, S. Evauation of provided services at MRI department in a public hospital using discrete event simulation technique: A case study. Cogent Eng. 2017, 4, 1–11. [Google Scholar] [CrossRef]
- Abu Jadayi, W.; Khraisat, W.; Shakoor, M. Different strategies to improve the production to reach the optimum capacity in plastic company. Cogent Eng. 2017, 4, 1–18. [Google Scholar] [CrossRef]
- Shakoor, M.; Abu Jadayil, W.; Jaber, N.; Jaber, S. Efficiency assessment in emergency department using lean thinking approach. Jordan J. Mech. Ind. Eng. 2017, 11, 97–103. [Google Scholar]
- Shakoor, M.; Jaber, N.; Qureshi, M.; Abu Jadayil, W.; Jaber, S. A novel model for benchmarking the performance of retail stores for retail operations using lean manufacturing approach. Int. J. Appl. Eng. Res. 2017, 12, 6686–6692. [Google Scholar]
- Shakoor, M.; Qureshi, M.; Abu Jadayil, W.; Jaber, N. Assessment of retail practices for providing enhanced value added services and improved customer satisfaction using lean manufacturing approach. Int. Rev. Manag. Mark. 2017, 7, 360–366. [Google Scholar]
- Abu Jadayil, W.; Mohsen, M.; Al-Bashir, A. Statistical model representing workers turnover problem in third developing countries: Jordanian industrial sector. Int. J. Hum. Resour. Stud. 2013, 3, 102–110. [Google Scholar] [CrossRef]
- Abu Jadayil, W. Main factors causing workers turnover in Jordan industrial sector. Jordan J. Mech. Ind. Eng. 2011, 5, 161–166. [Google Scholar]
- Quantity of Non-Hazardous Wastes and Treatment Method by Type- Third Quarter; Dubai Statistics Center: Dubai, United Arab Emirates, 2018.
- A Deposit Return System for Scotland; Scottish Government: Edinburgh, Scotland, 2018.
- Acharya, P. Domestic Solid Waste Recycling: Programs and Policies for Dubai; The British University in Dubai: Dubai, United Arab Emirates, 2012. [Google Scholar]
- Walls, M. Deposit-Refund Systems in Practice and Theory; Resources for the Future Discussion Paper: Washington, DC, USA, 2011. [Google Scholar]
- McCloughan, P. Report on the Proposed Deposit and Return System for Beverage Containers in Ireland; PMCA Economic Consulting: Dublin, Ireland, 2017. [Google Scholar]
- Kalinovskaya, I. Implementation Project for Deposit-Refund System in the Republic of Belarus. Master’s Thesis, Lund University, Lund, Sweden, 2016. [Google Scholar]
- Dace, E.; Pakere, I.; Blumberga, D. Evaluation of Economic Aspects of the Deposit-Refund System for Packaging in Latvia. Manag. Environ. Qual. 2013, 24, 311–329. [Google Scholar] [CrossRef]
- Deprez, N. Deposit-Refund Schemes for One-Way Beverage Packaging; University of Ghent: Ghent, Belgium, 2015. [Google Scholar]
- Nashfa, H. Implementing a Deposit Refund System for P.E.T Bottles in the Maldives. Master’s Thesis, Lund University, Lund, Sweden, 2016. [Google Scholar]
- Hogg, D.; Fletcher, D.; Elliott, T.; von Eye, M. Have We Got the Bottle? Implementing a Deposit Refund Scheme in the UK; Eunomia Research and Consultancy: Bristol, UK, 2010. [Google Scholar]
- Davies, P. Cost-Benefit Analysis of a Container Deposit Scheme; Sapere Research Group: Auckland, New Zealand, 2017. [Google Scholar]
- Recycled Polyethylene Terephthalate (rPET) Market; Anshula Mandaokar, Grand View Research: San Francisco, CA, USA, 2021.
- Welle, F. Twenty years of PET bottle to bottle recycling—An overview. Resour. Conserv. Recycl. 2011, 55, 865–875. [Google Scholar] [CrossRef]
- Hopewell, J.; Dvorak, R.; Kosior, E. Plastics Recycling: Challenges and Opportunities. Philos. Trans. R. Soc. B Biol. Sci. 2009, 364, 2115–2126. [Google Scholar] [CrossRef] [PubMed]
- Plastics Market Situation Report; WARP: Banbury, UK, 2016.
- Foolmaun, R.; Ramjeeawon, T. Disposal of post-consumer polyethylene terephthalate (PET) bottles: Comparison of five disposal alternatives in the small island state of Mauritius using a life cycle assessment tool. Environ. Technol. 2012, 33, 563–572. [Google Scholar] [CrossRef] [PubMed]
- Perugini, F.; Mastellone, M.; Arena, U. A Life Cycle Assessment of Mechanical and Feedstock Recycling Options for Management of Plastic Packaging Wastes. Environ. Prog. 2005, 24, 137–154. [Google Scholar] [CrossRef]
- Introducing a Deposit Return Scheme on Beverage Containers; DEFRA: London, UK, 2019.
- UAE Bottled Water Market-Growth, Trends and Forecasts (2017–2022); Mordor Intelligence: Hyderabad, India, 2018.
- Federal Competitiveness and Statistics Authority, UAE. Available online: http://fcsa.gov.ae/ (accessed on 15 January 2023).
- Valentino, G. Life Cycle Assessment of PET Bottles: Closed and Open Loop Recycling in Denmark and Lombardy Region; The Polytechnic University of Milan: Milan, Italy, 2017. [Google Scholar]
- Gandy, S.; Fry, J.; Downes, J. Review of Packaging Deposits System for the UK; Environmental Resources Management: San Francisco, CA, USA, 2008. [Google Scholar]
- Softa, A. Environmental and Economic Assessment of Management of Plastic Packaging Waste. Ph.D. Thesis, Department of Environmental Engineering DTU, Copenhagen, Denmark, 2013. [Google Scholar]
- Waste Statistics, Federal Competitiveness and Statistics Authority, UAE. Available online: https://uaestat.fcsc.gov.ae/en (accessed on 30 January 2023).
- Grigore, M. Methods of Recycling, Properties and Applications of Recycled Thermoplastic Polymer. Recycling 2017, 2, 24–34. [Google Scholar] [CrossRef]
- Dormer, A.; Finn, D.; Ward, P.; Cullen, J. Carbon footprint analysis in plastics manufacturing. J. Clean. Prod. 2013, 51, 133–141. [Google Scholar] [CrossRef]


Disclaimer/Publisher’s Note: The statements, opinions and data contained in all publications are solely those of the individual author(s) and contributor(s) and not of MDPI and/or the editor(s). MDPI and/or the editor(s) disclaim responsibility for any injury to people or property resulting from any ideas, methods, instructions or products referred to in the content. |
© 2023 by the authors. Licensee MDPI, Basel, Switzerland. This article is an open access article distributed under the terms and conditions of the Creative Commons Attribution (CC BY) license (https://creativecommons.org/licenses/by/4.0/).