Abstract
Several theories and case studies have shown that information has little or no direct influence on waste sorting behavior. However, it is often suggested that information plays a vital role by indirectly influencing behavior. This contribution sheds light on how instructive information influences users of a recycling scheme in terms of perception, knowledge and waste sorting behavior. The study was performed as a case study on a student population in a medium-sized city in Sweden. An intervention in the form of modified information that was provided to the users was studied. This information was instructive in nature and adapted to the participants’ needs using the Recycling Behavior Transition procedure, where the users are involved in the development and modification of recycling schemes. New information was designed after investigating how the participants perceived the original information on correct waste sorting, as well as ascertaining their preferred channel for providing the information. Pick analyses and surveys were conducted before and after providing the user-adapted information. The results indicated a trend towards correct participation in the recycling scheme. These results are also discussed in the theoretical context of the Motivation-Opportunity-Ability-Behavior model. The study shows that user-adapted, instructive information can have a significant influence on people’s knowledge of correct waste separation and their overall perception of information.
1. Introduction
Efforts that are made by citizens to separate household waste into different fractions, such as plastics, metal and glass, play a vital role in many municipal recycling schemes. After buying and using a product, the waste management process begins with the user’s decision on how to dispose of it. Many recycling schemes, including those in Sweden, require households to sort their waste at the source, i.e., in the household. The recycling schemes will only receive separated waste streams if people participate in waste sorting properly. If this is done, it enables the waste management facilities to efficiently recover and recycle different materials that can be reintroduced into the production process and replace virgin materials. Therefore, there is a considerable amount of responsibility connected to the first step, i.e., people’s participation in the waste sorting system. However, as opposed to the technical parts of waste management systems, it is often difficult to attain high rates of participation in waste sorting across societies [1].
There are established recycling schemes in all Swedish municipalities, and household waste sorting participation has become a main function within waste management. Still, even though Sweden is often regarded as a country with efficient recycling, waste sorting rates at the household level are far from satisfactory [2]. Therefore, increasing household waste sorting participation is becoming increasingly important when attempting to reach ambitious recycling goals, such as recycling of 65% of packaging by 2020 in Sweden [3].
Within the scientific literature on waste sorting behavior, several factors—and the relationship between them—that influence user behavior have been investigated. Different models classify these factors, and there are different theories that describe the relationships and correlations between these factors [4,5,6]. Although the theories differ slightly, they have certain features in common. Some factors, most notably the intention to sort, directly influence waste sorting behavior, while other factors, such as social norms and attitudes, only have an indirect influence [4,5,6,7].
Rousta et al. [7] listed a variety of factors that have been studied in scientific research (including convenience, attitudes, norms and socio-demographics) and discussed those that are generally seen to influence waste sorting behavior as well as those that have little or no influence. One controversial factor is information, including the type of information provided to the people who are supposed to engage in recycling schemes and how this information is disseminated. The disseminated information may include instructions on correct participation and reminders, reasons for participation and explanations of waste management techniques. There is also a wide range of channels that may be utilized to distribute information. These include, for example, flyers, verbal contact, radio, TV and social media.
Generally, information alone has little effect on waste sorting behavior, and when it does, the effects tend not to be long-lasting [8,9,10]. It has been suggested that this may be due to the interaction between information and other factors [9]. Attitudes, for example, are formed by knowledge and experience, both of which are highly dependent on information received by people [11]. Therefore, the influence of information could be underrated, and it is also difficult to measure. For this reason, the present study aims to clarify the mechanisms of how information influences people who are supposed to participate in a recycling scheme through sorting. The focus is set not only on waste sorting behavior itself, but also on how information affects knowledge and general perception of the local recycling scheme. Moreover, attitudes and experiences of the participants are investigated. As it is impractical to assess the effects of all types of information at the same time, the current study focuses on instructive information. This is because it is essential that users know how to sort their waste correctly in order for them to participate properly in the system. The term ‘information’ will thus henceforth only refer to instructive information on correct participation in waste management schemes.
Apart from the above mentioned aspects that influence waste sorting behavior, other reasons for ineffective information could be the way that the information is disseminated and the media channel used to present it to the users [10,12,13]. Many studies used written information in the form of brochures distributed once or multiple times [8,9,10]. However, it has been found that this medium is the least attractive and the least effective channel to disseminate information targeted at increasing waste sorting behavior [14]. This raises the question as to why many studies focus on information that is provided in this way, especially since most studies do not give a reason for their choice. Studies that focus on other methods of disseminating information, such as verbally prompting waste separation or installing block leaders, found that these lead to significantly higher success rates than providing written information [10,12]. Some conclude, however, that the most effective approach to providing information has to be identified separately for every population and in close contact with the users [11,14,15,16,17].
One procedure to investigate waste sorting behavior in close collaboration with target groups is the Recycling Behavior Transition (RBT) procedure [16]. This procedure is a recent addition to scientific efforts targeted at increasing the participation in waste management systems through sorting. It aims to increase waste sorting rates among any given population by designing interventions in consultation with people whose participation the scheme relies on. This is achieved by using a combination of qualitative and quantitative methods. The qualitative methods include semistructured interviews with individuals from the target population as well as observations of the target population’s waste sorting behavior and the existing waste infrastructure the target population is supposed to use. This is to provide a better understanding of the general situation in the area of interest and the population’s attitudes and beliefs regarding waste sorting. This knowledge is then used in combination with results from quantitative components to design an appropriate intervention aimed at improving waste sorting behavior. The quantitative methods include pick analyses (composition analyses of waste samples, see Section 2.3) and surveys. The quantitative components of the RBT procedure are tools to evaluate the impact of the intervention and are thus conducted both before and after the implementation of the intervention.
Hence, the interventions created by using this procedure are adapted to the needs of the people they target and are thus more likely to influence waste sorting. This reduces the risk of introducing interventions with little or no effect, such as written information [10], given that the population has already confirmed the suitability of the interventions. The RBT procedure also evaluates the impact of interventions after their introduction. This gives researchers a chance to draw meaningful conclusions and give direct and clear suggestions to stakeholders on how to implement interventions and what outcomes to expect [7].
The present study investigates how user-adapted, instructive information influences the perception of information, knowledge and waste sorting behavior. It combines pick analyses, interviews and surveys within the RBT procedure to ascertain the type of information that users think they need to improve their waste sorting behavior, as well as implementing this knowledge in the form of an intervention and evaluating its impact.
2. Materials and Methods
2.1. Study Area
The study was performed in Borås, a medium-sized Swedish city of 112,000 inhabitants [18]. The local recycling scheme is based on curbside collection for combustible and food waste. Both of these fractions are supposed to be sorted by the people who generate the waste. The two fractions are then collected in the same container but in differently colored bags. Sorting is encouraged by providing free white and black plastic bags for each of these two fractions. People are supposed to use white bags for the combustible fraction and the black bags for food waste. The bags are then separated optically at a separation plant located close to the city. The food waste is then converted into biogas via fermentation. The combustible waste is incinerated in a waste boiler to generate electricity and hot water for district heating. The combustible waste fraction should only include nonpackaging and nonrecyclable materials that are not hazardous. People are supposed to sort the recyclable waste and packaging materials and place them in the proper containers at drop-off stations that are distributed in the city. Containers for metal, paper, glass, plastic packaging and newsprint are provided at these drop-off stations. Other fractions, such as hazardous or bulky waste, are to be taken to one of five recycling centers in the municipality.
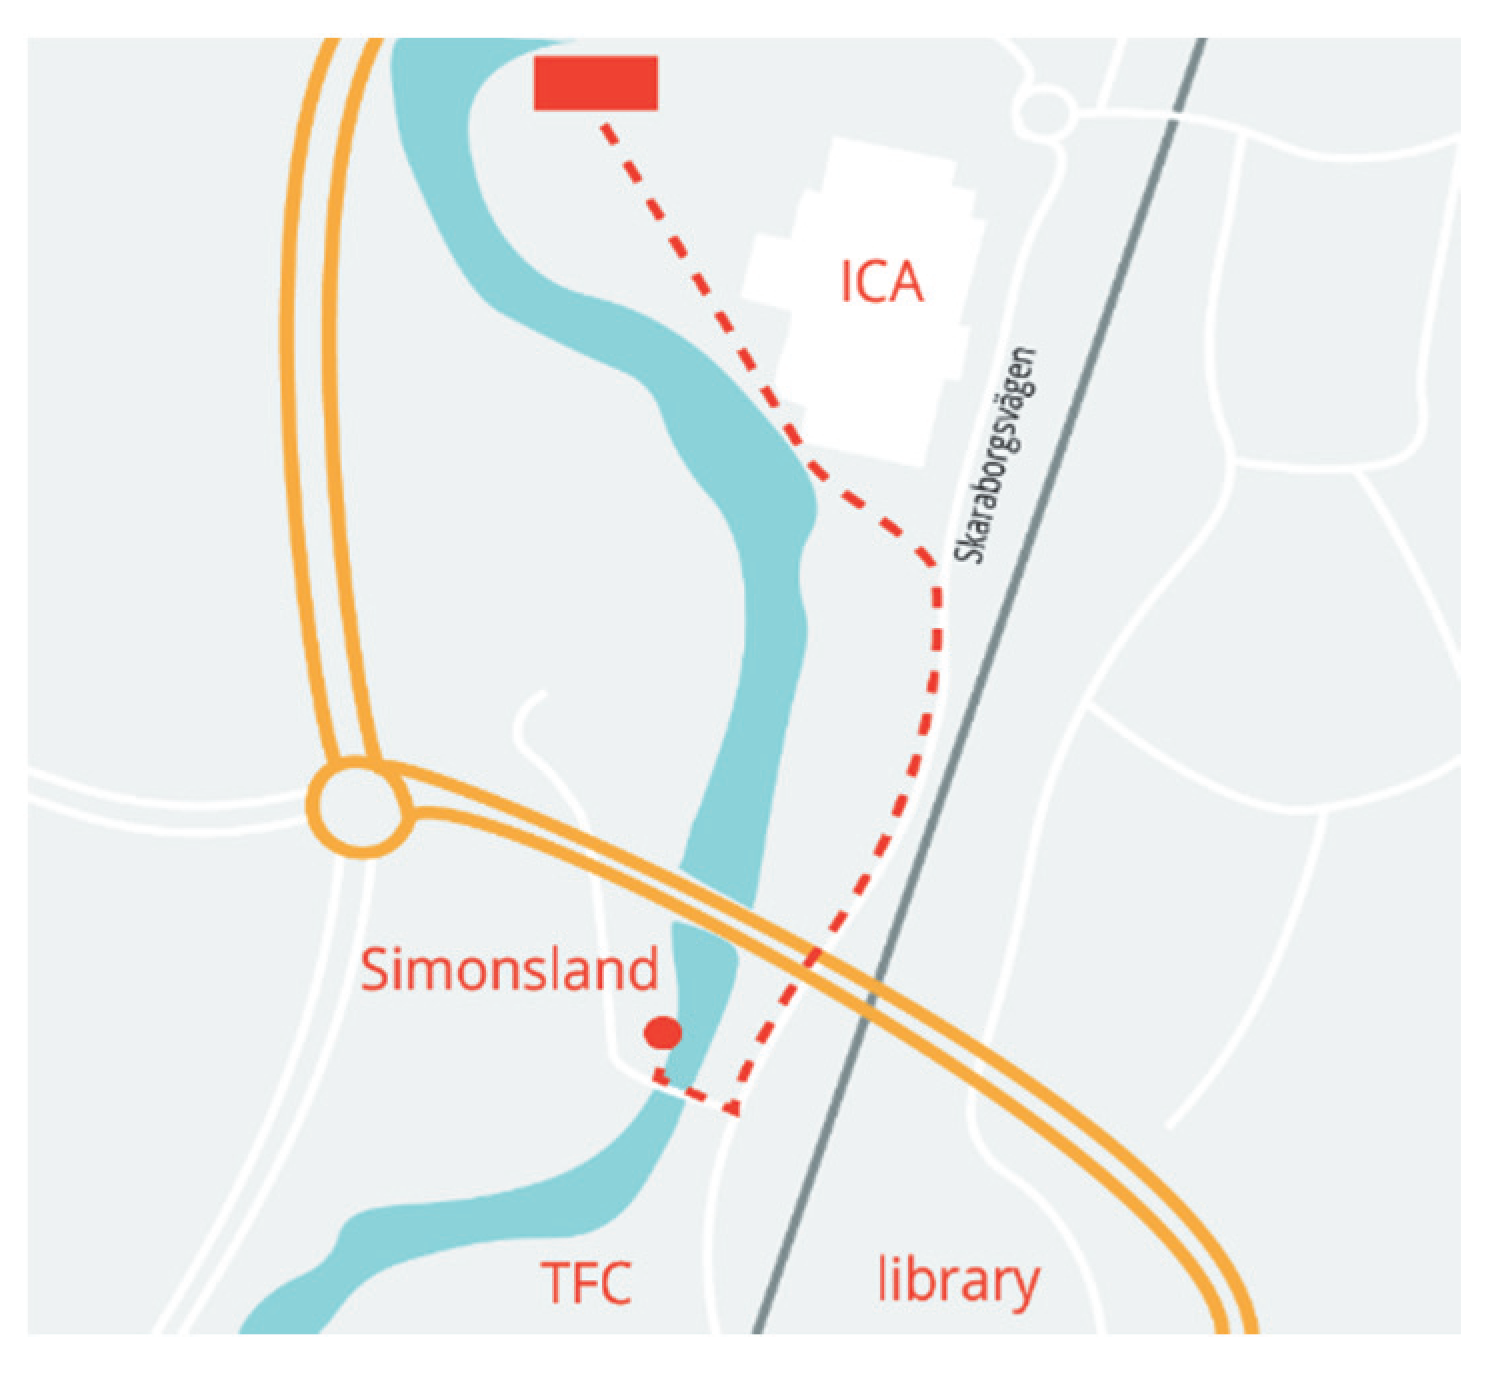
The study area is a student housing complex on the campus of the University of Borås. It consists of 160 one-room apartments for students only. Two-thirds of the tenants were female, and the average age was 23.6 years. Over a third of the tenants were international and mainly came from European and Asian countries. Only 10% of the tenants were initially from Borås. The periods that the students reside at the complex are usually short and range from a few months to a few years. This results in high tenant turnover. The closest drop-off station is 500 m from the housing complex (Figure 1).
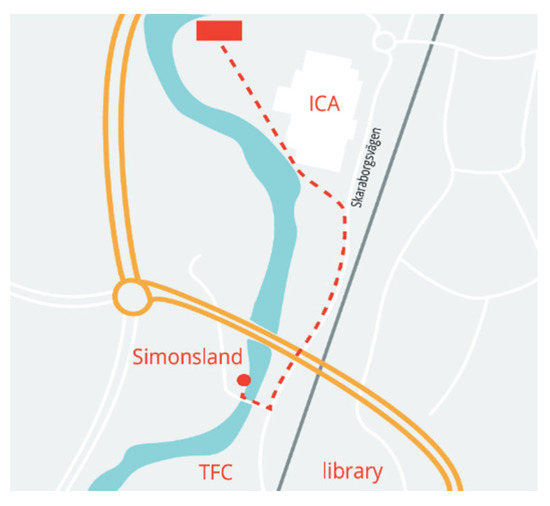
Figure 1.
Simplified map of the study area. The student housing is called Simonsland. Textile fashion center (TFC) and the library indicate the positions of the university buildings. ICA is a supermarket. The red box represents the drop-off station, and the dotted line the shortest route from the student housing (500 m).
A second student housing complex on the university campus was used as a reference area. It consists of 40 single-room apartments for students only and is located 900 m from the closest drop-off station. While there are containers provided to collect the white and black bags outside the housing complex in the study area, the reference area is equipped with a vacuum collection system for these two fractions. Although the collection systems for the black and white bagged fractions differ, it was still deemed to be the most reliable reference area for this study.
2.2. Design of the Study
The design of the study was based on the RBT procedure [16] with the goal of improving instructive information, including the way that it is disseminated, by interacting closely with the tenants of the study area. In the first part of the study, the waste sorting behavior in the study area was quantified using a pick analysis. Using the results of the pick analysis, five semistructured interviews were conducted with voluntary participants. This is a relatively low number of interviews. It was not possible to conduct more of these types of interviews due to the reasons discussed in Section 4.3. Based on these interviews, a survey was created for all tenants in the study area. Two-thirds of the tenants took part in the survey. The results of the survey were used to design and disseminate new types of instructive information to the tenants. After a period of six weeks, which gave the tenants time to adapt to the new information, a second survey and pick analysis were performed. This was done to evaluate the effects that the intervention had on waste sorting behavior, knowledge on correct waste separation and how the new information was perceived. The timeline of the study is illustrated in Figure 2, and the design and main methods are described in the following sections.

Figure 2.
Timeline of the research project.
2.3. Pick Analyses
Pick analysis is a tool to objectively quantify waste sorting behavior in the form of a waste composition study and was thus conducted in the study and reference areas [1]. During a pick analysis, waste is collected from sources where people discard their waste. These can be, for example, waste containers or waste bags. Afterwards, the collected waste is often mixed to ensure uniformity and then sampled. The number of samples and sample size depends on the total amount of generated waste in the studied area. The samples are then sorted into the different waste fractions. Separation into the different fractions is usually done in accordance with the local recycling scheme but may differ depending on the goal of the analysis (for example, if only the composition of one particular fraction is to be analyzed). This procedure enables the analysis of people’s waste sorting behavior by identifying, for example, frequently mis-sorted fractions [19]. This ensures reliable data, especially given that studies have shown that people’s perceived and actual waste sorting behavior can differ significantly [20].
Furthermore, pick analyses that are performed before and after an intervention can yield data on the impact of the intervention. Pick analyses have been a common tool to assess waste sorting behavior in scientific literature and for governmental agencies [19]. The pick analyses in this study were based on Swedish standards [21].
There are fourteen curbside collection containers in the study area where people can discard their black and white bags. A vacuum collection system is provided in the reference area. In both cases, the containers are meant to contain only combustible and food waste sorted into white and black plastic bags, respectively. Three sources of error can arise. First, the white and black bags can contain wrongly sorted waste. Second, other types of bags might be used. This includes any other color than black and white, as well as paper bags which often cannot be closed and therefore easily spill their contents. Third, some loose waste may not be found in any bag at all.
Previous pick analyses in the same city showed that people’s waste sorting rate for the food waste fraction is relatively high [2,22]. Therefore, the contents of the black bags (meant for food waste) were not analyzed in the present study. Instead, the study focused on all the other types of waste in these containers, i.e., loose waste and waste in all types and colors of bags except for black plastic bags. During the pick analyses, the collected waste was separated into seven main fractions and was weighed on a wet basis.
For the present study, about 200 kg of waste was sampled in each of the two analyses in the study area, with the first and second analyses representing 75% and 90% of the total waste of one week of collection, respectively. As it was not possible to collect all waste in this area, the fourteen containers were put in a random order, and the waste that was used for further analysis was extracted until the maximum capacity was reached. The maximum capacity of the collection equaled three full containers. Bias was avoided by applying this method of sampling. This bias refers to the observation that the tenants appear to dispose of their waste in some containers more frequently than in others. In the reference area, all waste of one week was collected due to the lower overall mass.
2.4. Semistructured Interviews
After the waste sorting behavior was assessed through pick analyses, it was necessary to get a deeper understanding of the participants’ perception of their sorting behavior. For this reason qualitative semistructured interviews were conducted with five participants who were living in the study area. Face-to-face conversations can potentially bring new ideas and perspectives to the fore [23]. This indeed provided insight into the interviewees’ thoughts about waste sorting. During these interviews, the personal relation of the participants towards waste sorting was discussed. This included experiences, attitudes, knowledge, behavior, perception of provided information related to waste sorting, perception of the local recycling scheme and thoughts on the improvement of the recycling scheme. The interviewees were asked few general questions related to the main topics of the interview, and for each question they were given time to explain and elaborate on their answers. Depending on their answers, additional questions were asked to encourage them to further explain their viewpoints and to follow lines of thought that had come up during the conversation.
The tenants of the student housing were contacted via letters and invited to participate in the semistructured interviews. Eight people volunteered to participate. However, due to an interference with an examination period, three of them cancelled their participation. The interviews were conducted in English by the same researcher who led all pick analyses and surveys. The interviews were recorded and transcribed. The transcripts were coded by key topics and statements, and the participants’ opinions regarding those statements were graded according to the intensity of their agreement or disagreement. This is an interpretational approach, which is deemed sufficiently accurate to create a general understanding of the participants’ thoughts and beliefs. The results of the coding were compared between all five interviews. The insights gathered from these interviews were used when designing the survey.
2.5. Survey
This quantitative method was chosen as it requires a shorter interaction time between the interviewer and the interviewees, which allows for a larger proportion of the tenants to be included and thereby represented. In order to ensure a large number of participants, a high response rate was crucial as the total number of tenants was quite small. A larger number of participants increases the statistical reliability of the data. The survey was performed in the form of face-to-face interviews as this approach is known for its high response rates [23,24,25]. At a later stage, a second survey was designed to evaluate the impact of the intervention in terms of participants’ perception of information and knowledge about correct waste sorting.
The first survey consisted of fourteen questions covering socio-demographic factors, the participants’ experience with waste sorting, their attitude towards waste sorting, their knowledge on correct waste sorting and their perception of the information on correct waste sorting that they had previously received. Appendix A presents detailed information about the first survey. Furthermore, the participants were asked about the type of information that they would like to receive. The survey entailed open questions, questions that were graded (one to five, five being best), or questions that were to be answered in multiple-choice and a yes/no alternative. The questions were limited in complexity and number because the survey was conducted using face-to-face interviews. Approximately 160 tenants were approached at the entrances of the housing complex or by knocking on apartment doors. 106 tenants agreed to be interviewed as part of the survey. Student volunteers conducted the interviews. They were instructed exactly how to ask the questions to ensure comparability of the answers. The same researcher led both surveys.
The second survey was performed similarly to the first and consisted of ten questions. Appendix B presents detailed information about the second survey. Six of the questions were repeated from the first survey, which enabled an analysis of possible change in perception. The other four questions focused on the participants’ perception of the intervention. Ninety-three of the 160 tenants agreed to be interviewed. The rationale for choosing each of the questions for both surveys, as well as the results of the surveys, are presented in Appendix A and Appendix B.
One of the six questions that were repeated in the second survey investigated the time of stay in order to be able to identify tenants who had moved in after the implementation of the intervention. Another question enquired about the source of knowledge on local waste sorting to evaluate any changes before and after the intervention. The other four questions were essential to understand the impact of the intervention on the waste sorting behavior of the tenants. These questions covered the influence of user-adapted information on the participants’ perception of information, their perceived knowledge of waste sorting and their waste sorting behavior. Three of the four questions were graded to enable statistical analysis. For the tested behavior, the interviewees had to state how they would sort each of three examples of waste fractions. Every interviewee received a grade between one and four depending on the number of wrong answers. In this way, the question was graded and analyzed along with the other graded questions.
The four graded questions that were repeated in both surveys are the following:
- Q.A
- (perceived behavior): How well do you sort your waste here in Borås? (5-grade)
- Q.B
- (perceived knowledge): How well do you know how the sorting system in Borås works? (5-grade)
- Q.C
- (tested behavior): Where would you put the following waste objects? (4-grade)
- Q.D
- (perception of information): Do you think it* was sufficient information to participate/sort? (5-grade)
- * Question D refers to the previous question (see Appendix A and Appendix B), which asks how the interviewees had learned about correct waste sorting in the local recycling scheme (see Appendix A and Appendix B). In case the answer did not contain the term ‘information’, an additional question was asked about whether the interviewee had received any information.
The statistical analysis of the results to these questions included the calculation of Pearson correlations between the perceived behavior (Q.A) and the tested behavior (Q.C) for each survey. To compare the two surveys with each other, a Mann-Whitney test was applied on each pair of answers to each of the four graded questions. The Mann-Whitney test is a nonparametric test based on median values.
2.6. Intervention
The intervention was implemented at the beginning of March 2019 and consisted of four types of information. First, the old stickers on the outdoor curbside collection containers were supplemented with modified stickers. These included pictures of examples of waste items that should be sorted in the white and black plastic bags (that are to be disposed of in the containers). The stickers also stated that other waste fractions, such as recyclables, should be taken to drop-off stations. The information was given in the form of pictures rather than text because this was thought to be more appealing given that the participants had suggested such a design. Appendix C shows the stickers used before the intervention as well as the user-adapted stickers along with the other types of information.
Second, posters were put up at all entrances to the building in the study area. The posters were based on the same design as the stickers on the curbside collection containers. However, the bottom part of the posters, which advises the tenants to take other fractions like recyclables to the drop-off station, is extended. This extension included information on and example pictures of recyclable fractions, as well as a simplified map with directions to the nearest drop-off station.
Third, a letter was sent to all tenants containing a detailed information sheet explaining correct waste sorting. This information sheet was a DinA4 paper printed on both sides. This was meant to be kept at home and consulted when necessary. Fourth, all apartments are provided with waste bins under the kitchen sink to encourage the sorting of combustible and food waste into the white and black plastic bags. These bins are for temporary storage until the tenants take the bags to the curbside collection containers. For this reason, the letter contained stickers for each of these bins and the fractions that are supposed to be sorted into them. The letter also included a description of how to place the stickers. Each sticker had the name of the waste fraction, i.e., combustible or food waste, with pictures of relevant items of waste that should be discarded in each bin.
3. Results
3.1. Pick Analyses
Two pick analyses were conducted in both the study and reference areas. For each area, one pick analysis was conducted prior to the intervention, and another one was conducted following the intervention. As mentioned earlier, waste in black plastic bags was not included in this study. All other waste was analyzed (i.e., waste in white plastic bags, bags of other colors, bags made from other materials or loose waste in the curbside collection containers). Hence, the mass of waste analyzed always excludes waste in black plastic bags unless explicitly stated otherwise. Approximately 200 kg of waste was collected in each of the two pick analyses in the study area. This was about 75% and 90% of the total mass in the bins for the first and second pick analysis, respectively. In the reference area, all waste generated in one week was analyzed because of the smaller volume of waste. The results from the pick analyses in the study area are shown in Table 1.

Table 1.
Results of the pick analyses in the study area (160 single-room apartments). The first analysis took place before implementing the intervention, and the second took place after the intervention was implemented.
As shown in Table 1, 38.6% of the mass in the curbside collection containers in the first pick analysis was mis-sorted recyclables. This excludes black plastic bags which were not analyzed as part of this study. The percentage of mis-sorted recyclables was lower (36.3%) for the second pick analysis. This decrease is minor and not significant. Nonetheless, it should also be noted that the total estimated mass of waste was 50 kg or 18% less in the second pick analysis, which is a substantial decrease. This indicates that the tenants in the study area decreased the total mass of mis-sorted recyclable fractions disposed of in the containers. It is not clear whether this is due to tenants taking recyclable fractions to the drop-off station rather than discarding them in the combustible waste, or whether it was simply due to an overall reduction in waste. Although there is no proof for this in the present study (since the study did not include pick analyses at the drop-off stations), a previous study in a similar housing area showed that a decrease in the total mass of mis-sorted recyclable fractions in white bags was accompanied by an increase of correctly sorted recyclables at the drop-off station [22].
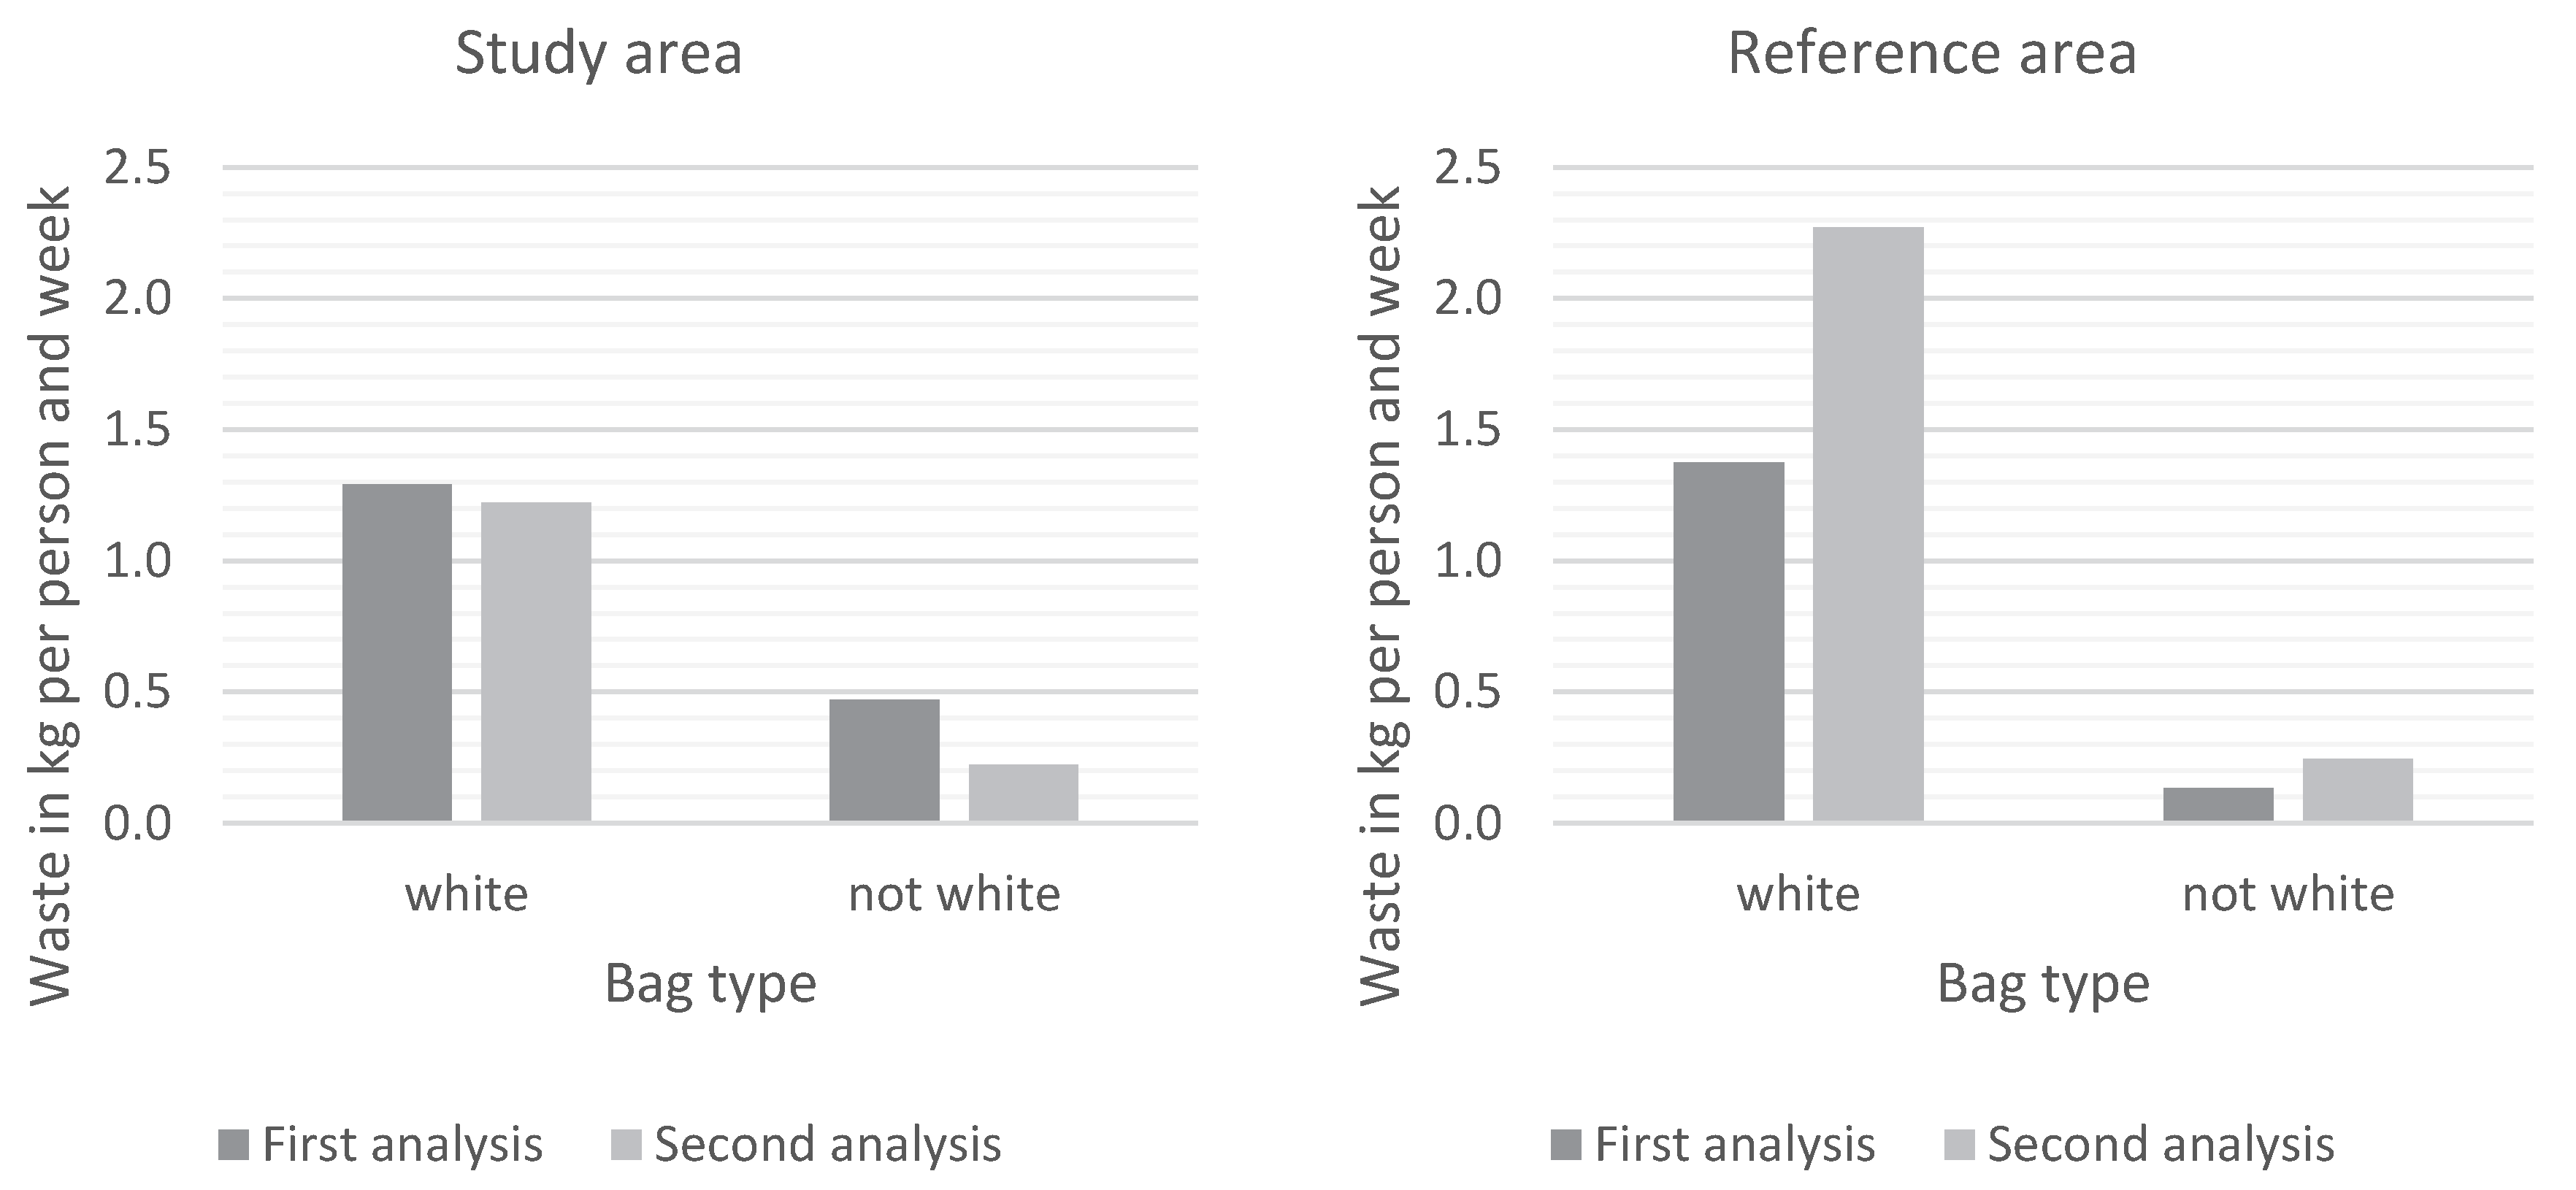
In order to obtain a more detailed understanding, the amounts of waste were expressed in kg per person and week (kg/p/w). The most basic requirement for correctly participating in the curbside collection scheme is to use correct waste bags (white plastic bags for combustible waste and black plastic bags for food waste). Because the black plastic bags were not included in this study, the focus was on white bags. Figure 3 shows the amount of waste (kg/p/w) in white plastic bags and the amount that is not found in white or black plastic bags, such as loose waste and waste in different types and colored bags.
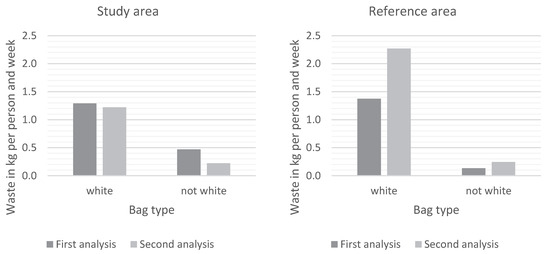
Figure 3.
Amount of waste per person and week displayed for the types of bag analyzed in this study. Ideally, there should only be white bags. Any other colored bag or loose waste is incorrectly disposed of according to the local recycling scheme. Black bags, intended for food waste, were not considered in this study.
As illustrated in Figure 3, the difference in total mass of the waste between the two pick analyses was much larger in the reference area compared to the study area. This posed a major obstacle for the interpretation of the data because no intentional changes had taken place at the reference area. No reasonable cause for the alteration could be identified. In order to interpret and compare the data between the areas, it was decided to focus on the observed patterns of sorting in both areas.
In the study area, 73% of all the waste that was analyzed in the first pick analysis was discarded in white bags. This number increased to 85% in the second pick analysis. This indicates that the new information motivated the tenants to use white bags for their waste instead of using no bags or other types and colors of bags. This is an important change in waste sorting behavior since it enables waste management systems to handle waste in sustainable and appropriate ways. As mentioned above, the total amount of waste in the second pick analysis was estimated to be reduced by 18%. Furthermore, a 5% decrease in white bags and a 53% decrease in waste that was not in white bags were observed.
The first pick analysis done in the reference area revealed that 91% of the waste had been sorted in white bags. This was slightly reduced to 90% in the second analysis. Hence, there was a constant high percentage of waste in white bags, while only minor changes were observed in the use of white bags. The overall higher tendency to use white bags as compared to the study area was expected due to the vacuum collection system in the reference area. This is because the openings of the collection pipes in this system only allow tenants to dispose of relatively small white plastic bags, which makes it difficult to dispose of larger bags. The white bags that are provided to tenants are slightly smaller than plastic shopping bags, which do not fit through the openings of the collection pipe.
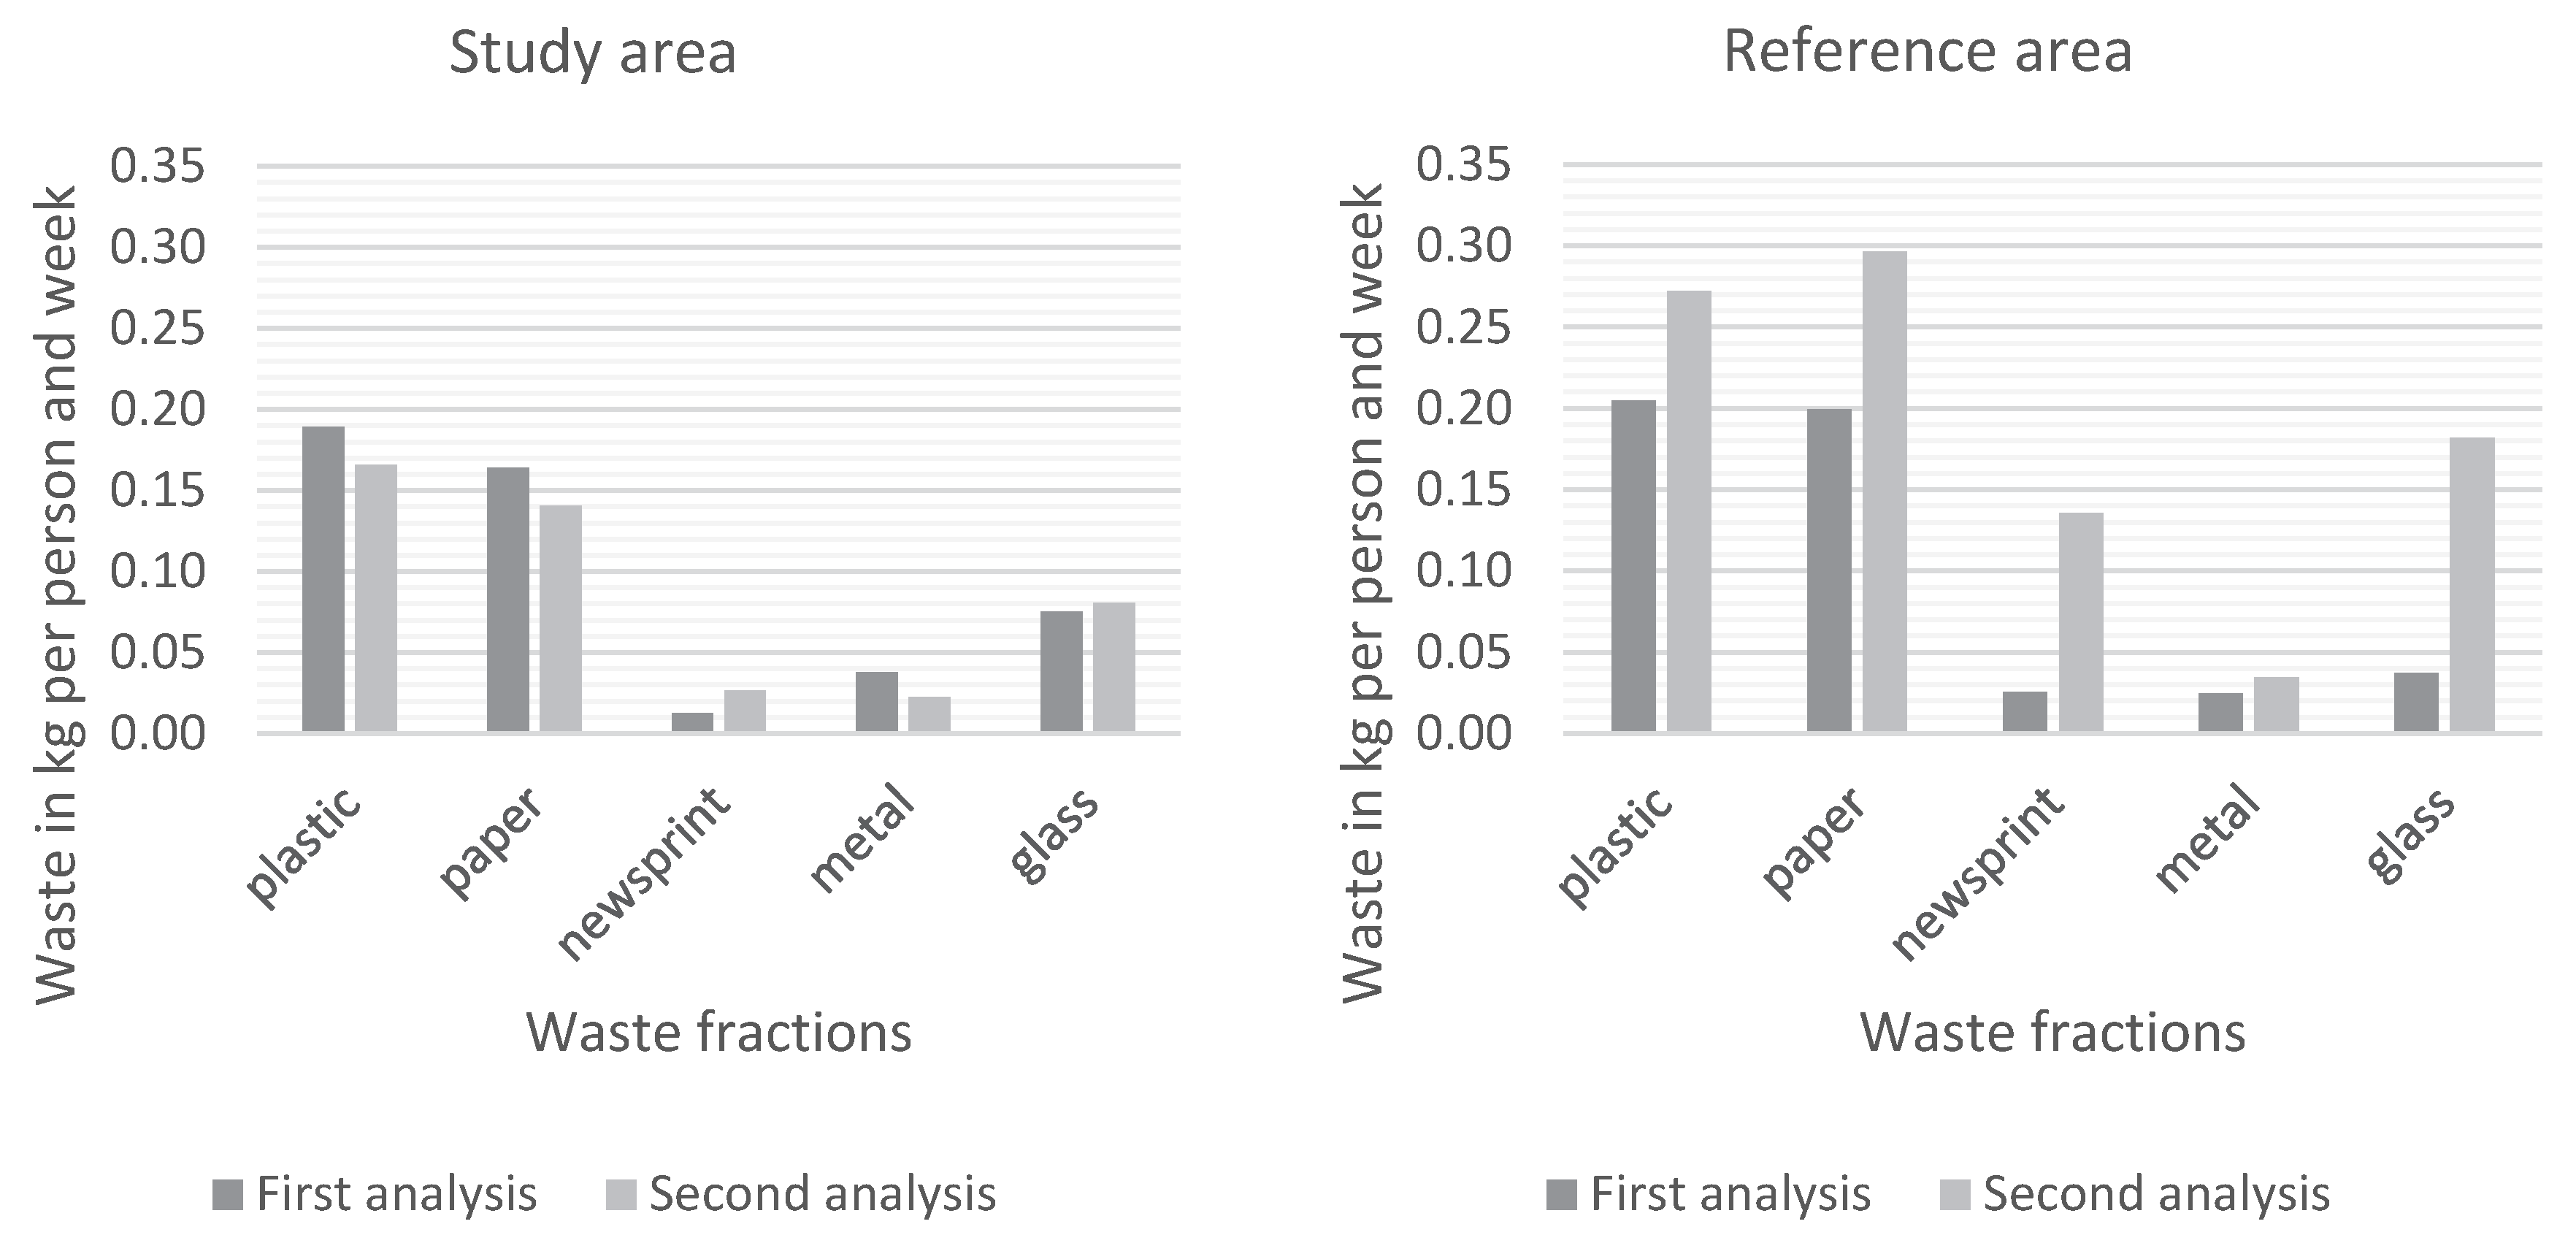
It can be assumed that tenants in the study area who were still not using white bags after the intervention had either not been reached by the information or that they actively decided not to participate in the recycling scheme. Furthermore, in addition to combustible and food waste, the intervention focused on recyclable fractions, such as plastic packaging, paper packaging, newsprint, metal packaging and glass packaging. For this reason, a deeper analysis of the pick analyses considered only these fractions in the white plastic bags. Figure 4 shows the amount of different types of recyclable fractions (kg/p/w) in the white bags.
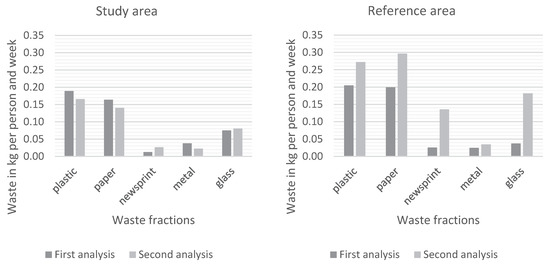
Figure 4.
The mass of recyclables in white bags per person and week in the study area and the reference area. According to the local recycling scheme, there should not be any recyclable fractions in white bags.
As discussed above, the focus of the analysis is on the relative changes in the masses of the discarded materials. The mass of three of the five recyclable fractions decreased after the intervention in the study area. The biggest reduction (40%) was observed in metal packaging. Plastic and paper packaging were reduced by 12% and 14%, respectively, which is more than the overall reduction of waste in white bags (5%). A slight increase of 7% was observed for glass packaging, while the amount of newsprint doubled (115%). This increase, however, may have been due to an overall higher tendency to sort waste into white bags (Figure 3). During the first analysis, only 28% of all newsprint was found in white bags, whereas this increased to 78% during the second pick analysis. The same observation was made for glass packaging. In total, the recyclable waste decreased after the intervention in the study area.
In the reference area, the mass of each fraction as well as the overall mass increased. The largest increases were for newsprint (430%) and glass packaging (390%). Both fractions only contribute slightly to the overall mass compared to the other fractions, and a single catalog, glass jar, or bottle weighs a lot. Therefore, when tenants discard more of these fractions, the impact on the outcome of the pick analysis of that fraction will be large. That is, dense types of waste coupled to small populations can cause large fluctuations in the results. There was also an increase in plastic (33%), paper (49%) and metal packaging (40%) from the first to the second pick analysis. However, the change was smaller than the overall increase observed in the white bags (65%). This relative decrease in recyclables in the reference area was to a large extent due to a decreased consistency in sorting those three fractions into white bags. This means that there was less plastic, paper and metal packaging in the white bags. At the same time, an increase in weight of each of these fractions was detected in other types of bags or loose waste. As a consequence, no clear trend in the relative composition of the analyzed waste was observed.
In the study area, the consistency to sort into white bags had increased for all recyclable fractions but metal packaging, which had decreased slightly from 95% to 92%.
All analyzed fractions in the white bags and their masses and changes are shown in Table 2.

Table 2.
The amount of recyclables (kilogram per person and week) in the white bags and changes between the pick analyses for both the study and reference areas.
3.2. Surveys
Two statistical analyses were performed for the four graded questions that appeared in both surveys. The questions were:
- Q.A
- (perceived behavior): How well do you sort your waste here in Borås? (5-grade)
- Q.B
- (perceived knowledge): How well do you know how the sorting system in Borås works? (5-grade)
- Q.C
- (tested behavior): Where would you put the following waste objects? (4-grade)
- Q.D
- (perception of information): Do you think it was sufficient information to participate/sort? (5-grade)
Pearson correlations between the perceived behavior (Q.A) and the tested behavior (Q.C) were calculated for each survey independently. The results showed a moderate correlation of 0.49 in the first survey and a strong correlation of 0.65 in the second survey. This increase indicates that the new information improved the tenants’ judgment of their own sorting behavior.
A second statistical analysis was performed to compare the answers to each of the four graded questions before and after the intervention. This was done by performing Mann–Whitney tests on the answers to each question. The relevant data are shown in Table 3.

Table 3.
The mean values of the answers to Questions A–D before and after the intervention. The significance of each change was calculated by Mann–Whitney tests (third column).
The mean values increased from the first to the second survey for all of the four graded questions (Q.A–D). The increases in perceived knowledge (p < 0.001), perception of information (p < 0.01) and tested behavior (p < 0.05) were statistically significant. There was no significant change observed for perceived behavior.
These results are consistent with those obtained from the pick analyses. The survey showed that the perception of information and the perceived knowledge improved significantly, which proves that the modified information had a positive effect on the way that tenants perceived their knowledge and their relation with the information on household sorting. This was supported by an increased correlation factor between perceived and tested behavior. It indicates that tenants had a better understanding of the accuracy of their behavior which, in turn, indicates better knowledge of correct waste sorting. The slightly weaker significance for the change in tested behavior also corresponds with the results of the pick analyses, since the pick analyses only showed a mild reduction in mis-sorted waste.
The additional questions in the second survey (Appendix B) asked participants to state their preferred part of the intervention. The participants perceived that the overall modified information was beneficial (mean of 4.11 out of 5). The favorite part of the intervention were the posters (Appendix C, Figure A28), which were considered the most helpful by half of the participants. These were considered helpful because, according to the participants, they acted as daily reminders while simultaneously not containing too much information. The information sheets (Appendix C, Figure A29) that were distributed via mail were considered the second most helpful part of the intervention (mentioned by a quarter of the participants). However, many participants admitted to not having read the letter and the information sheet. Similarly, the stickers for the bins (Appendix C, Figure A30) were only implemented by those who had read the letter and were thus not often considered as being helpful (most helpful to 20% of the participants). The stickers on the curbside collection containers (Appendix C, Figure A27) were perceived as being the least helpful (mentioned by 5% of the participants).
3.3. Evaluation of the Intervention
According to the findings of the surveys, the perception of the information had increased significantly. The instructive information that was provided was rated distinctly better (p = 0.004, see Table 3) in the second survey. Moreover, the intervention was well received by the participants, with an average grade of 4.11 out of 5. The information, which was adapted to the needs of the tenants in the study area, was clearly favored over the information that was provided previously.
The knowledge of the participants was tested first by questioning their perceived knowledge of correct sorting in the context of the local recycling scheme. It improved significantly (p = 0.000, see Table 3) from the first to the second survey. Furthermore, the Pearson correlation between perceived and tested behavior was compared between surveys to get a second and more objective understanding of the change in knowledge. It increased from moderate (r = 0.490) to strong (r = 0.649), which indicates that the tenants had a better understanding of the correctness of their behavior due to increased knowledge.
Additionally, the pick analyses showed that the tenants made more use of the white plastic bags, rather than using bags of other colors or no bags at all. This suggests that the information had been seen and understood, given that using white bags is one of the most basic requirements of the local recycling scheme. The pick analyses in the reference area did not reveal changes in the use of white plastic bags, which shows that there is no change without an intervention. In summary, the intervention increased knowledge of correct waste sorting.
Similar to testing knowledge, different methods were used to evaluate waste sorting behavior. The perceived waste sorting behavior was questioned in the surveys. There was no significant change before and after the intervention (Table 3). Additionally, the behavior was tested by giving examples of waste fractions and asking the participants how they would dispose of them. This was considered to be more accurate than asking for perceived behavior since it is known that claimed behavior usually differs from actual behavior [20]. The tested behavior improved significantly between the surveys (p = 0.026 in Table 3).
In addition to the surveys, the pick analysis conducted after the intervention revealed a reduction in the absolute mass of recyclable fractions in the white bags as compared to the first analysis (Figure 4). However, for the whole waste sample, the relative reduction of recyclables was negligible (Table 1). Therefore, the results indicate only slightly improved behavior, even though this could not be confirmed statistically due to the limited number of samples.
4. Discussion
This study aimed to investigate how user-adapted, instructive information influences users of a recycling scheme. The study focused on how new information was perceived by people who received it and how it affected knowledge and waste sorting behavior.
4.1. Discussion of the Results
The results from the pick analyses suggest two general changes in the sorting behavior of the tenants in the study area due to the new user-adapted information. First, there was a decrease in the amount of plastic and paper packaging in white bags, which were the two largest mis-sorted recyclable fractions in the curbside collection containers. Previous research [22] showed that this change was due to tenants’ tendency to discard these waste fractions of at drop-off stations rather than wrongly sorting them into curbside collection containers for food and combustible waste. If this is the case for the present study, then the intervention had a positive effect on the tenants’ waste sorting behavior.
Second, the tenants increased the use of the correct white plastic bags after the intervention instead of discarding their waste in nonplastic bags, bags of other colors or no bags at all. According to the local recycling scheme, using white bags for anything but combustible waste is incorrect. Still, the increased use of these bags indicates that the intervention had triggered a change in waste sorting behavior. This suggests that the information had reached the tenants and motivated them to change their behavior, even though it was not sufficiently convincing to encourage full and correct participation. In other words, the information seemed to primarily have promoting effects. This may be due to perceived inconveniences of the sorting system. Tenants often complained in the surveys and semistructured interviews that it is inconvenient having to carry the recyclable fractions 500 m to the drop-off station. Moreover, it was considered impractical having to store seven different waste fractions (white and black bags plus the five recyclable fractions) in a small apartment (between 20 and 32 m2). These results agree with similar studies that suggest that improving the convenience of a recycling scheme has a stronger influence on the waste sorting behavior than improving information [8,10,22].
As presented in the results, there were no changes in the use of white bags in the reference area, nor were any trends in the waste sorting behavior observed. This implies that there is no change without an intervention. At the same time, Figure 3 and Figure 4 show that there was a large increase (65%) of the total mass of waste in the reference area. This may seem contradictory. However, it was assumed that if no clear trend is observable within the sorting pattern, the reasons for the change in the total mass are most likely not related to changes in the waste sorting behavior. These reasons may be a higher residence ratio (possibly the tenants had stayed at home less frequently during the first analysis, e.g., due to internships), a single event with a large impact on the total mass (e.g., a birthday party) or a different waste accumulation pattern (e.g., people moving out, which may cause larger amounts of waste). To eliminate the effects of the overall increase in waste in the reference area as compared to the overall decrease of waste in the study area, focus was placed on the relative changes within the different recyclable fractions and the use of the white bags. Applying the same concept for the study area meant focusing on the relative changes in order to avoid the effects of the overall waste reduction. Even when this is done, there is a clear trend towards a decrease for all recyclable fractions except for glass packaging. Glass packaging had a slight increase of 7% (Table 2), while the overall mass of waste in white bags was reduced by 5% (Figure 3). However, it should be noted that glass packaging, besides newsprints, is expected to show the largest fluctuations, as discussed in Section 4.3.
The results of the surveys showed three major changes. First, the perception of the information that was provided increased significantly (p = 0.002, Table 3). According to the participants of the survey, this was due to the fact that the new information was more detailed and more visually appealing than the old information. Furthermore, it was designed based on the desires of the participants of the first survey. In this context it is interesting to note that there were two different kinds of participants in the second survey: those who had experienced the situation before the intervention and those who moved into the study area after the intervention. While the new tenants could only refer to the new information when asked for their perception of information, the situation was more complex for tenants that had experienced the time before the intervention. When asked about their perception of information, their answers may have referred to the whole situation, before and after the intervention. Moreover, they may have used the question to express their approval or disapproval of the whole information campaign (e.g., one participant gave the lowest grade because they disapproved of the fact that only the information and not the convenience had been changed). In case the participants were unsure about the timespan in question, it was clarified that the question concerned the current situation. For this reason, and because the change between the surveys had a high significance, the result was considered robust.
Second, the knowledge on correct waste sorting had increased. This was shown by a significant increase of the perceived knowledge between the surveys (p = 0.000, Table 3). To support this subjective evaluation of the participants’ own knowledge, the Pearson correlations between the perceived and the tested behavior were compared between both surveys. It was assumed that a higher correlation would represent a better knowledge, as it indicates a higher awareness of the participants towards the accuracy of their behavior. The observed change in the correlation increased from moderate (r = 0.490) to strong (r = 0.649). Due to the high significance of the first test and the supporting results from the second test, the results were considered robust.
The third observed change considered waste sorting behavior. The perceived behavior increased only slightly between the surveys (p = 0.489, Table 3), while the tested behavior increased significantly (p = 0.026, Table 3). This significance was just within the threshold of p = 0.05. Taking into account the potential inaccuracy of self-claimed behavior [20] and considering that only three different example waste objects were included into the grading of the behavior (see Section 2.5), this result was not considered robust. However, it supported the findings of the pick analysis, where a decreased mass of recyclables had been found in the white bags. For this reason, the combination of the results of the pick analyses and the surveys indicate a change towards correct waste sorting behavior.
During the second survey, all participants that had experienced the situation before the intervention were asked to evaluate the intervention. The overall grade of 4.11 out of 5 showed that the intervention was well received. However, there were some differences between the four parts of the intervention. First, the stickers on the curbside collection containers (Appendix C, Figure A27) were considered the most helpful part of the intervention by only 5% of the participants. At the same time, the posters near the entrances of the building (Appendix C, Figure A28) were considered most helpful by half of the participants, even though both had a very similar design. The low perceived helpfulness of the outdoor stickers may be due to the fact that they have a similar design to the posters, and hence the participants may not have perceived them as a separate type of information. Another explanation could be that people who considered the outdoor stickers helpful also tended to find the posters helpful. As they could only choose one of the two alternatives, they decided for the one that contained more information and that was more visible (every time one exits or enters the building).
The part of the intervention that was considered the second most helpful was the information sheet (Appendix C, Figure A29) that had been sent to all tenants via mail. This choice was selected by a quarter of the participants. It is interesting to note that many participants admitted to neither having read the letter nor the information sheet. This agrees with the findings of previous research, i.e., that written information handed out only once is not very appealing [8,10,13,14]. At the same time, the number of people that considered the information sheet as the most helpful part of the intervention was higher within the group of participants who had read the letter. Therefore, it may still be important to provide this type of information.
The stickers for the bins that are located in the apartments (Appendix C, Figure A30) were considered the most helpful by one-fifth of the participants. Again, many of the people who had not read the letter had not considered the stickers. Only 41% of the participants had placed the stickers on their bins (Appendix B, Figure A26), though some claimed that they would place them at a later time. Therefore, it may be more effective if the landlord applied the stickers personally, either directly or every time a tenant moves out, so that the new tenants arrive with the stickers already in place.
The present study was based on the RBT procedure [16], which enabled the intervention to be designed in close interaction with users and thereby adapted to their expressed desires. The intervention is described in Section 2.6 and presented in Appendix C. The user involvement throughout the design process is expected to have played an important role in the success of the study, which is supported by a positive reaction from the participants towards the intervention. This was confirmed when evaluating the impact of the intervention. Adapting a recycling scheme to the local requirements by involving different stakeholders, including the users of the scheme, is something that has been suggested by studies working with waste sorting behavior [7,15,17]. In this way it can be ensured that all stakeholders provide input to the design. This could lead to higher success rates, especially in the parts of the recycling scheme which require cooperation between different stakeholders. One example would be household waste sorting and curbside collection, where the people sorting their waste cooperate with the collection companies. However, future studies need to verify the potential effect of designing recycling schemes based on user and stakeholder involvement in comparison to conventional design processes.
4.2. Discussion of the Theoretical Context
In the semistructured interviews and the first survey, the interviewees were asked about their experiences with, and attitudes towards, waste sorting (Appendix A). In this context, ‘waste sorting’ refers to people’s participation in proper separation of materials in their waste which then enables constructive waste management, such as the recycling of materials. It became apparent that most of the participants had prior experience with waste sorting (85% of the interviewees claimed to have had previous experiences with recycling, see Figure A4 in Appendix A) and that general attitudes towards waste sorting were positive (see Figure A6 and Figure A7 in Appendix A). It was widely agreed that waste sorting is necessary, important and good for the environment (Appendix A, Figure A6). These results are likely due to the embedded importance of sustainability among the Swedish society where waste sorting has been an established social norm for decades and where all municipalities have recycling schemes in which people can participate by sorting their waste.
Yet, the population studied here included international students, which indicates that the perceived importance of waste sorting is not restricted to the context of Sweden or local social norms. In fact, this finding is in line with other studies that have shown that people with an immigration background display the same attitudes towards recycling as nonimmigrants (e.g., [26,27]) and that the perception of the benefits of waste sorting is the main trigger for waste sorting behavior among ethnically diverse people in Sweden [28]. However, currently there is insufficient knowledge on the role of attitudes, culture, traditions and language in waste sorting behavior [26].
When waste management systems rely on people’s waste sorting efforts, such as the case in the present study, they also rely on how people value waste sorting and their attitudes towards it [29]. Attitude in this context refers to a person’s assessment of whether waste sorting is good or not in general [30,31,32,33,34] or for the environment [35,36]. There are opposing positions on the impact of attitudes on waste sorting behavior, and some research concludes that positive attitudes significantly increase the likelihood of waste sorting behavior [35,36,37,38,39,40,41] whereas others conclude that it does not [30,34,42,43]. One explanation for this could be that waste sorting rates can be low even if people have positive attitudes towards waste sorting. This can occur when they are dissatisfied with the information about the waste management scheme, when they do not find that they have the opportunity to sort waste or when they perceive a lack of ability to sort.
Applying the findings of the current study to the context of the theoretical Motivation–Opportunity –Ability–Behavior (MOAB) model [4] for waste sorting behavior, it becomes apparent that the psychological factors that correspond to “motivation”, such as beliefs and values, are satisfied within the studied population to the degree that these factors should favor high intentions to sort waste and therefore favor correct waste sorting behavior. Hereby, the MOAB model is in line with Tucker [5], Barr [44] and Ölander and Thøgersen [4], according to whom intentions and motivation are most crucial triggers of waste sorting behavior. Psychological aspects that impact waste sorting behavior can also be triggered by social norms, by how the society that a person finds him- or herself in tends to act and whether intention and motivation are channeled towards the own good or collective causes [27]. Again, given the history of recycling in Sweden and the experience of the interviewees with waste sorting (Appendix A, Figure A4), a high intention to recycle should be favored within the studied population.
However, given that the observed behavior, even after the intervention, is still far from ideal, the other two crucial aspects within this model, “ability” and “opportunity”, appear to be barriers that prevent people from correctly participating in the waste management scheme. The people who participated in the interviews and surveys commonly claimed that they perceived inconvenience and lacking information as the two main barriers that prevented them from sorting. In terms of the MOAB model, convenience would be the main contributor to “opportunity” whereas information and knowledge would be part of the “ability” aspect. In the present study, modified information only led to minor improvements in waste sorting behavior, which indicates that people are more likely to participate in the recycling scheme not only if they are motivated to do so and receive appropriate information on the system and how to engage in it, but also if they perceive the system as convenient.
In terms of convenience of recycling schemes, previous research has shown that variables like inaccessibility of a recycling scheme, time and space to sort the different fractions of the waste [45,46], the type of residential area a person lives in, the condition of waste facilities a person is supposed to use [47] and the distance to drop-off stations [28] can deter waste sorting behavior. In fact, a study conducted in the same Swedish city showed that waste sorting behavior improved significantly when a new drop-off station was built closer to tenants [22]. In the present study, however, participants identified the lack of convenience and information as barriers that prevent them from properly sorting their waste. Hence, inconvenience seems to be an even greater barrier to waste sorting behavior given that providing adapted information resulted in just a slightly increased rate of waste sorting.
Nonetheless, providing instructive information seems to have played a vital role in the mechanisms that lead to proper waste sorting behavior. This is likely to be because ability influences attitudes which, in turn, impact intentions to sort, which can eventually lead to further improved waste sorting behavior (see MOAB model [4]). Instructive information can provide the knowledge necessary to make people feel that they are able to participate in recycling schemes. People tend not to sort when they are not sure how to sort or where to take their sorted waste (e.g., [28,48,49]). Instructive information can be a valuable tool for efforts targeted at improving such insecurities. Furthermore, insufficient information provided on waste sorting can also lead to compromised awareness of its importance in terms of environmental, social and economic sustainability, which makes it a crucial aspect to be aware of when targeting efforts at increasing people’s waste sorting behavior [27]. Part of the instructive information that is provided to people could include details of the possibilities within resource recovery and material recycling system, giving examples of what could be made from specific products when people sort them into the right fraction and dispose of them in appropriate ways. Such knowledge and awareness could then become an incentive to change waste sorting behavior because it gives people the sense of being able to make a direct change with their actions [27]. Instructive information can also lead to a desire for action when it encourages people to play an active part in enhancing sustainability through the means of their waste. This is because the awareness that instructive information can entail might lead to a shift in how people perceive their own ability, control and empowerment. Psychological empowerment also positively impacts waste sorting behavior because it highlights the crucial aspect of meaning [50].
However, information will not make a significant and robust impact if other barriers, such as inconvenience, still prevent appropriate waste sorting behavior. For this reason, information campaigns should always be coupled with other interventions if a large impact on waste sorting behavior is intended. At the same time, due to its strong interaction with other factors that influence waste sorting behavior, providing proper information should always be considered when designing waste management schemes. This information should be adapted and improved in close cooperation with the people who are supposed to engage in the scheme to ensure that their desire for correct and complete information is satisfied.
4.3. Limitations
As with any research, some factors that can affect the results cannot be controlled. One such factor is that the turnover rate of the tenants may have impacted the amount of waste in the study and reference area. This is because tenants who moved in after the intervention was implemented may have behaved differently than the previous tenants. The amounts of waste generated also may be different for different weeks of the year. This may have affected the results given that different weeks were chosen for the first and second pick analyses. To minimize these two errors, large samples were taken and weeks without vacation or special occasions, such as holidays, were chosen for the sampling. Moreover, the pick analyses in the study and reference area were performed in close succession.
Sorting the waste into different fractions during the pick analyses can also lead to errors if a particular waste object is not consistently sorted into the same fraction. To reduce the risk of this error, one of the authors supervised all pick analyses while being helped by assistants. The same procedure was used during all four pick analyses. For the pick analyses, only one sample was taken before and one after the intervention in both the reference and the study area. This number of samples is too small to perform a statistical analysis of the data. Therefore, the results were only understood as indications and were compared with a similar study conducted in the same town to give a better reference for interpretation.
Furthermore, the population and the sample size were relatively small. It is usually recommended to work with sample sizes of at least 500 kg [19]. Due to the small sample sizes in this study, waste fractions that are comparably small and that consist mainly of heavy items such as newsprints (e.g., catalogues) and glass packaging (e.g., jars and bottles) will cause larger fluctuations. This is because a single tenant disposing of several of these items will cause a large impact on the outcome of the pick analysis with respect to these fractions. This consequence could not be prevented and may have affected the outcome of the pick analyses.
The reference area and the study area did not have the same waste collection systems for the combustible and food waste fractions. While there are curbside collection containers for these two fractions in the study area, tenants of the reference area disposed these fractions using a vacuum system. This was an obstacle for the comparison of the data because the waste sorting pattern was different in the areas. However, despite the different systems, the reference area was still deemed the most reliable choice to compare the effect of the intervention. This is because the reference area is structurally very similar to the study area in that they have similarly equipped apartments (e.g., apartment size and furniture), similar type of tenants and the same demands for tenants to sort into black and white bags and take all other fractions to the appropriate collection points. Furthermore, the landlord is the same for both areas, which means that the same rules for living and renting apply and the same information on how to sort is provided. To make the data between the areas more comparable, focus was placed on the relative changes in the waste sorting behavior instead of merely the masses of the waste fractions. However, one source of error that could not be avoided was the activities of the landlord, such as installing locks on the curbside collection containers, which may have influenced the waste sorting behavior.
The black bags that are also collected in the curbside collection containers were not considered in this study. It can be assumed that the waste in the black bags had also been affected by the intervention, given that the intervention also included information and descriptions on how to use the black bags correctly. However, previous research from the same town showed that the amount of mis-sorted waste is generally much lower in the black bags [22]. Furthermore, in comparison to the white bags, only a few black bags are usually used. For this reason, a sample would have been very small considering the small population size. Therefore, the black bags were not considered in this study.
Five semistructured interviews were conducted during this study. This low number was due to the fact that there were only eight responses to the letter inviting the participants to participate. Of the eight people that agreed to participate, three did not participate because the interview schedule collided with an examination period. Due to the limited time to conduct the study, it was not possible to postpone the interviews. As there were too few interviews to conduct a valid qualitative analysis, the findings from the semistructured interviews were only used as an orientation and inspiration for the design of the surveys and did not play a role in the final results of the study.
Planning to conduct two surveys with the same tenants may have caused errors since tenants who had been interviewed before the intervention may not have been interested in participating in the second interview. This may have resulted in a disproportionate number of new tenants participating in the second survey. It was also difficult to ensure that all participants understood all questions correctly, even though the interviewers had the chance to clarify uncertainties given the personal character of the interviews. This was partially because the interviews were held in English, which was a second language for almost all participants. A majority of the tenants (106 and 93 out of 160, respectively) were questioned as part of the surveys in order to provide meaningful data, despite the potential sources of error.
Only 10% of the participants of the survey were initially from Borås, while over a third were international students (Appendix A, Figure A3). It was considered that this may have had influence on the waste sorting behavior. However, given that over 85% of the participants had previous experiences with waste sorting, and given that an immigration background does not necessarily influence waste sorting participation [26,27], it was assumed that the presence of international students did not affect the outcome of the study.
5. Conclusions
Modified instructive information on how to participate in the local recycling scheme was designed based on the RBT procedure [16]. This new information was subsequently implemented as an intervention, and the impact of the intervention was ascertained using pick analyses and surveys. The intervention significantly improved the participants’ knowledge of correct waste sorting and improved the perception of information on correct sorting. Indications of improved waste sorting behavior were observed using both the pick analyses and surveys. However, improvements did not result in a significant change in correct sorting behavior but rather in smaller changes towards correct waste sorting, such as using the white plastic bags that are freely provided to households rather than other bags or no bag at all. This suggests that the information had strong prompting effects but could not raise sufficient motivation for full participation in the recycling scheme. Full participation would require that people take their recyclable fractions to drop-off stations instead of discarding them in the white plastic bags.
The inconvenience of the waste management system was often perceived as the biggest hindrance to proper sorting behavior. One of the major inconveniences identified by the participants was the long distance to the drop-off station. The study showed that even though the information was adapted to the users, it was not sufficient to motivate everyone to take their recyclable fractions to these stations. However, as mentioned above, the intervention improved sorting within the part of the system that was convenient, meaning that more tenants used white plastic bags but discarded recyclable fractions in these bags rather than taking them to the drop-off station.
The participants were knowledgeable about waste sorting and had a positive attitude towards it. For the participants, information and convenience were the main hinderances to proper waste sorting behavior. It would therefore be interesting to investigate how information can influence waste sorting behavior when the recycling scheme is more convenient. Furthermore, future studies should investigate how different types of information influence people’s waste sorting behavior. This could include transparency of the recycling process as well as environmental and economic effects of proper waste sorting.
Author Contributions
Conceptualization, E.M., K.R. and K.B.; methodology, E.M., K.R. and C.H.; validation, E.M., A.N., C.H. and K.R.; formal analysis, E.M. and K.R.; investigation, E.M., A.N. and C.H.; resources, K.R and K.B.; data curation, E.M. and K.R.; writing—original draft preparation, E.M.; writing—review and editing, K.R., K.B., C.H. and A.N.; visualization, E.M. and K.R.; supervision, K.R. and K.B.; project administration, K.B., K.R. and E.M.; funding acquisition, K.B. and K.R. All authors have read and agreed to the published version of the manuscript.
Funding
The authors are grateful for the financial support from Sparbankstiftelsen Sjuhärd.
Acknowledgments
The authors gratefully acknowledge AB Bostäder and Borås Energi och Miljö for making the research possible.
Conflicts of Interest
The authors declare no conflict of interest.
Appendix A
Survey 1 (conducted in the study area—the apartment building is called Simonsland)
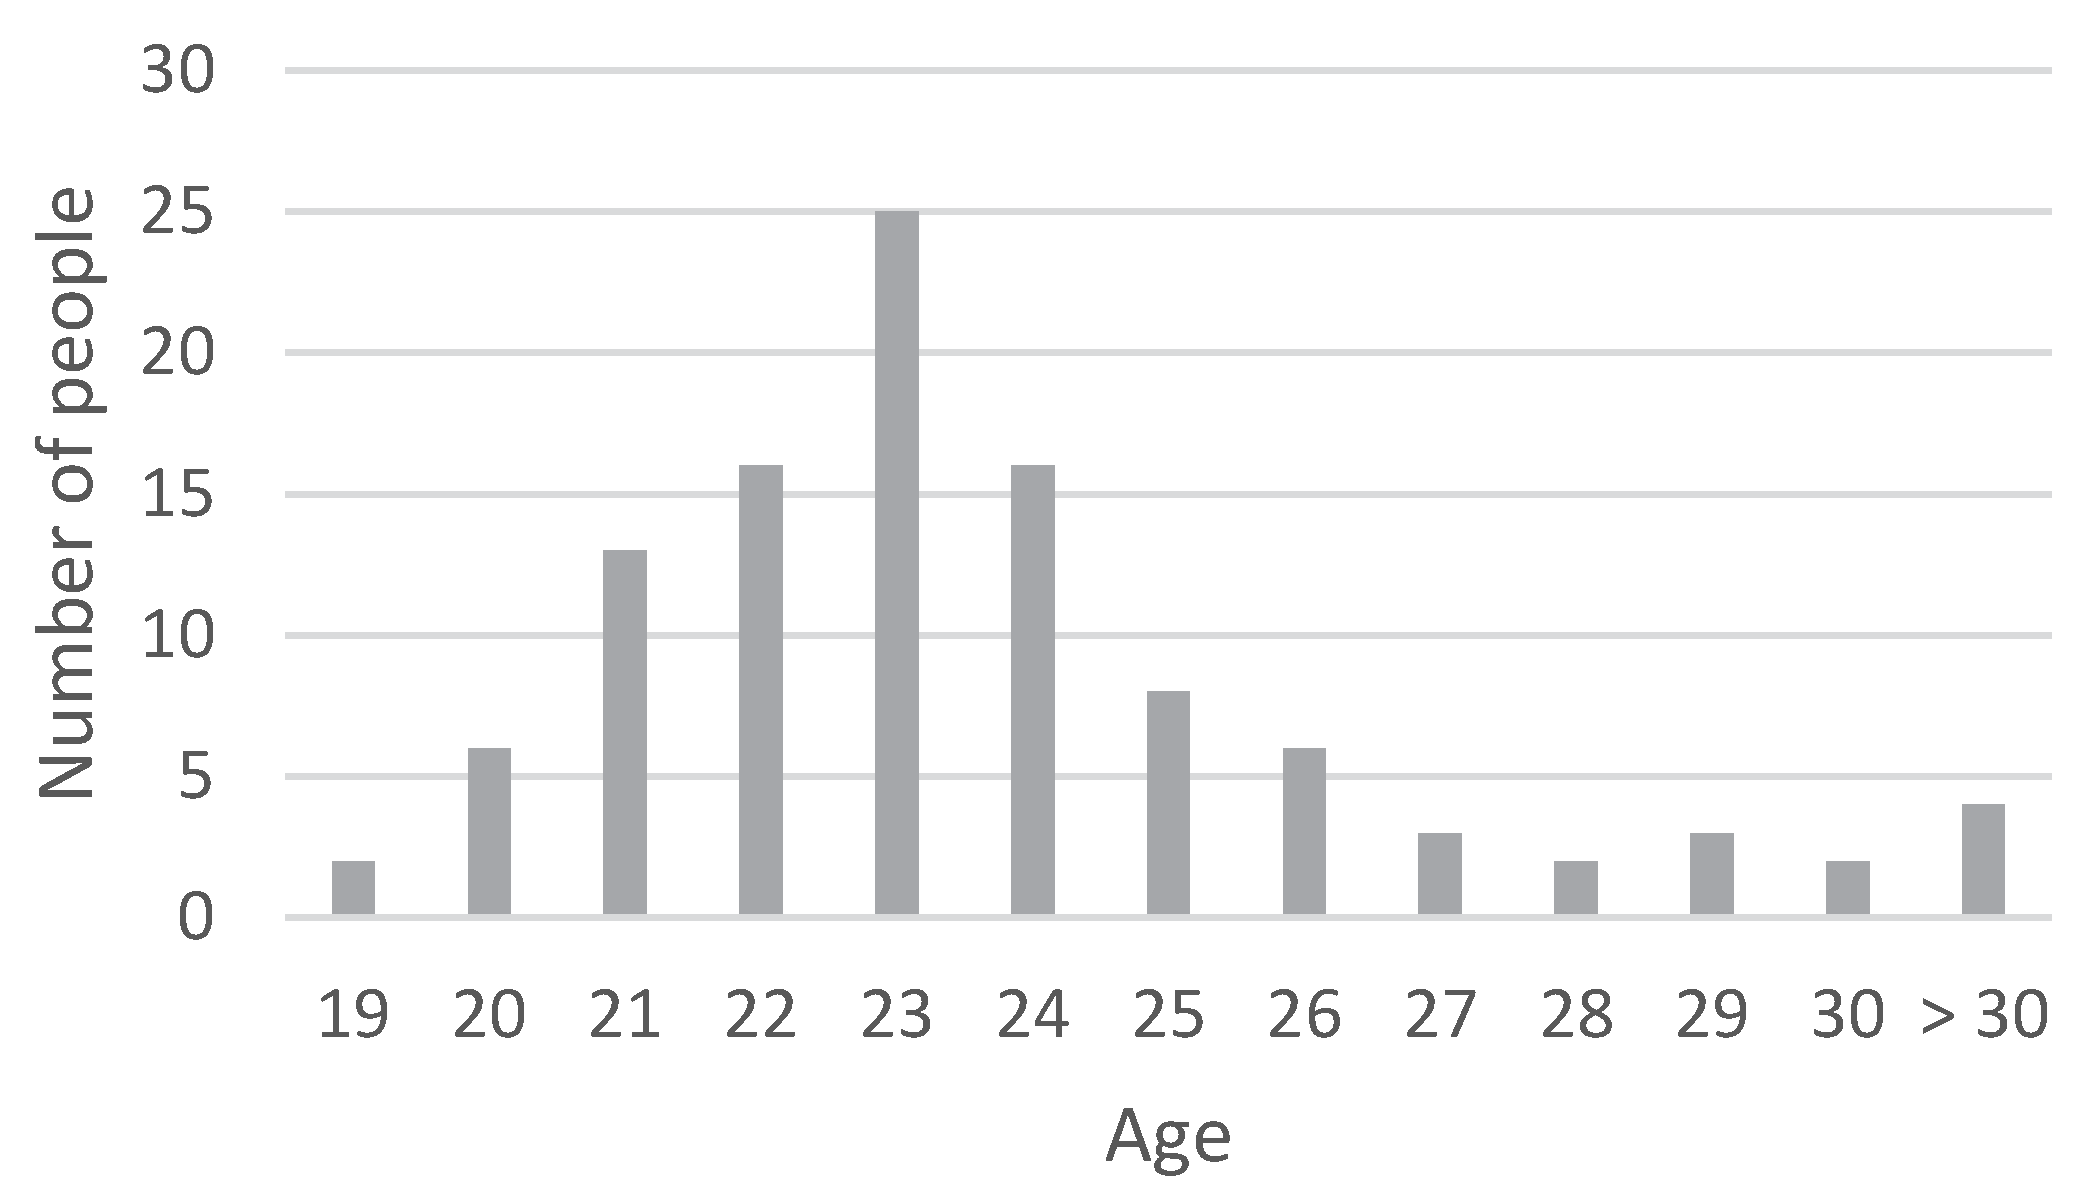
Question 1. How old are you?
The age is an important demographic factor when describing a population.
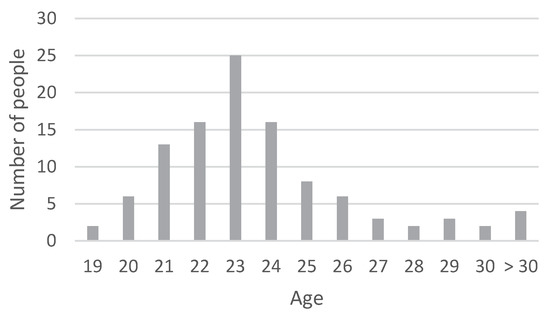
Figure A1.
Age distribution in the population, first survey (106 individuals).
Figure A1.
Age distribution in the population, first survey (106 individuals).
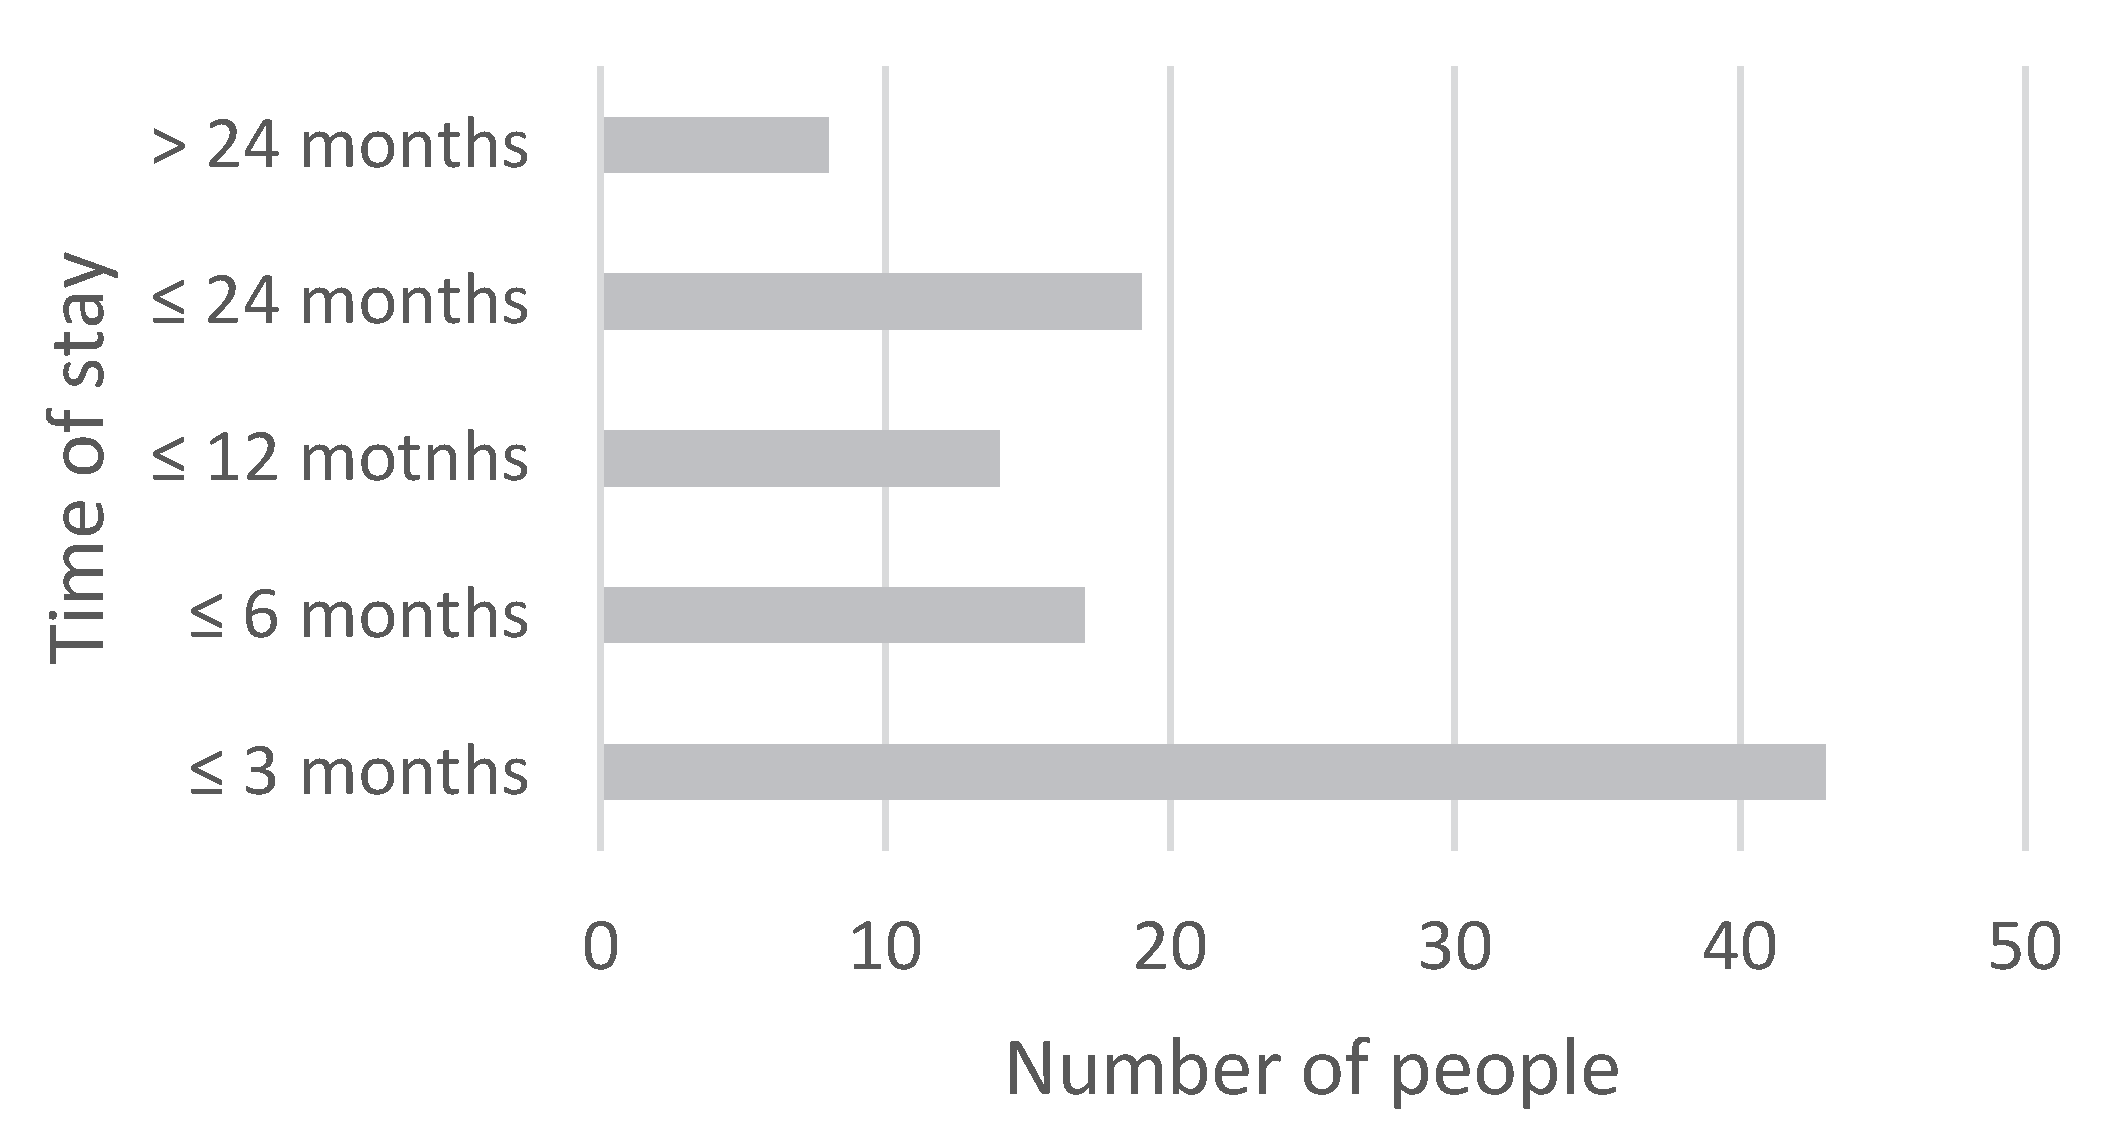
Question 2. How long have you been living in Simonsland?
The time of stay is an important factor to describe the population as it influences the ability to remember the information provided on arrival as well as the experience with the local recycling scheme. Furthermore, it is a good indicator for the turnover rate of the tenants in the building.
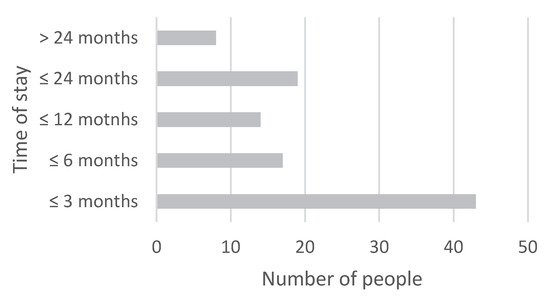
Figure A2.
Time of stay at Simonsland, first survey (101 individuals).
Figure A2.
Time of stay at Simonsland, first survey (101 individuals).
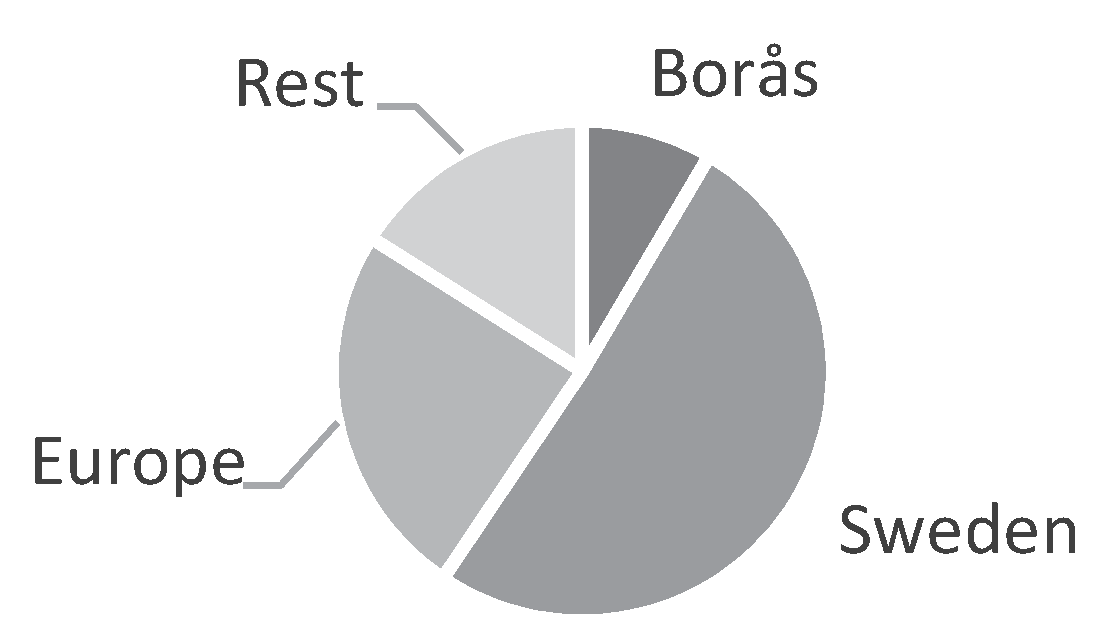
Question 3. Where are you from?
The origin is a demographic factor to describe the population and to put the recycling experience into further context.
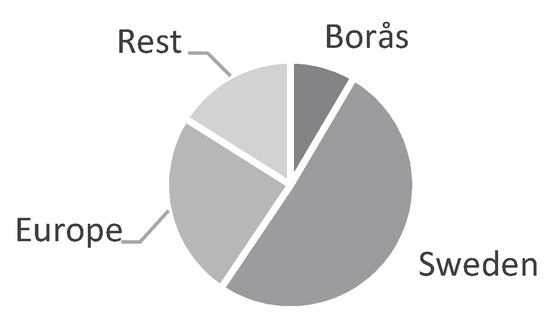
Figure A3.
Origin of the tenants of Simonsland, first survey (106 individuals).
Figure A3.
Origin of the tenants of Simonsland, first survey (106 individuals).
Question 4. Did you grow up with a waste sorting system/recycling?
The user’s experience with recycling before the arrival in Simonsland was questioned by investigating previous contact that the participants had with recycling systems.
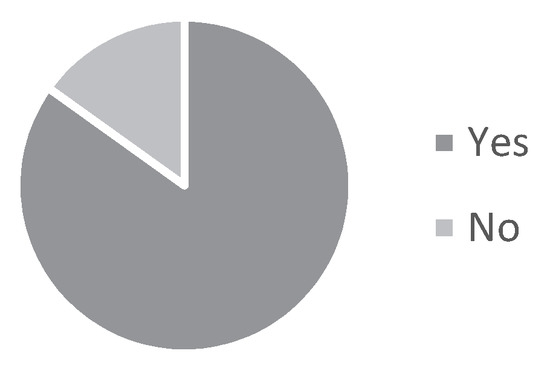
Figure A4.
Previous experience with recycling, first survey (106 individuals).
Figure A4.
Previous experience with recycling, first survey (106 individuals).
Question 5. On a scale from 1 to 5, how well do you sort your waste here in Borås?
As a pick analysis had been performed to quantify the waste sorting behavior objectively, it was decided to investigate the participants’ perception of their waste sorting behavior for comparison.
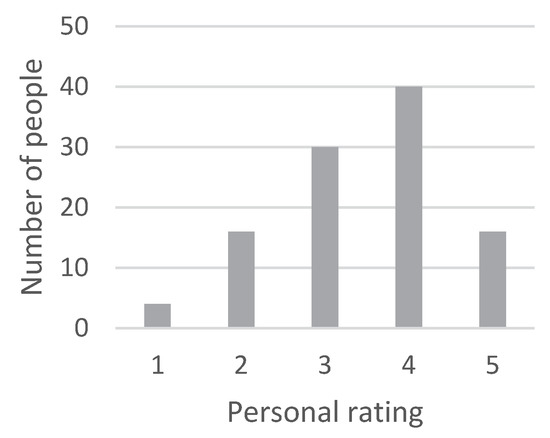
Figure A5.
Perceived personal waste sorting behavior, first survey (106 individuals).
Figure A5.
Perceived personal waste sorting behavior, first survey (106 individuals).
Question 6. What do you think about recycling? In three words.
To get an impression on the participants’ attitudes towards recycling, they were asked to describe recycling in a few words. Though it is not easy to quantify, it gave a good general indication of the populations’ perception.
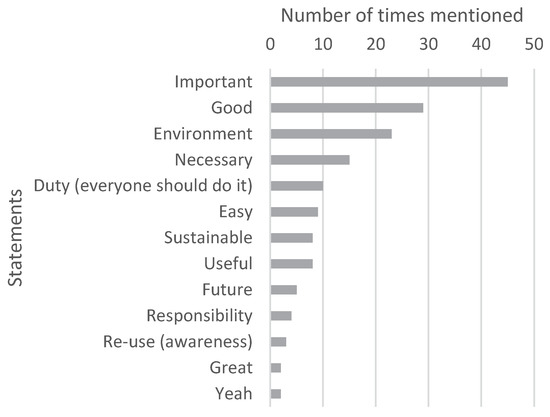
Figure A6.
Opinion on recycling in three words, all positive statements mentioned more than once, first survey (106 individuals).
Figure A6.
Opinion on recycling in three words, all positive statements mentioned more than once, first survey (106 individuals).
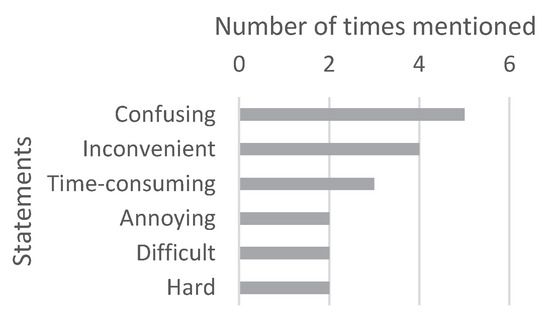
Figure A7.
Opinion on recycling in three words, all negative statements mentioned more than once, first survey (106 individuals).
Figure A7.
Opinion on recycling in three words, all negative statements mentioned more than once, first survey (106 individuals).
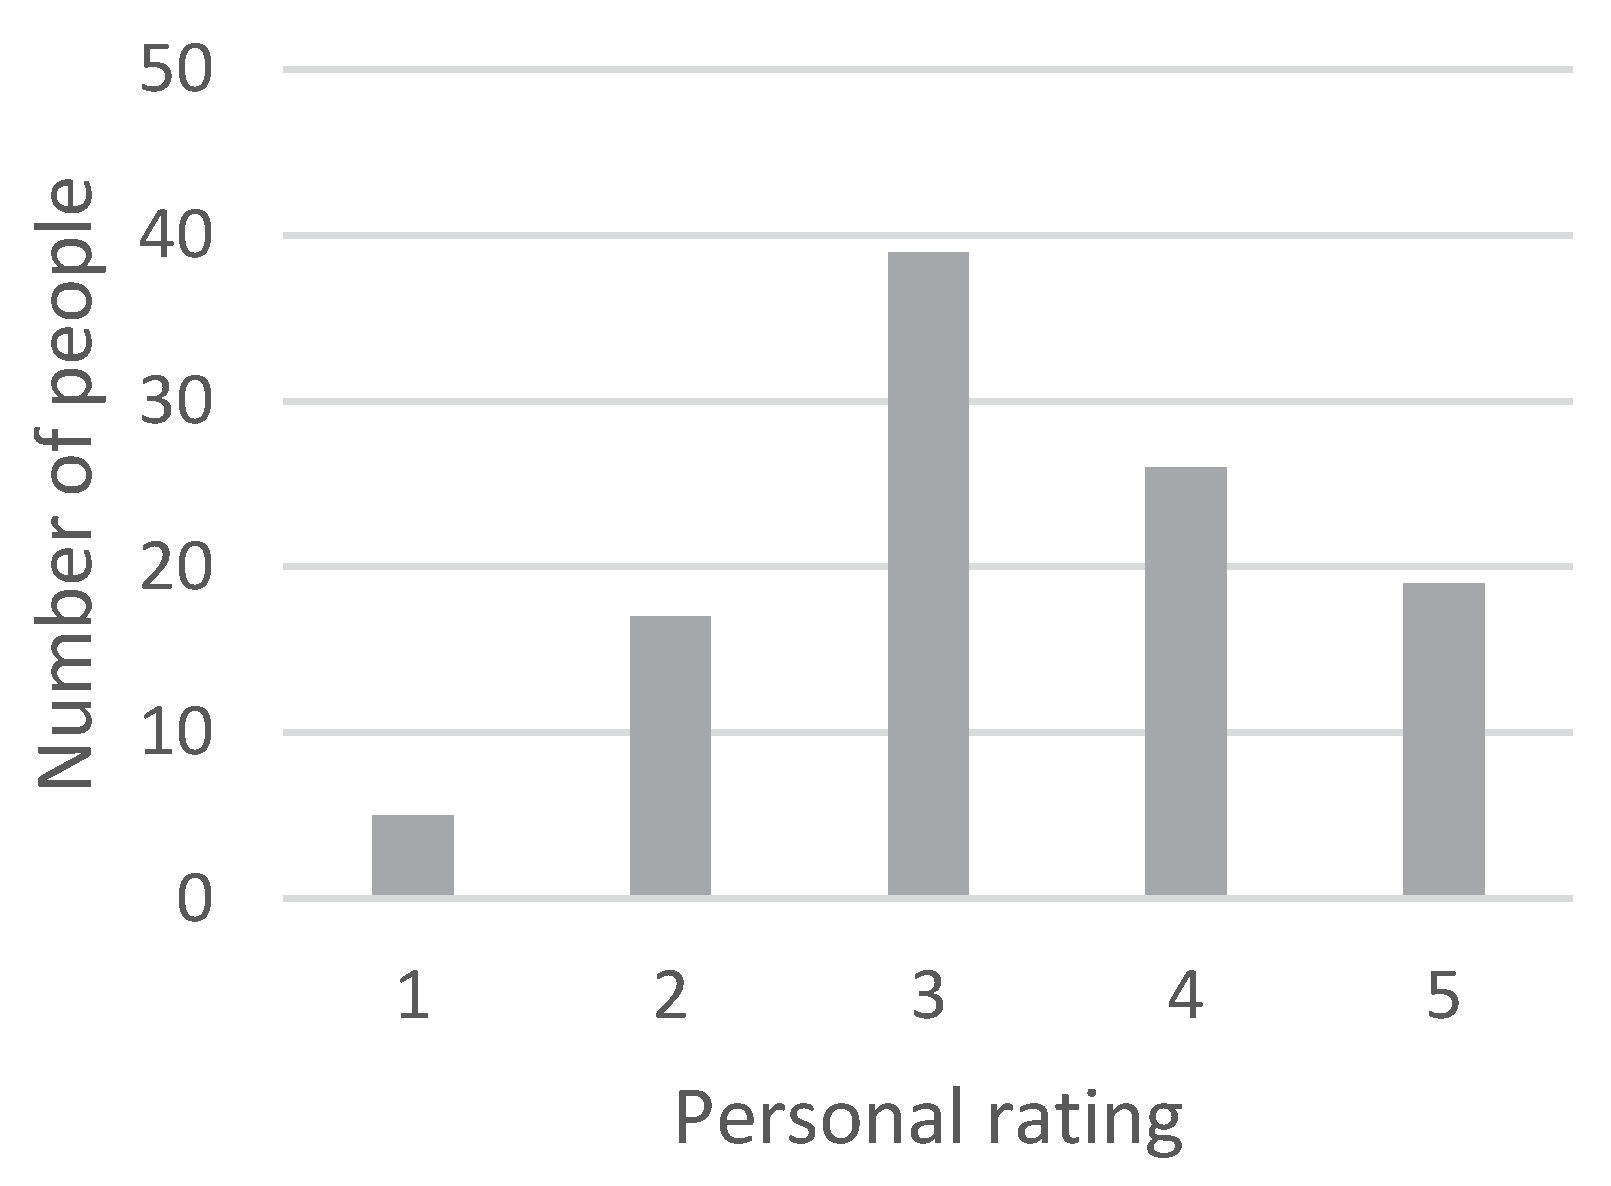
Question 7. On a scale from 1 to 5, how well do you know how the sorting system in Borås works?
The confidence of the participants’ interaction with the local recycling scheme was questioned by asking them to rate their knowledge on the scheme.
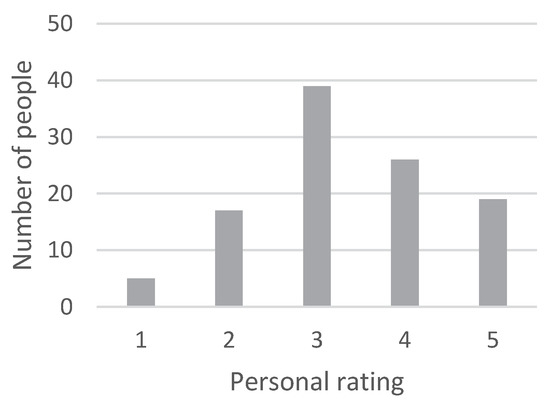
Figure A8.
Perceived personal knowledge on recycling scheme in Borås, first survey (106 individuals).
Figure A8.
Perceived personal knowledge on recycling scheme in Borås, first survey (106 individuals).
Question 8.
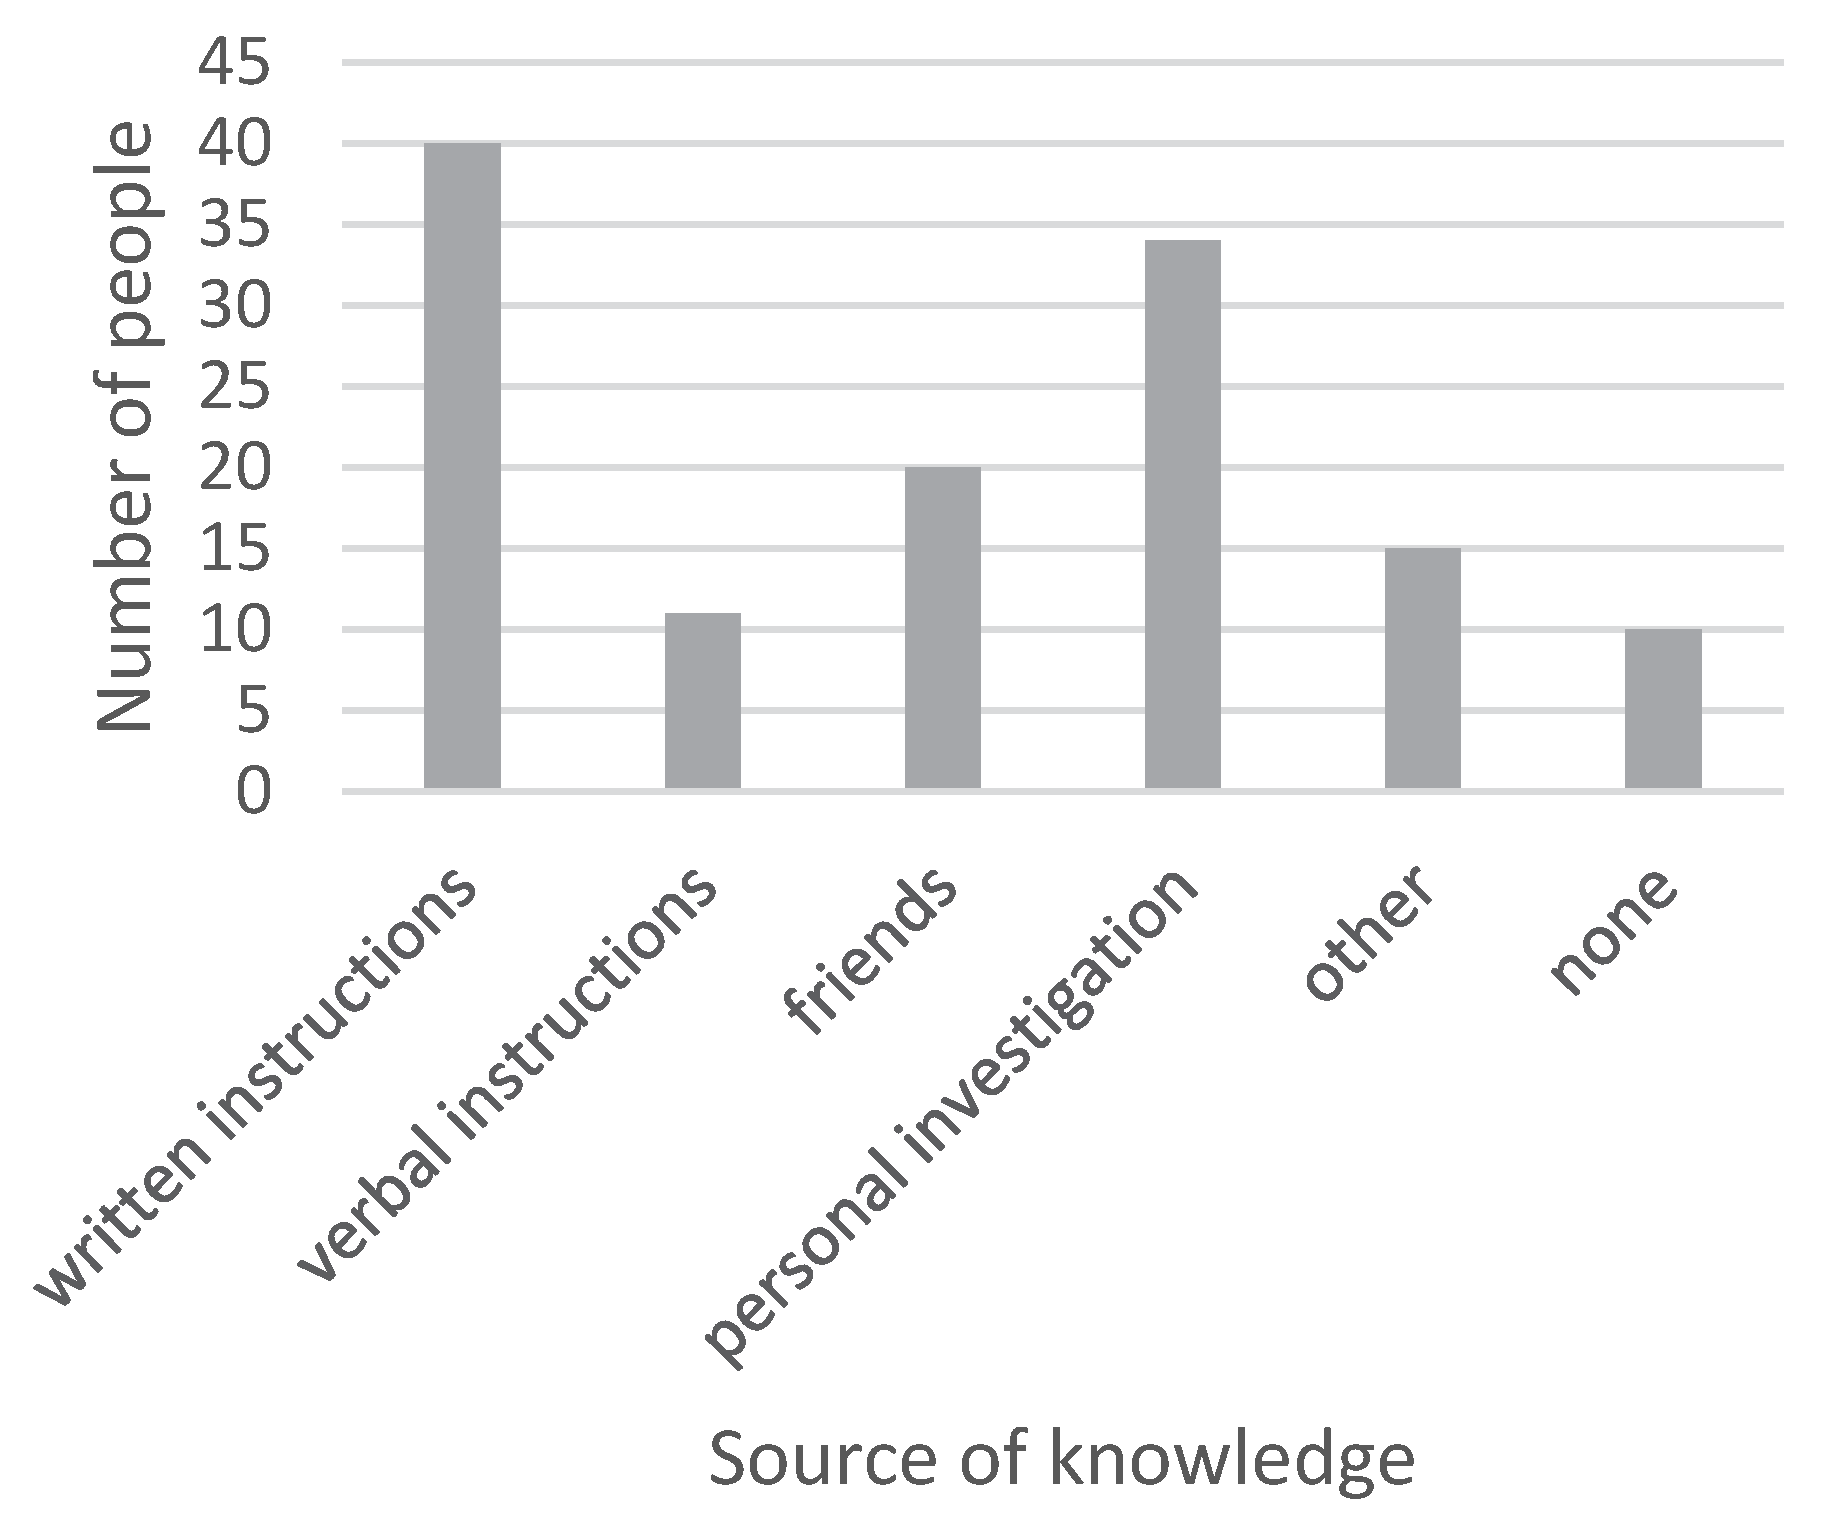
a—How did you find out about it?
b—Do you mean you did not get any information?
When the participants were confident with the scheme (rating 3 to 5 in Question 7), they were asked to tell how they had found out about it, to test their perception of the information that they had received. When they were not confident with their knowledge, they were asked if they did not remember receiving any information, to ensure that they understood the question correctly and to question their perception of the information. It would have been preferred to avoid the use of the word “information” as it might influence the answers, as learning it from friends or finding out about it by oneself is not necessarily interpreted as receiving information.
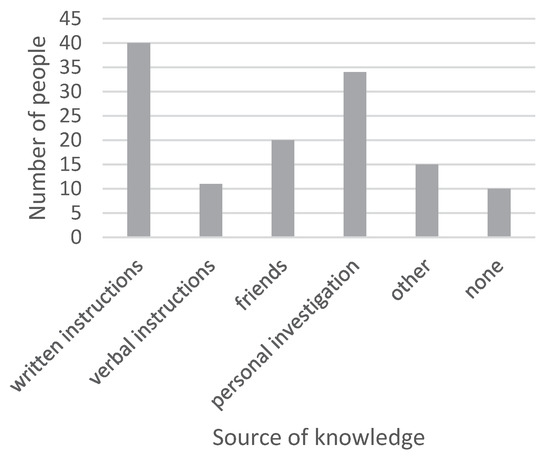
Figure A9.
Perceived source of knowledge, first survey (106 individuals).
Figure A9.
Perceived source of knowledge, first survey (106 individuals).
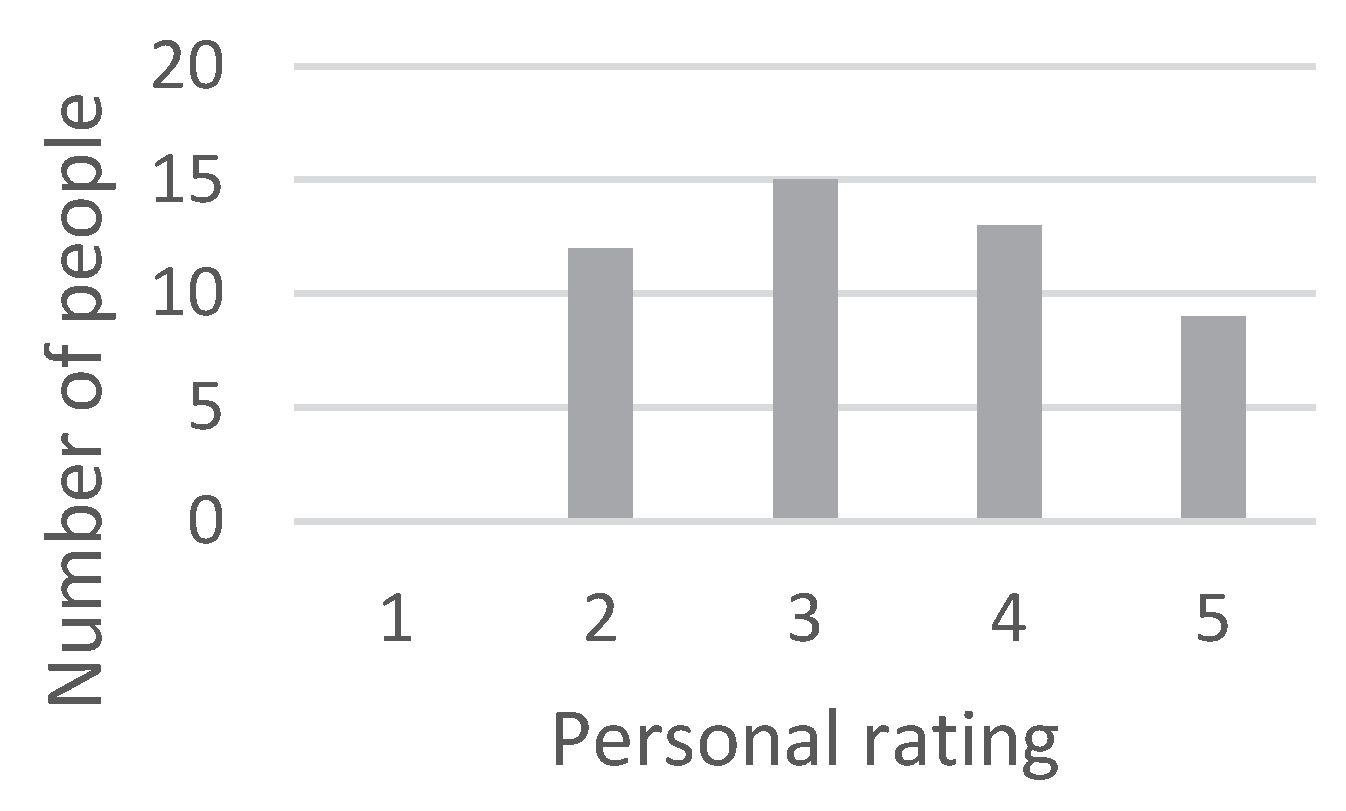
Question 9. Do you think it was sufficient information? To participate/sort.
When the participants stated that they had received information, it was of interest to know how they perceived the usefulness of this information.
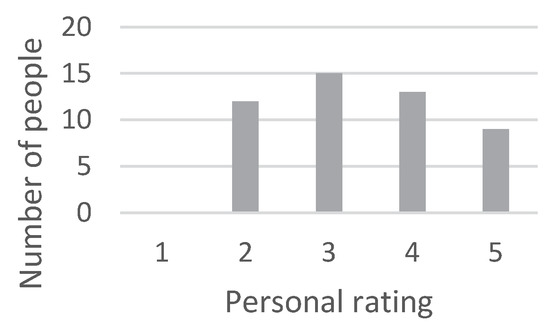
Figure A10.
Rating of usefulness of the current information on the recycling scheme, first survey (49 individuals).
Figure A10.
Rating of usefulness of the current information on the recycling scheme, first survey (49 individuals).
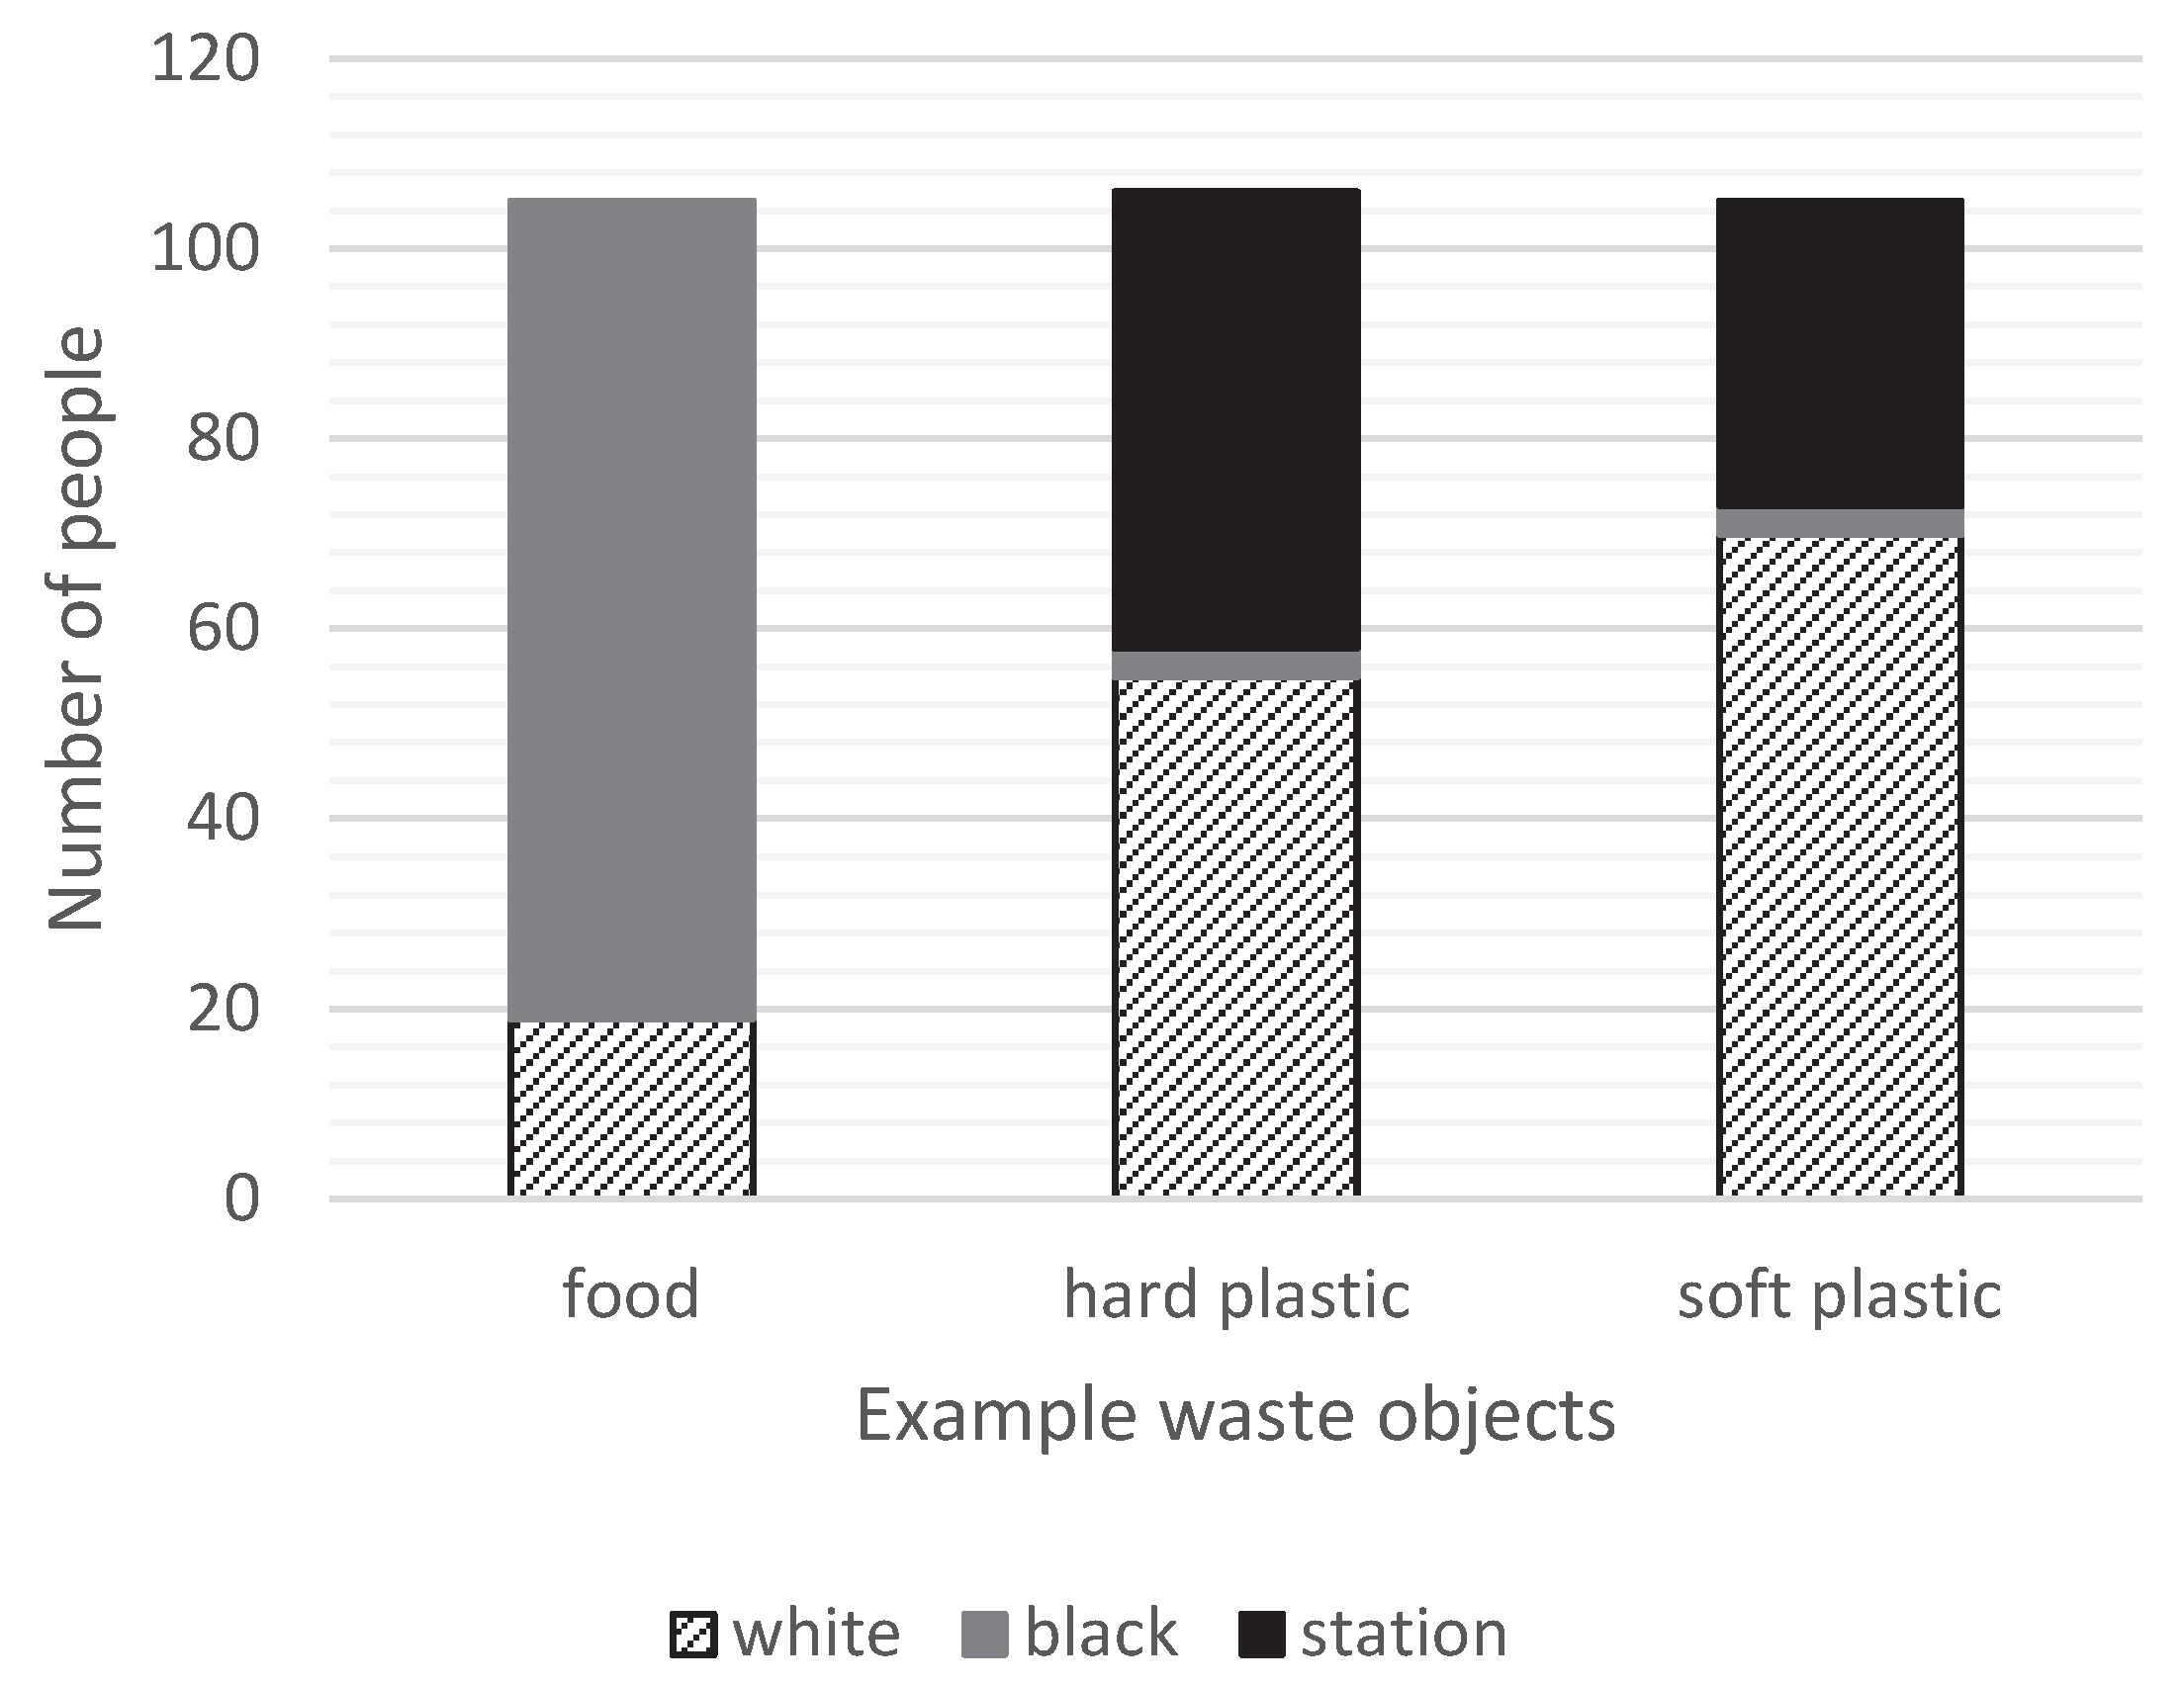
Question 10. Where would you put the following waste objects?
Different examples (using pictures) for waste were given, and the participants were asked how they would treat them. This indicates their actual behavior as opposed to the perceived one. The examples were a piece of food waste, a shampoo bottle (hard plastic) and plastic wrapping (soft plastic).
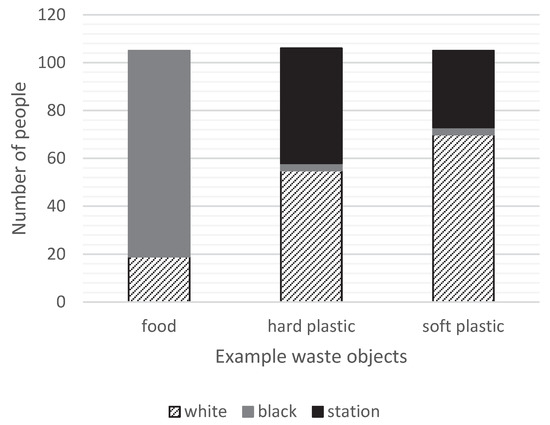
Figure A11.
Waste sorting behavior by giving waste examples, first survey (106 individuals).
Figure A11.
Waste sorting behavior by giving waste examples, first survey (106 individuals).
Question 11. Which of the following suggestions for additional information on correct sorting are your two favorites?
Five different examples for alternative information channels (information on how to recycle) were given (supported by illustrations), and the participants were asked to pick their two favorites. All five examples had often been suggested in the semistructured interviews.
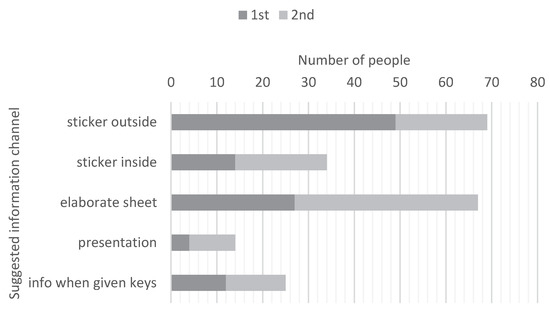
Figure A12.
Favorite information channels, first and second choice noted, first survey (106 individuals).
Figure A12.
Favorite information channels, first and second choice noted, first survey (106 individuals).
Question 12. If you had information on how recycling is part of your everyday life, how it relates to your everyday life, do you think it could motivate to sort the waste better?
Participants were asked if more relatable information could increase their motivation to sort since this had been suggested numerous times during the semistructured interviews.
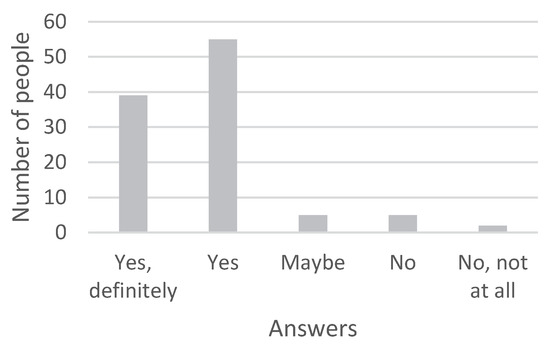
Figure A13.
Opinion on usefulness of relatable information on recycling, first survey (106 individuals).
Figure A13.
Opinion on usefulness of relatable information on recycling, first survey (106 individuals).
Question 13. Do you know what happens after the waste collection?
The knowledge on the local waste management system was tested in preparation for the next question.
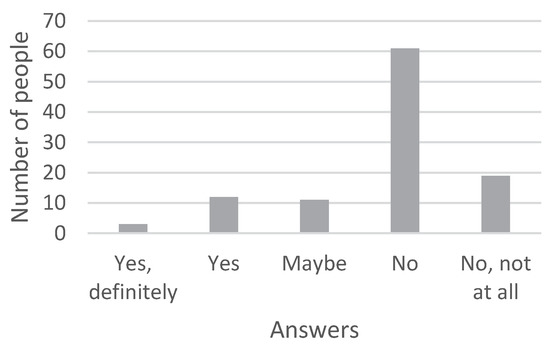
Figure A14.
Perceived knowledge on postcollection recycling in Borås, first survey (106 individuals).
Figure A14.
Perceived knowledge on postcollection recycling in Borås, first survey (106 individuals).
Question 14. Do you think it would be more motivating if you knew better, if it was more transparent?
This question investigates if a higher transparency of the waste management system could increase motivation to sort properly, as this had been suggested multiple times during the semistructured interviews.
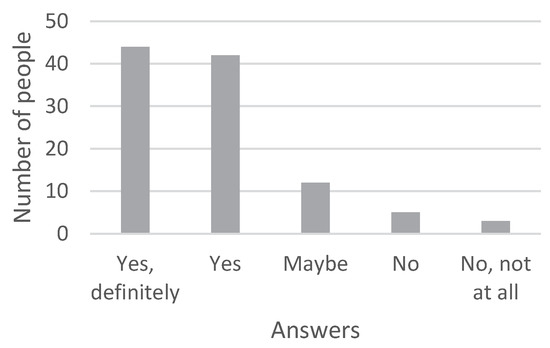
Figure A15.
Opinion on the usefulness of knowing what happens after waste collection, first survey (106 individuals).
Figure A15.
Opinion on the usefulness of knowing what happens after waste collection, first survey (106 individuals).
Appendix B
Survey 2 (conducted in the study area—the apartment building is called Simonsland)
Question 1. How long have you been living in Simonsland?
Same reason as given in Appendix A.
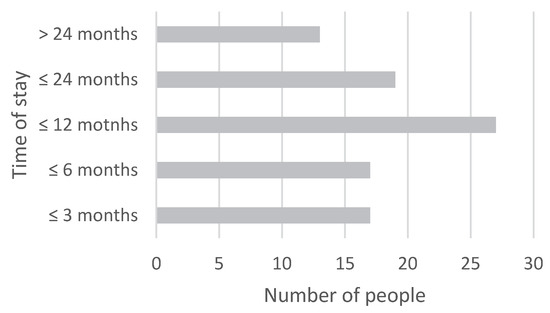
Figure A16.
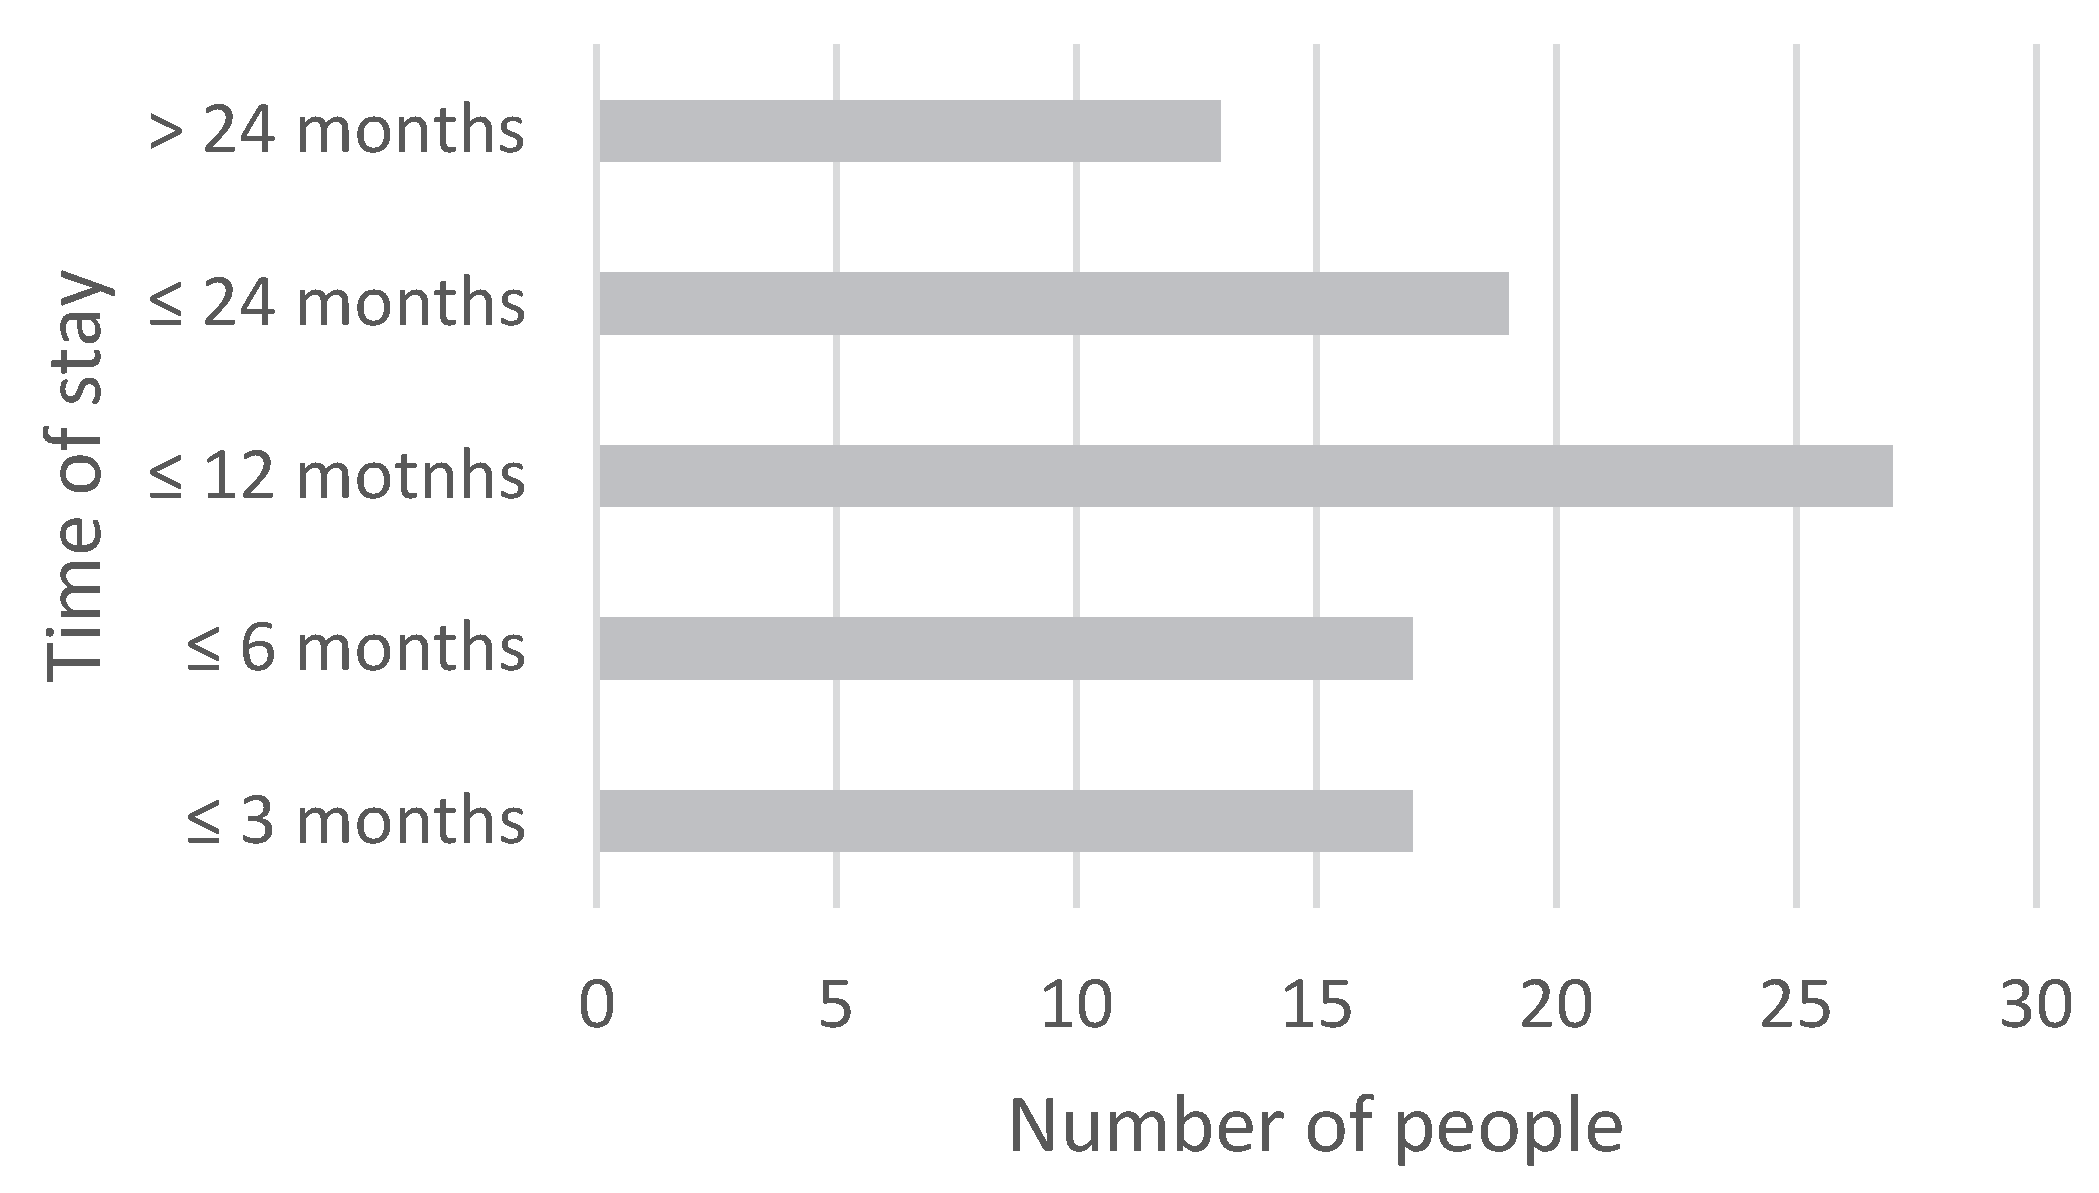
Time of stay in Simonsland, second survey (93 individuals).
Figure A16.
Time of stay in Simonsland, second survey (93 individuals).
Question 2. On a scale from 1 to 5, how well do you sort your waste here in Borås?
The perception of the personal waste sorting behavior was tested for comparison with the results of the pick analyses and the other behavior-related questions.
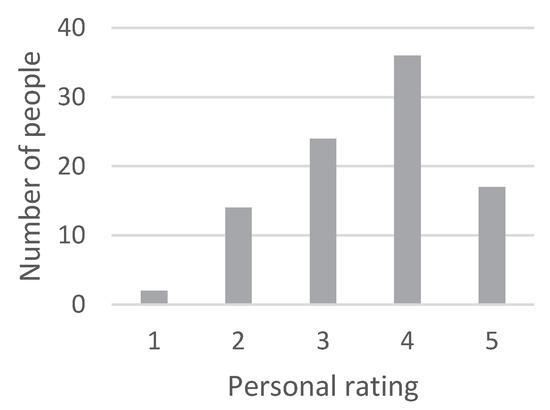
Figure A17.
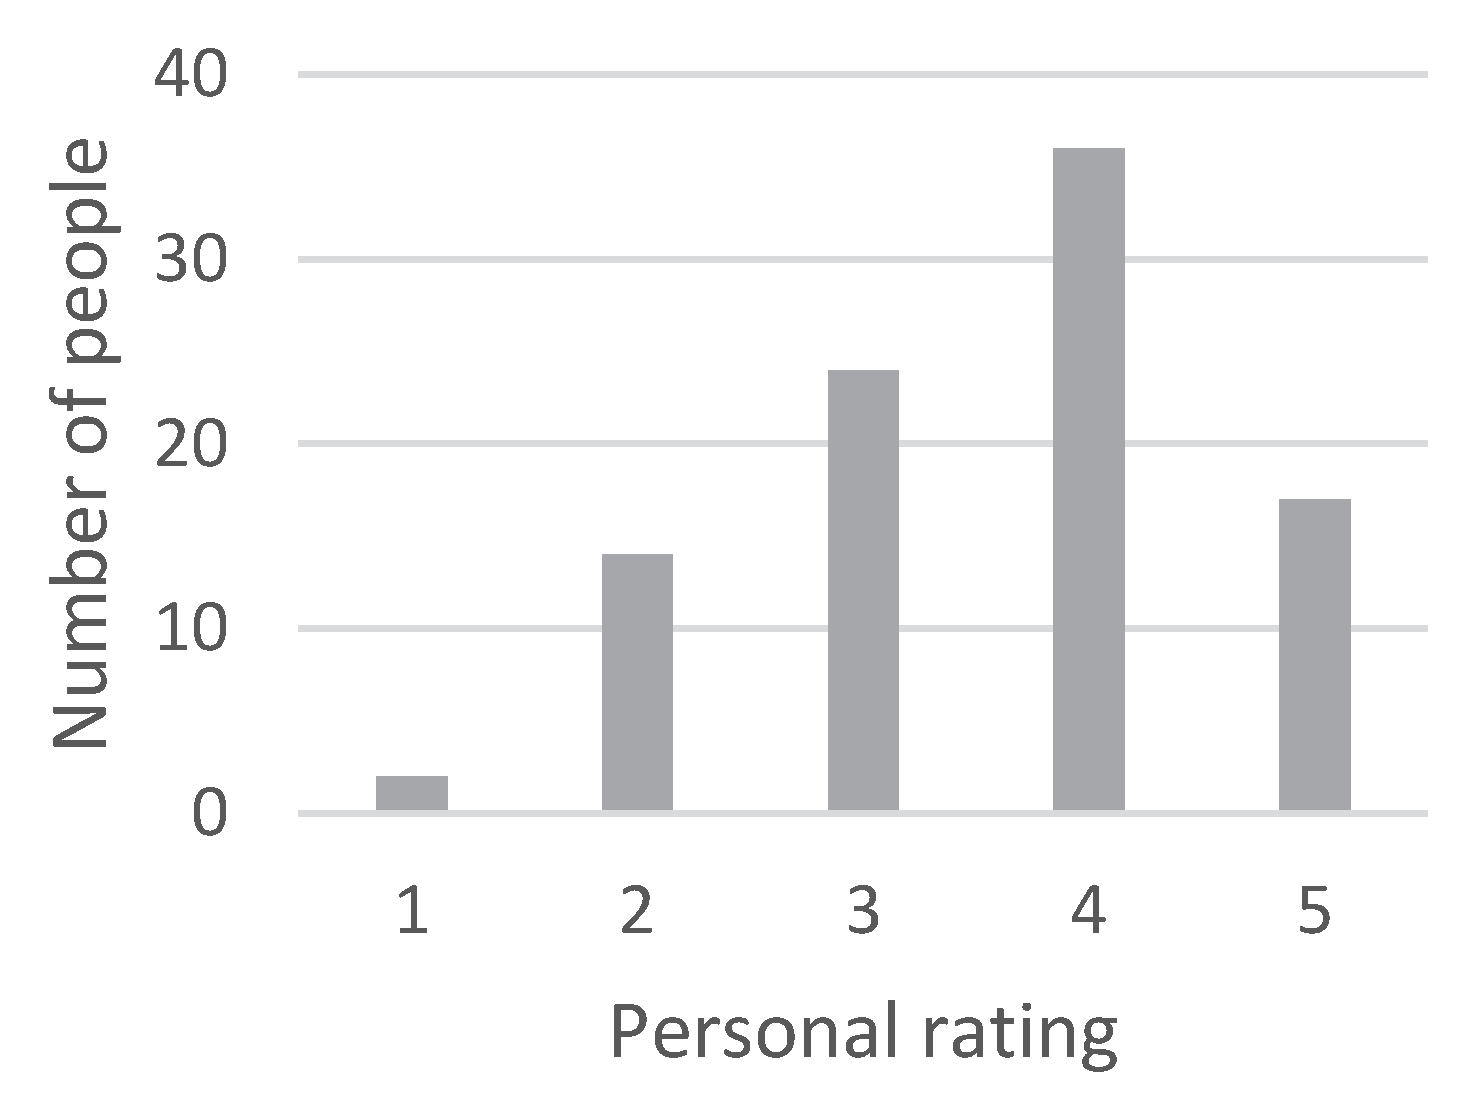
Perceived personal waste sorting behavior, second survey (93 individuals).
Figure A17.
Perceived personal waste sorting behavior, second survey (93 individuals).
Question 3. On a scale from 1 to 5, how well do you know how the sorting system in Borås works?
The confidence of the participant’s knowledge of the local recycling scheme was questioned again to be able to analyze any changes since the first survey.
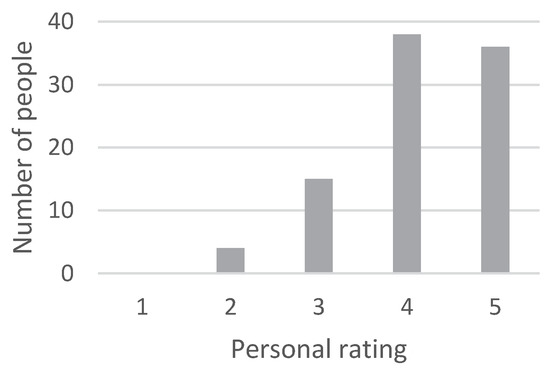
Figure A18.
Perceived personal knowledge on recycling scheme in Borås, second survey (93 individuals).
Figure A18.
Perceived personal knowledge on recycling scheme in Borås, second survey (93 individuals).
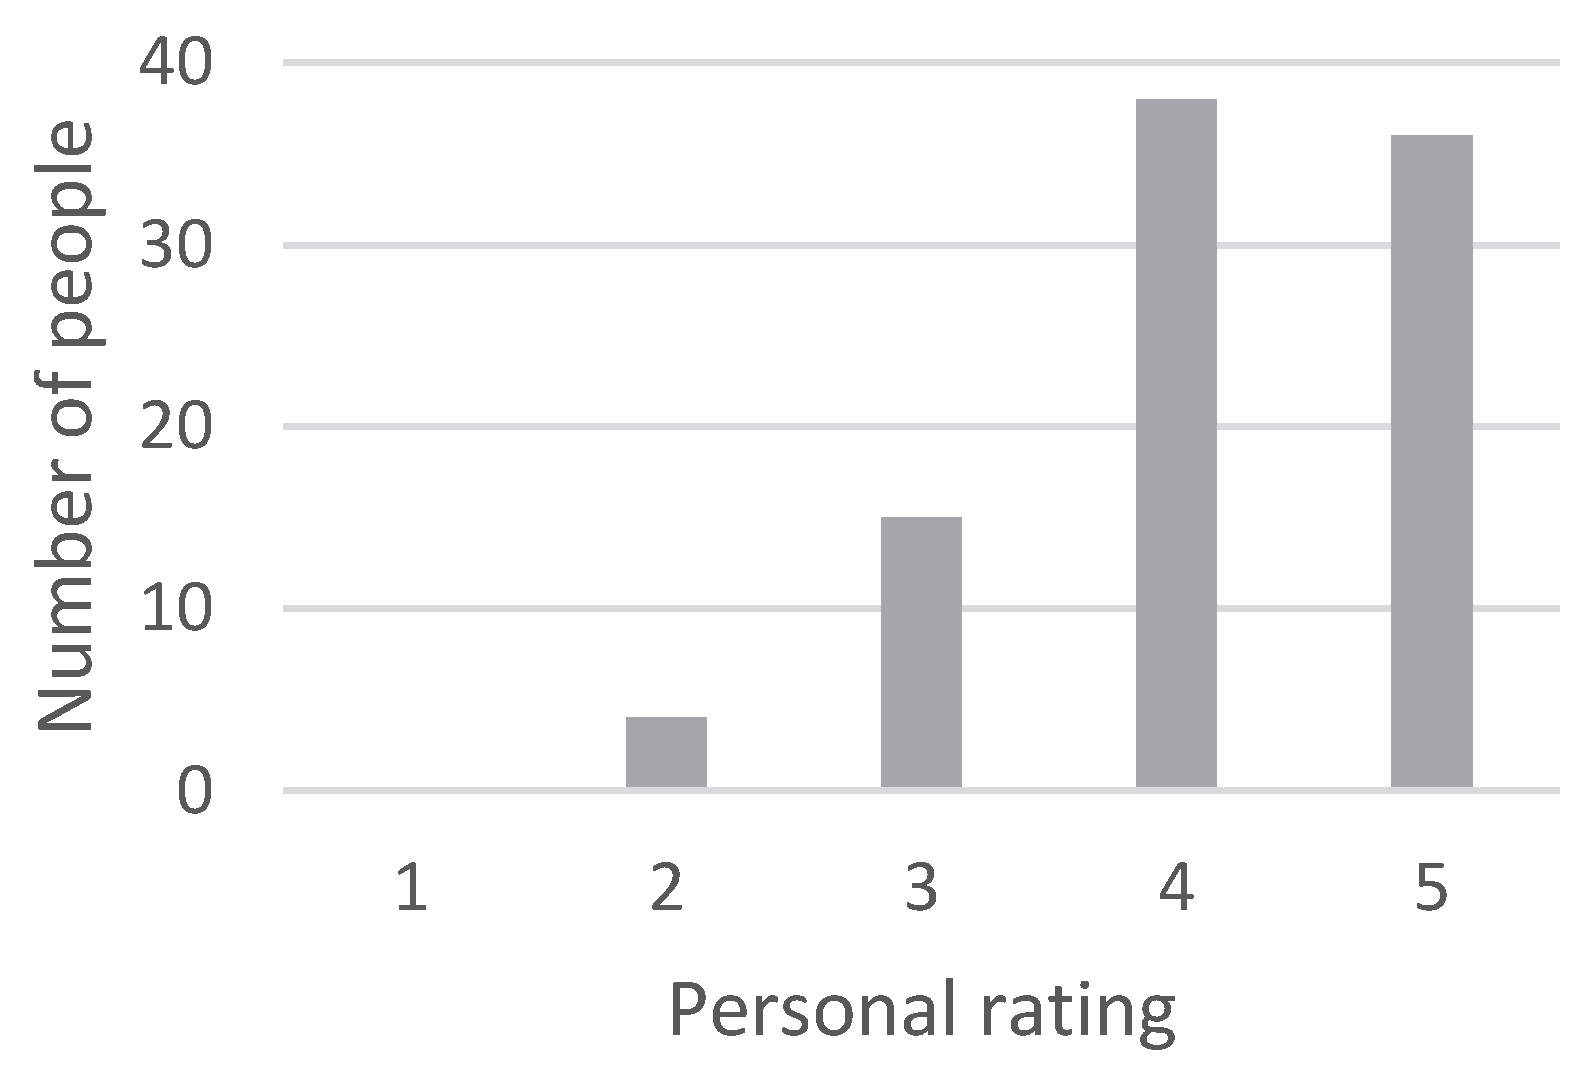
Question 4.
a—How did you find out about it?
b—Do you mean you did not get any information?
The perceived information was investigated to identify any possible changes from the first survey and to investigate if any dependencies had developed or reduced since that survey. Furthermore, it introduces the next question.
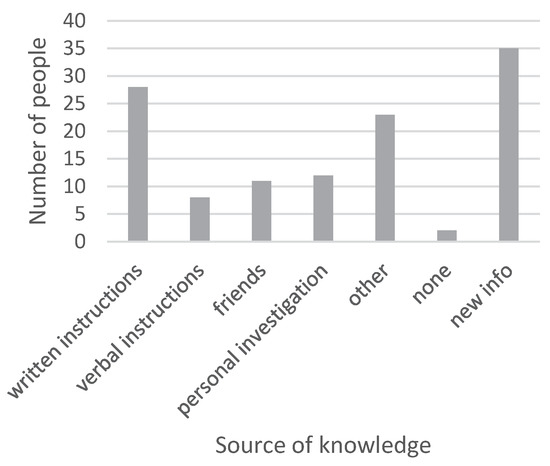
Figure A19.
Perceived source of knowledge, second survey (93 individuals).
Figure A19.
Perceived source of knowledge, second survey (93 individuals).
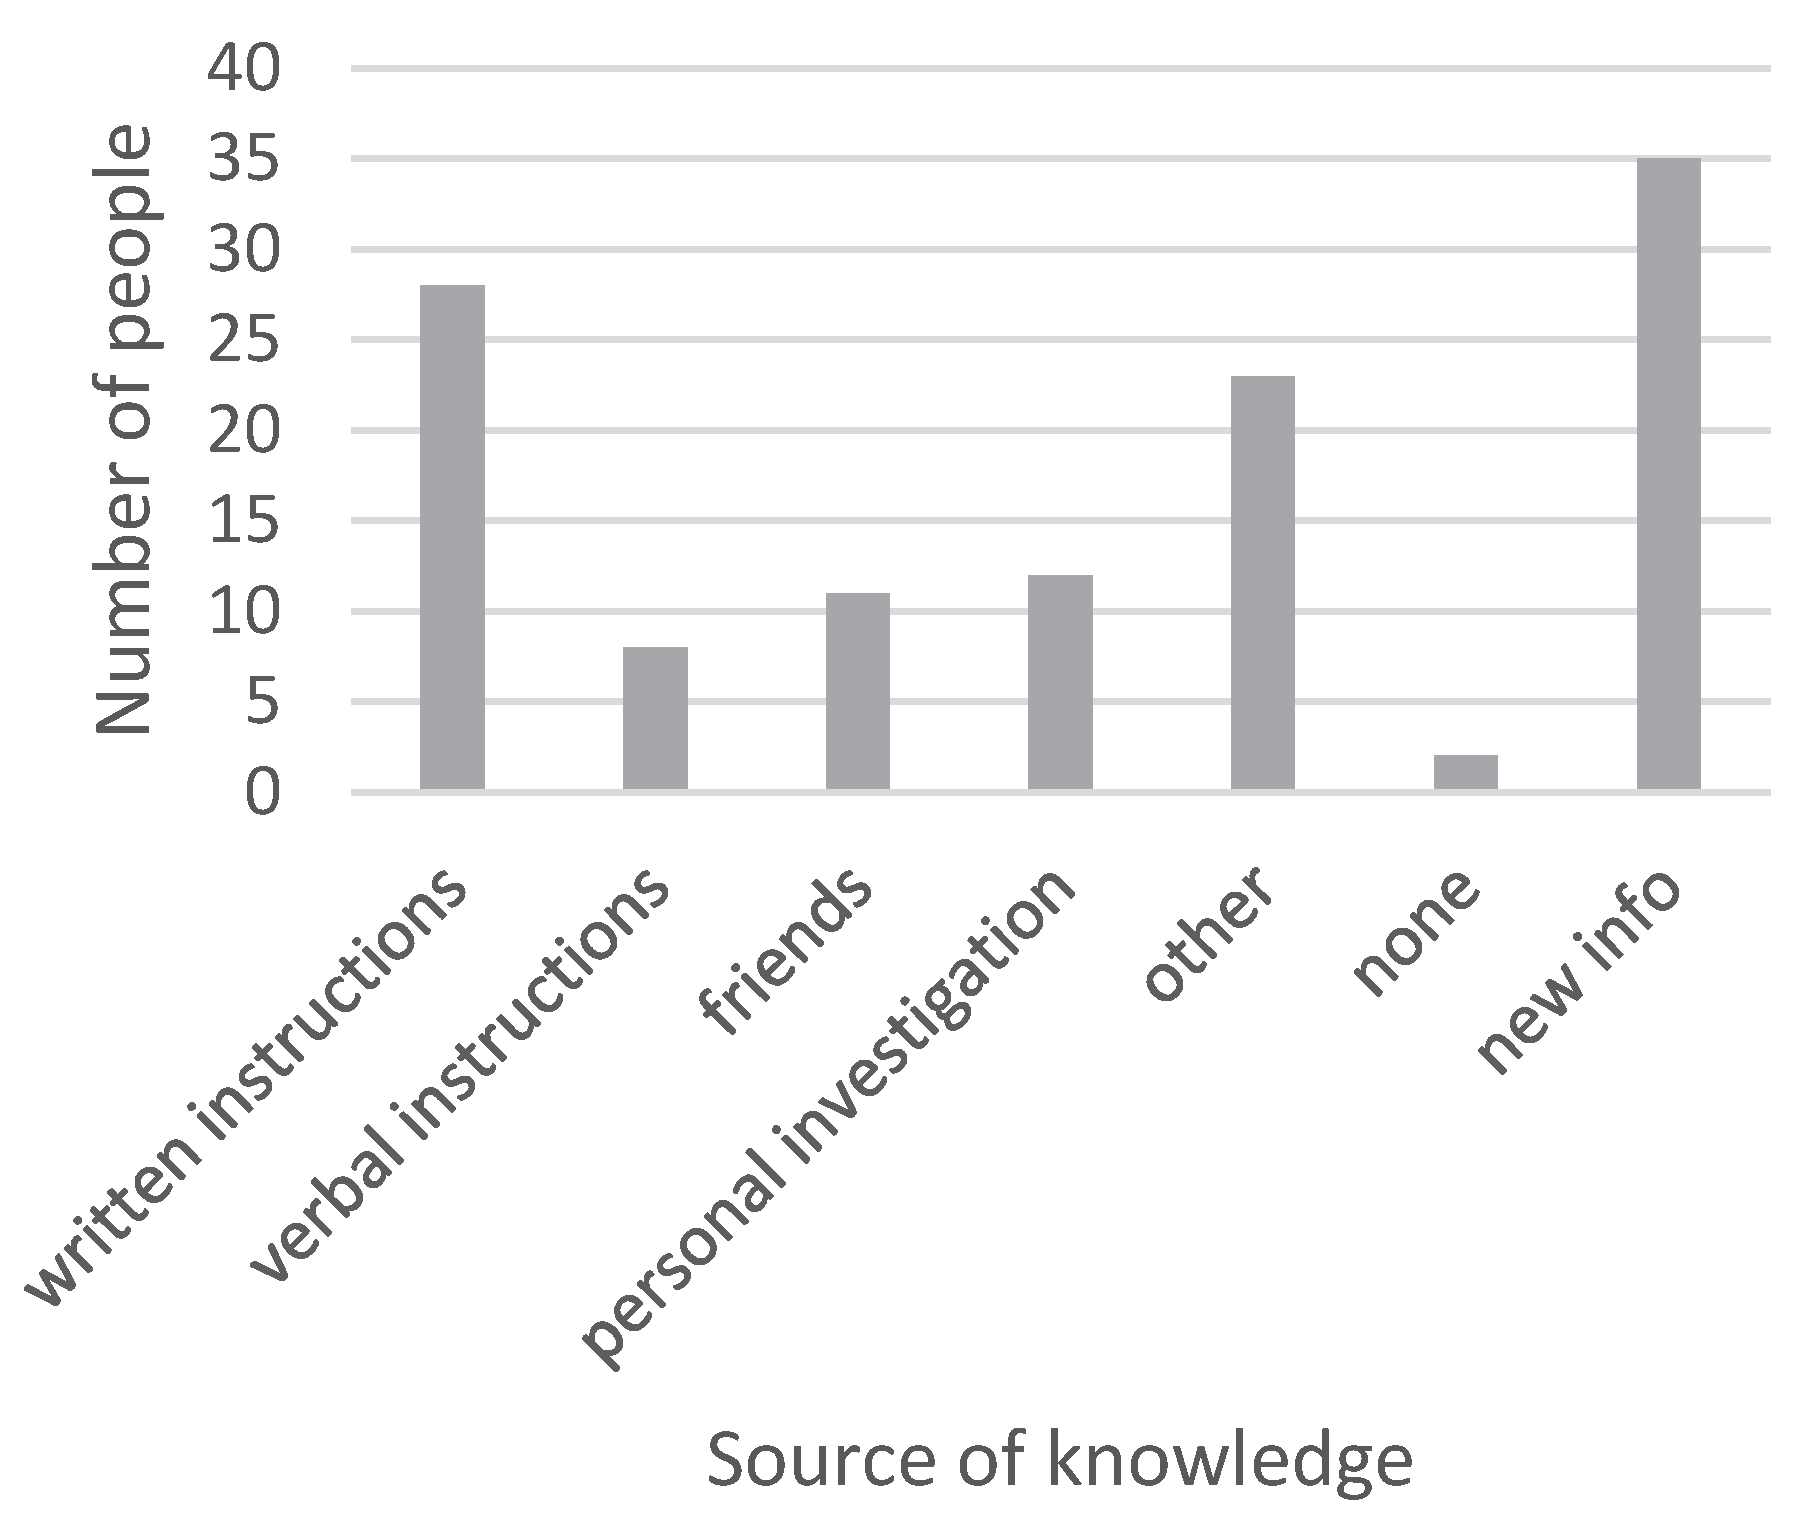
Question 5. Do you think it was sufficient information? To participate/sort. (5-grade)
The interviewees were asked to grade the information they had for learning about the local recycling scheme. This was used to evaluate the overall perception of information before and after the intervention.
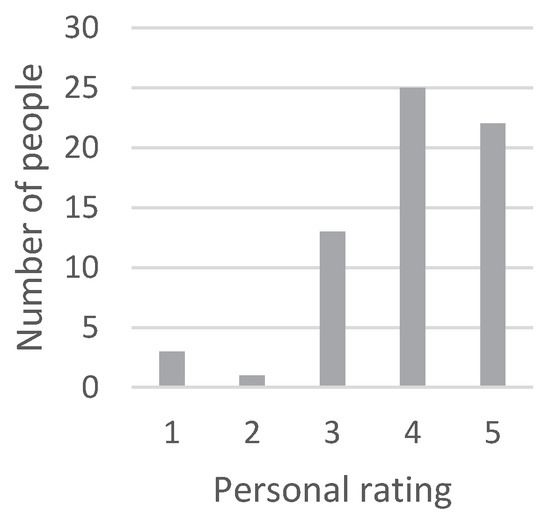
Figure A20.
Rating of the source, second survey (64 individuals).
Figure A20.
Rating of the source, second survey (64 individuals).
Question 6. Where would you put the following waste objects?
The same examples as used in the first survey were given, and the interviewees asked how they would sort them. This was considered to be a reasonable indicator of possible changes in individual waste sorting behavior.
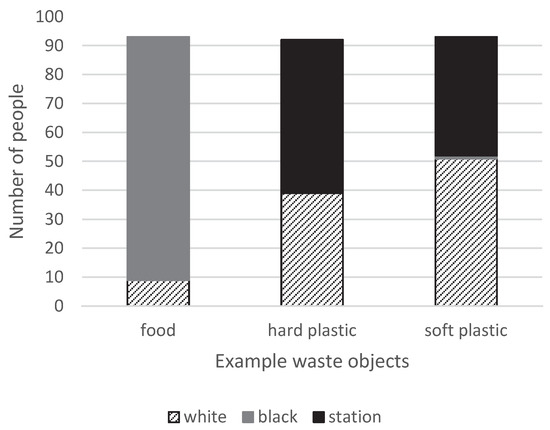
Figure A21.
Waste sorting behavior by giving examples, second survey (93 individuals).
Figure A21.
Waste sorting behavior by giving examples, second survey (93 individuals).
Question 7. Did you notice any change in information lately? Which?
The perception of the intervention was questioned to see which types of information were more efficient in promoting correct sorting. The answers given to this question were the base for Question 9.
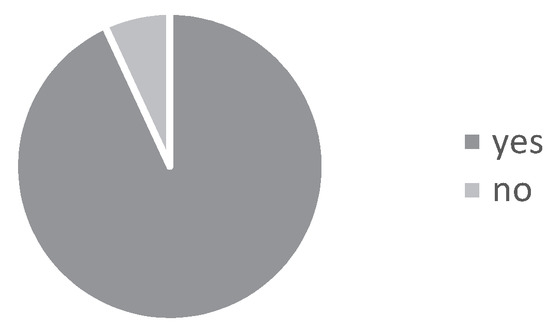
Figure A22.
Noticing the intervention, second survey (87 individuals).
Figure A22.
Noticing the intervention, second survey (87 individuals).
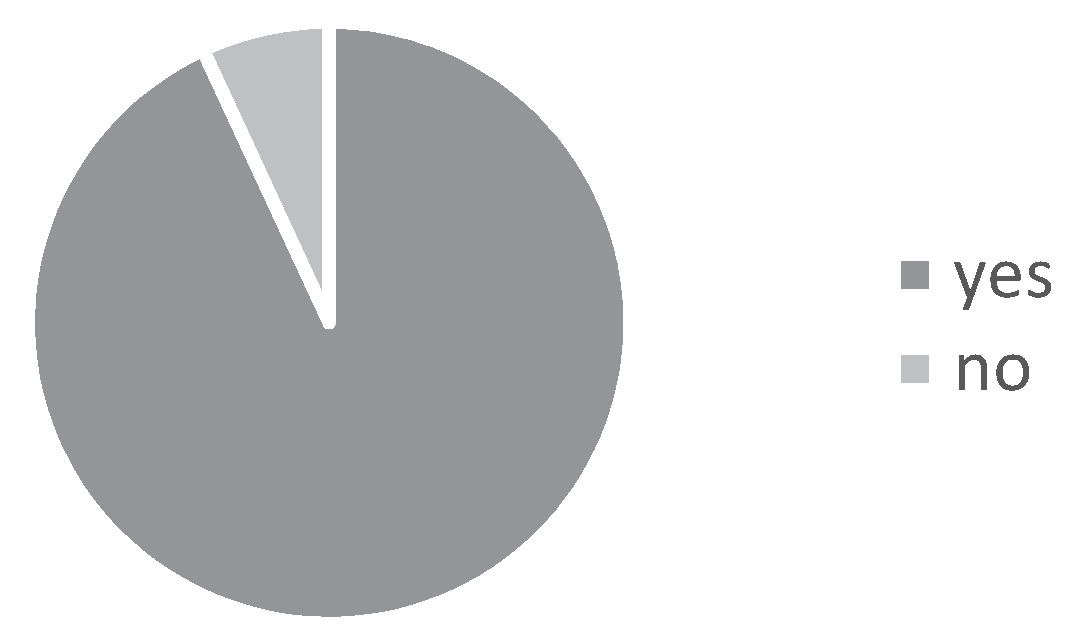
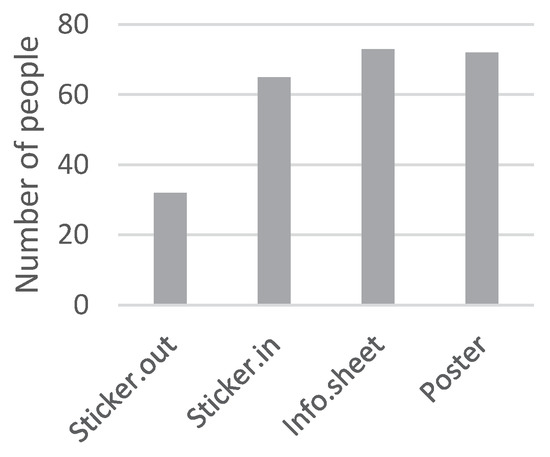
Figure A23.
The number of participants that had seen the different types of information, second survey (81 individuals).
Figure A23.
The number of participants that had seen the different types of information, second survey (81 individuals).
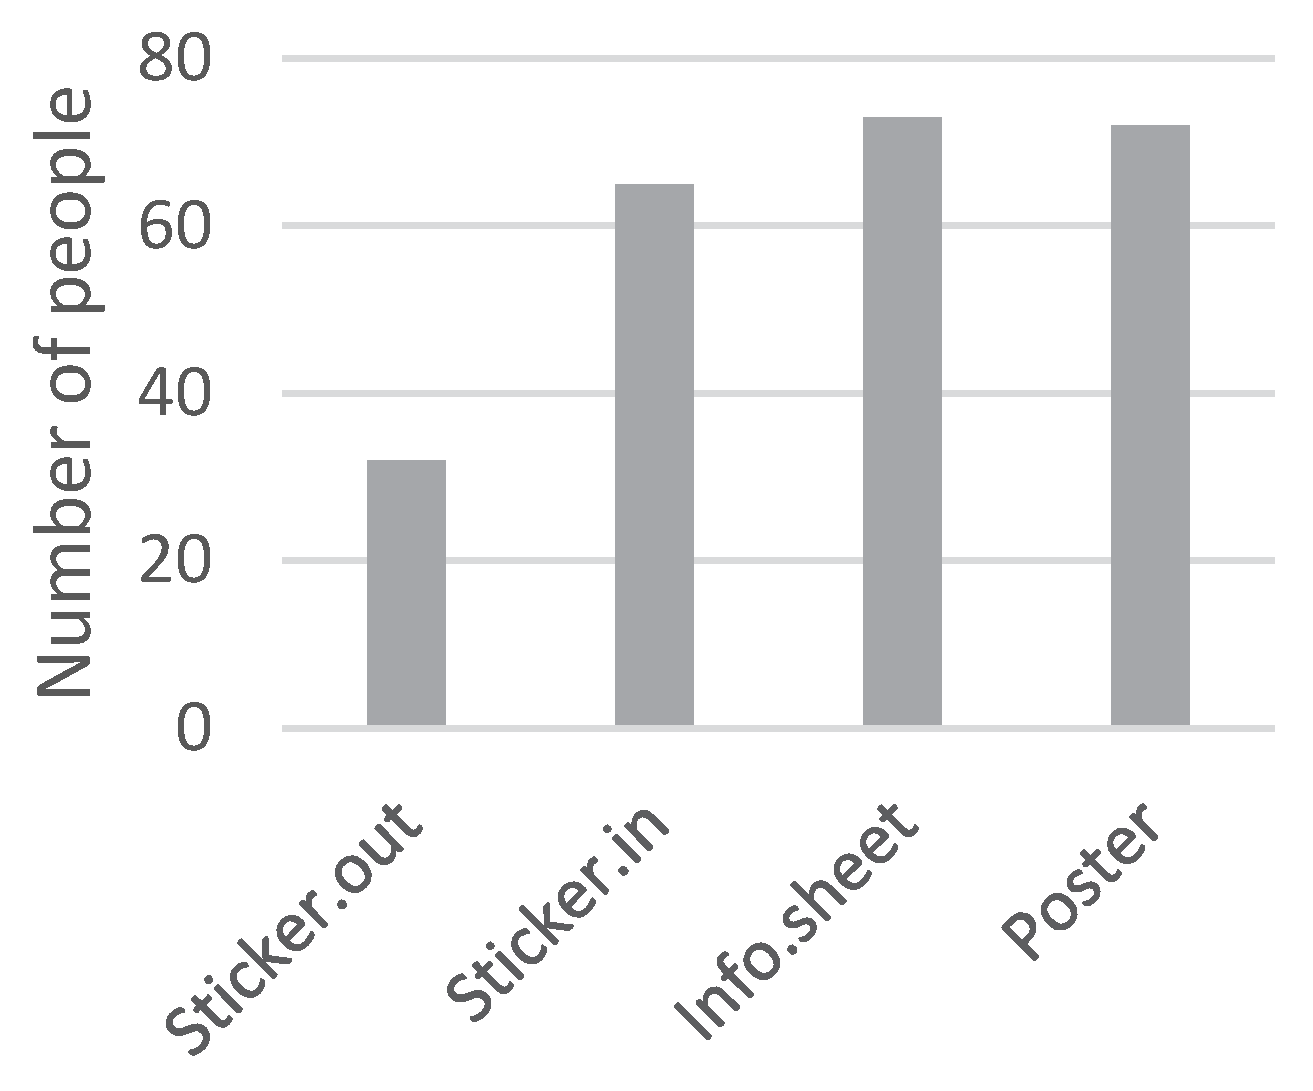
Question 8. In your opinion, how helpful is the new information? Compared to before.
The tenants were asked to evaluate the usefulness of the information on a 5-grade scale to get an impression of how the population received the information.
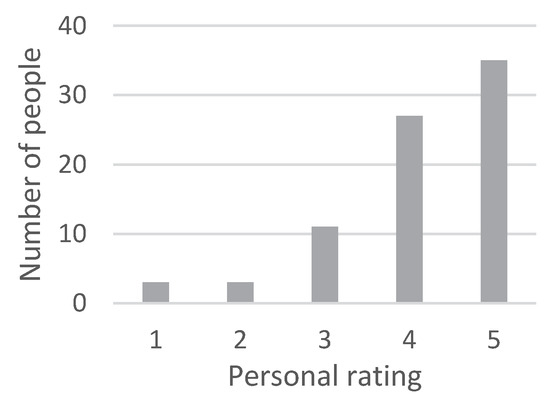
Figure A24.
Perception of usefulness of the intervention, second survey (79 individuals).
Figure A24.
Perception of usefulness of the intervention, second survey (79 individuals).
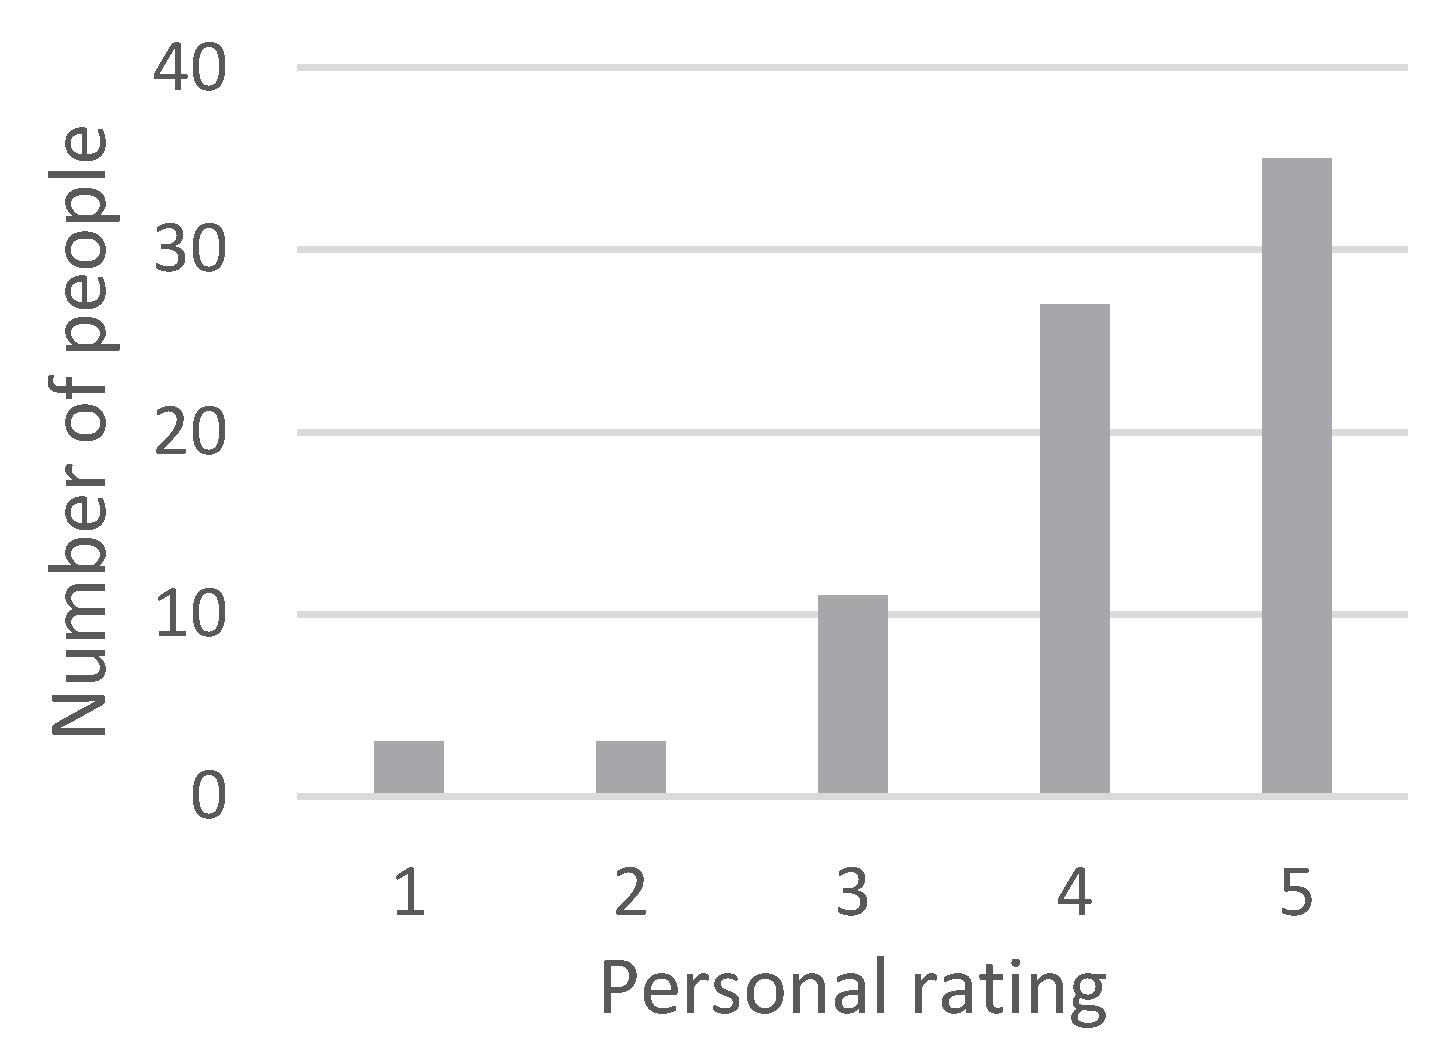
Question 9. Which type of information (of the ones that you just mentioned) do you consider the most helpful?
The interviewees were asked to name their favorite type of information (see Question 7). This helped to identify the usefulness of all of the new types of information and thereby estimate their individual impact.
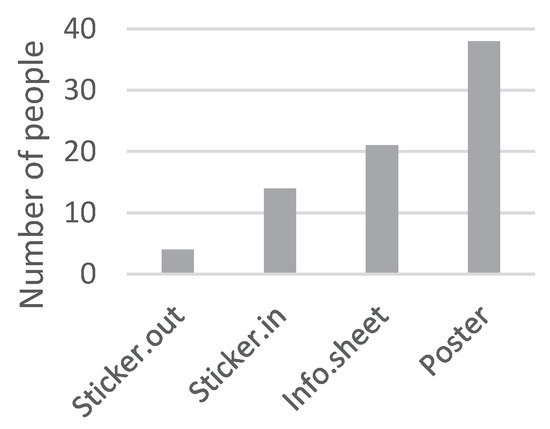
Figure A25.
Most useful type of new information, second survey (77 individuals).
Figure A25.
Most useful type of new information, second survey (77 individuals).
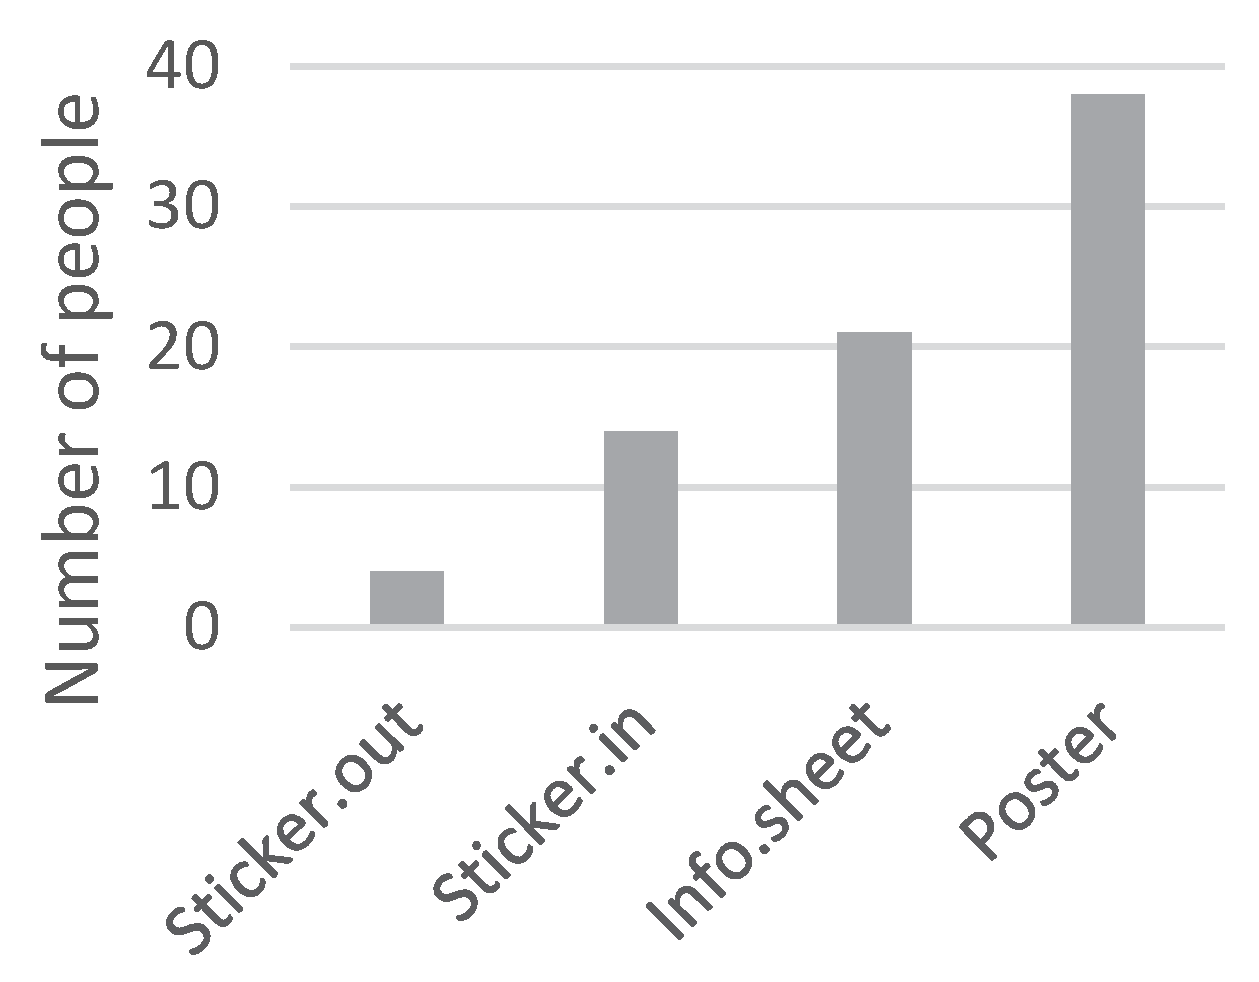
Question 10. And by the way, did you put up the stickers indoors?
This question clarified how many tenants actually put up the stickers indoors as they were instructed to do by the landlord and the researcher.
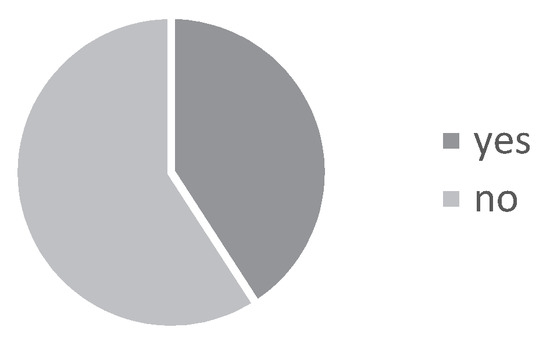
Figure A26.
Proportion of the stickers put up indoors, second survey (93 individuals).
Figure A26.
Proportion of the stickers put up indoors, second survey (93 individuals).
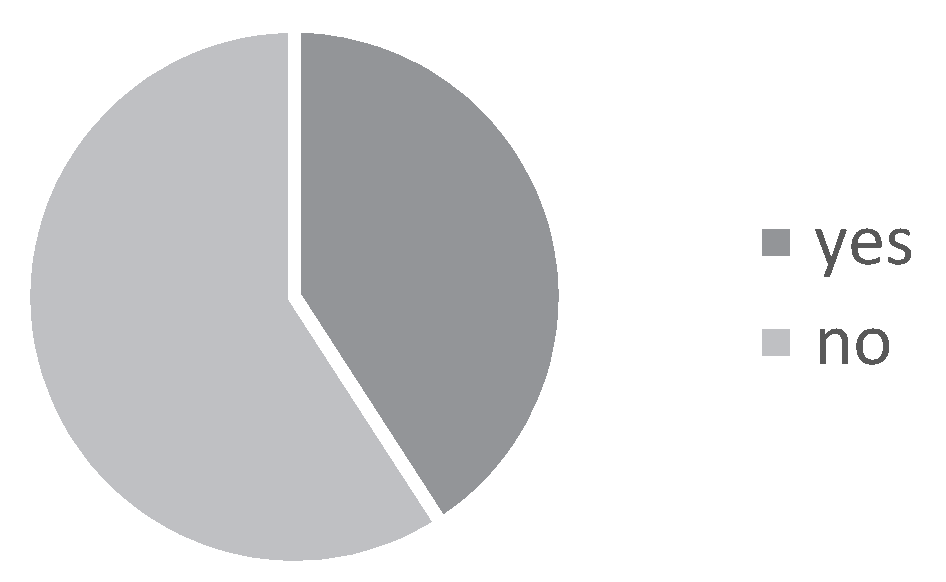
Appendix C
Types of information used in the intervention
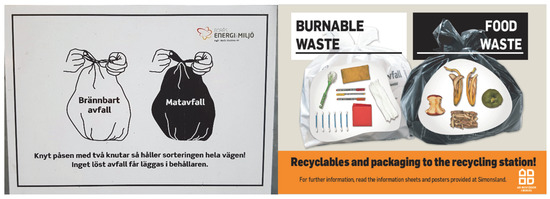
Figure A27.
Old (left) and new (right) stickers for the outdoor bins. The text on the white bag in the left figure means ‘burnable waste’, on the black bag ‘food waste’ and under the bags ‘If you tie the bag with two knots then the sorting will remain all the way! No loose waste must be placed in the containers’.
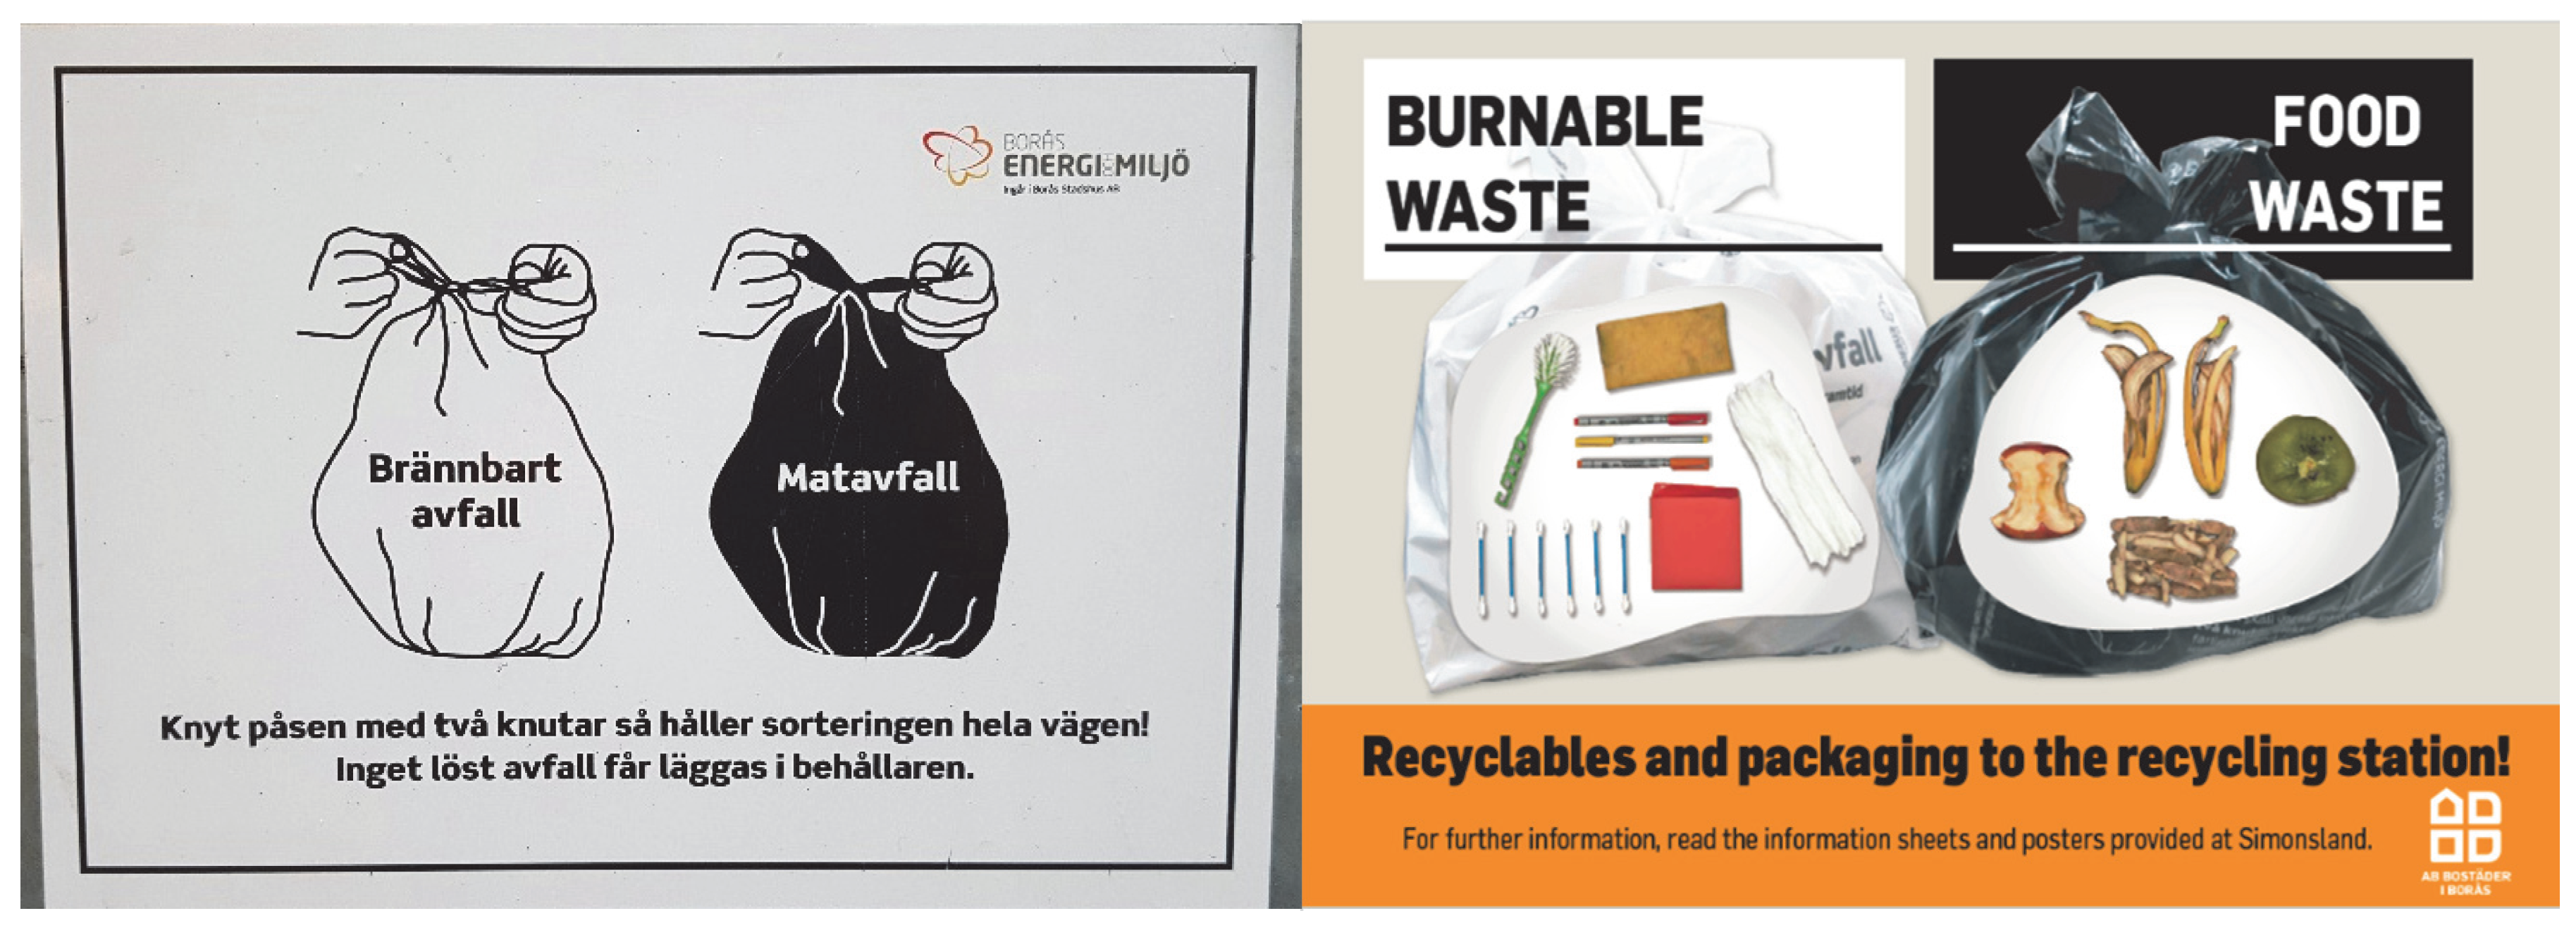
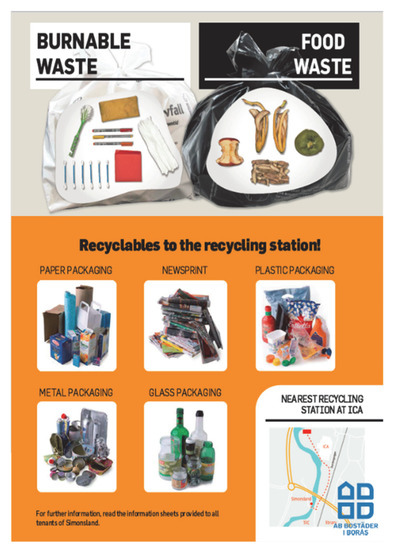
Figure A28.
Poster displayed at all entrances and elevators.
Figure A28.
Poster displayed at all entrances and elevators.
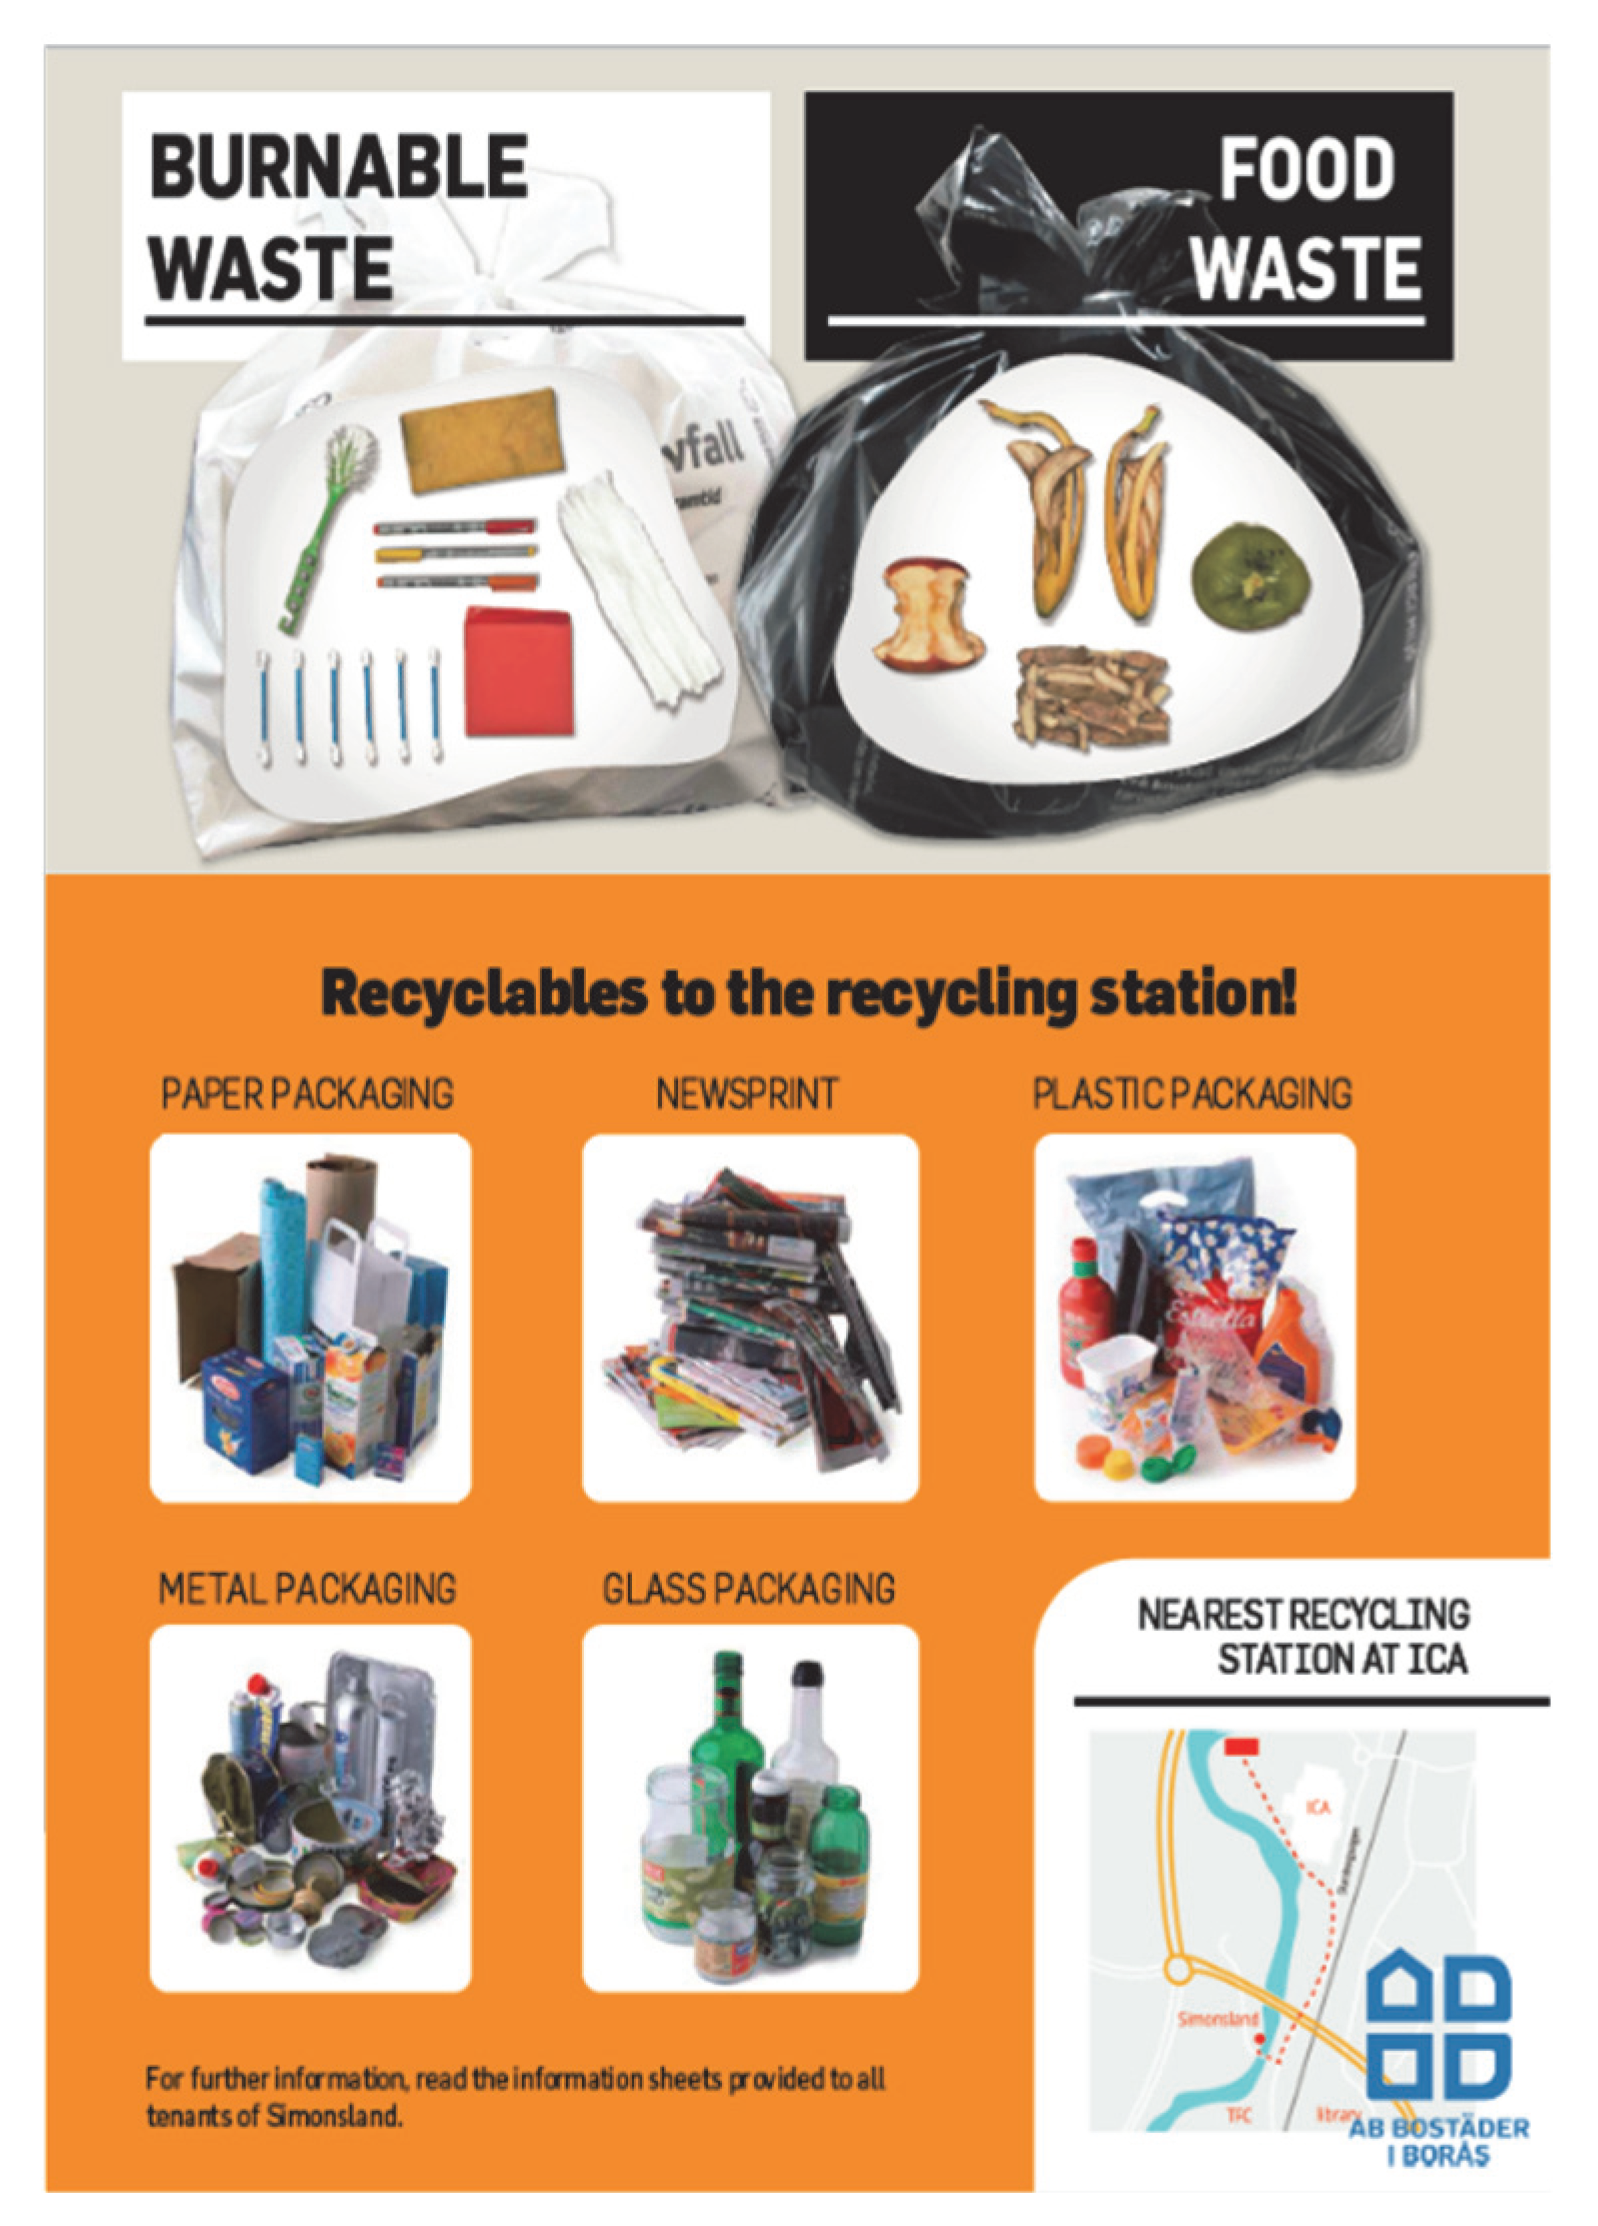
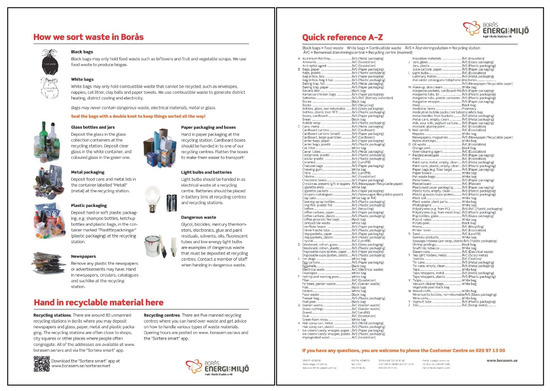
Figure A29.
Front (left) and back (right) of the provided information sheet. This figure is also shown at <borasem.se/download/18.514ad6e915a834ad6bc69bff/1488532278694/Infoblad_sortering_foto_1601_eng.pdf> for the sake of legibility.
Figure A29.
Front (left) and back (right) of the provided information sheet. This figure is also shown at <borasem.se/download/18.514ad6e915a834ad6bc69bff/1488532278694/Infoblad_sortering_foto_1601_eng.pdf> for the sake of legibility.
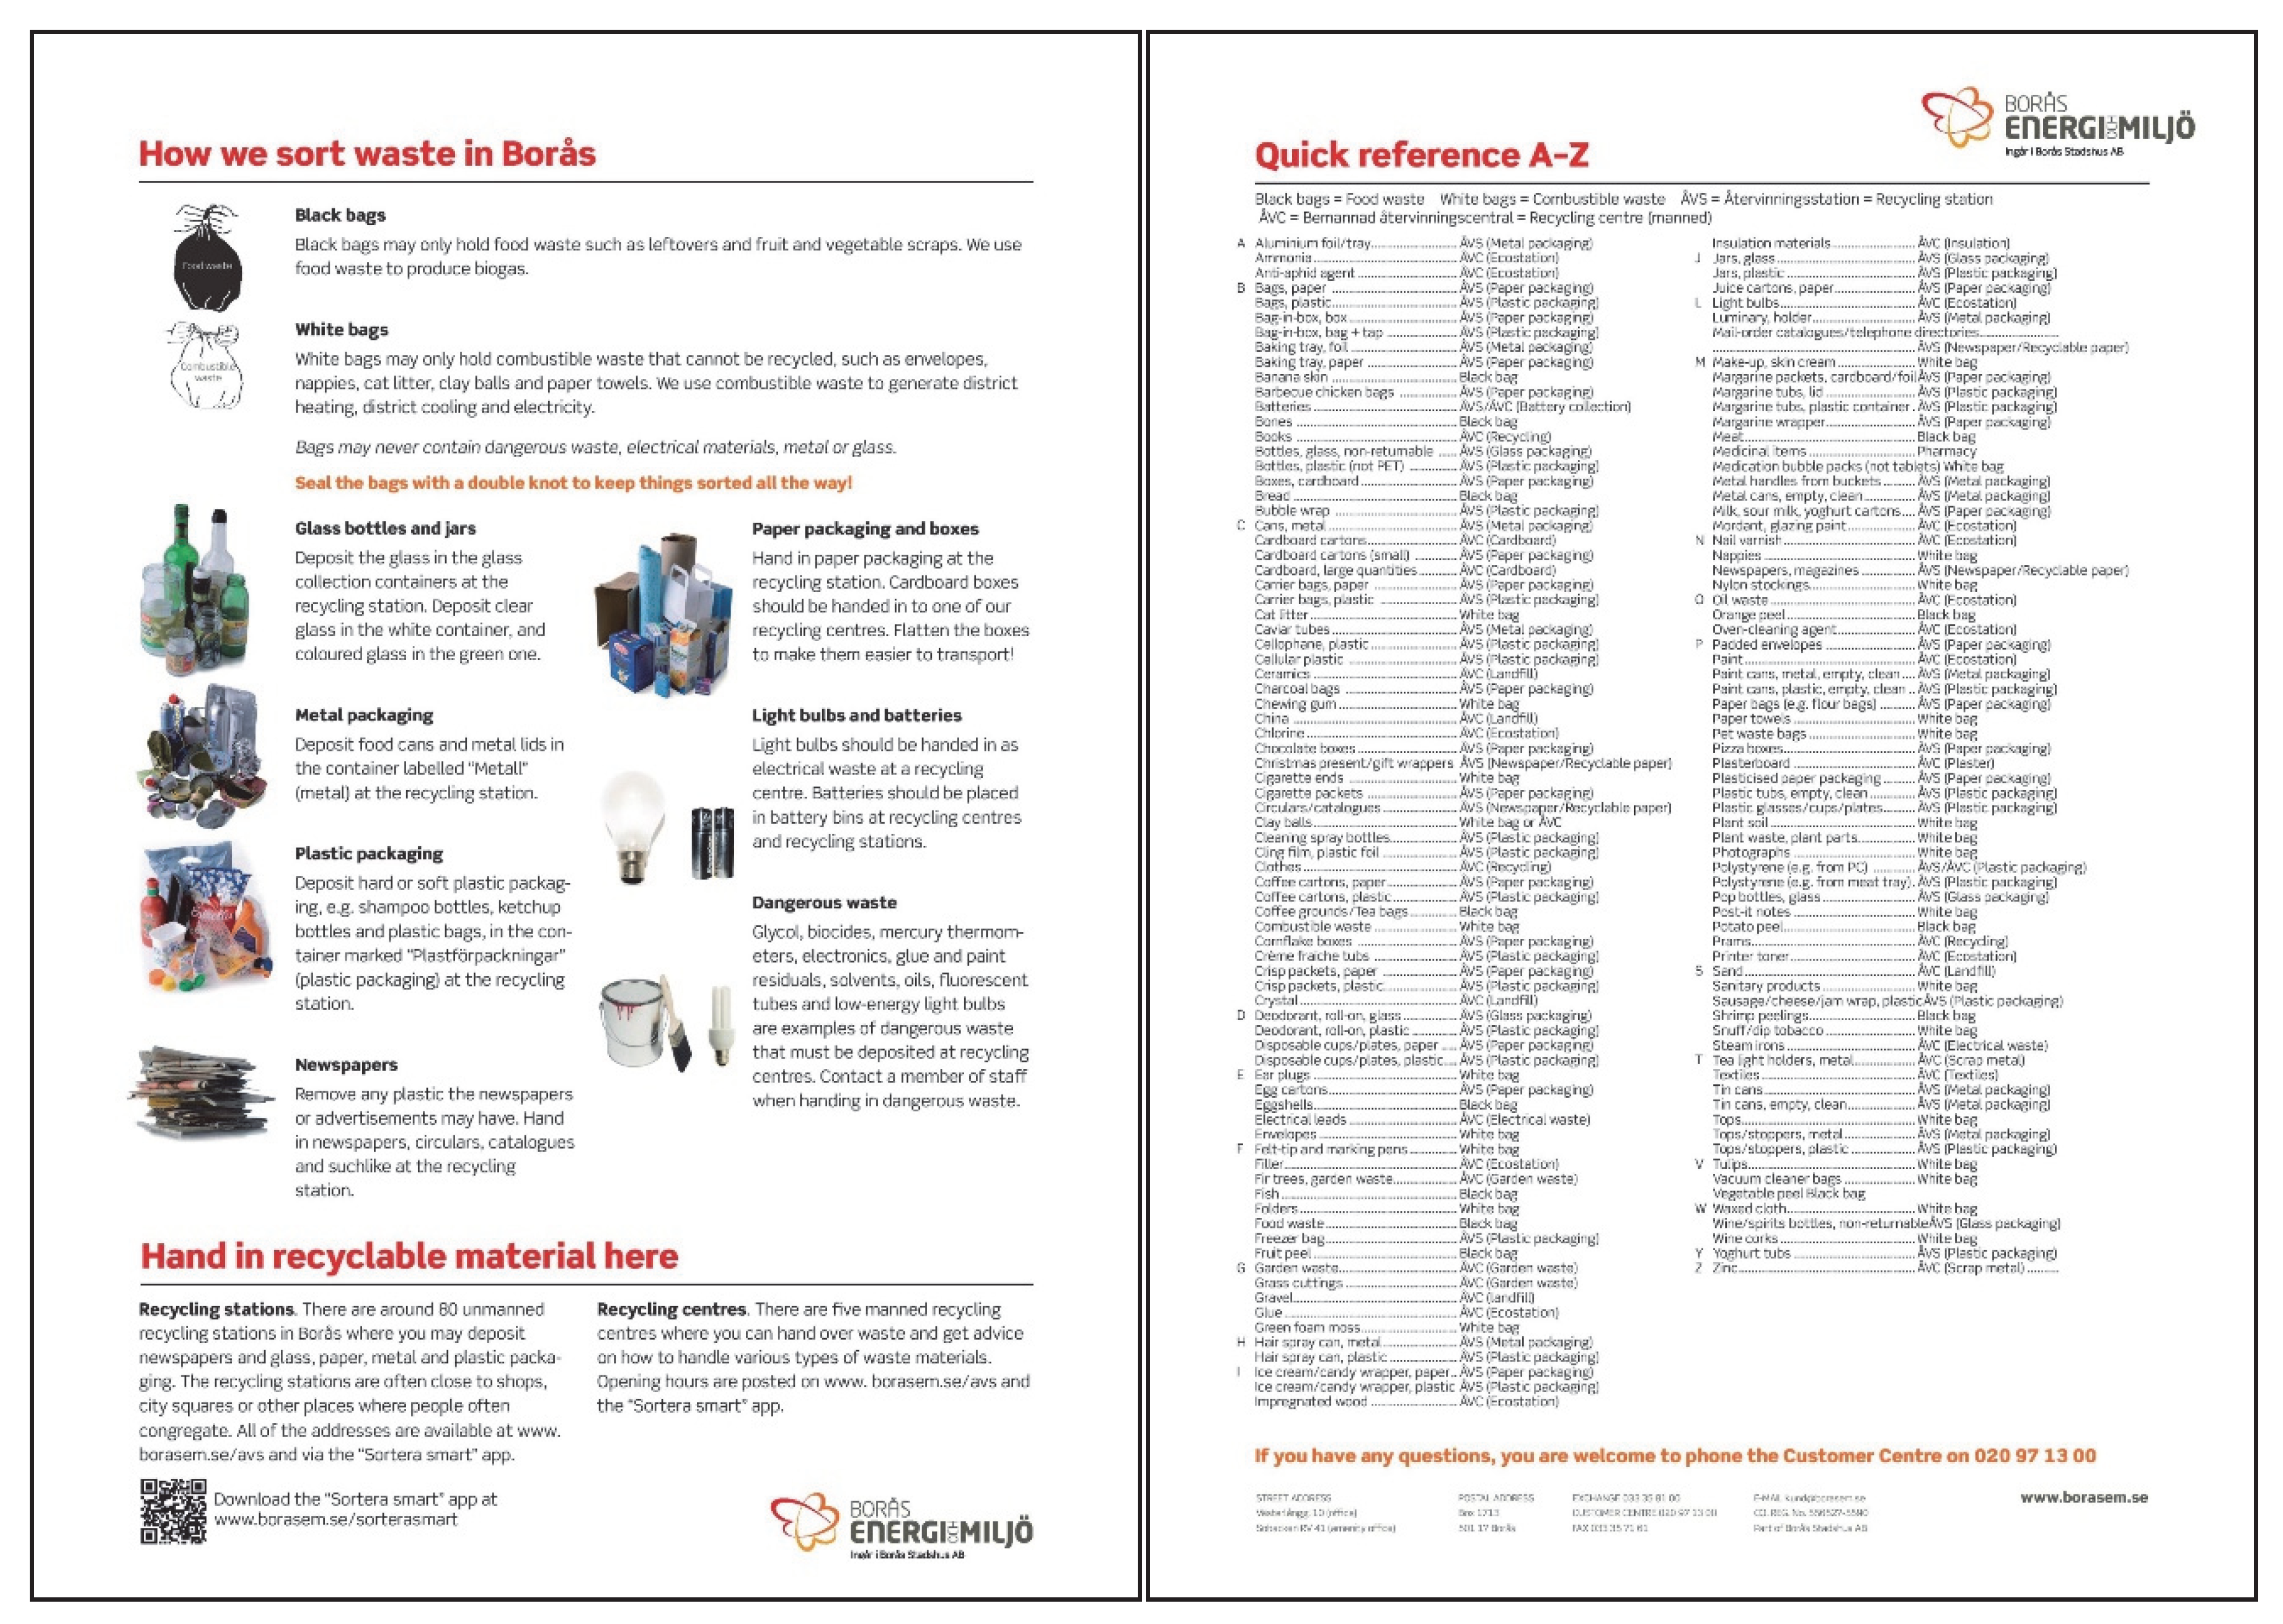
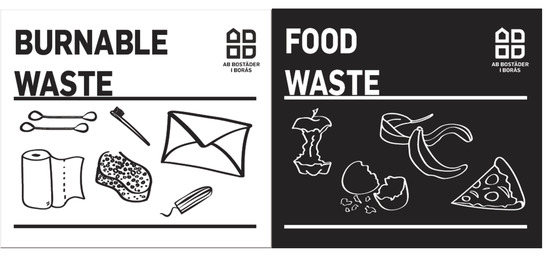
Figure A30.
Stickers for the indoor bins.
Figure A30.
Stickers for the indoor bins.
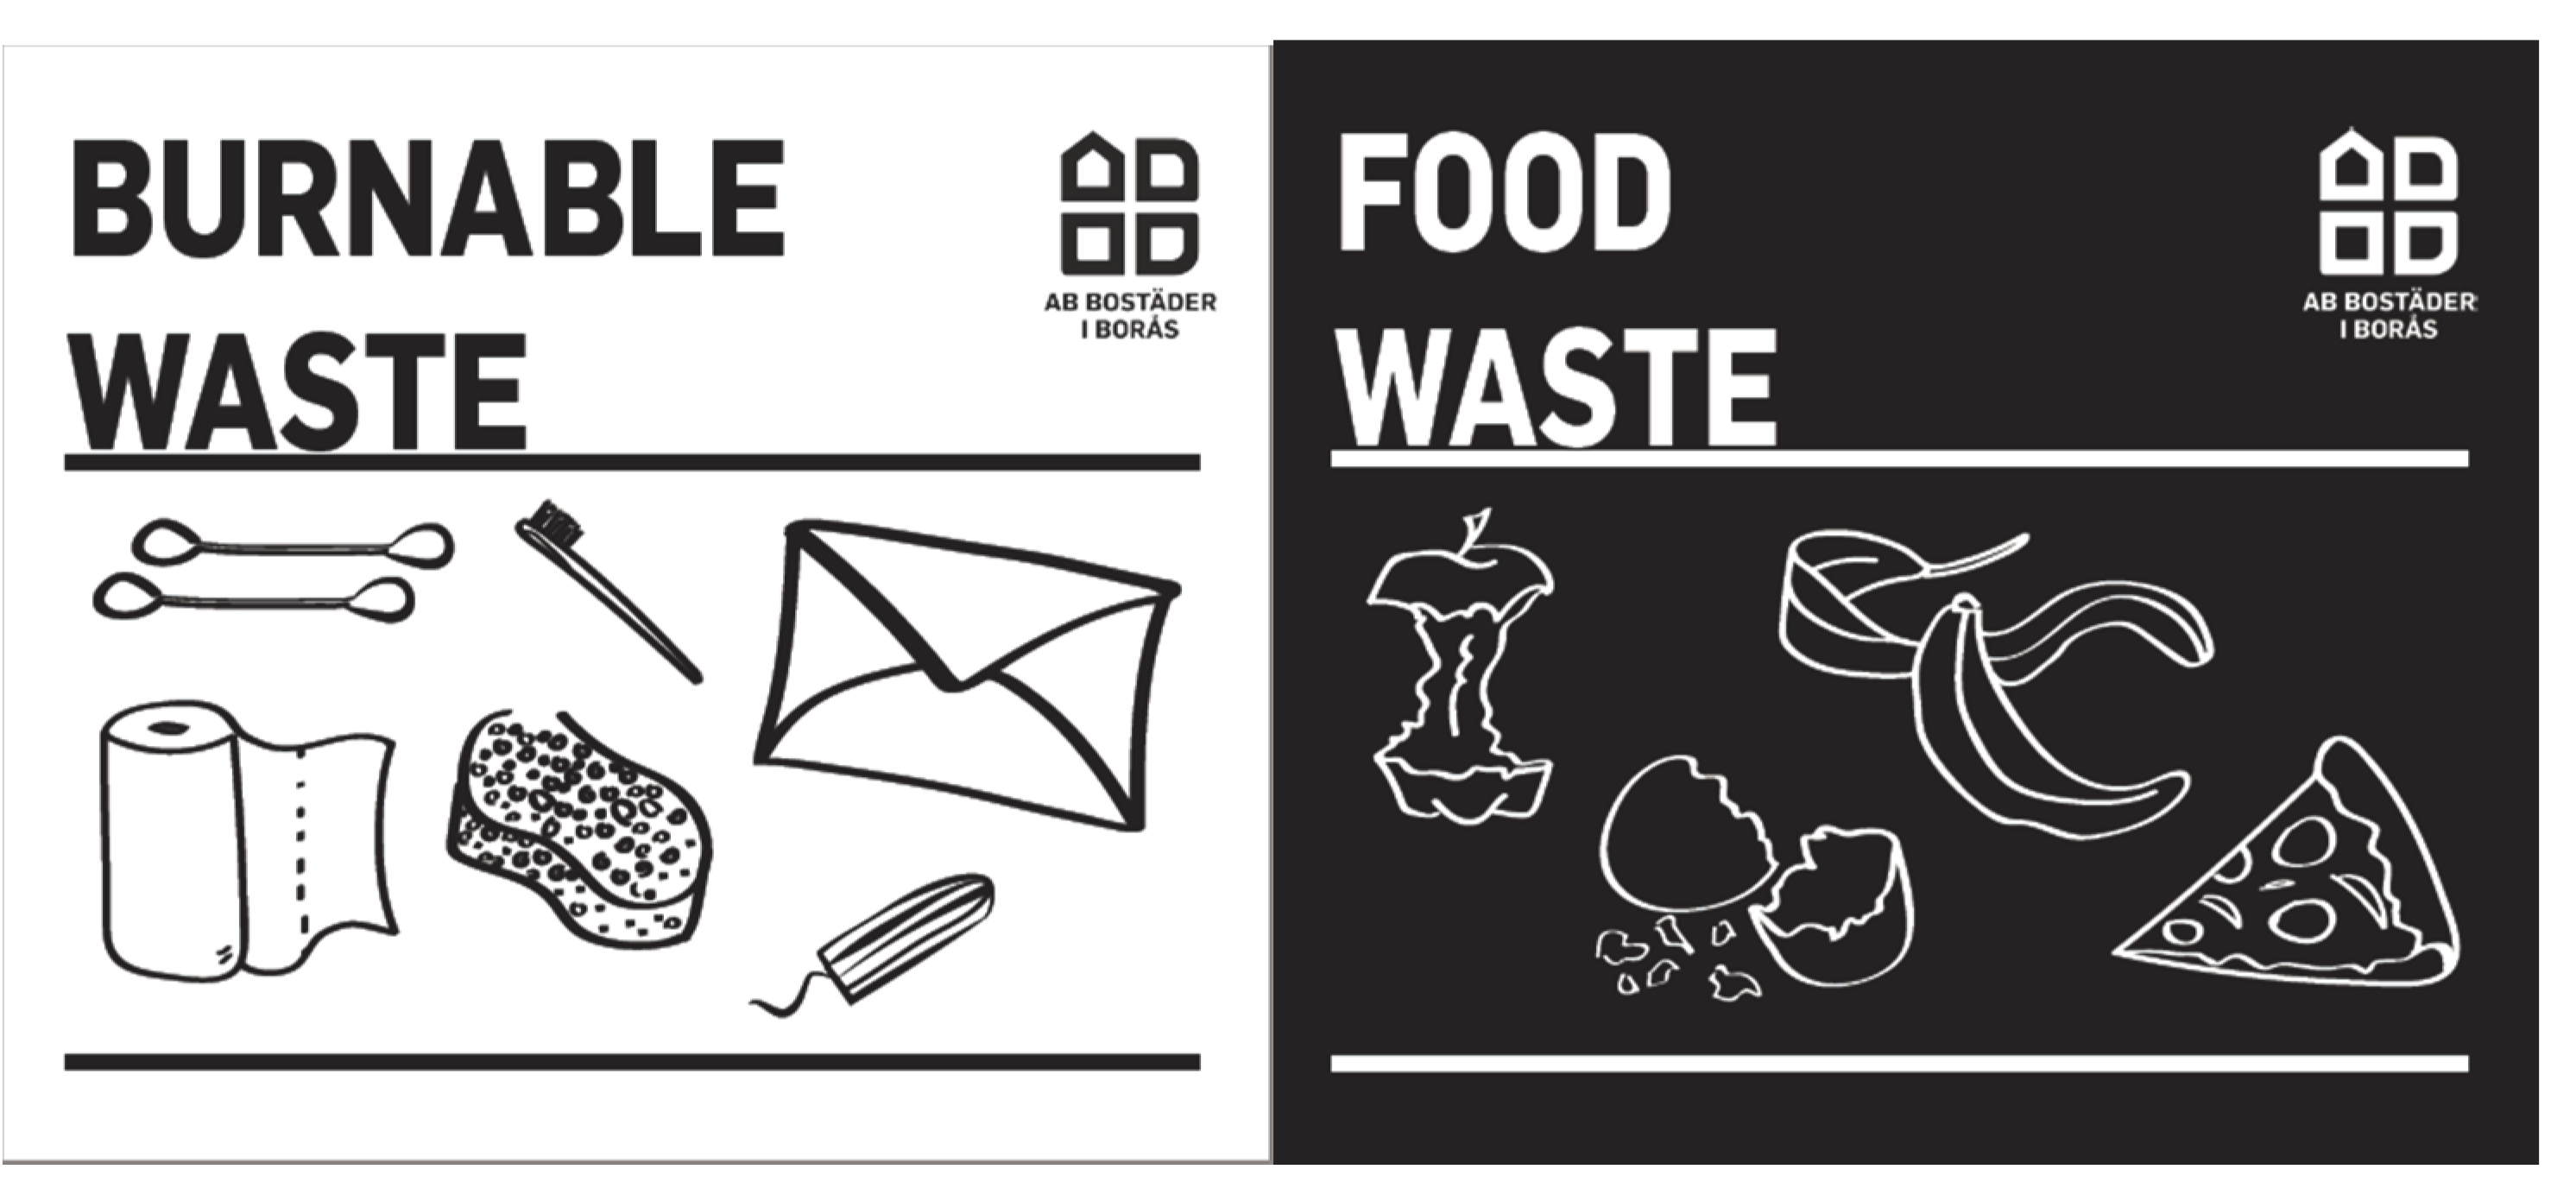
References
- Rousta, K. Household waste sorting at the source: A procedure for improvement. Available online: www.diva-portal.org/smash/get/diva2:1148055/FULLTEXT01.pdf (accessed on 1 January 2018).
- Rousta, K.; Ekström, K. Assessing incorrect household waste sorting in a medium-sized Swedish city. Sustainability 2013, 5, 4349–4361. [Google Scholar] [CrossRef]
- Swedish Waste Management 2018. Available online: www.avfallsverige.se/fileadmin/user_upload/Publikationer/Avfallshantering_2018_EN.pdf (accessed on 10 March 2020).
- Ölander, F.; Thøgersen, J. Understanding of consumer behaviour as a prerequisite for environmental protection. J. Consum. Policy 1995, 18, 345–385. [Google Scholar] [CrossRef]
- Tucker, P. Understanding recycling behaviour. Pap. Technol. 2001, 42, 51–54. [Google Scholar]
- Barr, S. Household Waste in Social Perspective: Values, Attitudes, Situation and Behavior; Routledge: London, UK, 2017. [Google Scholar]
- Rousta, K.; Ordoñez, I.; Bolton, K.; Dahlén, L. Support for designing waste sorting systems: A mini review. Waste Manag. Res. 2017, 35, 1099–1111. [Google Scholar] [CrossRef]
- Bernstad, A. Household food waste separation behavior and the importance of convenience. Waste Manag. 2014, 34, 1317–1323. [Google Scholar] [CrossRef]
- Schultz, P.W. Changing behavior with normative feedback interventions: A field experiment on curbside recycling. Basic Appl. Soc. Psychol. 1999, 21, 25–36. [Google Scholar] [CrossRef]
- Porter, B.E.; Leeming, F.C.; Dwyer, W.O. Solid waste recovery: A review of behavioral programs to increase recycling. Environ. Behav. 1995, 27, 122–152. [Google Scholar] [CrossRef]
- Thøgersen, J. A model of recycling behaviour, with evidence from Danish source separation programmes. Int. J. Res. Mark. 1994, 11, 145–163. [Google Scholar] [CrossRef]
- Varotto, A.; Spagnolli, A. Psychological strategies to promote household recycling. A systematic review with meta-analysis of validated field interventions. J. Environ. Psychol. 2017, 51, 168–188. [Google Scholar] [CrossRef]
- Huang, Y.; Tamas, P.; Harder, M. Information with a smile–Does it increase recycling? J. Clean. Prod. 2018, 178, 947–953. [Google Scholar] [CrossRef]
- Salhofer, S.; Isaac, N.A. Importance of public relations in recycling strategies: Principles and case studies. Environ. Manag. 2002, 30, 68–76. [Google Scholar] [CrossRef] [PubMed]
- Coggins, C. Waste prevention—An issue of shared responsibility for UK producers and consumers: Policy options and measurement. Resour. Conserv. Recycl. 2001, 32, 181–190. [Google Scholar] [CrossRef]
- Rousta, K.; Bolton, K.; Dahlén, L. A procedure to transform recycling behavior for source separation of household waste. Recycling 2016, 1, 147. [Google Scholar] [CrossRef]
- Hage, O.; Sandberg, K.; Söderholm, P.; Berglund, C. The regional heterogeneity of household recycling: A spatial-econometric analysis of Swedish plastic packing waste. Lett. Spat. Resour. Sci. 2018, 11, 245–267. [Google Scholar] [CrossRef]
- Borås. Snabba siffror och fakta. Available online: https://www.boras.se/kommunochpolitik/omboras/borasisiffror/snabbasiffrorochfakta (accessed on 6 December 2019).
- Dahlén, L.; Lagerkvist, A. Methods for household waste composition studies. Waste Manag. 2008, 28, 1100–1112. [Google Scholar] [CrossRef]
- Tucker, P.; Speirs, D. Count me as doing my bit: An appraisal of the accuracy of waste attitude/behaviour surveys. CIWM Sci. Tech. Rev 2003, 4, 2003. [Google Scholar]
- Manual for Pick Analysis of Household Food and Residual Waste. Available online: https://www.avfallsverige.se/kunskapsbanken/rapporter/rapportera/article/manual-for-plockanalys-av-hushallens-mat-och-restavfall/ (accessed on 1 January 2017).
- Rousta, K.; Bolton, K.; Lundin, M.; Dahlén, L. Quantitative assessment of distance to collection point and improved sorting information on source separation of household waste. Waste Manag. 2015, 40, 22–30. [Google Scholar] [CrossRef]
- Kelley, K.; Clark, B.; Brown, V.; Sitzia, J. Good practice in the conduct and reporting of survey research. Int. J. Qual. Health Care 2003, 15, 261–266. [Google Scholar] [CrossRef]
- Sitzia, J.; Wood, N. Response rate in patient satisfaction research: An analysis of 210 published studies. Int. J. Qual. Health Care 1998, 10, 311–317. [Google Scholar] [CrossRef]
- Zhang, X.; Kuchinke, L.; Woud, M.L.; Velten, J.; Margraf, J. Survey method matters: Online/offline questionnaires and face-to-face or telephone interviews differ. Comput. Hum. Behav. 2017, 71, 172–180. [Google Scholar] [CrossRef]
- Martin, M.; Williams, I.D.; Clark, M. Social, cultural and structural influences on household waste recycling: A case study. Resour. Conserv. Recycl. 2006, 48, 357–395. [Google Scholar] [CrossRef]
- Hellwig, C.; Häggblom-Kronlöf, G.; Bolton, K.; Rousta, K. Household Waste Sorting and Engagement in Everyday Life Occupations after Migration—A Scoping Review. Sustainability 2019, 11, 4701. [Google Scholar] [CrossRef]
- Miafodzyeva, S.; Brandt, N.; Andersson, M. Recycling behaviour of householders living in multicultural urban area: A case study of Järva, Stockholm, Sweden. Waste Manag. Res. 2013, 31, 447–457. [Google Scholar] [CrossRef] [PubMed]
- Hage, O. The Swedish producer responsibility for paper packaging: An effective waste management policy? Resour. Conserv. Recycl. 2007, 51, 314–344. [Google Scholar] [CrossRef]
- Ghani, W.A.W.A.K.; Rusli, I.F.; Biak, D.R.A.; Idris, A. An application of the theory of planned behaviour to study the influencing factors of participation in source separation of food waste. Waste Manag. 2013, 33, 1276–1281. [Google Scholar] [CrossRef] [PubMed]
- Nomura, H.; Takahashi, Y.; Yabe, M. Psychological driving forces behind households’ behaviors toward municipal organic waste separation at source in Vietnam: A structural equation modeling approach. J. Mater. Cycles Waste Manag. 2017, 19, 1052–1060. [Google Scholar]
- Nguyen, T.T.P.; Zhu, D.; Le, N.P. Factors influencing waste separation intention of residential households in a developing country: Evidence from Hanoi, Vietnam. Habitat Int. 2015, 48, 169–176. [Google Scholar] [CrossRef]
- Tang, Z.; Chen, X.; Luo, J. Determining socio-psychological drivers for rural household recycling behavior in developing countries: A case study from Wugan, Hunan, China. Environ. Behav. 2011, 43, 848–877. [Google Scholar] [CrossRef]
- Yuan, Y.; Nomura, H.; Takahashi, Y.; Yabe, M. Model of Chinese household kitchen waste separation behavior: A case study in Beijing city. Sustainability 2016, 8, 1083. [Google Scholar] [CrossRef]
- Chu, P.Y.; Chiu, J.F. Factors influencing household waste recycling behavior: Test of an integrated model 1. J. Appl. Soc. Psychol. 2003, 33, 604–626. [Google Scholar] [CrossRef]
- Jekria, N.; Daud, S. Environmental concern and recycling behaviour. Procedia Econ. Financ. 2016, 35, 667–673. [Google Scholar] [CrossRef]
- Chen, M.-F.; Tung, P.-J. The moderating effect of perceived lack of facilities on consumers’ recycling intentions. Environ. Behav. 2010, 42, 824–844. [Google Scholar] [CrossRef]
- Mosler, H.-J.; Tamas, A.; Tobias, R.; Rodríguez, T.C.; Miranda, O.G. Deriving interventions on the basis of factors influencing behavioral intentions for waste recycling, composting, and reuse in Cuba. Environ. Behav. 2008, 40, 522–544. [Google Scholar] [CrossRef]
- Pakpour, A.H.; Zeidi, I.M.; Emamjomeh, M.M.; Asefzadeh, S.; Pearson, H. Household waste behaviours among a community sample in Iran: An application of the theory of planned behaviour. Waste Manag. 2014, 34, 980–986. [Google Scholar] [CrossRef] [PubMed]
- Tamas, A.; Mosler, H.-J.; Tobias, R.; Rodríguez, T.C.; Miranda, O.G. Factors determining the intentions to reuse, separate and compost household waste in the city of Santiago De Cuba. Waste Soc. Context 2005, 2005, 736–744. [Google Scholar]
- Corral-Verdugo, V.c. Dual ‘realities’ of conservation behavior: Self-reports vs. observations of re-use and recycling behavior. J. Environ. Psychol. 1997, 17, 135–145. [Google Scholar] [CrossRef]
- Singhirunnusorn, W.; Donlakorn, K.; Kaewhanin, W. Contextual factors influencing household recycling behaviours: A case of waste bank project in Mahasarakham municipality. Procedia-Soc. Behav. Sci. 2012, 36, 688–697. [Google Scholar] [CrossRef]
- Strydom, W. Highlights of a recycling behaviour study in South Africa’s large urban areas. In Proceedings of the 4th CSIR Biennial Conference: Real problems relevant solutions, Pretoria, South Africa, 9–10 October 2012. [Google Scholar]
- Barr, S. Household Waste in Social Perspective; Values, Attitudes, Situation and Behaviour; Ashgate: Burlington, UK, 2002. [Google Scholar]
- Strydom, W. Barriers to household waste recycling: Empirical evidence from South Africa. Recycling 2018, 3, 41. [Google Scholar] [CrossRef]
- Omran, A.; Schiopu, A.-M. Reasons for non-participation in recycling of solid waste in northern Malaysia: A case study. Environ. Eng. Manag. J. (EEMJ) 2015, 14, 233–243. [Google Scholar] [CrossRef]
- Tadesse, T.; Ruijs, A.; Hagos, F. Household waste disposal in Mekelle city, Northern Ethiopia. Waste Manag. 2008, 28, 2003–2012. [Google Scholar] [CrossRef]
- De Young, R. Recycling as appropriate behavior: A review of survey data from selected recycling education programs in Michigan. Resour. Conserv. Recycl. 1990, 3, 253–266. [Google Scholar] [CrossRef]
- Vicente, P.; Reis, E. Factors influencing households’ participation in recycling. Waste Manag. Res. 2008, 26, 140–146. [Google Scholar] [CrossRef] [PubMed]
- Chen, F.; Chen, H.; Yang, J.; Long, R.; Li, W. Impact of regulatory focus on express packaging waste recycling behavior: Moderating role of psychological empowerment perception. Environ. Sci. Pollut. Res. 2019, 26, 8862–8874. [Google Scholar] [CrossRef] [PubMed]
© 2020 by the authors. Licensee MDPI, Basel, Switzerland. This article is an open access article distributed under the terms and conditions of the Creative Commons Attribution (CC BY) license (http://creativecommons.org/licenses/by/4.0/).

