Article

Harnessing Wheat Bran as a Phytochemical Bioresource: Release of Ferulic Acid Using Organosolv Treatment with Acidic/Alkaline Deep Eutectic Solvents

by
Spyros Grigorakis
1 and
Dimitris P. Makris
2,*
1
Department of Food Quality & Chemistry of Natural Products, Mediterranean Agronomic Institute of Chania (M. A. I. Ch.), International Centre for Advanced Mediterranean Agronomic Studies (CIHEAM), P.O. Box 85, 73100 Chania, Greece
2
Green Processes & Biorefinery Group, Department of Food Science & Nutrition, School of Agricultural Sciences, University of Thessaly, N. Temponera Street, 43100 Karditsa, Greece
*
Author to whom correspondence should be addressed.
Recycling 2025, 10(5), 178; https://doi.org/10.3390/recycling10050178
Submission received: 2 September 2025 / Revised: 19 September 2025 / Accepted: 19 September 2025 / Published: 22 September 2025

Abstract

Wheat bran (WB) is a very abundant residual biomass, resulting from wheat processing. Although it can be used as feed without further processing, the utilization of WB as a bioresource of high valued-added chemicals would require task-specific treatments. In this context, the present work aimed to used two newly reported deep eutectic solvents (DESs) for the effective organosolv treatment of WB to achieve a high-performance polyphenol recovery. One of the DESs used was alkaline, composed of glycerol and sodium carbonate (GL-SCar), and the other one was acidic, composed of glycerol and oxalic acid (GL-OA), and the treatments carried out were evaluated based on severity. Further optimization with a response surface methodology showed that treatment with GL-SCar could afford a maximum total polyphenol yield of 24.30 ± 2.34 mg ferulic acid equivalents per g of dry WB mass, the optimal settings being t = 172 min and T = 90 °C. Likewise, the GL-OA treatment yielded 23.21 ± 3.82 mg ferulic acid equivalents per g of dry WB mass, with the corresponding optimal conditions being t = 180 min and T = 90 °C. The examination of the polyphenolic profile of the extracts obtained revealed important differences in the composition, as the extract obtained with GL-SCar treatment was dominated by ferulic acid, whereas the extract produced with GL-OA treatment was enriched in a ferulate derivative, previously identified as a ferulate pentose ester. However, both treatments were shown to liberate only part of the bound phenolics, as judged by comparison with a reference alkaline hydrolysis. The difference in composition most probably defined the antioxidant effects of the extracts, with the GL-OA extract displaying more powerful antiradical and ferric-reducing power activity, despite the significantly lower polyphenolic concentration. The evidence that emerged from this investigation pointed to both DESs as solvents with high potency in polyphenol recovery from WB, yet further improvements are required to maximize yield. Moreover, it was shown that, due to their different nature (alkaline/acidic), both DESs could be suitably tuned for delivering extracts enriched in different phytochemicals.

1. Introduction

The ever-increasing agricultural intensification and food production to cover the needs of the world’s growing population have led to the production of an outstanding mass of waste biomaterials. These materials may derive from farming practices (i.e., pruning), post-harvest screening (i.e., rejection of damaged/defected products), and food processing (i.e., peeling, seed/root/leaf removal, etc.). As a consequence, the agri-food sector has become a leading source of residual biomass, which must be properly managed and disposed; otherwise, serious environmental and public health issues may emerge. Common utilization of waste materials may include landfill dumping and/or reuse in the field as soil amendment, but they may be also incorporated into the value chain as low-value products, e.g., as compost or animal feed [1,2].
On the other hand, contemporary policies based on bioeconomy principles dictate the utilization of rejected biomass as a raw material for the production of a vast range of high value-added commodities. Such approaches embrace advanced biorefinery strategies, committed to delivering bio-based products created using sustainable and eco-friendly technologies. In this context, food processing by-products and wastes are now regarded as precious bioresources, as they may contain a wide range of phytochemicals with high prospects in the chemical industry (i.e., biosolvent and biofuel production) and the food/pharmaceutical/cosmetic manufacturing industries [3,4].
Cereals are one of the largest parts of the food industry worldwide, and crops including wheat, maize, rice, and barley account for more than 90% of global cereal consumption. The processing of cereals generates a high volume of by-products which, due to their composition, could be regarded as fine raw materials for biorefinery [5,6]. Wheat is one of the most important cereal crops, and wheat grains are almost exclusively used to produce flour, with a yield ranging from 73 to 77%. The main constituent of the residual 23–27% is bran, accompanied by a lower proportion of endosperm and germ. Wheat bran (WB) represents roughly 25% of the total wheat grain weight, and it is by far the most important wheat processing residue. Almost 120 million tons of WB are annually produced [7], making WB a very abundant biomaterial, which could be used for the recovery of value-added products, including polyphenolic antioxidants [8,9].
Ferulic acid (FA) is the major polyphenol of WB and exhibits significant antioxidant effects [10], but it may also display beneficial properties against some degenerative diseases, such as cardiovascular disorders and cancer [11,12]. FA has also gained industrial interest, since it could be a phytochemical with high potential as a food antioxidant, functional food ingredient, and natural bio-vanillin precursor [13]. In WB, FA is linked to arabinoxylan and/or lignocellulosic matrix through ether or ester linkages [14,15], and as such its recovery from WB under regular solvent extraction conditions is extremely low. Effective FA retrieval would require detachment from the lignocellulosic matrix through acid/alkali-catalyzed hydrolysis, yet the majority of methodologies employed for such a task require harsh conditions, implicating corrosive and environmentally aggravating chemicals, such as sodium hydroxide and sulfuric acid [16,17].
Deep eutectic solvents (DESs) are considered to be neoteric liquids with unique characteristics that distinguish them from common conventional solvents. They are usually composed of two compounds, one characterized as a hydrogen bond donor (HBD) and the other as a hydrogen bond acceptor (HBA). Ever since the establishment of various DES categories [18], a plethora of DESs have been synthesized and studied [19]. Typical features of DESs are low vapor pressure, composition tunability, absence or very low toxicity, high solvation power, miscibility with water, recyclability, and low cost [20]. All these properties have attracted enormous interest, and a vast variety of applications have been developed based on DESs [21,22,23].
The use of DESs for polyphenol recovery from numerous plant sources is a field of ongoing research, and DESs have been the solvents of preference mainly because of their higher performance in extracting polyphenols possessing a range of polarities, but also because of the stability they may confer [24,25]. DESs may have a strongly acidic or alkaline character, and, by virtue of these properties, they have also been employed in polyphenol modification, such as flavonoid glycoside hydrolysis [26]. These investigations showcased the usefulness of certain DESs in assisting the production of extracts with tuned composition. Specifically for glycerol-based DESs, there have been several investigations demonstrating their usefulness in cutting-edge technologies, implemented to generate extracts enriched in bioactive substances, such as polyphenols, from plant material (e.g., food processing residues). These solvents have been distinguished for an assortment of properties, including relatively low cost and their bio-based character, absence of toxicity, recyclability, and compatibility with use in foods, pharmaceuticals, and cosmetics [24,25].
The work presented herein aimed to use two novel DESs, one acidic, composed of glycerol/oxalic acid, and one alkaline, composed of glycerol/sodium carbonate, for carrying out organosolv treatments of WB. The scope extended to examining the potency of these two solvents to simultaneously liberate and extract polyphenols, with the aim of generating extracts enriched in ferulic acid and possibly ferulate derivatives, as demonstrated in earlier studies of ours [27]. Such a treatment of WB with environmentally friendly and low-cost solvents, as far as the authors are aware, has heretofore been unreported.

2. Results and Discussion

2.1. Effect of Treatment Severity

To test the effect of the severity of the treatment on the total polyphenol yield (YTP), a series of trials were considered using several combinations of residence time and temperature (Table 1). Using the alkaline DES (GL-SCar), maximum YTP (23.71 ± 0.30 mg FAE g−1 DM) was obtained when variable settings were t = 120 min and T = 90 °C. Under these conditions, the CSF calculated was 5.77. When the acidic DES was used for carrying out the treatment, the maximum YTP achieved was 21.97 ± 0.21 mg FAE g−1 DM, at t = 180 min and T = 90 °C. The CSF for this treatment was 8.64, and it was almost 1.5 times higher than the CSF required to have maximum YTP using the alkaline DES. Furthermore, the maximum YTP attained with the acidic DES was significantly lower compared to the corresponding value attained with the alkaline DES (p < 0.05). Therefore, the alkaline DES organosolv treatment afforded higher YTP with lower severity.
Previous examinations of sulfuric acid-catalyzed ethanol organosolv treatment of WB showed that to obtain a YTP of 10.96 mg FAE g−1 DM, a CSF of 7.93 was required [28]. Likewise, hydrothermal treatment with benign acid catalysis using citric acid demonstrated that a YTP of 23.76 could be achieved with a CSF of 8.37 [27]. On the other hand, the sodium hydroxide-catalyzed ethanol organosolv WB treatment gave a YTP of 19.91 mg FAE g−1 DM, requiring a CSF of 7.63 [28], while an even higher YTP (23.60 mg FAE g−1 DM) could be achieved using hydrothermal treatment of WB with benign alkaline catalysis (sodium carbonate) and a CSF of 7.54 [27].
Therefore, it could be argued that the alkaline DES used in this study was a highly efficient and green means of recovering WB polyphenols, as it provided a significantly higher YTP at the lowest CSF.
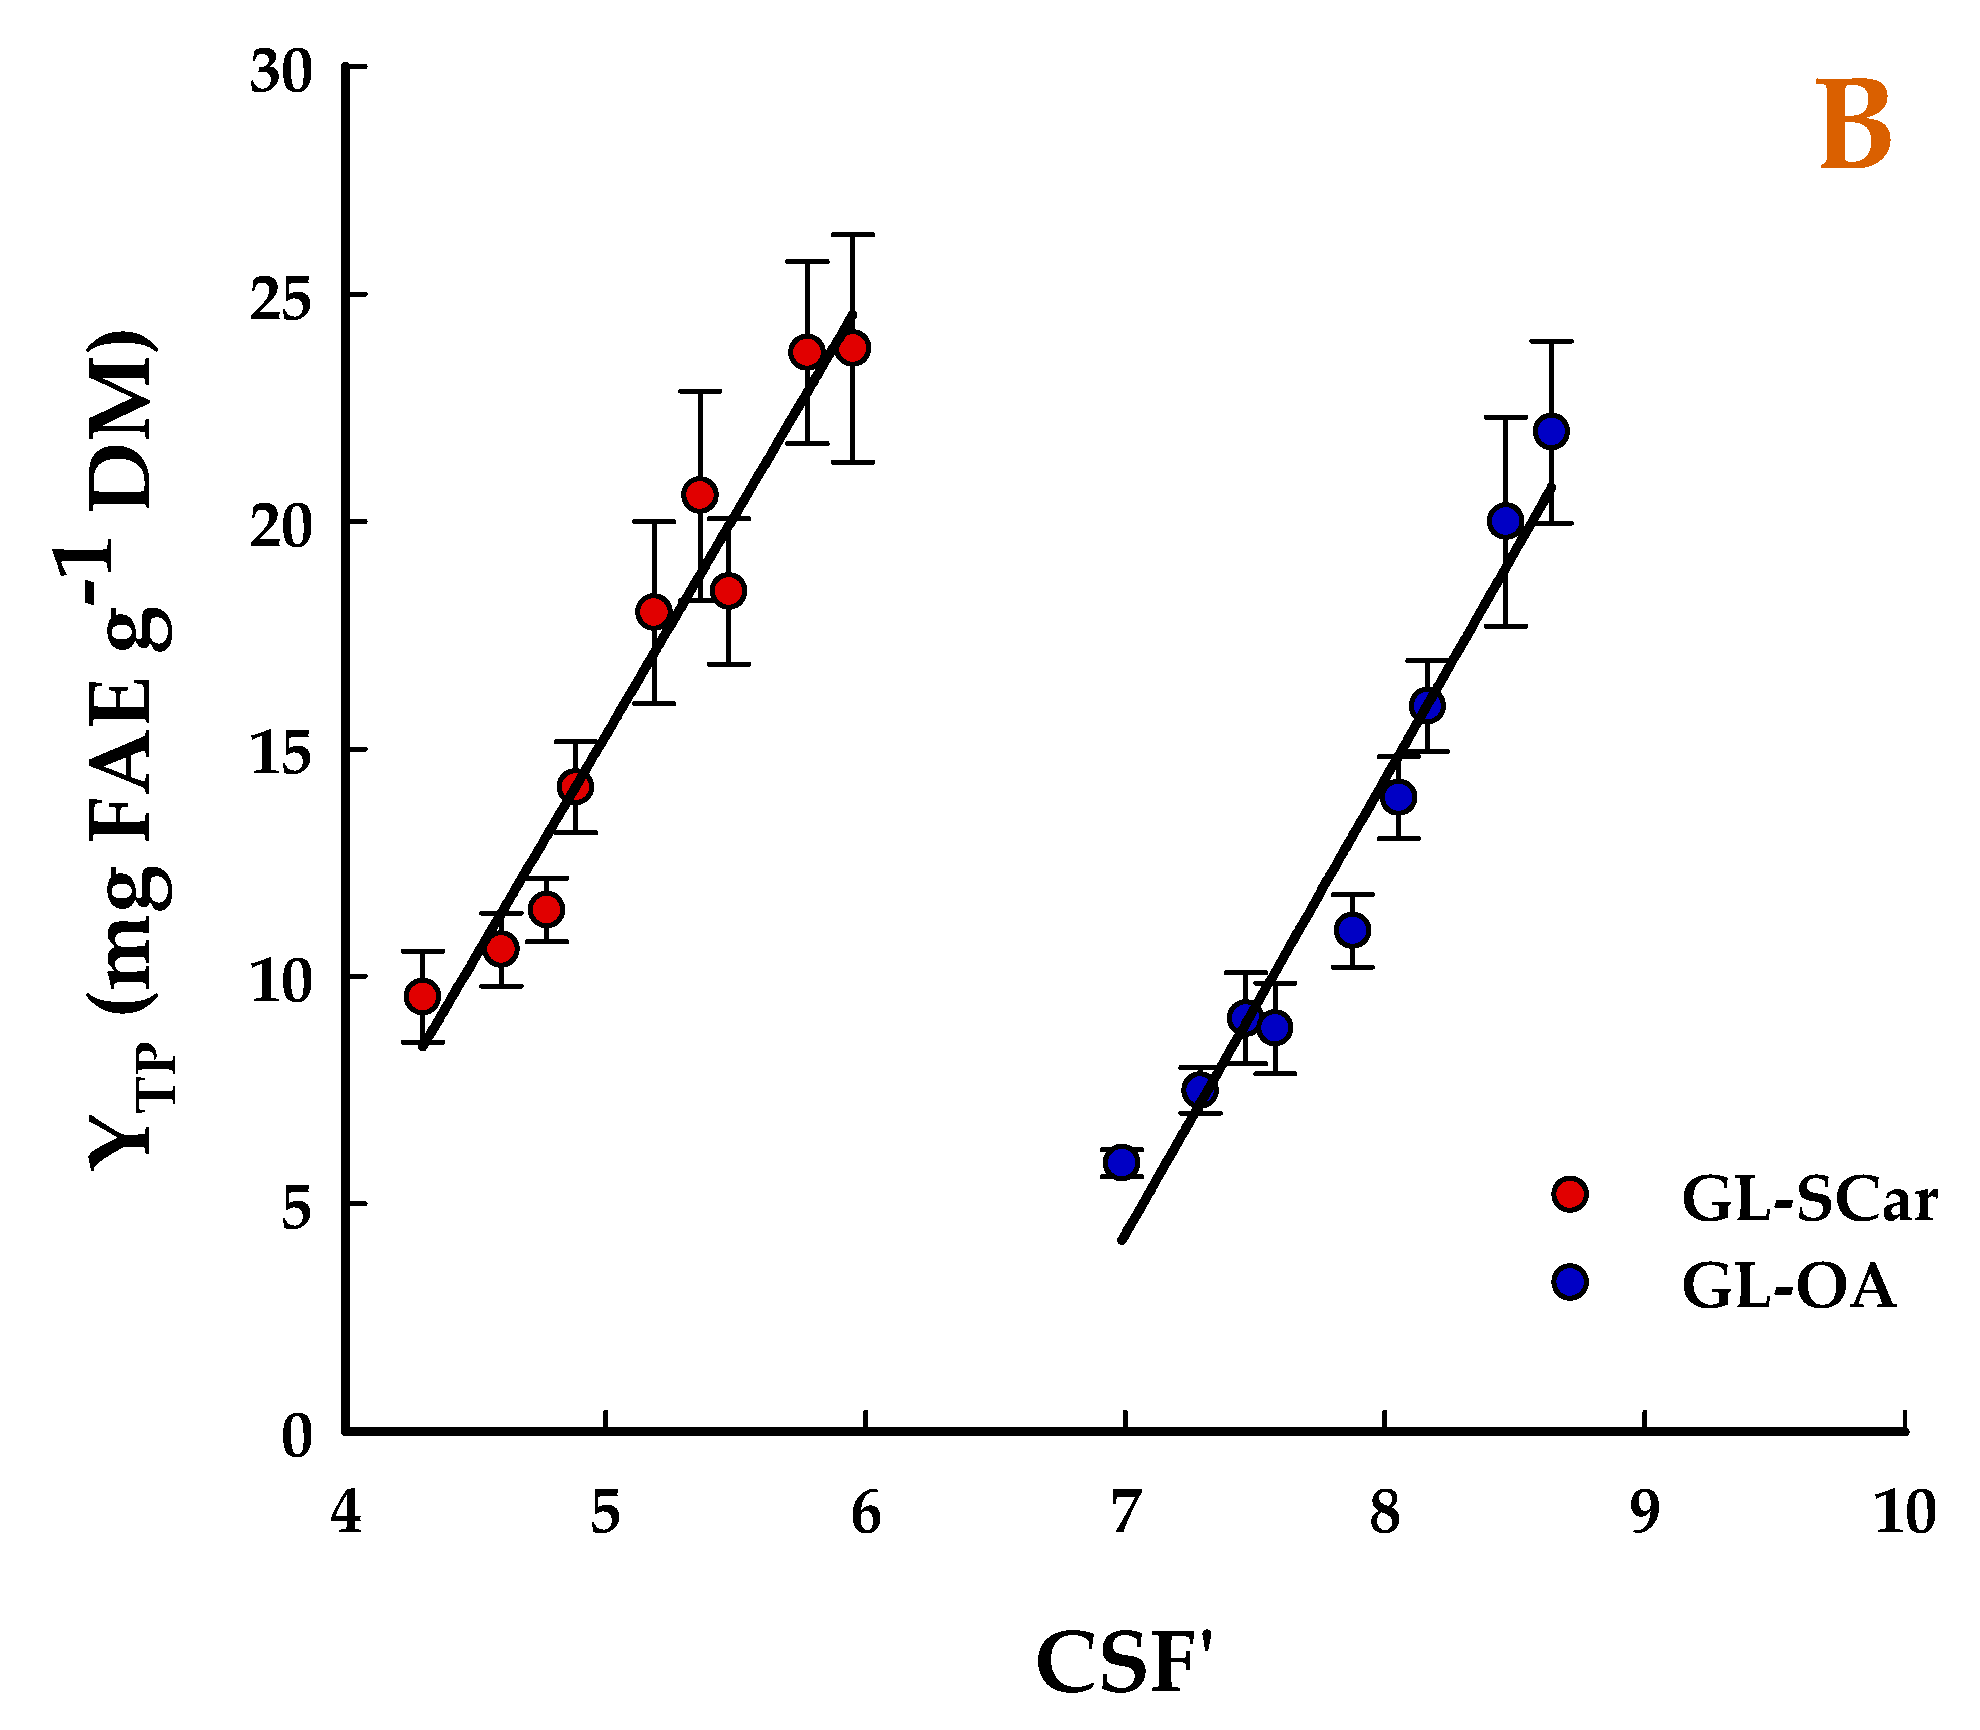
To examine whether CSF could be related to YTP, as previously reported [27,28,29,30], linear regressions were attempted. Figure 1 shows that for both acid and alkaline DES organosolv treatments, the values of YTP obtained were in a linear correlation with both CSF and CSF.
In the case of correlation with CSF, the linear models derived were as follows:
YTP(GL-OA) = 10.01CSF + 4.34 (R2 = 0.95, p < 0.0001)
YTP(GL-SCar) = 9.74CSF + 112.46 (R2 = 0.95, p < 0.0001)
The correlation of CSF with YTP was described by the functions given below:
YTP(GL-OA) = 10.01CSF − 65.72 (R2 = 0.95, p < 0.0001)
YTP(GL-SCar) = 9.74CSF − 33.38 (R2 = 0.95, p < 0.0001)
Considering that all linear models derived from the linear regressions were highly significant, it could be argued that, using the above empirical equations, credible predictions of YTP could be made based on any pair of t and T within the ranges employed. Moreover, it was also demonstrated that the total polyphenol yield was associated with treatment severity, in accordance with previous findings on total polyphenol recovery from WB with pressurized water/ethanol mixtures [31].

2.2. Treatment Optimization

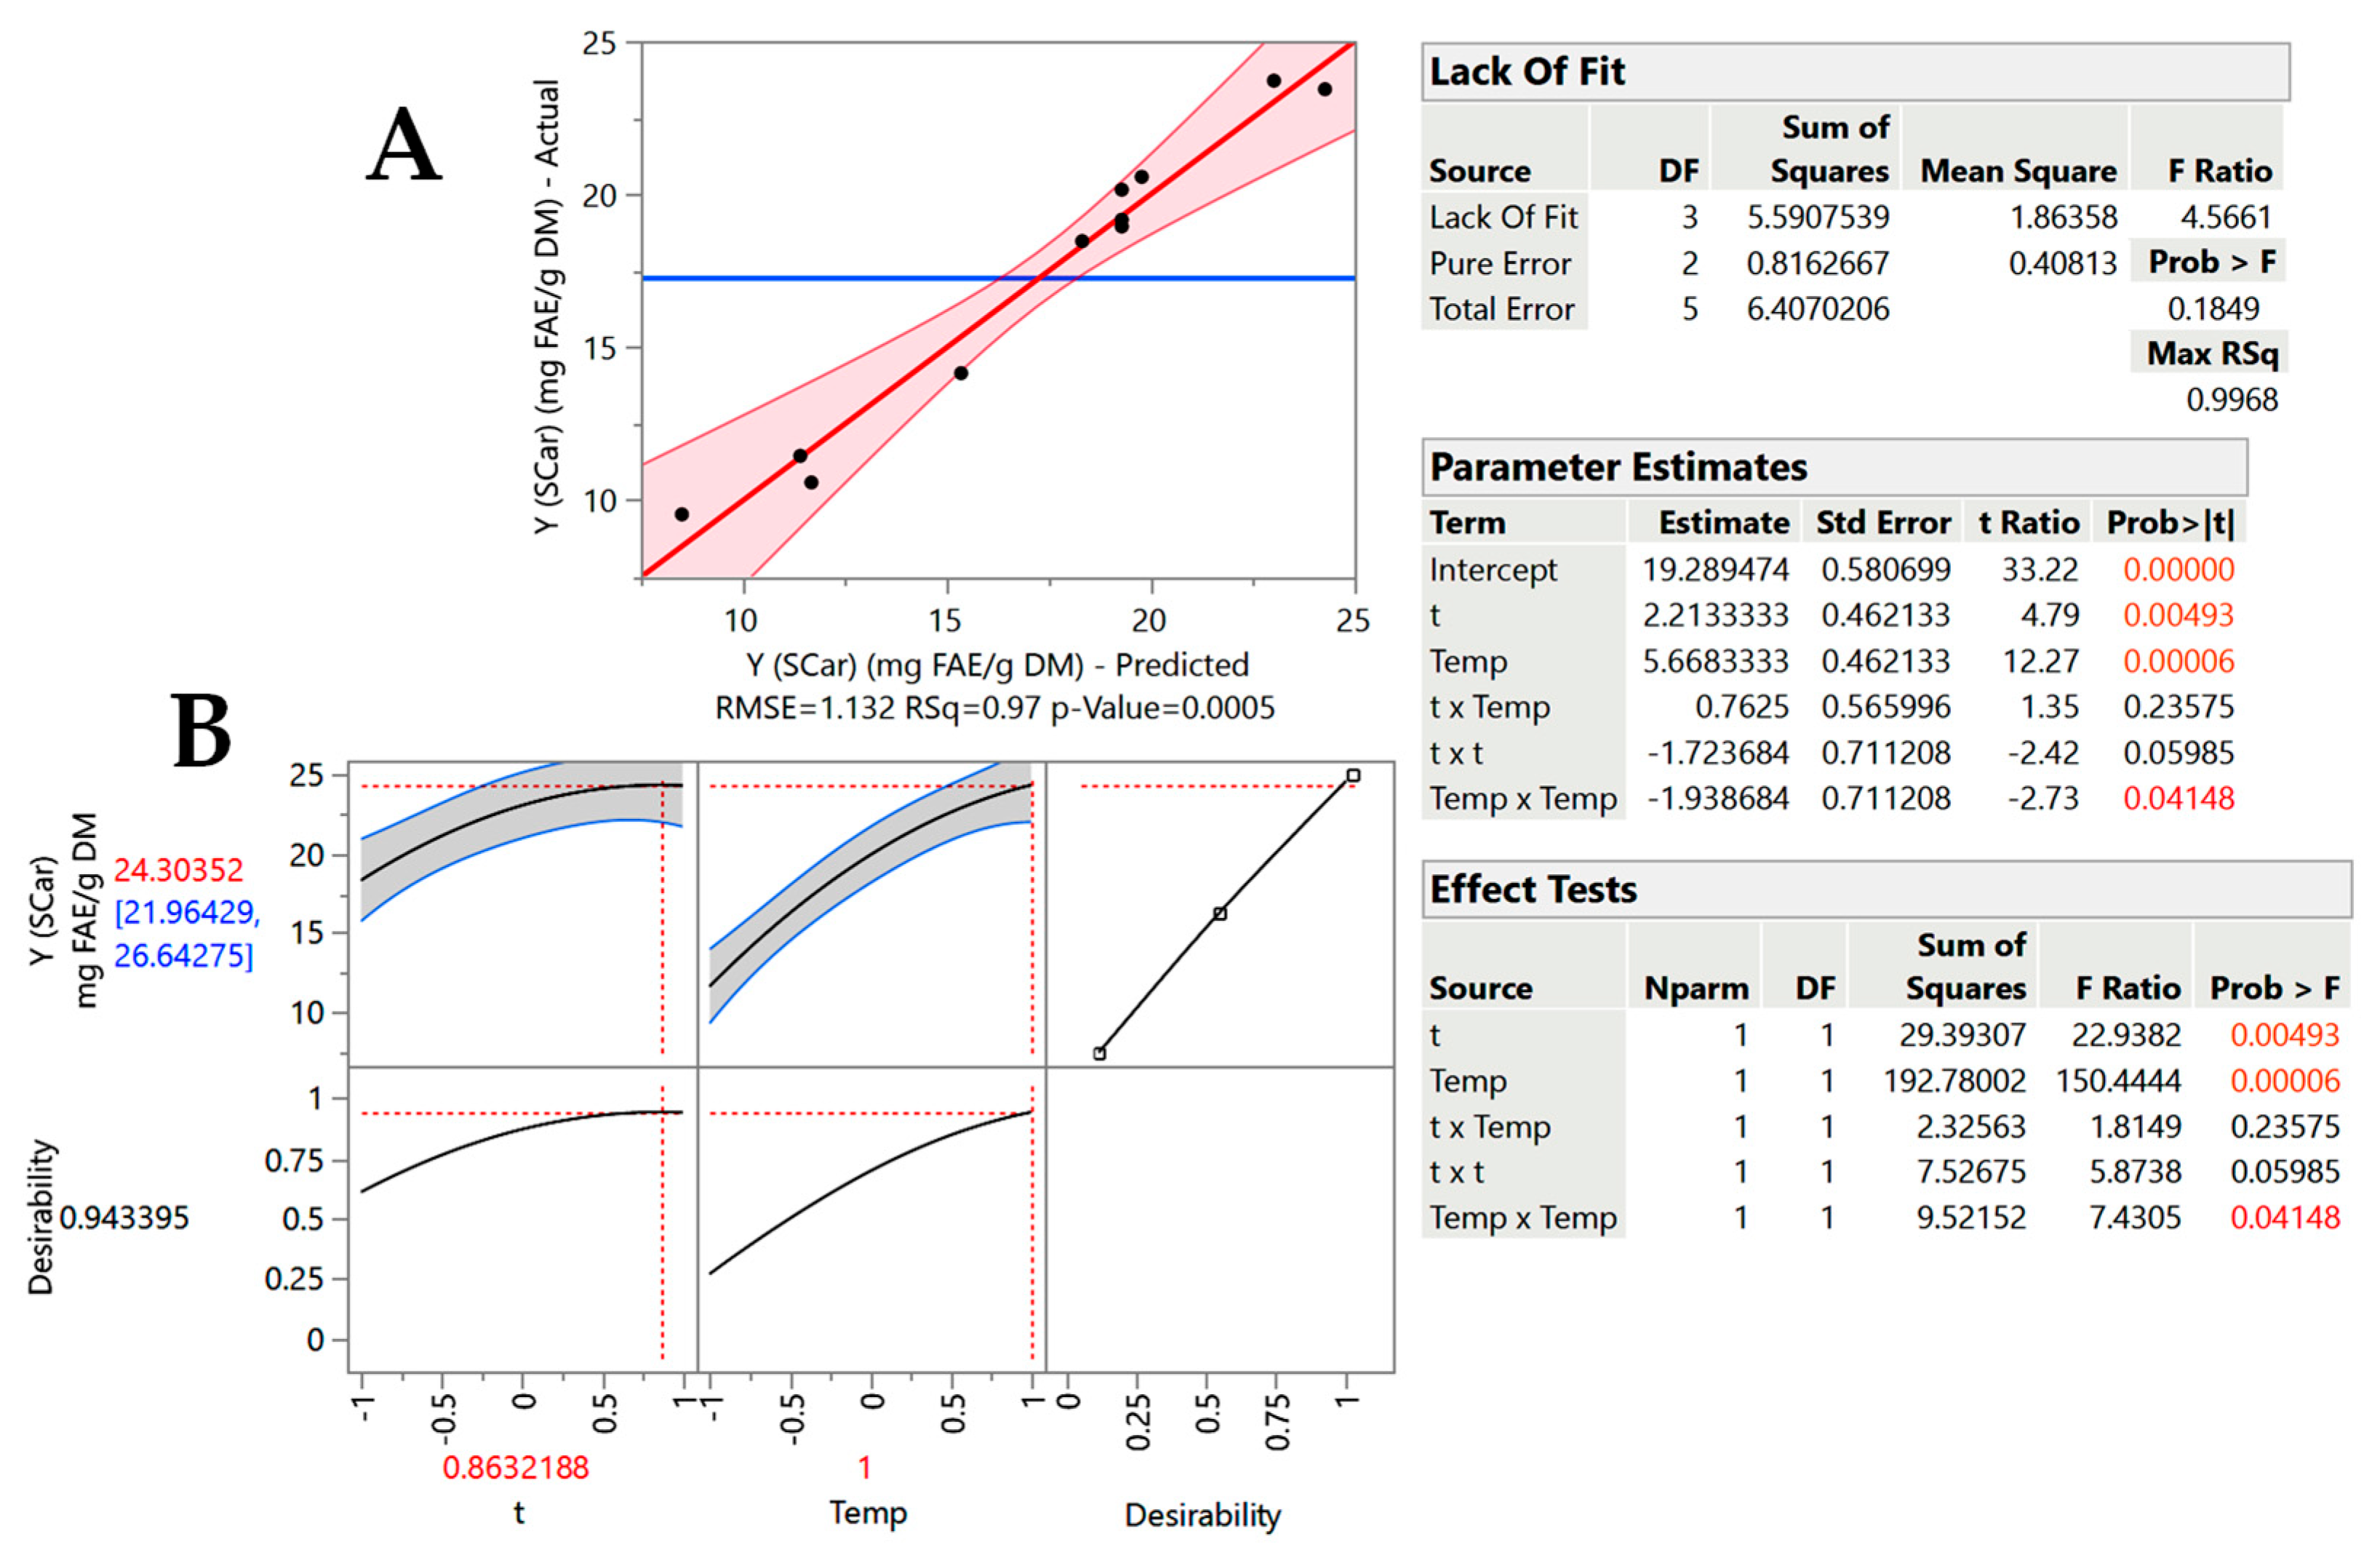
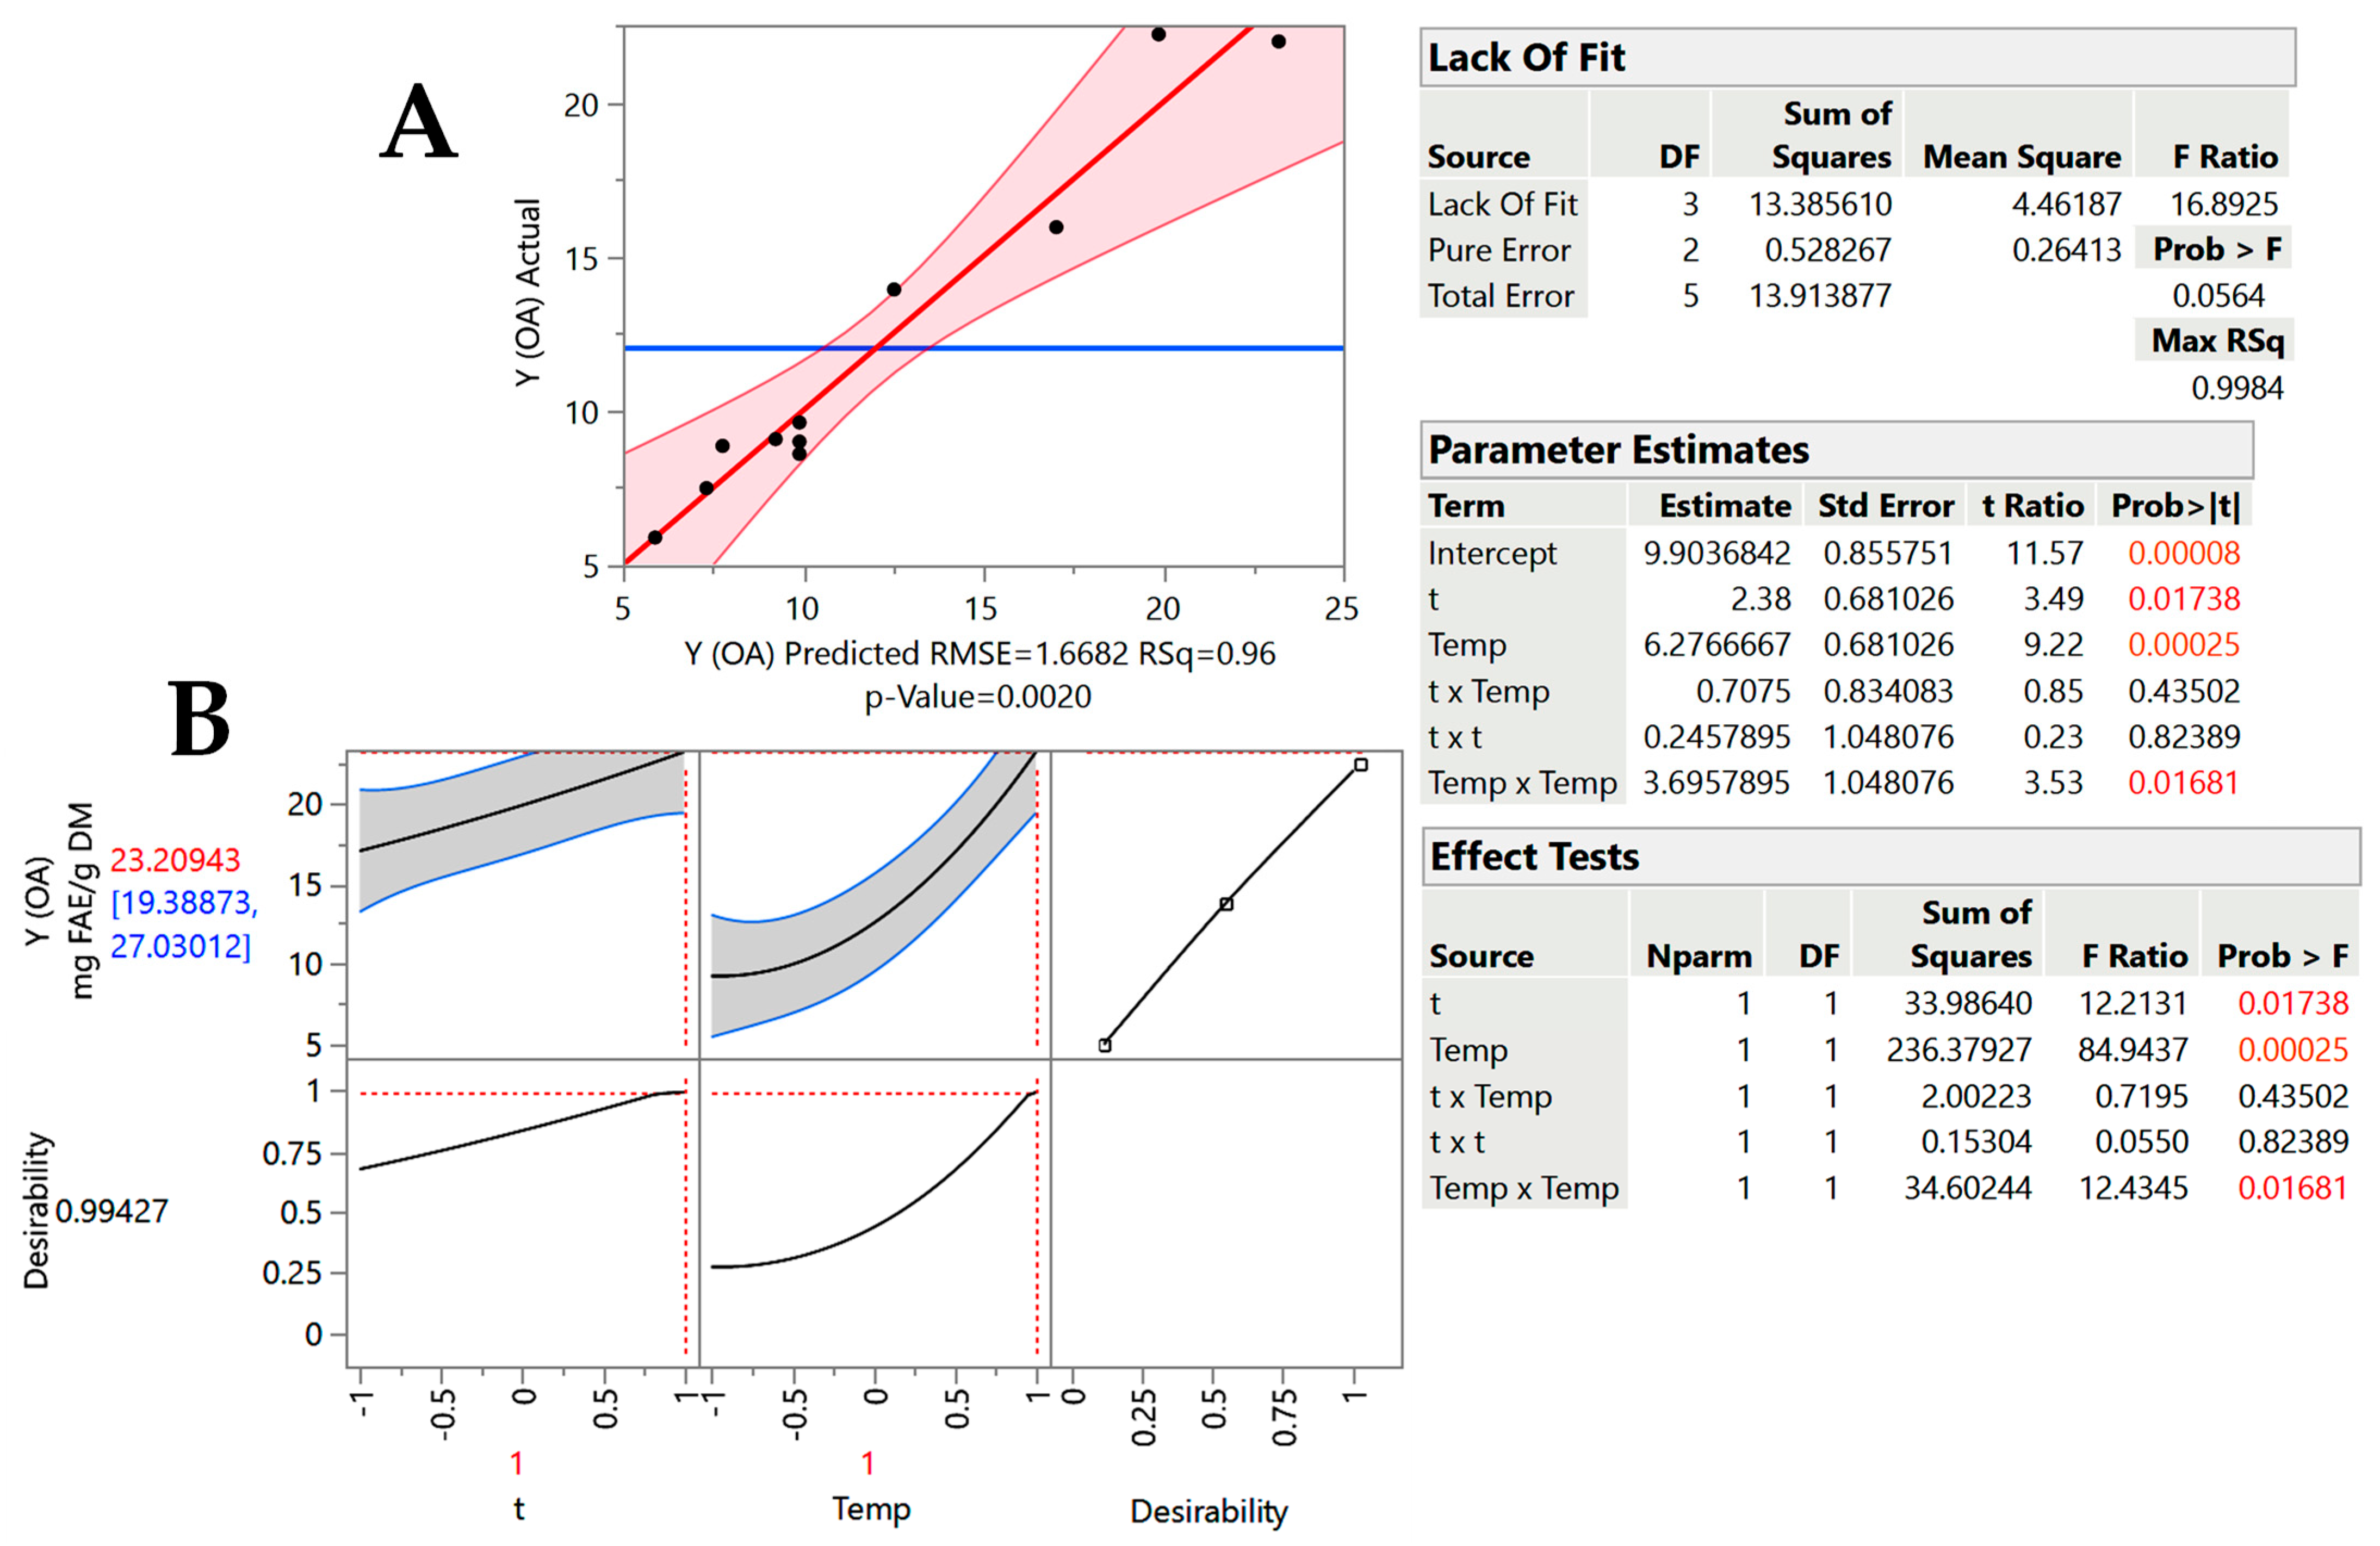
The information drawn from the severity-based modeling strongly suggested that both treatment variables, t and T, have key roles in polyphenol recovery from WB. However, unilateral approaches cannot reveal synergistic (cross) effects between these variables, and thus evaluation of their full effect on treatment performance could not be conclusive. Therefore, treatment modeling was also attempted by deploying a response surface methodology, considering t and T as the independent variables, and YTP as the response. The experimental design used aimed at assessing the effect of the independent variables and identifying possible quadratic effects and/or cross functions between them. Statistical assays including lack-of-fit, and analysis of variance (ANOVA) tests (Figure 2 and Figure 3) formed the basis to evaluate models and response surface optimization, taking into account the predicted and measured values’ closeness (Table 2).
After omitting non-significant terms from the models (mathematical equations) based on the significance shown in the inset tables titled “Parameter Estimates” (Figure 2 and Figure 3), the expressions derived were as follows:
YTP(GL-SCar) = 19.29 + 2.21X1 + 5.67X2 − 1.94X22
YTP(GL-OA) = 9.90 + 2.38X1 + 6.28X2 + 3.70X22
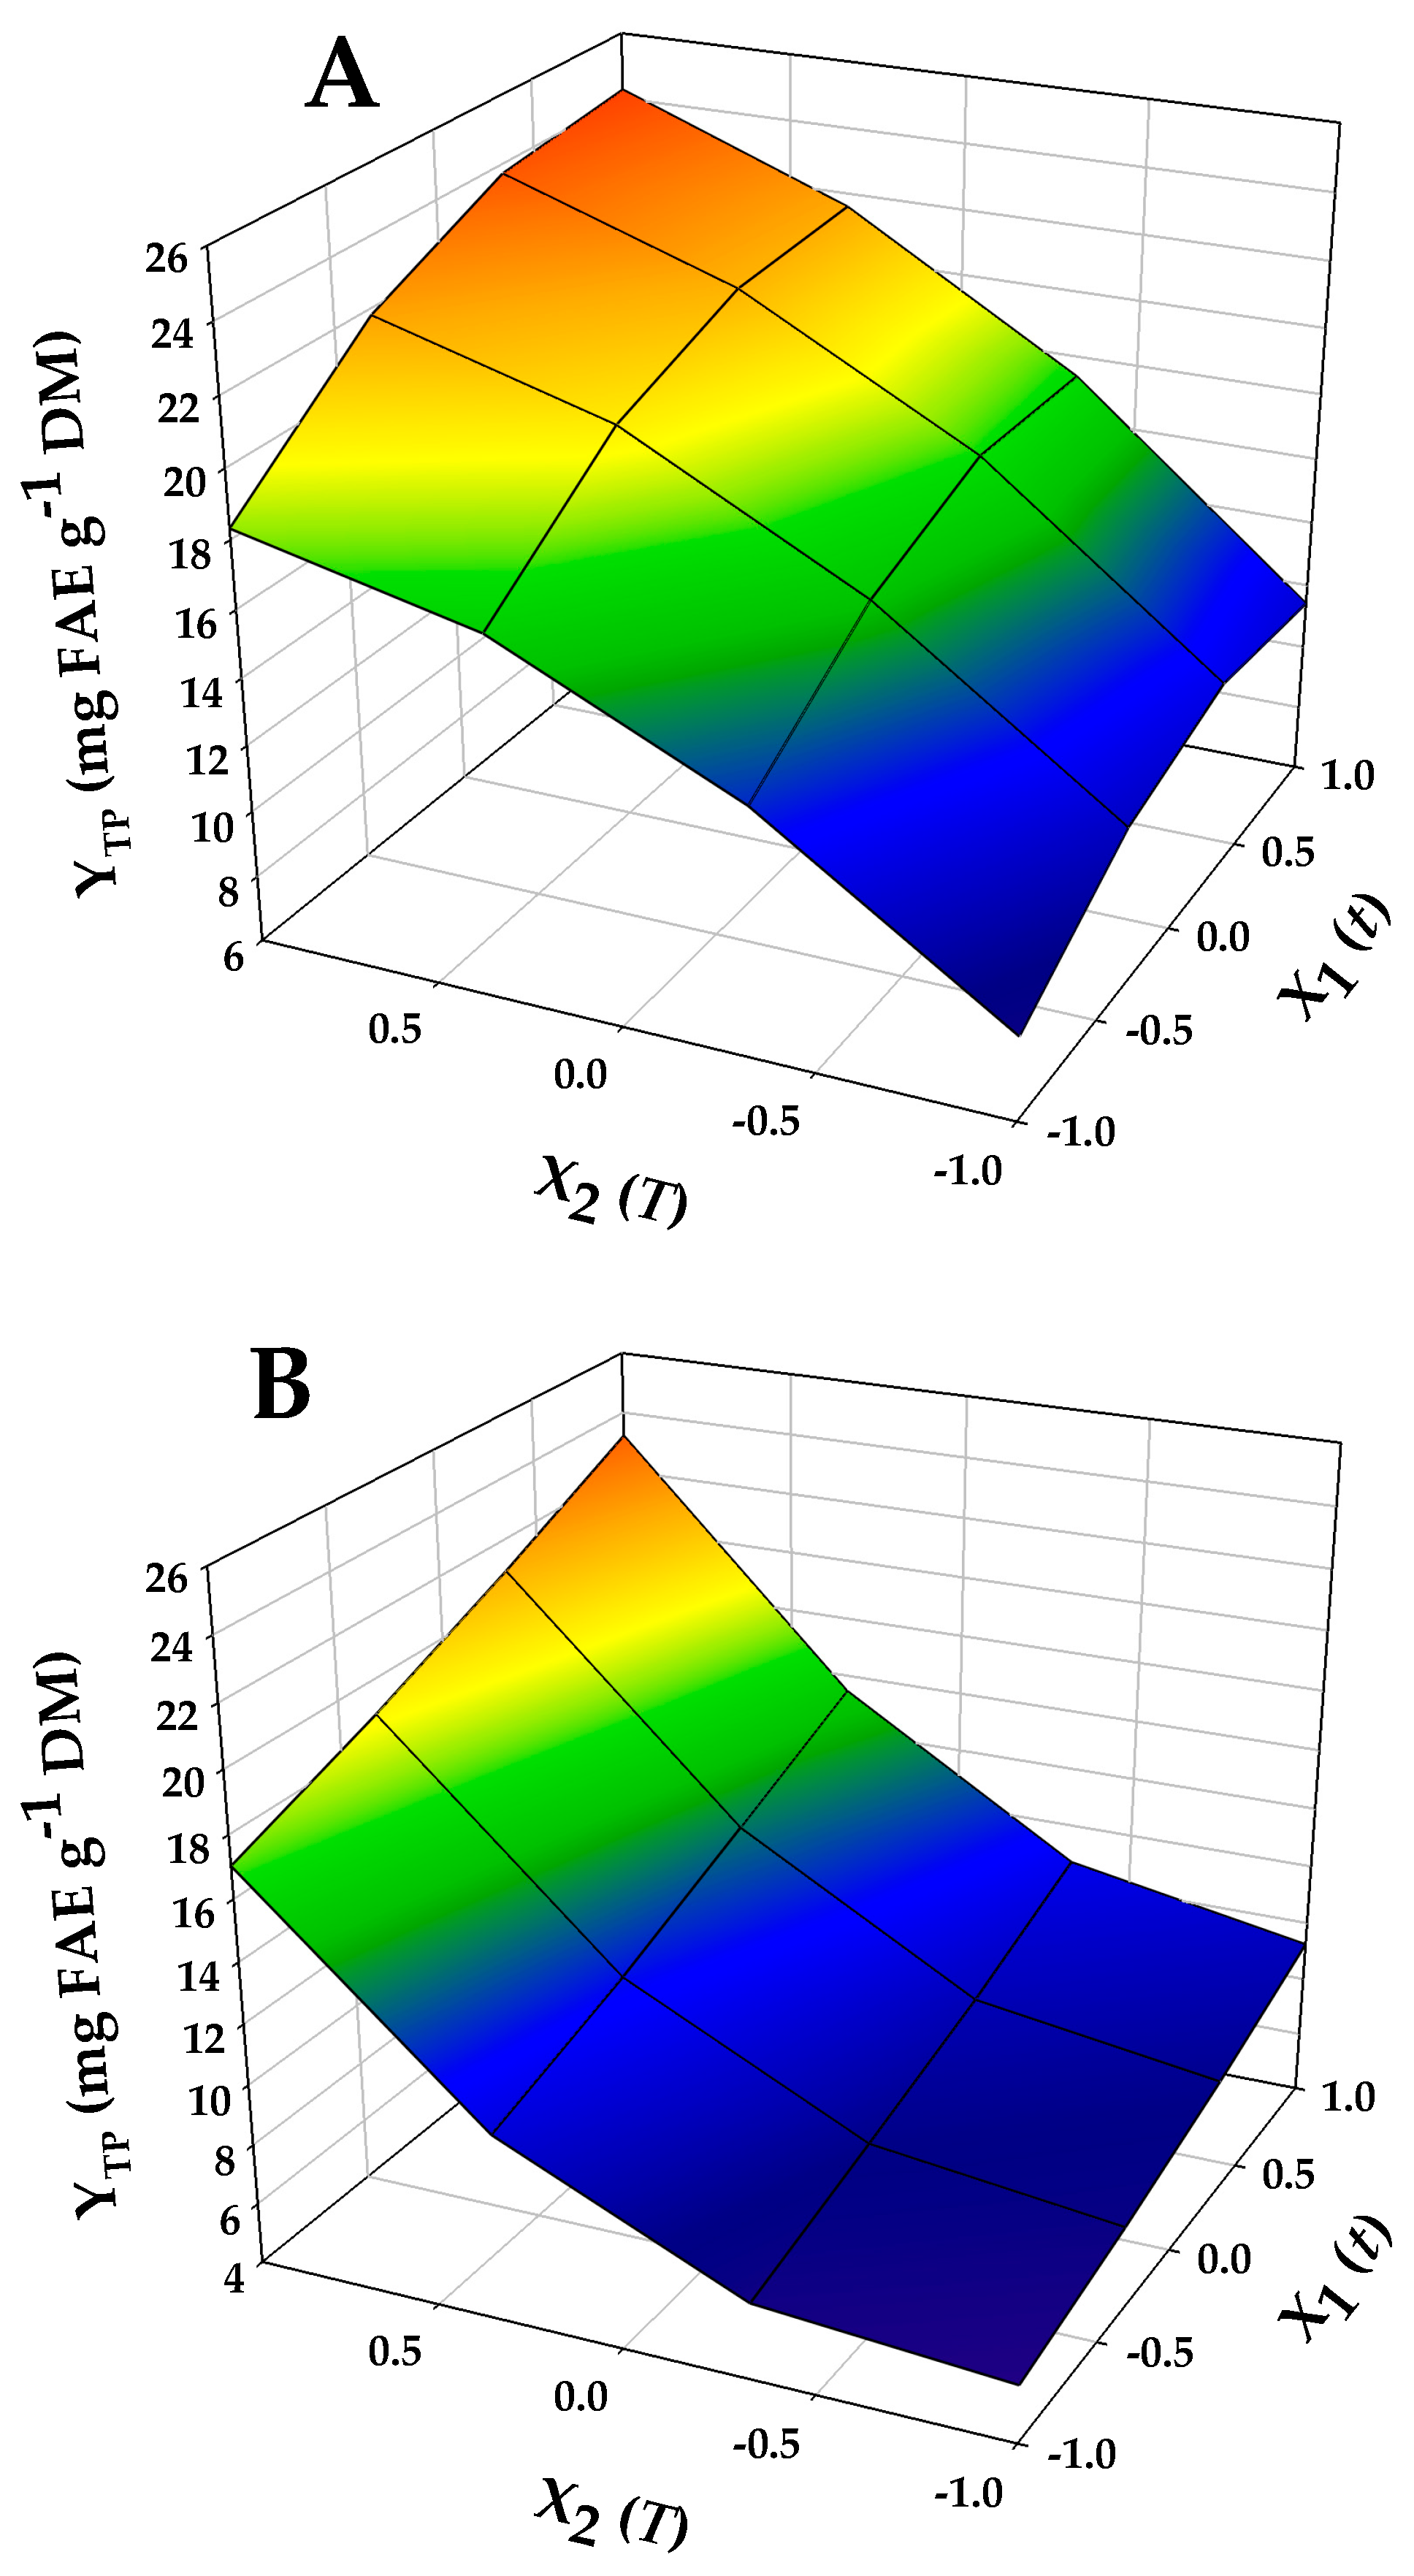
It can be seen in Figure 2A and Figure 3A that both models had an R2 equal to or higher than 0.96, and, based on a confidence interval of at least 95%, the lack-of-fit p-values were highly significant. Thus, both models showed very good adjustment to the actual (experimental) values. Using the models, 3D diagrams were constructed to visually illustrate the effect of treatment variables on YTP, and present an at-a-glance comparison between the two DESs (Figure 4).
For the treatment carried out with the GL-SCar DES, both t (X1) and T (X2) were highly significant (p < 0.005), as was the quadratic term X22 (Figure 2, inset table “Parameter Estimates”). By contrast, cross effects between variables were non-significant. Similarly, both X1 and X2 had a significant effect on YTP when the treatment was carried out with the GL-OA DES, and in this case too no significant cross terms were seen, as opposed to a quadratic effect (X22). The positive effect of the terms t (X1) and T (X2) in both treatments indicated that increases in either variable would entail higher YTP, but the negative quadratic term in equation (5) showed that, beyond a given limit, increases in T (X2) negatively impacted YTP. Such an effect has been previously observed in sodium hydroxide-catalyzed organosolv treatment of WB [28] and might indicate polyphenol instability under alkaline conditions. However, in similar studies on oat bran [30] and cotton stalks [32], no such effect was observed. Based on this evidence, it could be argued that the influence of the alkalinity of the means used for the treatment might be associated with the polyphenolic composition of the plant matrix.
The desirability function (Figure 2B and Figure 3B) enabled the estimation of the optimal settings for both independent variables, under which the maximum predicted response could be achieved. In the case of treatment with GL-SCar DES, the optimum conditions were t = 172 min and T = 90 °C, giving a maximum YTP of 24.30 ± 2.34 mg FAE g−1 DM (Figure 2B). The corresponding optimum t and T values for the treatment with the GL-OA DES were 180 min and 90 °C, providing a maximum YTP of 23.21 ± 3.82 mg FAE g−1 DM (Figure 3B). This finding revealed that both treatments under almost equal severity could provide virtually the same YTP.
The level of 23–24 mg FAE g−1 DM attained in this study is higher than the 19.8 mg FAE g−1 DM obtained with sodium hydroxide-catalyzed ethanol organosolv treatment of WB [28] and at a comparable level to the 23 mg FAE g−1 DM obtained with sodium carbonate-catalyzed hydrothermal treatment [27]. These findings were sound evidence for the role of the acidity and alkalinity of the solvents used for the treatments. Both DESs employed did not act merely as solvents, since simple solvent extraction for polyphenol recovery from WB may give yields that do not usually exceed 5 mg g−1 DM [27,28,33,34]. Although techniques such as steam explosion have been reported to give a yield as high as almost 28 mg GAE g−1 DM [35], only acid or alkaline catalysis may enable the release of bound phenolics from WB [17]. Therefore, it was evident that, by virtue of the acidic and alkaline pH, both DESs used promoted hydrolysis of bound phenolics and contributed to obtaining a high YTP.
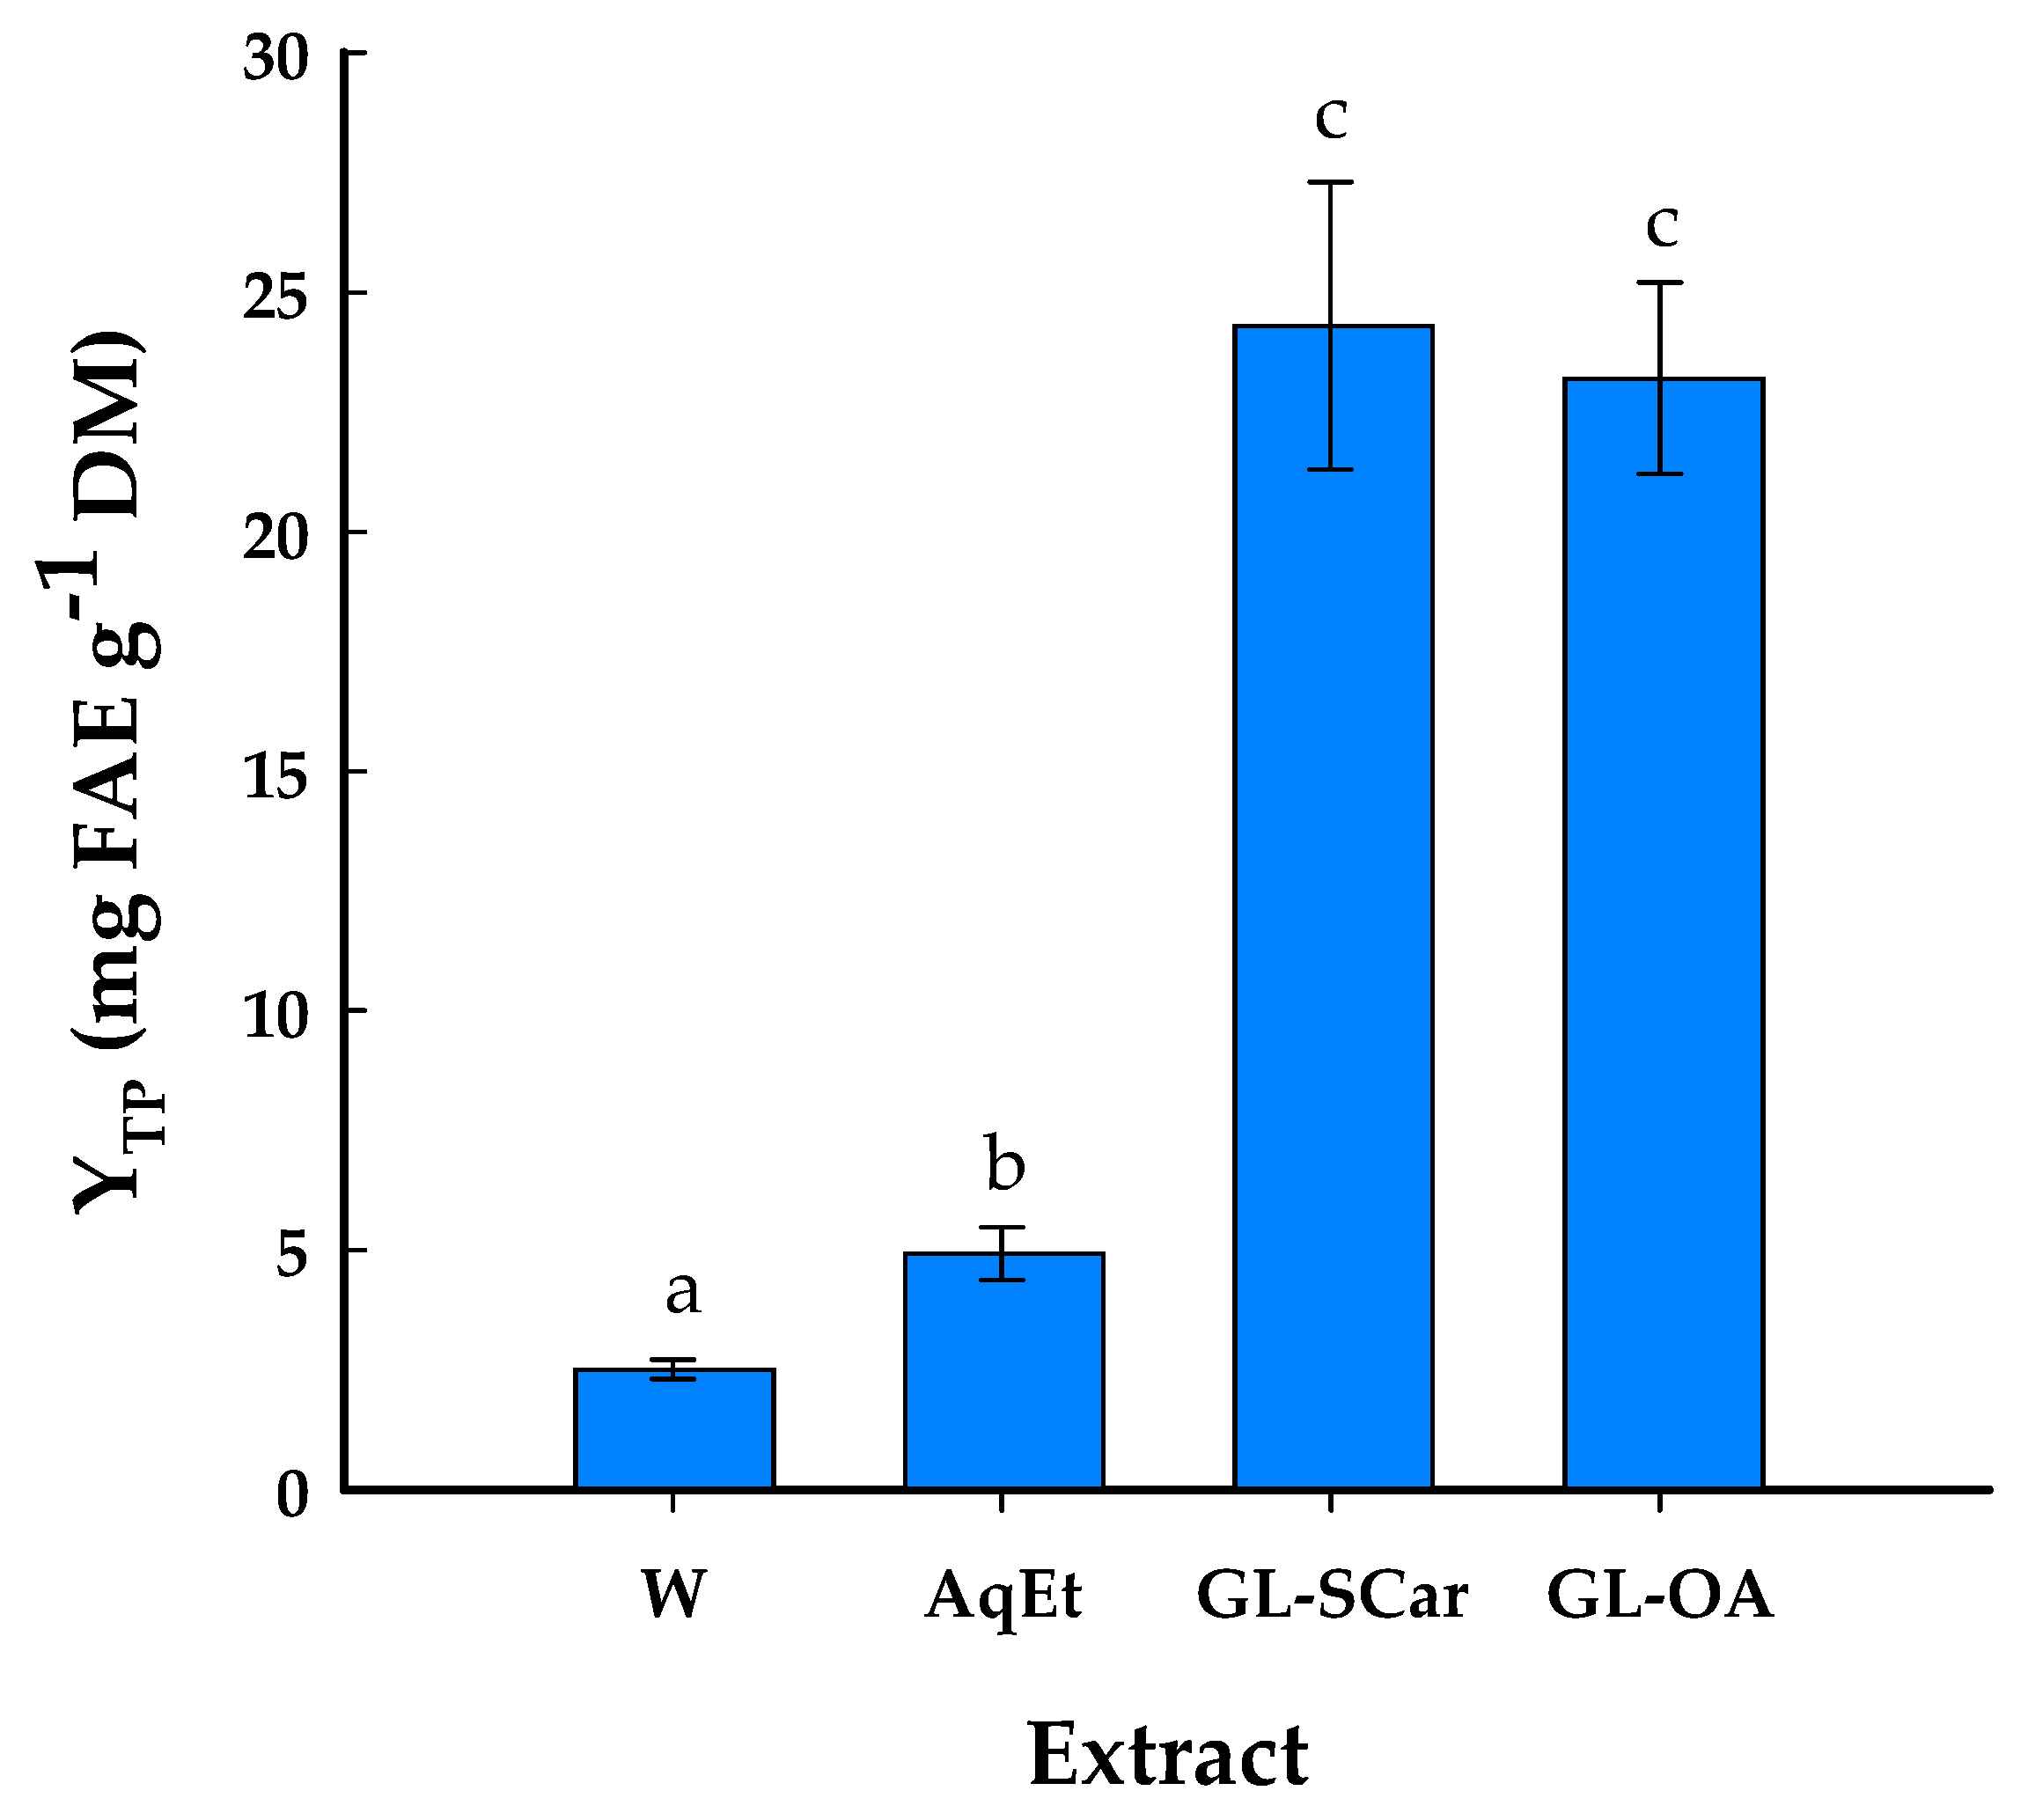
To confirm this assumption, control extractions with neat water but also aqueous ethanol were also performed, and the results are depicted in Figure 5. It can be seen that treatments with water or aqueous ethanol failed to provide YTP higher than 6 mg FAE g−1 DM, while treatment with either DES resulted in almost 4.9 times higher performance. This outcome showcased in the best way the pivotal role of DES composition and pH in boosting polyphenol recovery from WB.

2.3. Polyphenolic Profile and Antioxidant Effects

The extracts obtained from both treatments with GL-SCar and GL-OA DESs were analyzed with HPLC to depict their polyphenolic profile and identify differences that might have been brought about due to the difference in DES character (acid/alkaline). Moreover, the analyses also aimed at revealing the role of DESs in defining the polyphenolic profile, through comparison with the composition of control extracts, produced with 60% aqueous ethanol and water.
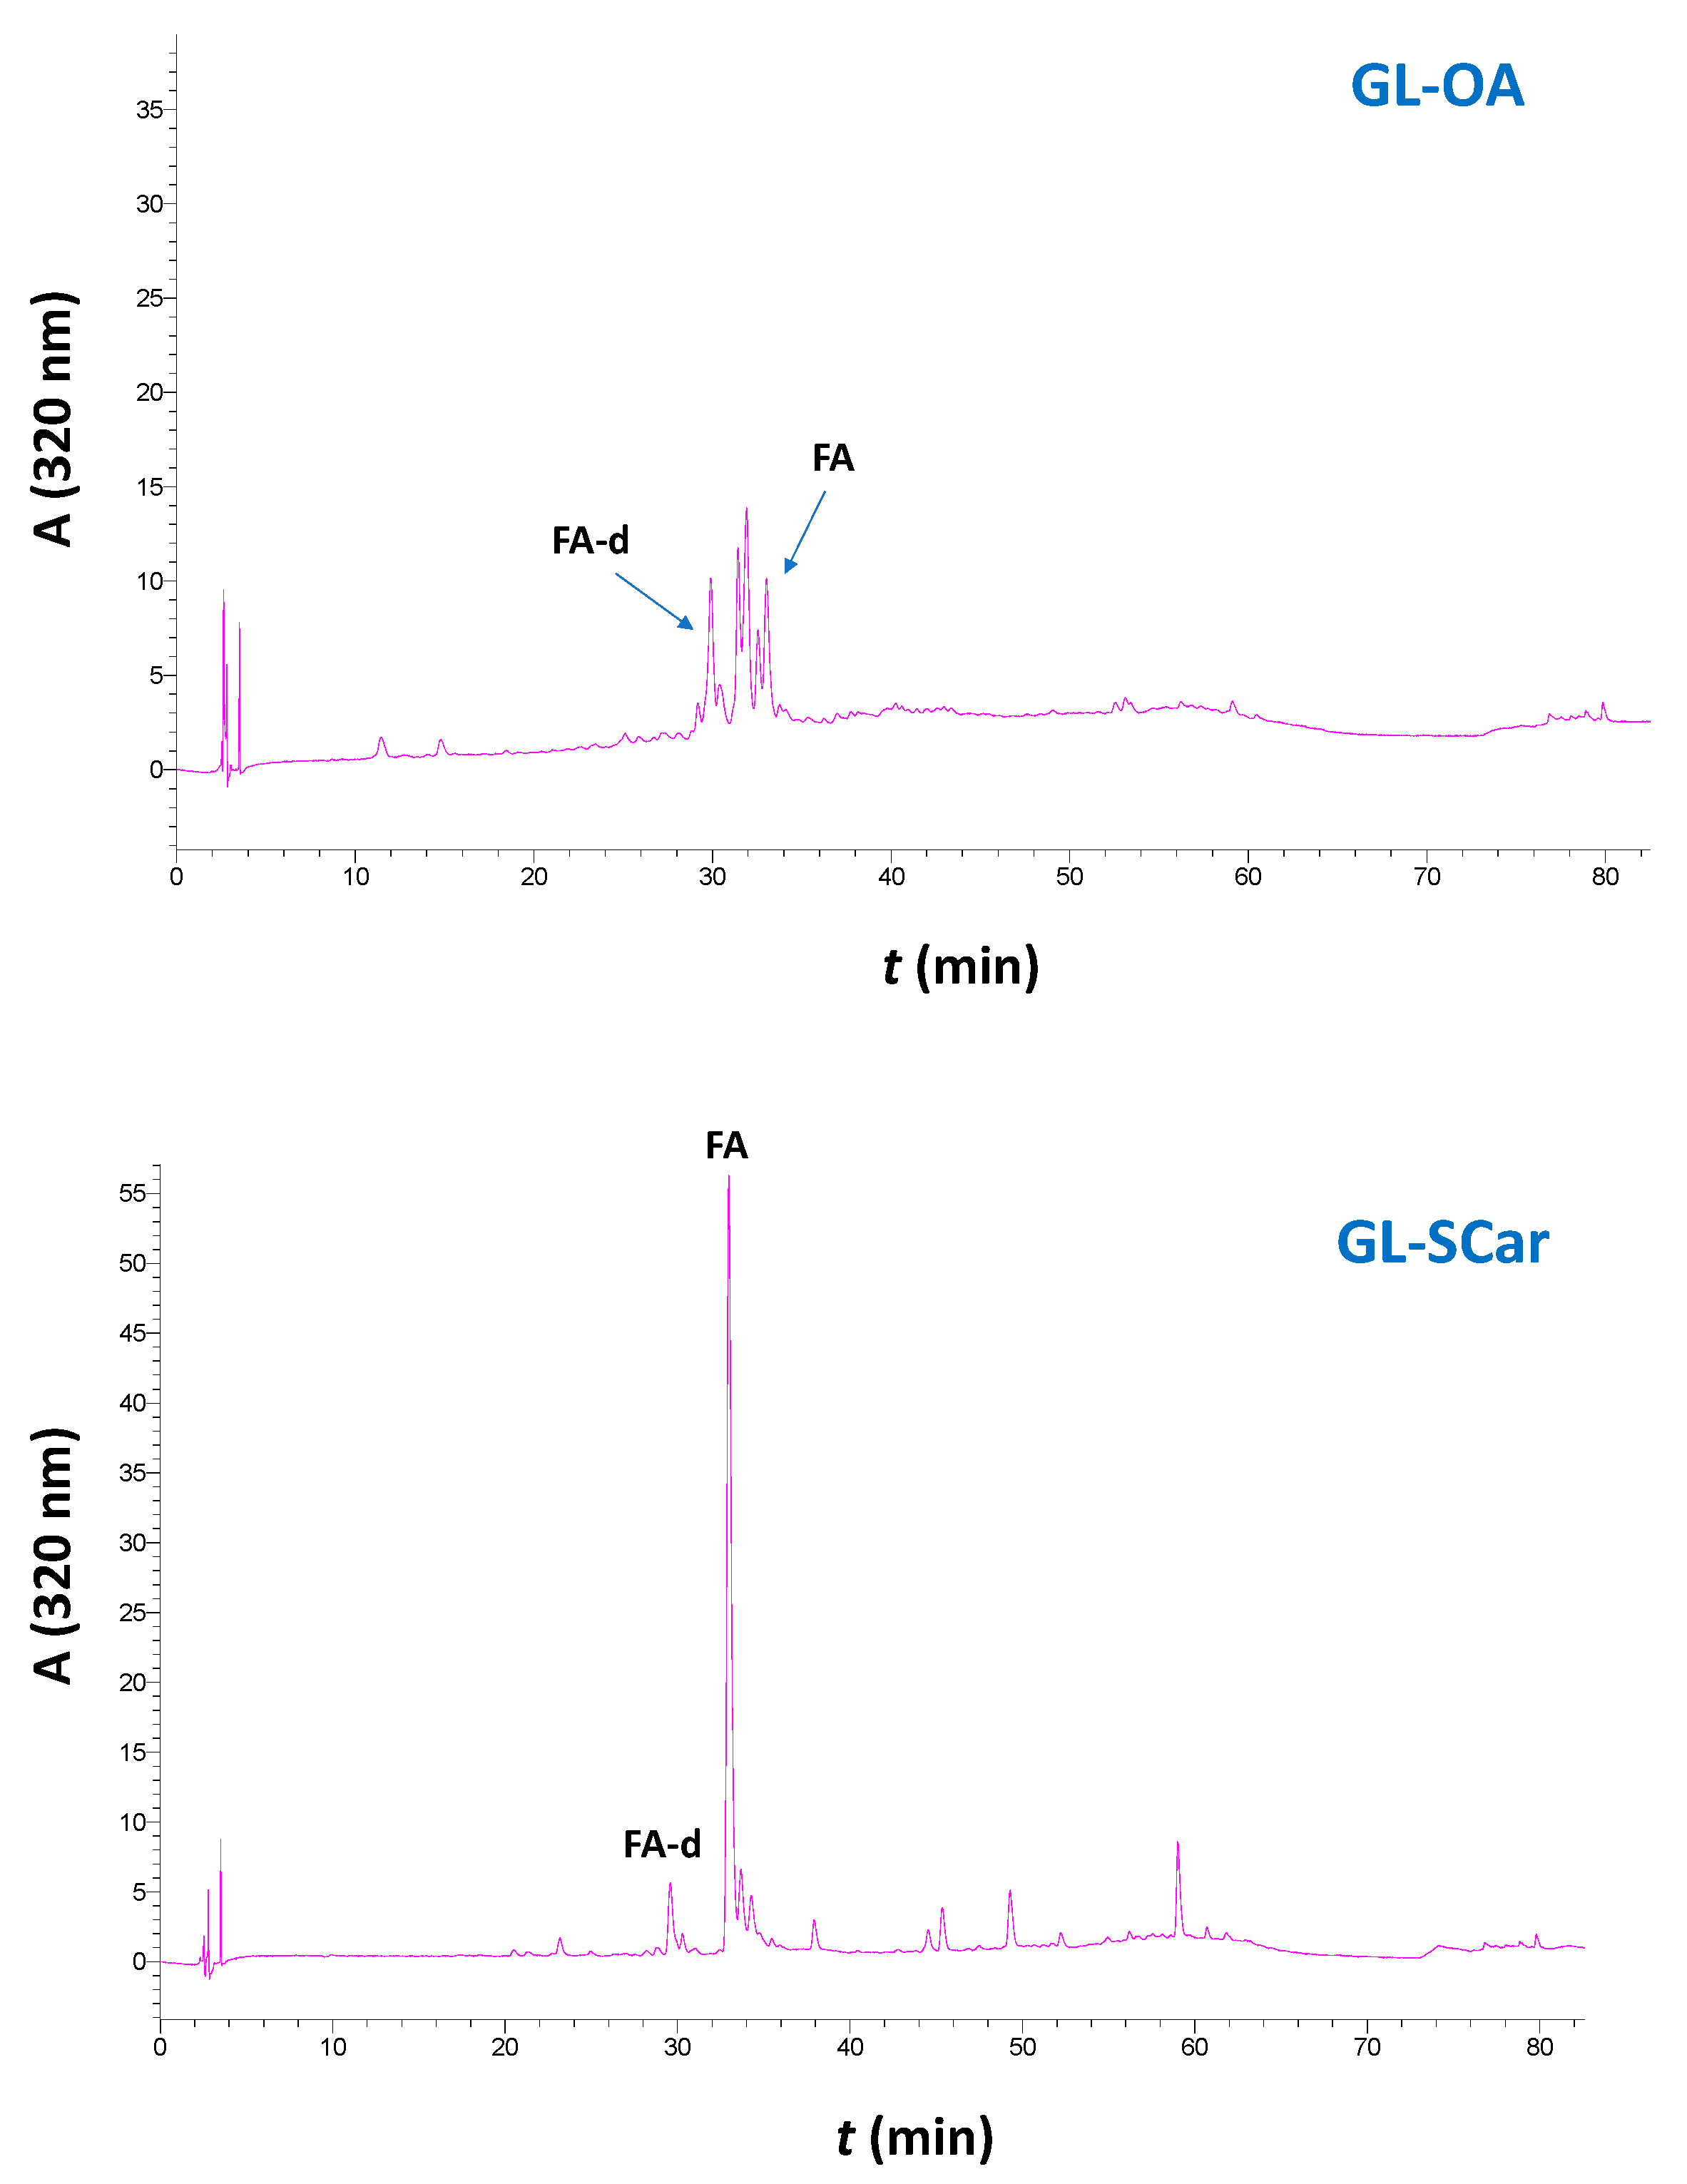
In Figure 6 it is illustrated that the GL-OA treatment yielded an extract characterized by the presence of ferulic acid (termed as FA), but also a ferulic acid derivative (termed FA-d), which has been previously tentatively identified as a ferulic acid ester with pentose [27]. By contrast, the extract obtained with the GL-SCar treatment was by far dominated by FA and a smaller amount of FA-d. Quantitative determination of these two substances in all extracts tested showed that treatment with neat water and 60% ethanol contained levels of both compounds that did not exceed in total 62 μg g−1 DM (Table 3), which were significantly lower than those found in the extracts produced with either DES treatment (p < 0.05). Furthermore, treatment with the acidic DES (GL-OA) gave extracts that were enriched in FA-d (p < 0.05). However, treatment with the alkaline DES (GL-SCar) was proven far more effective, as it provided a yield of FA that was more than nine times higher compared to the one with the GL-OA treatment. In total, the GL-SCar treatment yielded 1042.00 μg of FA and FA-d g−1 DM, whereas treatment with GL-OA had a total yield just under 227 μg of FA and FA-d g−1 DM. This finding underlined the high performance of GL-SCar in producing extracts enriched in FA. Nevertheless, it should be noted that the total yield achieved with the GL-SCar treatment was almost 2.3 times lower than that obtained by carrying out the reference hydrolysis, indicating that treatment of WB with GL-SCar, under the conditions employed, liberated only a fraction of bound FA.
It should also be emphasized that the treatment with GL-OA was more efficacious in releasing both FA-d and FA compared to a previously reported sulfuric acid-catalyzed ethanol organosolv WB treatment [28], yet it was far less so compared to citric acid-catalyzed hydrothermal WB treatment [27]. Moreover, in this study, but also in the aforementioned earlier examinations, it was demonstrated that WB treatment under alkaline conditions may offer significantly higher performance in releasing FA.
A critical comparison with bibliographic data would indicate that the amount of FA obtained after GL-SCar treatment (943.18 μg g−1 DM) was far higher than that achieved in several other studies, such as 51.93 [36], 226.8 [31], 231.00 [37], and 406.14 μg g−1 DM [38]. However, other authors have reported levels of 1660.60 μg g−1 DM [39], 1918 and 2193 [40,41], 2391.56 [35], 3084.20 [42], and 3910 μg g−1 DM [43]. The differences seen could be attributed to the different characteristics and FA content of the feedstock used, but also to the conditions used, the type and concentration of catalyst, and the type of solvent. Considering that in this study treatment was carried out with DESs that usually possess very high viscosity, this could have hindered increased FA recovery due to decreased extraction kinetics and reduced mass transfer coefficient [44,45]. This might be a significant disadvantage of using glycerol-based DESs [46], and merits further investigation.
In WB, FA is linked onto arabinoxylan chains of the cell wall via ester bonds [14,47]. These bonds may be efficiently cleaved under alkaline conditions, and FA can be released. Furthermore, hydroxycinnamates such as FA are known to function as cross-linking compounds between polysaccharides and lignins, with ester bonds being labile to alkali-catalyzed hydrolysis [48]. Additionally, FA may also be bound on lignin networks through ester bonds. In this case, increased lignin solubilization could further enhance the release of FA [49], and the role of GL-based DESs could be critical in this regard, assisting lignin solubilization [50,51].
Ester-linked FA could be liberated even under mild alkaline conditions, such as that imparted by the use of GL-SCar, and rate acceleration could be achieved by suitably regulating temperature [49]. On the other hand, treatment for more than 40 min at 140 °C was reported to be inappropriate, probably provoking FA degradation [52]. Nevertheless, using a very short residence time (3.5 min), pressurized hot water treatment was shown to give a maximum FA yield at 200 °C [53]. By contrast, pressurized water/ethanol treatments at 160 °C required 74 min to liberate the maximum FA amount [31]. Thus, knowing that in thermal treatments temperature and time are interdependent variables, appropriate regulation of temperature and/or time to optimize settings would be imperative in maximizing FA recovery.
Acidic DESs, such as the GL-OA used in this study, are considered to have better delignification performance in biomass pretreatment, due to the proton-catalyzed cleavage of bonds, including glycosidic, ether, and carbohydrate/lignin bonds, the latter being a main mechanism in delignification [51]. FA may also be linked to the lignocellulosic matrix with ether bonds, which can be cleaved only under acidic conditions. Such a process would require temperatures much higher than 80 °C, and the conditions used in this study (90 °C) might not have facilitated similar reactions to a great extent. Fractions of hemicellulose may be solubilized under acidic conditions, but the ester-linked FA would remain unaffected.
Although some acidic DESs have been shown to better solubilize lignin compared to alkaline GL-potassium carbonate-based DESs [54], FA release has been closely correlated with alkali-solubilized lignin [49]. This could be another means of releasing FA using the GL-SCar treatment, since alkaline treatments may greatly assist lignin solubilization [55]. High lignin solubilization has also been observed in sodium carbonate-containing DES [56] and sodium hydroxide-containing DES [57]. Lignin depolymerization has been shown to be more advanced in an acidic DES compared to an alkaline one [58], but lignin degradation could also take place in alkaline DES through partial β-O-4 linkage breakdown and demethoxylation of lignin units, which might favor higher lignin solubilization [59,60]. This in turn might further contribute to obtaining a more extended FA release.

2.4. Antioxidant Effects

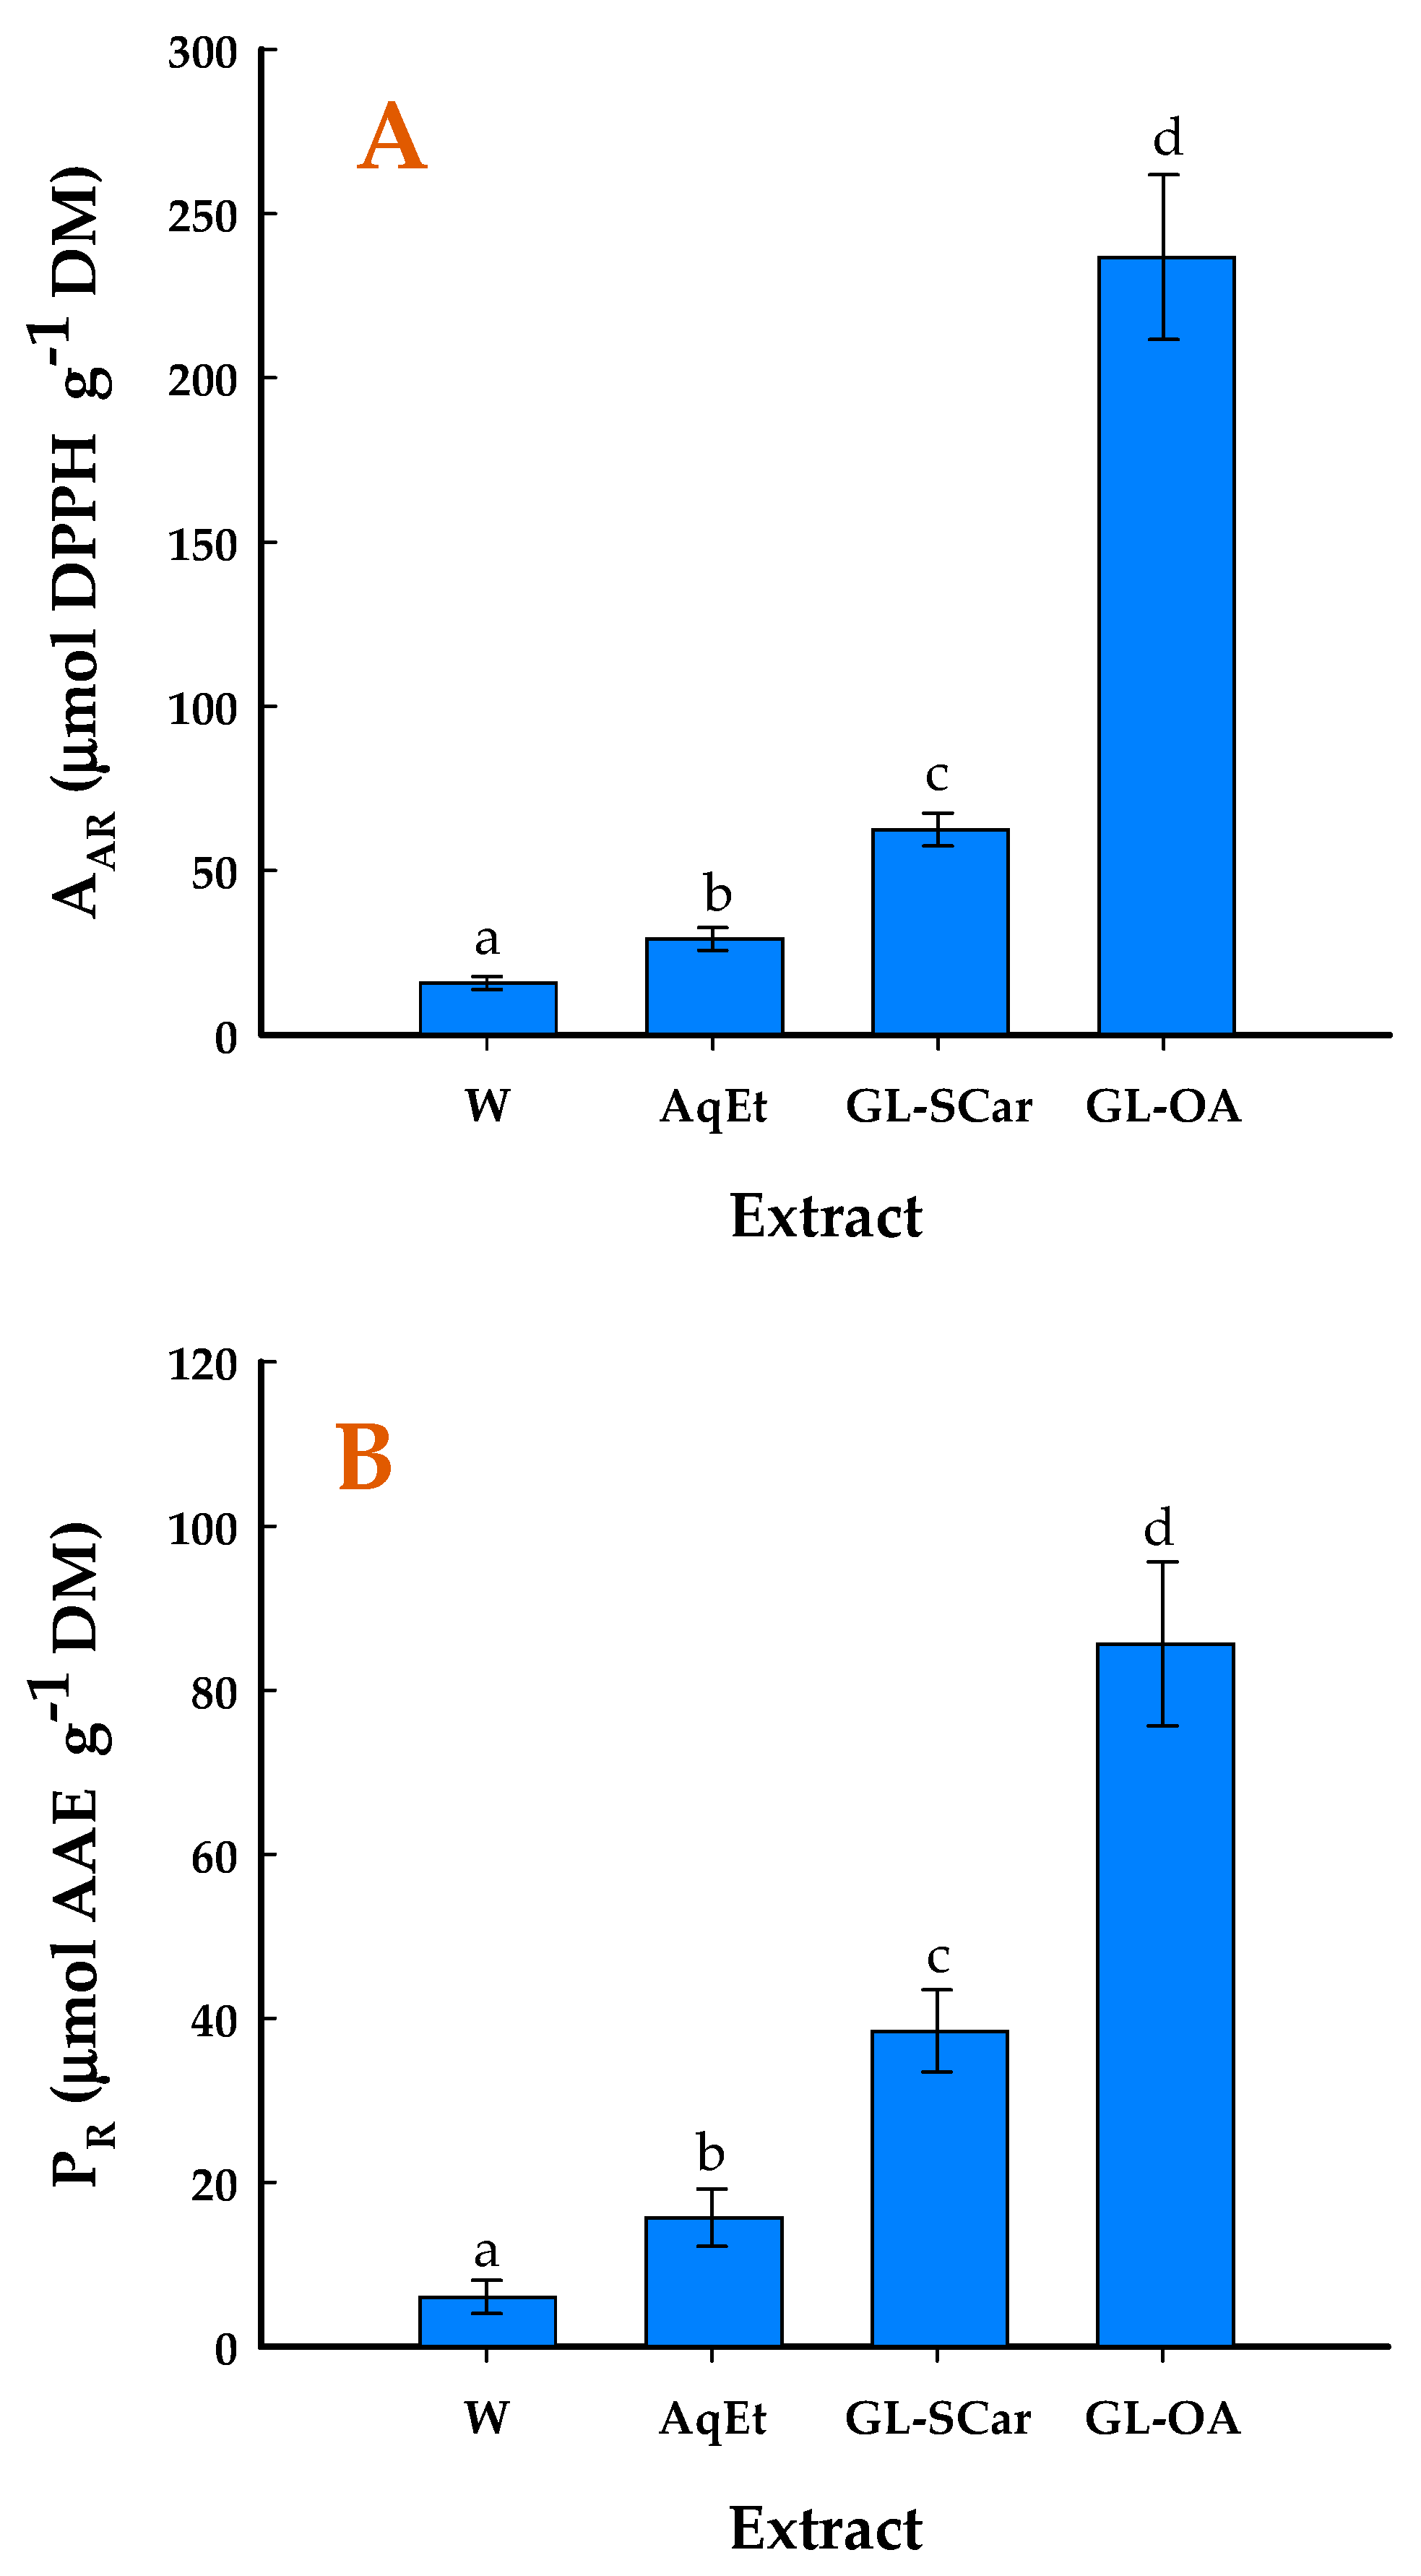
The impact of the different composition of the extracts obtained was appraised by determining the antioxidant activity. With respect to the antiradical effect, the extract produced with GL-OA treatment was by far the most active, exhibiting an antiradical activity (AAR) of 236.8 μmol DPPH g−1 DM (Figure 7A). This value was about 3.8 times higher than that found for the extract generated with the GL-SCar treatment. Likewise, the ferric-reducing power (PR) of the GL-OA extract displayed 2.2 times higher potency than the GL-SCar extract (Figure 7B).
Apparently, these results were in contrast to the polyphenolic composition, since the GL-SCar extract was much richer in total polyphenol (FA-d + FA) compared to the GL-OA extract. However, the GL-OA extract contained almost 1.25 times higher FA-d content compared to the GL-SCar extract. Furthermore, in the GL-OA-treated extract some unidentified peaks were also detected (Figure 6). This difference in composition might be a key factor in the manifestation of antioxidant activity. It should be emphasized that this phenomenon has been observed in a previous study, where extracts with higher FA-d concentration showed higher AAR and PR compared to extracts enriched in FA [27]. This antioxidant behavior was ascribed to the stronger antioxidant ability of the FA-d, in light of earlier studies which demonstrated more powerful antioxidant activity of ferulate glucose esters [61] and ferulate arabinose [62] compared to free FA. The evidence in the present study potentiated such a claim, which merits more in-depth examination. This could lead to synthesizing task-specific DESs for producing extracts enriched in peculiar phytochemicals, thus regulating their antioxidant and, presumably, other biological properties.

3. Materials and Methods

3.1. Chemicals and Reagents

2,2-Diphenyl-1-picrylhydrazyl (DPPH) was from Alfa Aesar (Karlsruhe, Germany). Ferulic acid (99%) was from Sigma-Aldrich (Steinheim, Germany). Iron chloride hexahydrate (FeCl3•6H2O) was from Merck (Darmstadt, Germany). Glycerol anhydrous (99%), oxalic acid dihydrate, and sodium carbonate anhydrous were from Penta (Prague, Czech Republic). Folin–Ciocâlteu reagent and absolute ethanol were from Panreac (Barcelona, Spain). L-Ascorbic acid was from Carlo Erba (Milano, Italy). 2,4,6-Tris (2-pyridyl)-s-triazine (TPTZ) was from Fluka (Steinheim, Germany). The solvents used for chromatography were of appropriate (HPLC) grade.

3.2. Deep Eutectic Solvent Synthesis

Preparation of the deep eutectic solvents (DESs) used was carried out as described in an earlier study [63]. Briefly, for the glycerol/sodium carbonate DES, exact amounts of anhydrous glycerol and anhydrous sodium carbonate were mixed in a glass vial of suitable volume to give a molar ratio of 25/1, and the mixture was heated at 85 °C, under continuous stirring at 400 rpm, for 3 h. Under these conditions, a perfectly transparent liquid was obtained, which, upon cooling down to room temperature, showed no apparent instability (crystallization). This solvent was termed GL-SCar. The solvent was stored at room temperature in the dark for several weeks, with periodic visual inspection for the appearance of crystals. The DES composed of glycerol/oxalic acid (molar ratio 3/1), termed GL-OA, was prepared and checked likewise. Both GL-SCar and GL-OA were used as DES/water mixtures (8/2 w/w), with corresponding pH of 10.99 and 0.32.

3.3. Wheat Bran Procurement

Hard wheat (Triticum aestivum) bran (WB) was obtained by an industrial cereal mill, located in Karditsa (Central Greece). WB was generated 24 h before its receipt and, upon transfer to the laboratory, it was comminuted in a table mill, sieved, and a powder with average particle diameter < 300 μm was collected. The comminuted material was placed in plastic containers and stored at 4 °C, for no longer than a week.

3.4. DES Organosolv Treatments

For all treatments performed, the DESs synthesized were used as water mixtures, at a DES/water proportion of 85/25 (w/w). Typically, treatments were carried out in a 25 mL, screw-cap, glass vessel, by combining 10 mL of solvent (DES/water mixture) and 1 g of WB. Mixing was fixed at a constant speed of 400 rpm, while the treatment temperatures tested were 50, 70, and 90 °C, in various combinations with holding times of 60, 120, and 180 min. Both mixing and heating were provided by a temperature-regulated hotplate (Witeg, Wertheim, Germany). After each treatment, the samples were allowed to reach ambient temperature, and centrifuged for 10 min at 10,000× g. The clear supernatant separated from the debris was used for all further analyses.

3.5. Treatment Severity Assessment

Treatment severity was determined as follows [64]:
R o   =   t   ×   e ( T 100 14.75 )
SF = logRo
where Ro represents the severity, while the value 100 °C is taken as the reference temperature. The empirical factor 14.75 is associated with the temperature of the treatment and the activation energy. The combined severity factor (CSF), which is regarded as a more integrated form of SF, includes the pH of the solvent used, which may be a key variable of the process [65]:
R o   =   10 pH   ×   t   ×   e ( T 100 14.75 )
CSF = logRo − pH
Finally, the alternative combined severity factor, defined as CSF, may be used to provide a more balanced representation of severities, when pH varies widely [65]:
CSF = logRo + |pH − 7|

3.6. Response Surface Treatment Optimization

Aiming at optimizing treatments, a series of temperature (T) and residence time (t) combinations were used to develop a suitable experimental design. A central composite design was utilized, with T and t serving as the independent (treatment) variables, and the total polyphenol yield (YTP) as the response variable. Based on this design, the independent variables were coded at three levels, namely, −1, 0, and 1, as detailed in a previous study [66]. The specific values for these variables were selected based on earlier investigations [27,30], and are presented in detail in Table 4.
For each model built, the overall statistical significance (R2, p), as well as the significance of the individual model coefficients, was assessed by performing analysis of variance (ANOVA) and lack-of-fit tests, both with a 95% significance as the minimum level.

3.7. Reference Alkaline Hydrolysis

A previously published methodology was utilized [27] to execute alkaline hydrolysis and use the resulting polyphenol yield as a reference value, since the polyphenolic fraction released during alkaline treatment is thought to represent approximately the entire amount of extractable polyphenols [16,17]. In summary, 10 mL of 2 M NaOH, produced in 60% methanol, was combined with 1 g of WB, and hydrolysis was carried out for 4 h at 40 °C. The mixture was then centrifuged at 4500× g after 3 mL of HCl (6 M) and 3 mL of formic acid (1 M in methanol) were added. After passing through a 0.45 μm PVDF syringe filter, the debris-free supernatant was put through an HPLC analysis.

3.8. Polyphenol Yield and Antioxidant Activity Determinations

As previously described, a Folin–Ciocâlteu test was used to determine the total polyphenol concentration in the extracted materials [67]. The total polyphenol yield was represented as mg FAE per g dry WB mass (DM), and the results were calculated as mg ferulic acid equivalents (FAE). Using the TPTZ complexing agent as the chromophore, a previously reported test was used to evaluate the extracts’ ferric (Fe3+)-reducing power (PR) [67]. To report the results, μmol ascorbic acid equivalents (AAE) per g DM were used. The stable DPPH radical assay [67] was used to quantify the antiradical activity (AAR), which was expressed as μmol DPPH per g DM.

3.9. Chromatographic Analyses

A Finnigan AQA mass spectrometer and a UV6000LP diode array detector were used with a Finnigan MAT Spectra System P4000 pump (San Jose, CA, USA). Chromatographic analyses were performed using a Fortis RP-18 column, 150 mm by 2.1 mm, 3 μm, which was maintained at 40 °C. Samples were injected onto the chromatograph using a 10 μL loop. By applying previously described modifications for mass spectrometer settings and elution conditions, electrospray ionization (ESI) in positive ion mode was used to acquire mass spectra [68]. Using ferulic acid as an external standard, the quantification was carried out as described in a previous study [27].

3.10. Data Processing—Statistics

The treatments were performed at least in duplicate. Regressions were performed using SigmaPlot 12.5 (Systat Software Inc., San Jose, CA, USA). Chemical analyses were carried out in triplicate. The experiment design used for setting up the response surface methodology, and all associated statistics (ANOVA, lack-of-fit) were performed with JMP™ Pro 16 (SAS, Cary, NC, USA). A Shapiro–Wilk test was used to ascertain the normality distribution of the experimental data. Once normality was affirmed, IBM SPSS Statistics™ 29 (SPSS Inc., Chicago, IL, USA) was used to reveal statistically significant differences, on the basis of the Kruskal–Wallis test.

4. Conclusions

In the present study, two newly synthesized DESs, one acidic and one alkaline, were employed to treat WB with the aim of obtaining extracts enriched in polyphenolic compounds. The results obtained underlined the potential of both DESs to provide high polyphenol yield, showcasing their ability to act as mild acid and alkaline catalysts for liberating bound phenolics, as demonstrated for other mild catalysts in earlier examinations. Treatment evaluation based on severity suggested that the alkaline DES may be more effective under less harsh conditions. Furthermore, very significant differences were recorded in the polyphenolic composition of the extracts prepared with either DES, suggesting differentiated hydrolysis pathways, which resulted in the release of different polyphenols. The extract generated with the acidic DES was more enriched in an FA derivative, identified as a ferulate pentose ester. This extract displayed more powerful antioxidant activity compared to the extract produced through the treatment with the alkaline DES. By contrast, the latter extract contained a much higher ferulic acid amount. The conclusions of this study strongly suggest that both DESs may be used as highly efficacious benign means of obtaining very high polyphenol recoveries from WB. The different features of the extracts produced dictate that similar DESs could be tuned to deliver extracts with targeted composition for task-specific uses. Considering that both DESs were composed of natural, non-toxic constituents, the treatments developed might form the basis for establishing sustainable technologies, with the use of food-compatible and environmentally benign chemicals. Such technologies could be principal components of integrated processes designed for biomass harnessing and bio-product development, in a wider biorefinery concept.

Author Contributions

Conceptualization, D.P.M.; methodology, S.G.; formal analysis, S.G.; investigation, S.G.; resources, D.P.M. and S.G.; data curation, D.P.M. and S.G.; writing—original draft preparation, D.P.M. and S.G.; writing—review and editing, S.G. and D.P.M.; supervision, D.P.M.; project administration, D.P.M. All authors have read and agreed to the published version of the manuscript.

Funding

This research received no external funding.

Data Availability Statement

Data are contained within the article.

Conflicts of Interest

The authors declare no conflicts of interest.

References

  1. Esparza, I.; Jiménez-Moreno, N.; Bimbela, F.; Ancín-Azpilicueta, C.; Gandía, L.M. Fruit and vegetable waste management: Conventional and emerging approaches. J. Environ. Manag. 2020, 265, 110510. [Google Scholar] [CrossRef]
  2. Ouro-Salim, O.; Guarnieri, P. Circular economy of food waste: A literature review. Environ. Qual. Manag. 2022, 32, 225–242. [Google Scholar] [CrossRef]
  3. Jin, Q.; Yang, L.; Poe, N.; Huang, H. Integrated processing of plant-derived waste to produce value-added products based on the biorefinery concept. Trends Food Sci. Technol. 2018, 74, 119–131. [Google Scholar] [CrossRef]
  4. Osorio, L.L.D.R.; Flórez-López, E.; Grande-Tovar, C.D. The potential of selected agri-food loss and waste to contribute to a circular economy: Applications in the food, cosmetic and pharmaceutical industries. Molecules 2021, 26, 515. [Google Scholar] [CrossRef] [PubMed]
  5. El Mekawy, A.; Diels, L.; De Wever, H.; Pant, D. Valorization of cereal based biorefinery byproducts: Reality and expectations. Environ. Sci. Technol. 2013, 47, 9014–9027. [Google Scholar] [CrossRef] [PubMed]
  6. Galanakis, C.M. Sustainable applications for the valorization of cereal processing by-products. Foods 2022, 11, 241. [Google Scholar] [CrossRef]
  7. Rudjito, R.C.; Matute, A.C.; Jiménez-Quero, A.; Olsson, L.; Stringer, M.A.; Krogh, K.B.R.M.; Eklöf, J.; Vilaplana, F. Integration of subcritical water extraction and treatment with xylanases and feruloyl esterases maximises release of feruloylated arabinoxylans from wheat bran. Bioresour. Technol. 2024, 395, 130387. [Google Scholar] [CrossRef]
  8. Apprich, S.; Tirpanalan, Ö.; Hell, J.; Reisinger, M.; Böhmdorfer, S.; Siebenhandl-Ehn, S.; Novalin, S.; Kneifel, W. Wheat bran-based biorefinery 2: Valorization of products. LWT Food Sci. Technol. 2014, 56, 222–231. [Google Scholar] [CrossRef]
  9. Katileviciute, A.; Plakys, G.; Budreviciute, A.; Onder, K.; Damiati, S.; Kodzius, R. A sight to wheat bran: High value-added products. Biomolecules 2019, 9, 887. [Google Scholar] [CrossRef]
  10. Silva, E.d.O.; Batista, R. Ferulic acid and naturally occurring compounds bearing a feruloyl moiety: A review on their structures, occurrence, and potential health benefits. Compr. Rev. Food Sci. Food Saf. 2017, 16, 580–616. [Google Scholar] [CrossRef]
  11. Fărcaș, A.; Drețcanu, G.; Pop, T.D.; Enaru, B.; Socaci, S.; Diaconeasa, Z. Cereal processing by-products as rich sources of phenolic compounds and their potential bioactivities. Nutrients 2021, 13, 3934. [Google Scholar] [CrossRef]
  12. Li, D.; Rui, Y.-X.; Guo, S.-D.; Luan, F.; Liu, R.; Zeng, N. Ferulic acid: A review of its pharmacology, pharmacokinetics and derivatives. Life Sci. 2021, 284, 119921. [Google Scholar] [CrossRef] [PubMed]
  13. Kumar, N.; Pruthi, V. Potential applications of ferulic acid from natural sources. Biotechnol. Rep. 2014, 4, 86–93. [Google Scholar] [CrossRef] [PubMed]
  14. Mathew, S.; Abraham, T.E. Ferulic acid: An antioxidant found naturally in plant cell walls and feruloyl esterases involved in its release and their applications. Crit. Rev. Biotechnol. 2004, 24, 59–83. [Google Scholar] [CrossRef] [PubMed]
  15. Khosravi, A.; Razavi, S.H. The role of bioconversion processes to enhance bioaccessibility of polyphenols in rice. Food Biosci. 2020, 35, 100605. [Google Scholar] [CrossRef]
  16. Barberousse, H.; Roiseux, O.; Robert, C.; Paquot, M.; Deroanne, C.; Blecker, C. Analytical methodologies for quantification of ferulic acid and its oligomers. J. Sci. Food Agric. 2008, 88, 1494–1511. [Google Scholar] [CrossRef]
  17. Bento-Silva, A.; Patto, M.C.V.; Bronze, M.d.R. Relevance, structure and analysis of ferulic acid in maize cell walls. Food Chem. 2018, 246, 360–378. [Google Scholar] [CrossRef]
  18. Smith, E.L.; Abbott, A.P.; Ryder, K.S. Deep eutectic solvents (DESs) and their applications. Chem. Rev. 2014, 114, 11060–11082. [Google Scholar] [CrossRef]
  19. Omar, K.A.; Sadeghi, R. Database of deep eutectic solvents and their physical properties: A review. J. Mol. Liq. 2023, 384, 121899. [Google Scholar] [CrossRef]
  20. Liu, J.; Li, X.; Row, K.H. Development of deep eutectic solvents for sustainable chemistry. J. Mol. Liq. 2022, 362, 119654. [Google Scholar] [CrossRef]
  21. Paiva, A.; Craveiro, R.; Aroso, I.; Martins, M.; Reis, R.L.; Duarte, A.R.C. Natural deep eutectic solvents–solvents for the 21st century. ACS Sustain. Chem. Eng. 2014, 2, 1063–1071. [Google Scholar] [CrossRef]
  22. Yang, Z. Natural deep eutectic solvents and their applications in biotechnology. Appl. Ion. Liq. Biotechnol. 2019, 31–59. [Google Scholar] [CrossRef]
  23. Usmani, Z.; Sharma, M.; Tripathi, M.; Lukk, T.; Karpichev, Y.; Gathergood, N.; Singh, B.N.; Thakur, V.K.; Tabatabaei, M.; Gupta, V.K. Biobased natural deep eutectic system as versatile solvents: Structure, interaction and advanced applications. Sci. Total Environ. 2023, 881, 163002. [Google Scholar] [CrossRef]
  24. Hikmawanti, N.P.E.; Ramadon, D.; Jantan, I.; Mun’im, A. Natural deep eutectic solvents (NADES): Phytochemical extraction performance enhancer for pharmaceutical and nutraceutical product development. Plants 2021, 10, 2091. [Google Scholar] [CrossRef] [PubMed]
  25. Socas-Rodríguez, B.; Torres-Cornejo, M.V.; Álvarez-Rivera, G.; Mendiola, J.A. Deep eutectic solvents for the extraction of bioactive compounds from natural sources and agricultural by-products. Appl. Sci. 2021, 11, 4897. [Google Scholar] [CrossRef]
  26. Bozinou, E.; Palaiogiannis, D.; Mourtzinos, I.; Chatzilazarou, A.; Gkatzionis, C.; Makris, D.P. The use of tailor-made acidic deep eutectic solvents for preparation of quercetin-enriched extracts from onion solid wastes. Environ. Qual. Manag. 2023, 33, 147–155. [Google Scholar] [CrossRef]
  27. Papadaki, E.; Grigorakis, S.; Palaiogiannis, D.; Lalas, S.I.; Mitlianga, P. Hydrothermal treatment of wheat bran under mild acidic or alkaline conditions for enhanced polyphenol recovery and antioxidant activity. Molecules 2024, 29, 1193. [Google Scholar] [CrossRef] [PubMed]
  28. Papadaki, E.S.; Palaiogiannis, D.; Lalas, S.I.; Mitlianga, P.; Makris, D.P. Polyphenol release from wheat bran using ethanol-based organosolv treatment and acid/alkaline catalysis: Process modeling based on severity and response surface optimization. Antioxidants 2022, 11, 2457. [Google Scholar] [CrossRef]
  29. Casasni, S.; Guenaoui, A.; Grigorakis, S.; Makris, D.P. Acid-catalyzed organosolv treatment of potato peels to boost release of polyphenolic compounds using 1-and 2-propanol. Appl. Sci. 2023, 13, 9484. [Google Scholar] [CrossRef]
  30. Guenaoui, A.; Casasni, S.; Grigorakis, S.; Makris, D.P. Alkali-catalyzed organosolv treatment of oat bran for enhanced release of hydroxycinnamate antioxidants: Comparison of 1-and 2-propanol. Environments 2023, 10, 118. [Google Scholar] [CrossRef]
  31. Pazo-Cepeda, V.; Benito-Román, Ó.; Navarrete, A.; Alonso, E. Valorization of wheat bran: Ferulic acid recovery using pressurized aqueous ethanol solutions. Waste Biomass Valor. 2020, 11, 4701–4710. [Google Scholar] [CrossRef]
  32. Papadimitriou, G.; Zarnavalou, V.; Chatzimitakos, T.; Palaiogiannis, D.; Athanasiadis, V.; Lalas, S.I.; Makris, D.P. Comparison of sodium hydroxide and sodium carbonate as alkali catalysts in ethanol organosolv treatment of cotton stalks for the release of hydroxycinnamates. Recycling 2024, 9, 21. [Google Scholar] [CrossRef]
  33. Kottaras, P.; Koulianos, M.; Makris, D.P. Low-transition temperature mixtures (LTTMs) made of bioorganic molecules: Enhanced extraction of antioxidant phenolics from industrial cereal solid wastes. Recycling 2017, 2, 3. [Google Scholar] [CrossRef]
  34. Abozed, S.S.; El-Kalyoubi, M.; Abdelrashid, A.; Salama, M.F. Total phenolic contents and antioxidant activities of various solvent extracts from whole wheat and bran. Ann. Agric. Sci. 2014, 59, 63–67. [Google Scholar] [CrossRef]
  35. Chen, Y.; Zhang, R.; Liu, C.; Zheng, X.; Liu, B. Enhancing antioxidant activity and antiproliferation of wheat bran through steam flash explosion. J. Food Sci. Technol. 2016, 53, 3028–3034. [Google Scholar] [CrossRef] [PubMed]
  36. Martín-Diana, A.B.; Tomé-Sánchez, I.; García-Casas, M.J.; Martínez-Villaluenga, C.; Frías, J.; Rico, D. A novel strategy to produce a soluble and bioactive wheat bran ingredient rich in ferulic acid. Antioxidants 2021, 10, 969. [Google Scholar] [CrossRef]
  37. Zhou, K.; Yu, L. Effects of extraction solvent on wheat bran antioxidant activity estimation. LWT Food Sci. Technol. 2004, 37, 717–721. [Google Scholar] [CrossRef]
  38. Guerrini, A.; Burlini, I.; Lorenzo, B.H.; Grandini, A.; Vertuani, S.; Tacchini, M.; Sacchetti, G. Antioxidant and antimicrobial extracts obtained from agricultural by-products: Strategies for a sustainable recovery and future perspectives. Food Bioprod. Process. 2020, 124, 397–407. [Google Scholar] [CrossRef]
  39. Verma, B.; Hucl, P.; Chibbar, R. Phenolic acid composition and antioxidant capacity of acid and alkali hydrolysed wheat bran fractions. Food Chem. 2009, 116, 947–954. [Google Scholar] [CrossRef]
  40. Kim, K.-H.; Tsao, R.; Yang, R.; Cui, S.W. Phenolic acid profiles and antioxidant activities of wheat bran extracts and the effect of hydrolysis conditions. Food Chem. 2006, 95, 466–473. [Google Scholar] [CrossRef]
  41. Arranz, S.; Calixto, F.S. Analysis of polyphenols in cereals may be improved performing acidic hydrolysis: A study in wheat flour and wheat bran and cereals of the diet. J. Cereal Sci. 2010, 51, 313–318. [Google Scholar] [CrossRef]
  42. Chen, X.; Sun, K.; Zhuang, K.; Ding, W. Comparison and Optimization of Different Extraction Methods of Bound Phenolics from Jizi439 Black Wheat Bran. Foods 2022, 11, 1478. [Google Scholar] [CrossRef]
  43. Buranov, A.U.; Mazza, G. Lignin in straw of herbaceous crops. Ind. Crops Prod. 2008, 28, 237–259. [Google Scholar] [CrossRef]
  44. Ng, M.H.; Hadi, N.A. Extraction of ferulic acid from oil palm pressed fiber by a choline chloride based deep eutectic solvent. J. Am. Oil Chem. Soc. 2022, 99, 443–453. [Google Scholar] [CrossRef]
  45. Chadni, M.; Haudrechy, A.; Couvreur, J.; Allais, F. Investigation of ferulic acid recovery from enzymatic hydrolysate of wheat bran using various solvents and liquid-liquid extraction assisted by membrane contactor. J. Mol. Liq. 2024, 400, 124538. [Google Scholar] [CrossRef]
  46. Makris, D.P.; Lalas, S. Glycerol and glycerol-based deep eutectic mixtures as emerging green solvents for polyphenol extraction: The evidence so far. Molecules 2020, 25, 5842. [Google Scholar] [CrossRef]
  47. de Oliveira, D.M.; Finger-Teixeira, A.; Mota, T.R.; Salvador, V.H.; Moreira-Vilar, F.C.; Molinari, H.B.C.; Mitchell, R.A.C.; Marchiosi, R.; Ferrarese-Filho, O.; Santos, W.D.D. Ferulic acid: A key component in grass lignocellulose recalcitrance to hydrolysis. Plant Biotechnol. J. 2015, 13, 1224–1232. [Google Scholar] [CrossRef]
  48. Buranov, A.U.; Mazza, G. Extraction and purification of ferulic acid from flax shives, wheat and corn bran by alkaline hydrolysis and pressurised solvents. Food Chem. 2009, 115, 1542–1548. [Google Scholar] [CrossRef]
  49. Linh, T.N.; Fujita, H.; Sakoda, A. Release kinetics of esterified p-coumaric acid and ferulic acid from rice straw in mild alkaline solution. Bioresour. Technol. 2017, 232, 192–203. [Google Scholar] [CrossRef] [PubMed]
  50. Scelsi, E.; Angelini, A.; Pastore, C. Deep eutectic solvents for the valorisation of lignocellulosic biomasses towards fine chemicals. Biomass 2021, 1, 29–59. [Google Scholar] [CrossRef]
  51. Wang, W.; Lee, D.-J. Lignocellulosic biomass pretreatment by deep eutectic solvents on lignin extraction and saccharification enhancement: A review. Bioresour. Technol. 2021, 339, 125587. [Google Scholar] [CrossRef]
  52. Valério, R.; Torres, C.A.; Brazinha, C.; da Silva, M.G.; Coelhoso, I.M.; Crespo, J.G. Purification of ferulic acid from corn fibre alkaline extracts for bio-vanillin production using an adsorption process. Separ. Purif. Technol. 2022, 298, 121570. [Google Scholar] [CrossRef]
  53. Pazo-Cepeda, M.V.; Aspromonte, S.G.; Alonso, E. Extraction of ferulic acid and feruloylated arabinoxylo-oligosaccharides from wheat bran using pressurized hot water. Food Biosci. 2021, 44, 101374. [Google Scholar] [CrossRef]
  54. Guo, Y.; Xu, L.; Shen, F.; Hu, J.; Huang, M.; He, J.; Zhang, Y.; Deng, S.; Li, Q.; Tian, D. Insights into lignocellulosic waste fractionation for lignin nanospheres fabrication using acidic/alkaline deep eutectic solvents. Chemosphere 2022, 286, 131798. [Google Scholar] [CrossRef]
  55. Woiciechowski, A.L.; Neto, C.J.D.; Vandenberghe, L.P.d.S.; Neto, D.P.d.C.; Sydney, A.C.N.; Letti, L.A.J.; Karp, S.G.; Torres, L.A.Z.; Soccol, C.R. Lignocellulosic biomass: Acid and alkaline pretreatments and their effects on biomass recalcitrance–Conventional processing and recent advances. Bioresour. Technol. 2020, 304, 122848. [Google Scholar] [CrossRef]
  56. Xie, J.; Cheng, Z.; Zhu, S.; Xu, J. Lewis base enhanced neutral deep eutectic solvent pretreatment for enzymatic hydrolysis of corn straw and lignin characterization. Renew. Energy 2022, 188, 320–328. [Google Scholar] [CrossRef]
  57. Li, H.; Li, X.; Li, D.; Zhang, J.; Nawaz, H.; You, T.; Xu, F. Highly-efficient pretreatment using alkaline enhanced aqueous deep eutectic solvent to unlock poplar for high yield of fermentable sugars: Synergistic removal of lignin and mannan. Bioresour. Technol. 2022, 351, 126993. [Google Scholar] [CrossRef]
  58. Yue, X.; Suopajarvi, T.; Mankinen, O.; Mikola, M.; Mikkelson, A.; Ahola, J.; Hiltunen, S.; Komulainen, S.; Kantola, A.M.; Telkki, V.-V. Comparison of lignin fractions isolated from wheat straw using alkaline and acidic deep eutectic solvents. J. Agric. Food Chem. 2020, 68, 15074–15084. [Google Scholar] [CrossRef] [PubMed]
  59. Li, H.; Li, X.; You, T.; Li, D.; Nawaz, H.; Zhang, X.; Xu, F. Insights into alkaline choline chloride-based deep eutectic solvents pretreatment for Populus deltoides: Lignin structural features and modification mechanism. Int. J. Biol. Macromol. 2021, 193, 319–327. [Google Scholar] [CrossRef] [PubMed]
  60. Ma, C.-Y.; Xu, L.-H.; Sun, Q.; Sun, S.-N.; Cao, X.-F.; Wen, J.-L.; Yuan, T.-Q. Ultrafast alkaline deep eutectic solvent pretreatment for enhancing enzymatic saccharification and lignin fractionation from industrial xylose residue. Bioresour. Technol. 2022, 352, 127065. [Google Scholar] [CrossRef] [PubMed]
  61. Kylli, P.; Nousiainen, P.; Biely, P.; Sipilä, J.; Tenkanen, M.; Heinonen, M. Antioxidant potential of hydroxycinnamic acid glycoside esters. J. Agric. Food Chem. 2008, 56, 4797–4805. [Google Scholar] [CrossRef]
  62. Ohta, T.; Nakano, T.; Egashira, Y.; Sanada, H. Antioxidant activity of ferulic acid β-glucuronide in the LDL oxidation system. Biosci. Biotechnol. Biochem. 1997, 61, 1942–1943. [Google Scholar] [CrossRef]
  63. Dai, Y.; Witkamp, G.-J.; Verpoorte, R.; Choi, Y.H. Tailoring properties of natural deep eutectic solvents with water to facilitate their applications. Food Chem. 2015, 187, 14–19. [Google Scholar] [CrossRef] [PubMed]
  64. Overend, R.P.; Chornet, E. Fractionation of lignocellulosics by steam-aqueous pretreatments. Philos. Trans. R. Soc. A Math. Phys. Sci. 1987, 321, 523–536. [Google Scholar]
  65. Pedersen, M.; Meyer, A.S. Lignocellulose pretreatment severity–relating pH to biomatrix opening. New Biotechnol. 2010, 27, 739–750. [Google Scholar] [CrossRef] [PubMed]
  66. Mota, I.; Pinto, P.C.R.; Novo, C.; Sousa, G.; Guerreiro, O.; Guerra, A.R.; Duarte, M.F.; Rodrigues, A.E. Extraction of polyphenolic compounds from Eucalyptus globulus bark: Process optimization and screening for biological activity. Ind. Eng. Chem. Res. 2012, 51, 6991–7000. [Google Scholar] [CrossRef]
  67. Lakka, A.; Grigorakis, S.; Karageorgou, I.; Batra, G.; Kaltsa, O.; Bozinou, E.; Lalas, S.; Makris, D.P. Saffron processing wastes as a bioresource of high-value added compounds: Development of a green extraction process for polyphenol recovery using a natural deep eutectic solvent. Antioxidants 2019, 8, 586. [Google Scholar] [CrossRef]
  68. Lakka, A.; Karageorgou, I.; Kaltsa, O.; Batra, G.; Bozinou, E.; Lalas, S.; Makris, D. Polyphenol extraction from Humulus lupulus (hop) using a neoteric glycerol/L-alanine deep eutectic solvent: Optimisation, kinetics and the effect of ultrasound-assisted pretreatment. AgriEngineering 2019, 1, 403–417. [Google Scholar] [CrossRef]
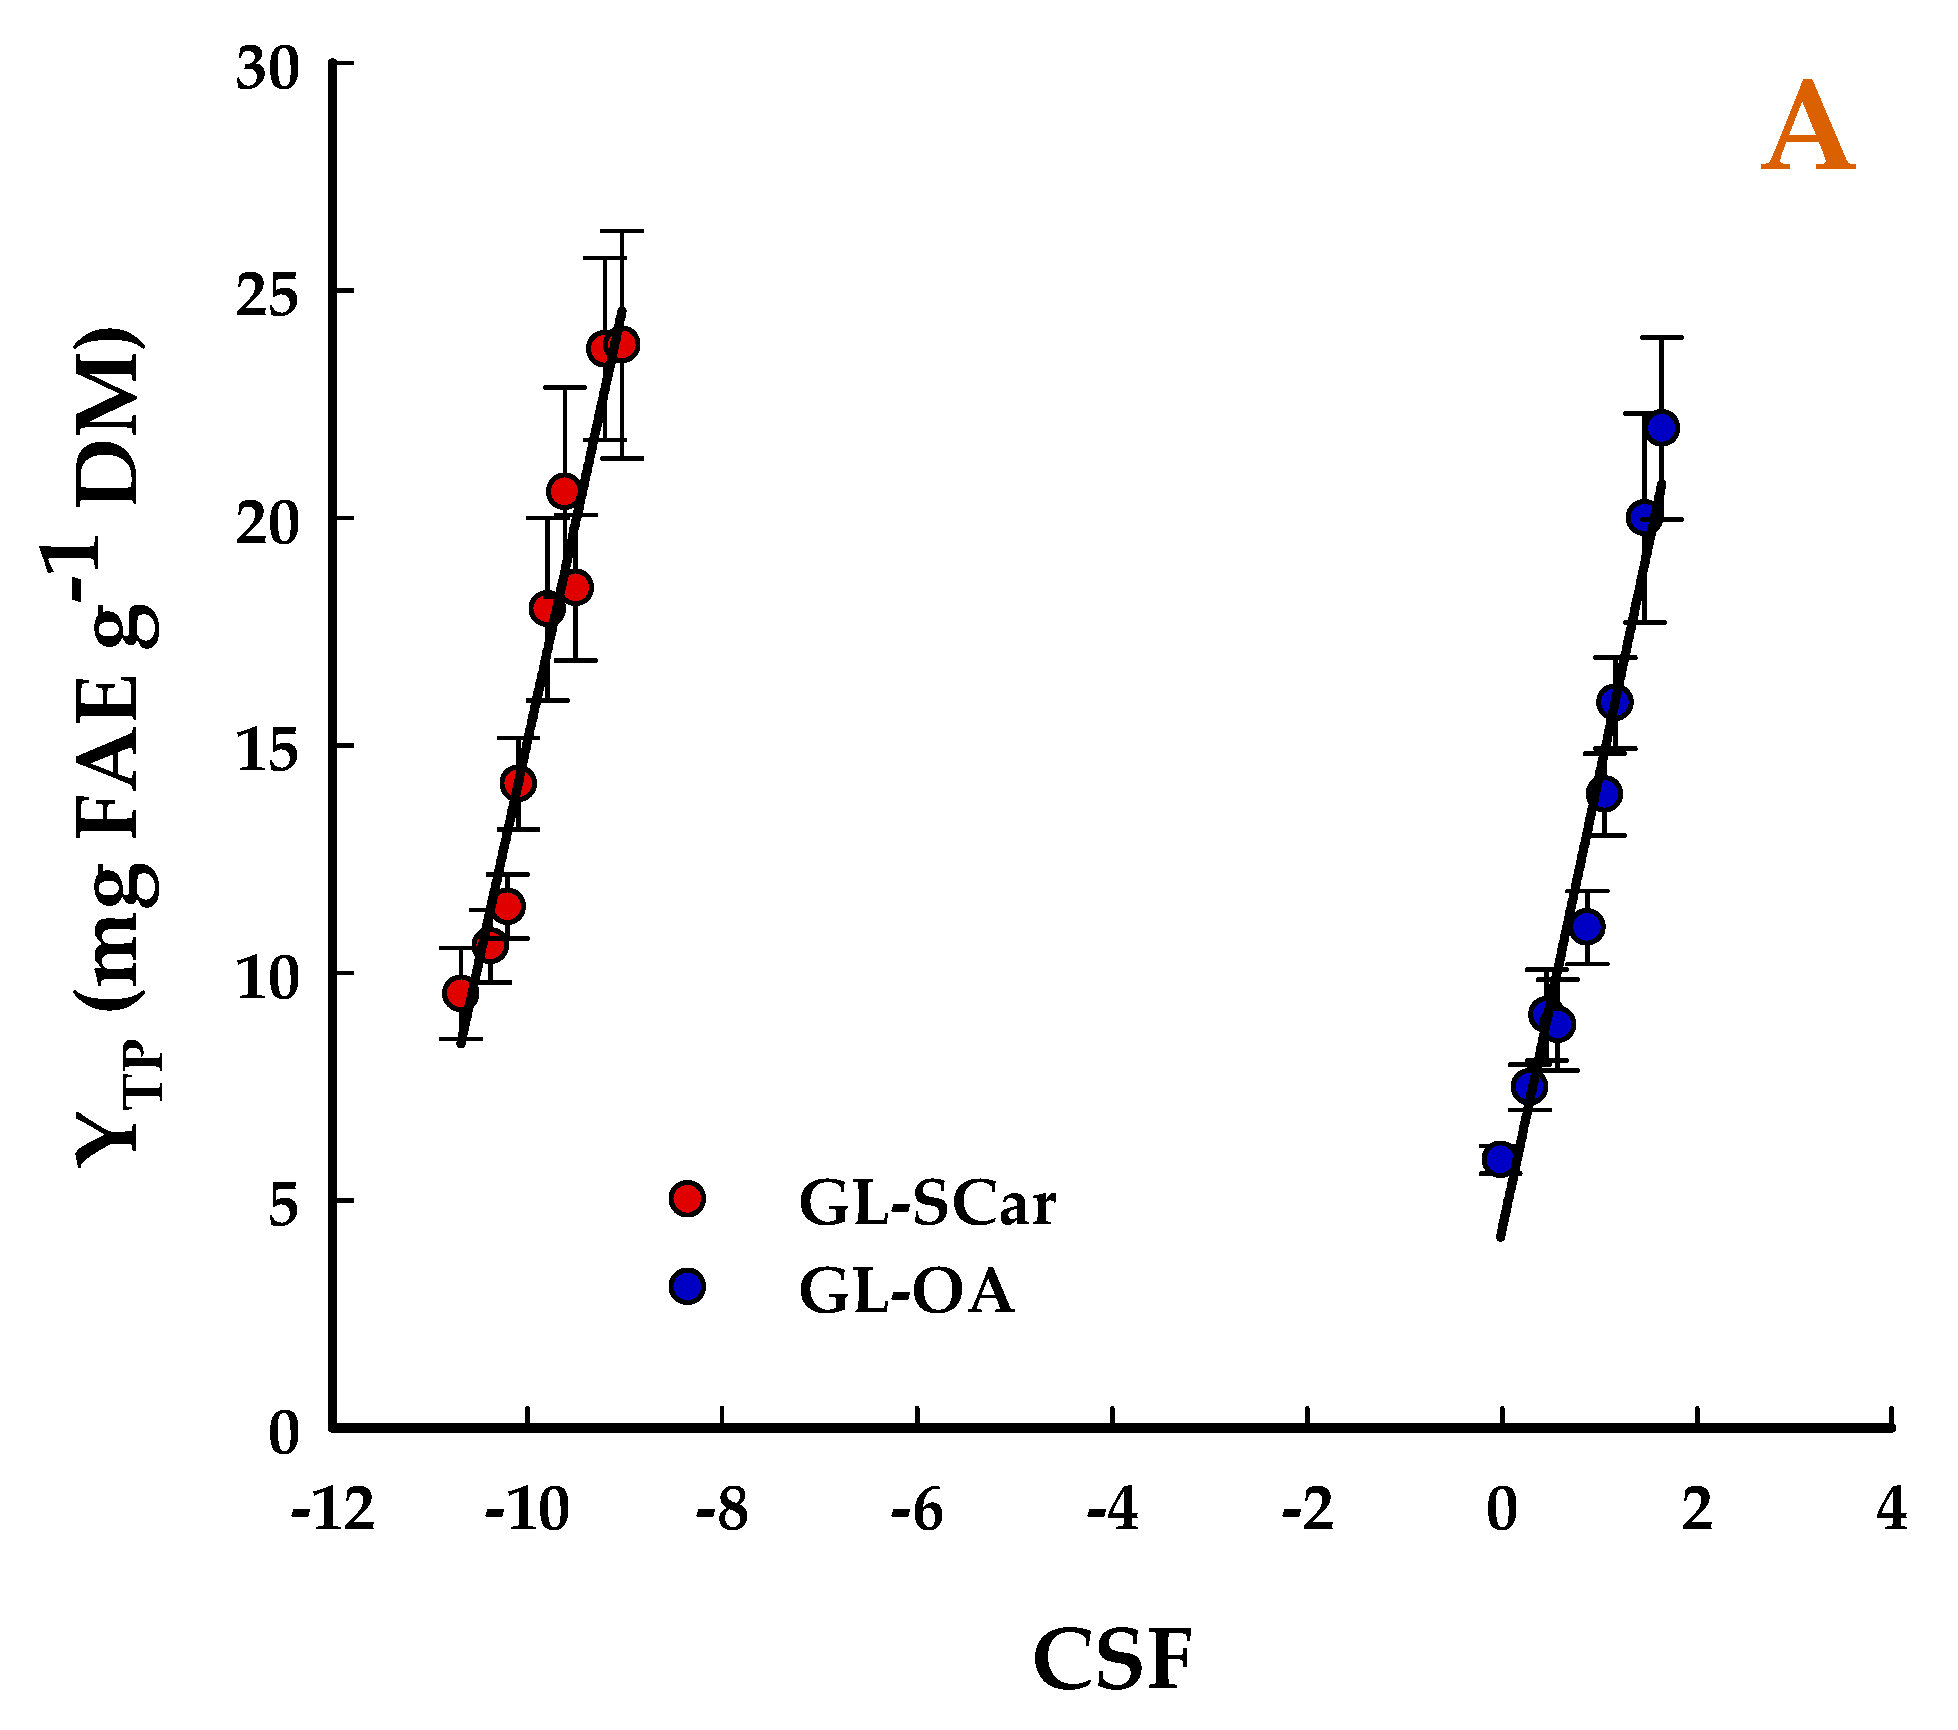
Figure 1. Plots showing the correlation between total polyphenol yield (YTP) and combined severity factor (A) and alternative severity factor (B). Bars indicate standard deviation of duplicate experiments.
Recycling 10 00178 g001aRecycling 10 00178 g001b
Figure 2. Statistical information derived from deploying response surface methodology for optimizing t and T conditions for WB treatment with the DES GL-SCar. Graph (A) presents the correlation between actual and predicted YTP values, while graph (B) illustrates the desirability function, through which optimum t and T levels could be predicted. The inset tables provide the results from the ANOVA and lack-of-fit tests. Values in color are statistically significant (p < 0.05).
Recycling 10 00178 g002
Figure 3. Statistical information derived from deploying response surface methodology for optimizing t and T conditions for WB treatment with the DES GL-OA. Graph (A) presents the correlation between actual and predicted YTP values, while graph (B) illustrates the desirability function, through which optimum t and T levels could be predicted. The inset tables provide the results from the ANOVA and lack-of-fit tests. Values in color are statistically significant (p < 0.05).
Recycling 10 00178 g003
Figure 4. Three-dimensional graphs showing the variation in the response (YTP) as a function of t and T for the treatment of WB with GL-SCar (A) and GL-OA (B).
Recycling 10 00178 g004
Figure 5. Bar plot illustrating the total polyphenol yield (YTP) achieved with different WB treatments. W, neat water; AqET, 60% ethanol; GL-SCar, DES composed of glycerol/sodium carbonate; GL-OA, DES composed of glycerol/oxalic acid. Values reported are means of duplicate treatments ± standard deviation. Columns with different letters (a, b, c) are statistically different values (p < 0.05).
Recycling 10 00178 g005
Figure 6. The polyphenolic profile of the WB extracts obtained after treatment with the DESs composed of glycerol/oxalic acid (GL-OA) and glycerol/sodium carbonate (GL-SCar). Chromatograms were recorded at 320 nm. Abbreviations: FA-d, ferulic acid derivative; FA, ferulic acid.
Recycling 10 00178 g006
Figure 7. Bar plots portraying the antiradical activity (A) and ferric-reducing power (B) of extracts obtained with different WB treatments. Abbreviations: W, neat water; AqET, 60% (v/v) ethanol; GL-SCar, DES composed of glycerol/sodium carbonate; GL-OA, DES composed of glycerol/oxalic acid. Values are means of duplicate treatments ± standard deviation. Columns with different letters (a, b, c, d) are statistically different values (p < 0.05).
Recycling 10 00178 g007
Table 1. Settings of t and T used to perform WB treatments and the corresponding total polyphenol yield and severity values. YTP is given as means of duplicate experiments ± standard deviation.
t (min)T (°C)SFCSFCSFYTP
(mg FAE g−1 DM)
GL-SCarGL-OAGL-SCarGL-OAGL-SCarGL-OA
60500.31−10.68−0.014.306.999.55 ± 0.13 a5.89 ± 0.08 a
120500.61−10.380.294.607.2910.59 ± 0.70 b7.49 ± 0.10 b
180500.78−10.210.464.777.4611.46 ± 0.71 b9.08 ± 0.16 c
60700.89−10.100.574.887.5714.16 ± 0.28 c8.86 ± 0.14 c
120701.20−9.790.885.197.8818.58 ± 0.29 d11.00 ± 0.93 d
180701.37−9.621.055.368.0520.57 ± 0.24 e13.93 ± 0.22 e
60901.48−9.511.165.478.1618.47 ± 0.34 d15.95 ± 0.40 f
120901.78−9.211.465.778.4623.71 ± 0.30 f20.20 ± 0.28 g
180901.96−9.031.645.958.6423.81 ± 0.27 f21.97 ± 0.21 h
Note: Values marked with different letters (a–h) represent statistically different values.
Table 2. The pairs for the independent variables for each design point used for the response surface methodology, and the corresponding predicted and measured YTP values.
Design PointIndependent VariablesResponse (YTP, mg FAE g−1 DM)
X1 (t, min)X2 (T, °C)GL-SCarGL-OA
MeasuredPredictedMeasuredPredicted
1−1 (60)−1 (50)9.558.515.895.90
2−1 (60)1 (90)18.4718.3215.9517.03
31 (180)−1 (50)11.4611.419.089.24
41 (180)1 (90)23.8124.2721.9723.21
5−1 (60)0 (70)14.1615.358.867.77
61 (180)0 (70)20.5719.7813.9312.53
70 (120)−1 (50)10.5911.687.497.32
80 (120)1 (90)23.7123.0220.2019.88
90 (120)0 (70)20.1519.2911.629.90
100 (120)0 (70)19.1719.2911.009.90
110 (120)0 (70)18.5819.2910.609.90
Table 3. Yields for the ferulic acid derivative (FA-d) and ferulic acid (FA) achieved after treatment with different solvents. Values are means of duplicate treatments ± standard deviation.
Extraction MediumExtraction Yield (μg g−1 DM)
Ferulic AcidFerulate DerivativeTotal
Reference hydrolysis2232.30 ± 98.54 a208.21 ± 14.32 a2440.51
Water33.25 ± 2.28 b17.44 ± 1.45 b50.69
60% EtOH40.51 ± 3.58 c20.69 ± 1.89 c61.20
GL-OA102.82 ± 9.63 d123.93 ± 10.44 d226.75
GL-SCar943.18 ± 78.12 e98.82 ± 7.89 e1042.00
Values within columns with different letters (a, b, c, d, e) have statistically significant difference (p < 0.05).
Table 4. The variables used to construct the experimental design, given as both actual and coded values.
Treatment VariablesCodesCoded Variable Level
−101
t (min)X160120180
T (°C)X2507090
Disclaimer/Publisher’s Note: The statements, opinions and data contained in all publications are solely those of the individual author(s) and contributor(s) and not of MDPI and/or the editor(s). MDPI and/or the editor(s) disclaim responsibility for any injury to people or property resulting from any ideas, methods, instructions or products referred to in the content.