Article

Exploring Refuse-Derived Fuel Production from Seafood-Processing Sludge and Landfill-Mined Plastic Waste Co-Pelletization

by
Wittawat Wulyapash
1,2,
Awassada Phongphiphat
1,2,*,
Johann Fellner
3 and
Sirintornthep Towprayoon
1,2
1
The Joint Graduate School of Energy and Environment, King Mongkut’s University of Technology Thonburi, Bangkok 10140, Thailand
2
Center of Excellence on Energy Technology and Environment (CEE), Ministry of Higher Education, Science, Research and Innovation (MHESI), Bangkok 10140, Thailand
3
Institute for Water Quality and Resource Management, TU Wien, Karlsplatz 13/226, 1040 Vienna, Austria
*
Author to whom correspondence should be addressed.
Recycling 2025, 10(2), 52; https://doi.org/10.3390/recycling10020052
Submission received: 2 December 2024 / Revised: 29 December 2024 / Accepted: 6 March 2025 / Published: 20 March 2025

Abstract

:
This study explores the co-pelletization of sludge with landfill-mined plastic waste as a method to create high-energy refuse-derived fuel (RDF), addressing both plastic and sludge waste streams. Key variables used in RDF pelletization included sludge-to-plastic mixing ratios (50:50, 75:25, and 100:0 wt%), mold temperatures (100 °C and 120 °C), and compression pressures (60–80 MPa). Results showed that the characteristics of pellets improved considerably as the mass percentage of plastic waste increased. The 75% sludge mixture produced pellets with high compressive strength (15.9–16.4 MPa), indicating rigid and ductile properties, and achieved a calorific value of up to 33.4 MJ/kg. Mercury levels of the RDF (0.02–0.04 mg/MJ) met solid recovered fuel standards. However, the elevated chlorine content (>3 wt%db) highlighted the necessity of removing PVC from the plastic waste before pelletization. Carbon emission factors for the pellets (23–25 kg CO2/GJ) were comparable to commercial RDFs and notably lower than coal, demonstrating their potential as a sustainable alternative fuel source. An assessment of the entire production and utilization chain, including sludge drying, plastic sorting, pelletization, and combustion, revealed that co-pelletization reduces greenhouse gas emissions by more than 24.3% compared to current practices.

1. Introduction

Thailand ranks among the world’s leading seafood producers, contributing 26% of the global tuna export value and generating 111 million USD in income in 2023 [1]. This sector supports significant local employment, further bolstered by government policies that promote the country’s food processing industry. However, seafood processing generates substantial wastewater and sludge; the tuna sector alone produces over 14 million m³ of wastewater and 1.4 million tons of sludge annually.
In Thailand, sludge is predominantly landfilled due to its simplicity despite high transport and tipping fees and environmental issues such as leachate and landfill gas emissions. With limited landfill space, NIMBY concerns, and global trends discouraging organic waste landfilling, alternative disposal methods are urgently needed. Given the gross calorific value (GCV) of seafood-processing sludge (approximately 20 MJ/kg, similar to lignite), thermal utilization offers a promising solution. Additionally, some toxic heavy metals such as As, Hg, Pb, and Sb are present in the sludge 2–4 times lower than those in lignite [2,3,4]. Converting sludge into refuse-derived fuel (RDF) for industrial boilers could also reduce reliance on imported coal, aligning with Thailand’s Alternative Energy Development Plan (AEDP) 2024–2037.
Several pre-treatment methods, such as thermal drying, biodrying, torrefaction, and hydrothermal carbonization, can enhance the sludge’s energy potential. Co-pelletization, which involves blending sludge with high-calorific plastic waste (e.g., HDPE: 40 MJ/kg, PP: 42 MJ/kg, PS: 38 MJ/kg, LDPE: 31 MJ/kg, PET: 22 MJ/kg), could further increase its calorific value. With over 75% of Thailand’s plastic waste (approximately 2 million tons) being unused and often landfilled or openly burned [5], blending sludge with plastics for RDF production could address both waste streams simultaneously. This strategy aligns with both the Thai Waste Management Action Plan Phase 2 (2022–2027) and the Plastic Waste Management Action Plan Phase 2 (2023–2027), which emphasizes maximizing material and energy recovery. Plastic waste for RDF could be sourced from current and legacy waste through landfill mining, offering additional benefits such as landfill space recovery, pollution mitigation, and resource extraction. Regarding the economic feasibility of landfill mining projects, government financial incentives, such as subsidies or tax credits, are crucial in Thailand. The project requires an investment of USD 2–5 million, with costs for mined RDF ranging from USD 50 to USD 100 per ton, while RDF recovered from municipal solid waste (MSW) averages USD 30 to USD 50 per ton [6].
Co-pelletization has been studied with several materials. However, there is still a lack of studies on co-pelletization using seafood-processing sludge and plastic waste. Laosena et al. [7] created mixed pellets using landfill-mined RDF and rubber wood without any added binder. These mixed pellets, containing 50% RDF and 50% wood, improved their calorific value to 21 MJ/kg, which represents a 22% increase compared to wood pellets, and exhibited the highest mechanical durability. However, it is important to note that the chlorine content significantly increased with a higher RDF ratio. Rezaei et al. [8] produced pellets by mixing various mass fractions of paper, plastic, household organic waste, and wood. Increasing the plastic ratio to 40% raised the pellets’ calorific value to 30 MJ/kg. Additionally, increasing the die temperature from 80 °C to 100 °C, which exceeds the plastic’s softening point, enhanced mechanical durability.
This study investigates the optimal conditions for the co-pelletization of seafood-processing sludge with landfill-mined plastic waste to produce RDF pellets. The hypothesis is that plastic waste will enhance the sludge’s calorific value, while the sludge may reduce harmful components (e.g., heavy metals and chlorine) in the plastics. Furthermore, the study compares the environmental impacts of various RDF blends, particularly concerning heavy metals and CO2 emissions, with the current industry’s reliance on coal.

2. Materials and Methods

2.1. Materials

Sludge and plastic waste were used in this study. The sludge was collected from a wastewater treatment facility of a seafood processing factory in Samut Sakhon province, Thailand. Bituminous coals, used in the factory’s steam generation, were also sampled to calculate greenhouse gas (GHG) emissions. The plastic waste was collected from an RDF production plant in Samut Prakan province, Thailand. The RDF, namely coarse RDF, was produced from a 3-year-old landfilled MSW. The MSW was excavated from a controlled dump and processed by mechanical treatment. The treatment procedures comprised (I) trommel screens to separate soil, (II) hand sorting to separate recyclable waste, (III) magnetic separators, (IV) wind shifters to separate glass, and (V) spinners to separate fine organics. The sludge and plastic waste were prepared by drying at 105 °C and 70 °C, respectively. The dried samples were milled to pass a 2 mm sieve using a cutting mill (Retsch, SM 300, Haan, Germany).

2.2. Pelletization

Mixing ratio, mold temperature, and compression pressure were studied for suitable conditions. The dried sludge was prepared to be 10 wt% wet basis (wb) of moisture content mixed with deionized water. The mixing ratios of sludge per plastic waste were 50:50, 75:25, and 100:0 wt%. The mold temperature was set at 100 °C and 120 °C. Compression pressure of 60 and 80 MPa was investigated. The obtained pellets were labeled according to the corresponding experimental conditions. For example, R100-T120-P60 meant that the mixing ratio (R) was 100 wt% sludge and 0 wt% plastic waste, the mold temperature (T) was 120 °C, and the compression pressure (P) was 60 MPa. A single pellet press unit made the co-pellets of sludge and plastic waste. The apparatus included (I) a cylindrical stainless mold, (II) a stainless piston, (III) a heater connected to the mold, and (IV) a hydraulic press (Toyo, Thailand). About 2 g of mixed materials were filled in the hole of the heated mold to make a single pellet. The average size of the produced pellets was approximately 8 mm in diameter and 30 mm in length.

2.3. Chemical and Physical Analysis

The raw materials were analyzed for glass transition temperature and melting point by a differential scanning calorimeter (NETZSCH, DSC 204 F1 Phoenix, Mannheim, Germany). The testing was performed between 25 °C and 300 °C with a 10 °C/minute heating rate in an N2 condition. The uniaxial compressive strength of the produced pellets was tested using a universal testing machine (Zwick/Roell, zwickiLine Z1.0, Ulm, Germany). The deformation speed of 1 mm/minute was applied. For each test, force-displacement data were collected from the start until a 20% drop in the force value after failure. Equations (1) and (2) were used to calculate the stress (σ) and strain (ε) values, respectively. The peak stress, the pellet crack point, represented the compressive strength value.
σ = F/πr2
ε = (l0l)/l0
where F represents the force, r represents the pellet radius, l0 represents the initial pellet length, and l represents the pellet length at the corresponding time.
The raw materials and the pellets were measured through proximate analysis for volatile matter (VM), ash content, and fixed carbon (FC). The ash content was analyzed based on ASTM D3174-12 [9], but the final temperature was 900 °C, following ASTM D5630-13 [10]. The VM was analyzed based on ASTM D3175-20 [11], but the maintained temperature was 900 °C, following ISO 22167 [12]. The FC content was calculated by subtracting 100% from the total VM and ash content amount. The samples were analyzed using an elemental analyzer (Elementar, vario MACRO cube, Langenselbold, Germany) for H, C, S, and N content. The O content was measured using an oxygen analyzer (Elementar, rapid OXY cube, Germany). Total chlorine was analyzed based on ASTM D4208-19 [13]. A mercury analyzer model MA-300 (Nippon Instruments Corporation, Kyoto, Japan) was used for Hg content analysis. Inductively coupled plasma-optical emission spectroscopy model Optima 8300 (PerkinElmer, Shelton, CT, USA) analyzed the content of Na, K, V, Mn, Cr, Co, Pb, Sb, Cd, As, Cu, and Ni. The other elements were analyzed using an X-ray fluorescence analyzer model Niton XL3t GOLDD+ (Thermo Fisher Scientific, Waltham, MA, USA). The samples’ gross calorific value (GCV) was computed from the C, H, O, N, and S content using an equation shown in Equation (3) [14]. The pellets’ net calorific value (NCV) was calculated from the GCV using an equation from ISO 21654 [15], as shown in Equation (4).
GCV = 0.3708C + 1.1124H − 0.1391O + 0.3178N + 0.1391S
where GCV represents the calorific value of the dry matter (expressed in MJ/kg) and the mass fractions of H, C, N, O, and S content on a percent-of-dry basis.
NCV = (GCV − 0.2122H − 0.0008O − 0.0008N) × (1 − 0.01M) − 0.02443M
where NCV is the calorific value of the materials with moisture content M, in MJ/kg; and M is the moisture mass fraction, on a percent-of-wet basis.

2.4. Estimation of CO2 Emission Factors of Solid Fuels

CO2 emission factors for combustion of the studied pellets and plastic waste were estimated by referring to the 2006 IPCC Guidelines for National Greenhouse Gas Inventories [16], Volume 5 (Waste), and Volume 2 (Energy). Fossil CO2 emissions were calculated using Equations (5) and (6), while the factors of coal were reviewed from the literature.
EFfuel = CO2 Emissionsfuel/NCVfuel
EmissionsCO2, fuel = ∑i (WFi × dmi × CFi × FCFi × OFi) × (44/12)
where EFfuel represents the CO2 emission factor of solid fuels (kg CO2/GJ); EmissionsCO2, fuel is emissions of CO2 by different solid fuels (kg CO2/kg); WFi represents the fraction of material of component i in solid fuels (as wet weight pelletized for pellets); i represents components of the solid fuel such as sludge and plastic waste; dm i represents the fraction of dry matter content in component i; CFi represents the fraction of carbon content in the dry matter of component i; FCFi represents the fraction of fossil carbon in the total carbon of component i (assumed as 1 for plastics and 0 for sludge); and OFi represents default carbon oxidation factor, which was set as 1; 44/12 is the conversion factor from C to CO2.

2.5. Estimation of GHG Emissions from Treatment and Disposal Scenarios

Pelletization and combustion of R100, R75, and R50 pellets were the main scenarios for the GHG estimation. These scenarios include the same processes: sludge drying, RDF mining, mechanical treatment, pelletization, and combustion. The treatment and disposal methods of the dewatered sludge and landfill-mined RDF were decided based on each factory source’s business-as-usual (BAU) situation. Hence, the sludge landfilling, coarse RDF production, and combustion can be considered a baseline scenario. Emissions from transportation were not calculated as they were outside the scope of this study. Moreover, for comparison of the results, the coal scenario was estimated using literature values. This study’s critical GHG estimation reference is the 2006 IPCC Guidelines for National Greenhouse Gas Inventories [16]. The 100-year global warming potential (GWP) was used 265 for N2O, 28 for CH4, and 1 for CO2 [17]. The final results were expressed in the unit of kg CO2 equivalent (CO2-eq) per kg of the solid fuels and kg CO2-eq per GJ of the solid fuels. The following sections and Table 1 describe the details of each treatment and disposal.

2.5.1. Dewatered Sludge Landfilling

The emissions were estimated based on the data from the case plant, which generated the dewatered sludge of 3750 tons per year. The sludge from the seafood processing factory was disposed of in a sanitary landfill. The GHG emissions were calculated using the “IPCC Waste Model” according to the first-order decay method [16]. Degradable organic carbon (DOC) used the carbon content of the studied sludge, and a fraction of DOC dissimilated (DOCf) was selected for highly decomposable waste. The methane correction factor (MCF) and oxidation factor (OF) were chosen at the values that 100% of the generated sludge was dealt with managed solid waste disposal sites with covered material. Other parameters were set to their IPCC default value under moist and wet tropical conditions. The CH4 emissions from landfills were not collected for energy recovery or flared.

2.5.2. RDF Production and Combustion

GHG emissions of the RDF scenario were calculated assuming that the landfilled MSW was excavated and processed by mechanical treatment to produce coarse RDF, which were subsequently combusted to produce energy. As shown in Equation (7), the calculation consists of emissions from landfill mining, RDF production with mechanical treatment, and combustion. The emissions were estimated based on data from the case plant, which has the capacity to produce 400 tons/day of coarse RDF. As shown in Equation (8), the emissions from landfill mining contributed to diesel consumption by excavators and loaders. The emissions from the coarse RDF production, as shown in Equation (9), were contributed by diesel consumption by loaders and electricity consumption by machinery. This study did not assess rejected materials. The emissions from combustion were calculated using the Equation (10). The N2O and CH4 emissions were estimated following Equation (11). CO2 emissions were estimated following the Equation (6). The coarse RDF composition of the case study referred to the results of waste sampling and analysis conducted in previous work by Wulyapash et al. [20].
EmissionsRDF scenario = Emissionslandfill mining + EmissionsRDF prod. + Emissionscombustion
Emissionslandfill mining = FClandfill mining, diesel × NCVdiesel × EFdiesel
EmissionsRDF prod. = (FCRDF prod., diesel × NCVdiesel × EFdiesel) + (ECRDF prod. × EFEC)
Emissionscombustion = ∑fuel (EmissionsGHG, fuel × GWPGHG)
EmissionsGHG, fuel = NCVfuel × EFGHG, fuel
where FC is fuel consumption for diesel in landfill mining and RDF production, EFEC is a national grid emission factor for the electricity consumer [19], ECRDF prod. is electricity consumption in the RDF production processes, EmissionsGHG, fuel is emissions of given GHGs in solid fuels, and EFGHG, fuel is the IPCC’s default emission factor of a given GHG.

2.5.3. Pellet Production and Combustion

GHG emissions of the pellet scenario, as shown in Equation (12), were calculated assuming the sludge and the coarse RDF from BAU were further processed to produce the R100, R75, and R50 pellets, which were subsequently combusted. Emissions from landfill mining and RDF production used the results of the RDF scenario, and the emissions from the combustion were calculated using the same method described in the RDF scenario. To make the emission calculations consistent with this laboratory study, the coarse RDF from BAU was assumed to be further separated and milled for plastic waste preparation, as shown in Equation (13). Emissions from sludge preparation, as shown in Equation (14), were estimated assuming the dewatered sludge was dried using hot air and then milled. The sludge was dried in an electric dryer with an energy consumption of 3.3 MJ/kg [24]. The prepared materials were then sent to the pelletization. Emissions from the pelletization, as shown in Equation (15), were calculated from mixing and pelletizing processes.
Emissionspellet scenario = ((((Emissionslandfill mining + EmissionsRDF prod.)/0.72) + Emissionsplastic prep) × WFplastic) +
(Emissionssludge prep × WFsludge) + Emissionspelletization + Emissionscombustion
Emissionsplastic prep = ((ECseparate/0.72) + ECmilling) × EFEC
Emissionssludge prep = (ECdrying + ECmilling) × EFEC
Emissionspelletization = (ECmixing + ECpelletizing) × EFEC
where 0.72 is the faction of plastic composition in RDF used to convert results per ton RDF to results per ton plastic waste.

2.5.4. Coal Mining and Combustion

The coal scenario’s GHG emissions were estimated from mining and combustion. The emissions of coal production at the surface mine refer to TGO [23]. NCV of bituminous coal was 0.0258 GJ/kg [16]. Emission factors of bituminous coal are referred to by the IPCC [16].

3. Results and Discussion

3.1. Characteristics of the Sludge and Plastic Waste

The thermal and chemical characteristics of the raw materials are listed in Table 2. The results indicated that the ash content of both samples was within the acceptable range for waste-derived fuels at <15%, following CEN/TR 15508 [25]. The main combustible content was VM, while FC was low, particularly in plastic waste. The materials could be easily ignited in the initial stage and burned out at low temperatures because of the thermal decomposition behavior of VM. Ignition and burnout temperatures were, respectively, 385 °C and 460 °C for plastic waste and 200 °C and 510 °C for sludge [24]. The GCV of the sludge was 20 MJ/kg, comparable to sub-bituminous coal, which has a GCV of 20–25 MJ/kg [26]. The GCV of plastic waste (36 MJ/kg) aligns with recovered plastic wastes (33–41 MJ/kg) from dumpsites in Thailand [27]. The high GCV of plastic was comparable to that of anthracite, which is 35 MJ/kg [28]. Both sludge and plastic wastes have distinctive GCVs that can be used as energy sources. Furthermore, the recovered plastic cannot produce high-quality recycled material due to the high level of impurities embedded in the plastics [29].
Elemental contents can predict the characteristics of pellet products. The sludge and plastic waste contained approximately 45% and 59% C content, respectively. The high C proportion makes it attractive for combustion. The Ca content in the sludge may enhance the compressive strength of pellets because the reaction between CaO and water can promote binding mechanisms [30]. The S concentration was higher in sludge (1.6%) than in plastic waste (0.4%). The P contents of the sludge and plastic waste were 1.8% and 0.2%, respectively, which is considered average compared to other studies that range from 0.03% to 7.1% [31]. The sludge had high S and P concentrations because these elements are naturally present in various organic materials, living organisms, and food fractions [32]. Si contents in the sludge and plastic waste were 0.3% and 1.0%, respectively. The higher level of Si in excavated plastic waste is probably related to impurities, such as soil and sand particles. However, the Si content of solid fuels can range from 0.2% to 21% [31].
The classification of solid recovered fuel (SRF) based on the ISO 21640 [33] standard assigns an environmental characteristic for mercury and a technical characteristic for chlorine content. The Hg content of the sludge, calculated at 10 wt%wb moisture content, was 0.03 mg/MJ as received (ar) and 0.02 mg/MJar for the plastic waste. The Hg values were within the 0.15 mg/MJar range required to meet the SRF standard. The sludge and plastic waste represent potential fuels that can be used to address the environmental issue of Hg. The Cl content of the plastic waste and sludge was 8.9 and 2.3 wt%db, respectively. According to the SRF classes standard, the mean value of Cl content must be less than 3 wt%db. The high Cl content of the plastic waste could be problematic. However, the relatively high carbon content and GCV indicate potential for solid fuel application. Using plastic waste as an auxiliary fuel or mixing it with other fuels could be an alternative strategy.
The feedstocks’ melting point and glass transition temperature were analyzed to determine the temperature range for compacting used in pelletizing experiments. The compacting temperature near the glass transition temperature improves plastic deformation and creates permanent bonds between particles by forming solid bridges upon cooling [34]. The compacting temperature within the melting point range can prevent the melted plastics from sticking in the mold. Therefore, mold temperatures of 100 °C and 120 °C were chosen for the co-pelletization experiment.

3.2. Characteristics of Pellets

3.2.1. Compressive Strength

A pellet’s compressive strength (CS) is the maximum load it can withstand before breaking under destructive force. CS evaluates the compressive stress caused by the weight of the top pellets on the lower pellets during transport, handling, and storage. High pellet hardness indicates a low release rate of volatiles, resulting in stable combustion [35]. The variance in CS values is significantly related to the type of feedstock type. The CS value of pellets made from sludge-mixed banana peel ranged from 5.8 to 13.4 MPa [36], while those produced from wood ranged from 8.3 to 32.3 MPa [37]. In this study, the CS values ranged from 5.9 MPa to 16.4 MPa, with the lowest and highest values observed under the pelletizing conditions of R100-T120-P60 and R75-T100-P80, respectively. The effects of the mixing ratio, mold temperature, and compression pressure on pellets are illustrated in Figure 1. As indicated by the standard deviations, there is considerable variation in the experimental CS values. Gilvari et al. [37] explained that this variation is due to pellet heterogeneity, such as differences in porosity and the number and orientation of microcracks. The one-way analysis of variance (ANOVA) results showed that CS significantly differed in response to the mixing ratio, with a p-value of 0.02 at a confidence level of 95%.
Under applied pressure and heat, natural binders (e.g., protein, carbohydrate, fat, and water) are squeezed out of the particles and activated. The water in the sludge acted as a binder and lubricant in the pelleting process [36], while protein played a crucial role in forming solid bridges between the microparticles. The denaturation temperatures of proteins exceed 57 °C [38]. Therefore, the mold temperatures of both 100 °C and 120 °C contributed to squeezing sludge particles into the gaps and voids of the plastic particles. Consequently, the pellets produced at both temperatures showed an insignificant difference, with a p-value of 0.14. The CS values at compression pressures of 60 MPa and 80 MPa were nearly identical, with a p-value of 0.93. Okot et al. [39] reported that increased compression pressure was linked to a rise in interparticle bonds due to increased cohesive force. However, above the optimal compacting pressure, dilation occurs, causing cracks in the pellets and weakening them. The preliminary test studied compression pressure at 100 MPa. The surface of the P100 pellets showed many cracks, indicating that maximum interparticle bonding was achieved at compacting pressures ranging from 60 to 80 MPa.
The stress–strain curves are presented in Figure 2. The curves can be categorized into three groups correlating with the strain tendencies. R100 (Figure 2a) showed minimal strain change, with a steep drop in stress after peak stress, indicating brittle behavior. R50 (Figure 2c) exhibited ductile behavior, characterized by progressive loading and gradual collapse at large strain displacements. Bui et al. [40] found that plastic particles acted as crack arresters, bridging cracks and improving crack resistance and ductility. R75 (Figure 2b) showed middle ductility and high rigid behavior, with the highest CS value of 15.9–16.4 MPa for R75-T100. For R75 pellets, the CS increased significantly by approximately 5–176% compared to R100 pellets, while CS values in R50 pellets were up to 131% higher than those of R100 pellets. The mixed plastic pellets improved physical properties by acting as a supplementary binding agent [41]. However, the findings highlighted that CS values improved with the addition of plastic waste up to 25 wt%; beyond that, a reduction trend was observed for plastic percentages of 50 wt%, aligning with the findings of Bahij et al. [42].

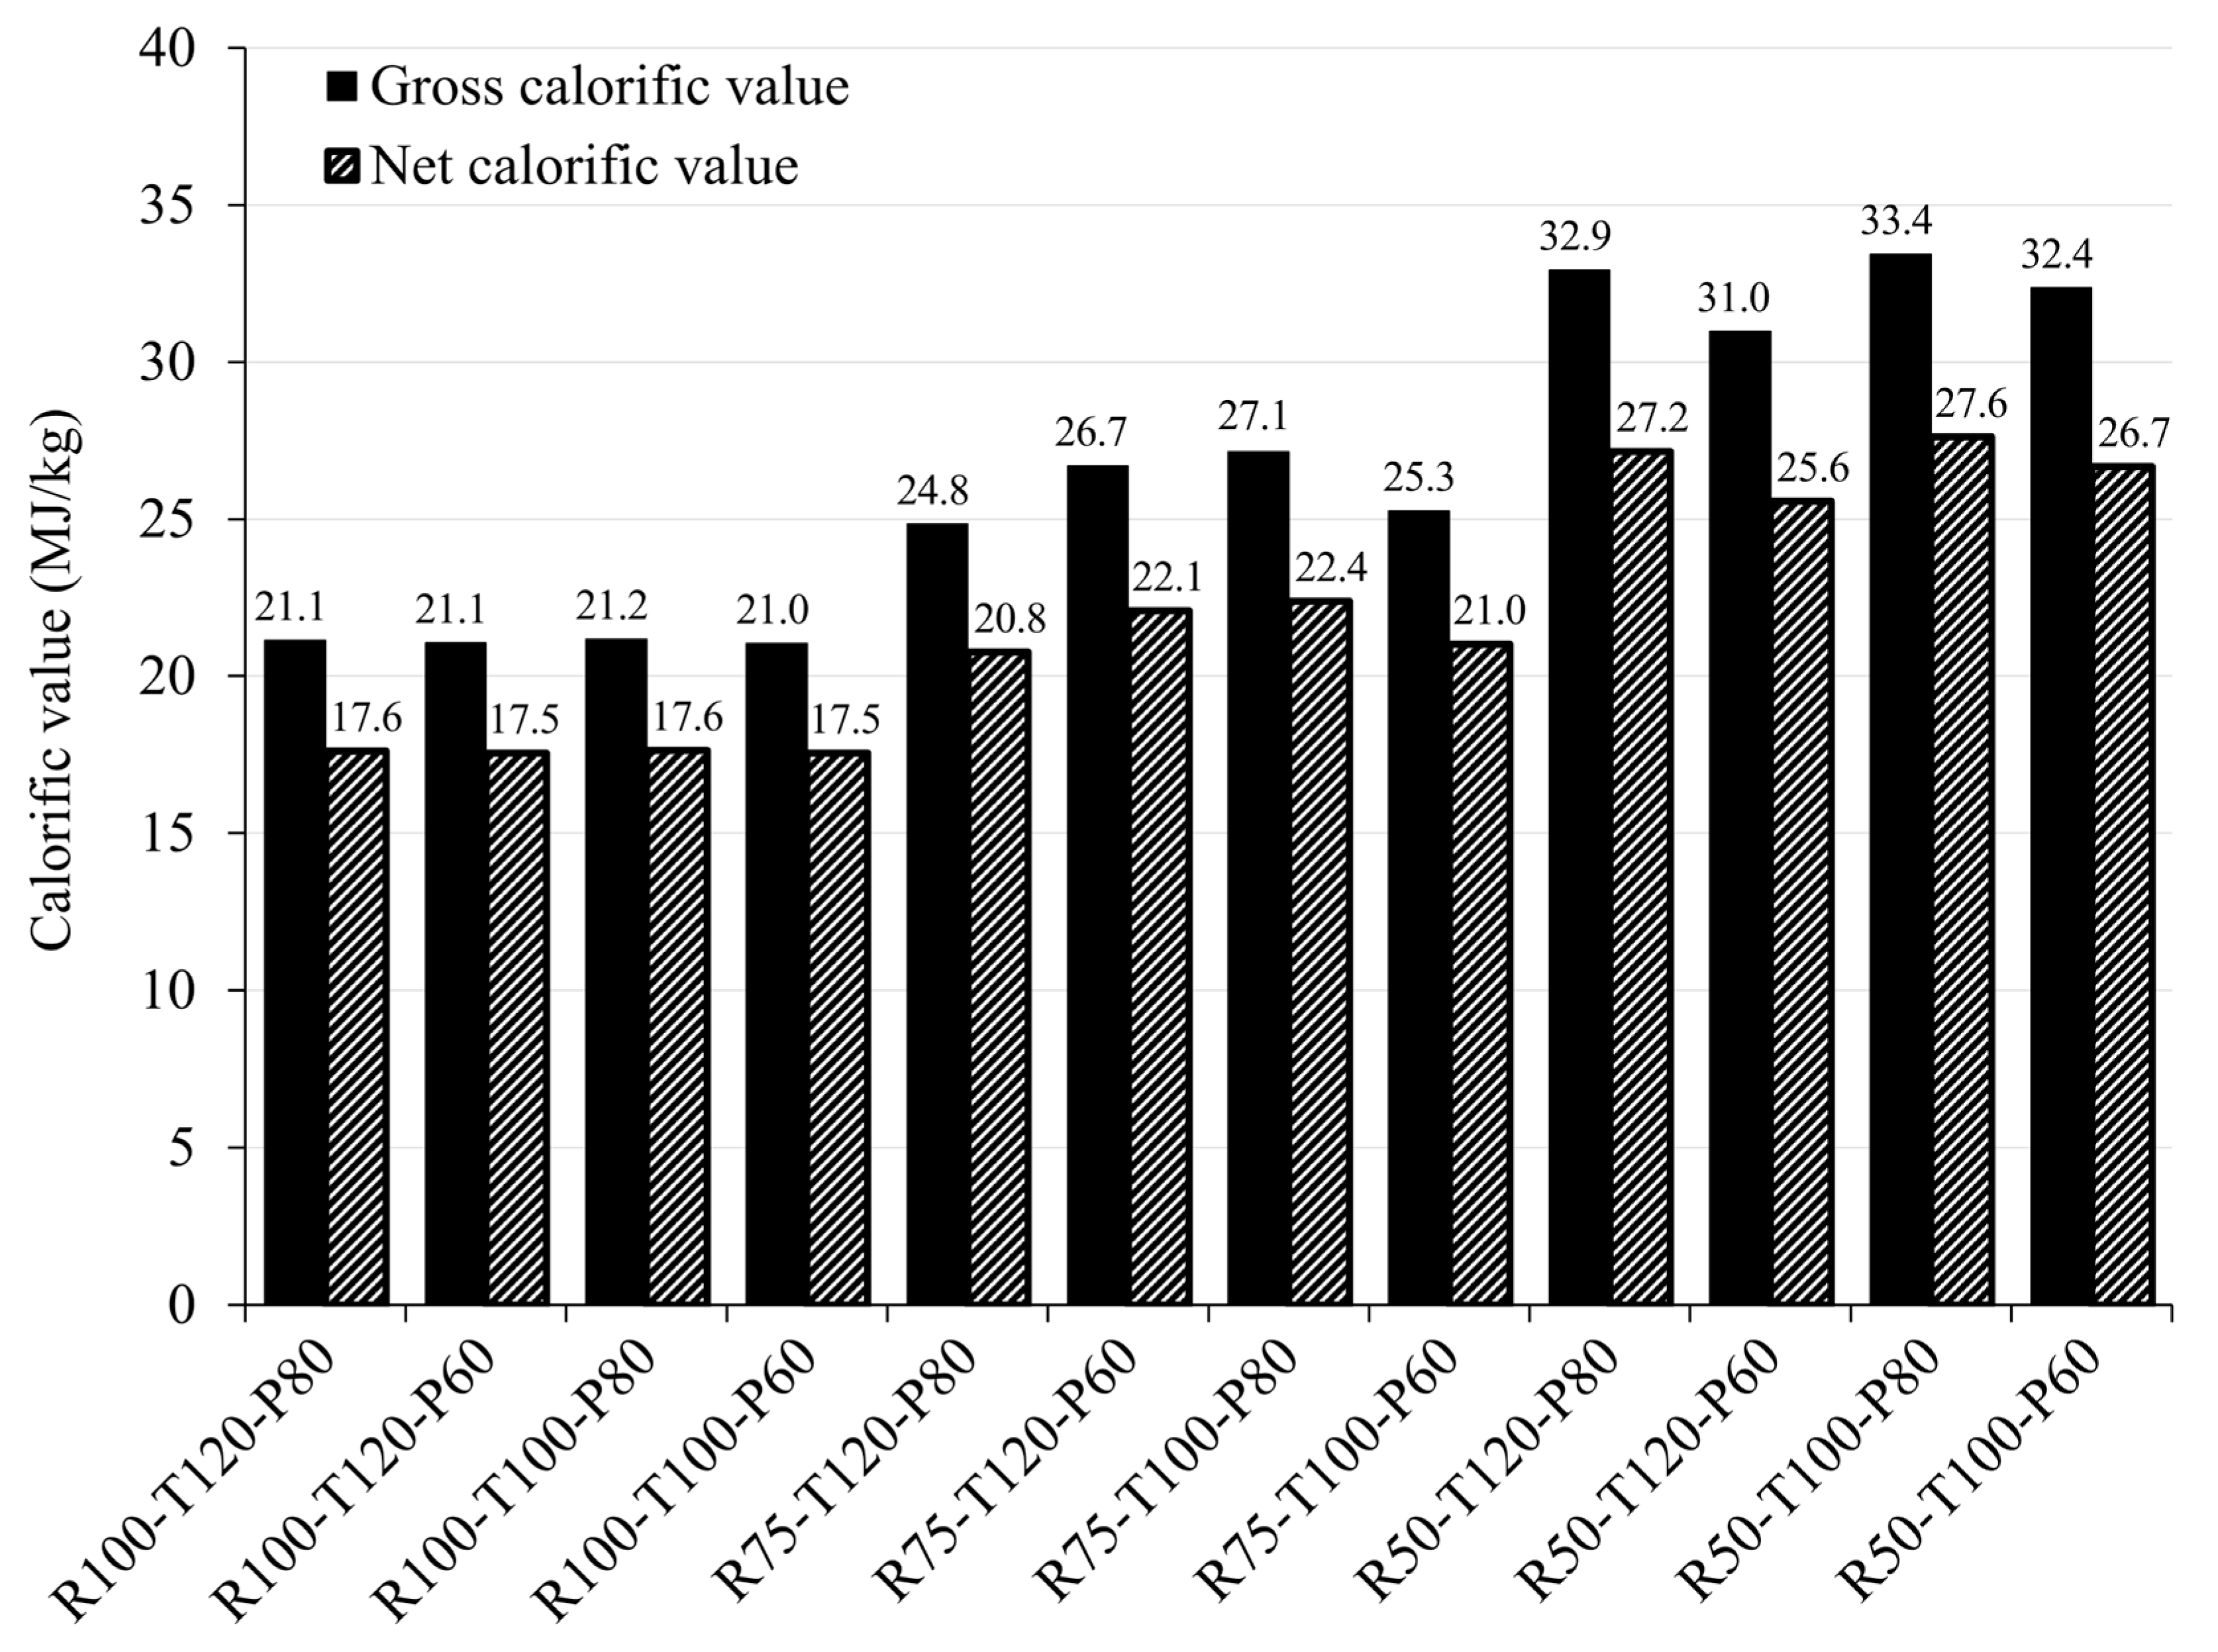
3.2.2. Calorific Value

The GCV and NCV of pellets under different operating conditions are illustrated in Figure 3. Increasing the plastic waste content from 0 to 50 wt% significantly raised the GCV from 21.10 ± 0.07 MJ/kg to 32.43 ± 1.06 MJ/kg. The results indicate that the calorific value of pellets improved considerably with the increasing mass percentage of plastic waste. However, it remains nearly unchanged when the mold temperature and compression pressure are varied. The energy enrichment factor (EEF), which measures energy densification in pellets, is the ratio of the calorific value of the produced pellets to the calorific value of raw materials. An EEF value of >1 indicates improved energy densification in pellets [43]. The EEF value of all pellets was above 1, indicating good energy densification. Therefore, maintaining production conditions to sustain calorific value is key to scaling up the industrial process. The mixing ratio and drying temperature are critical factors. For instance, plastic waste should be dried below 79 °C to avoid reaching its glass transition temperature, and sludge should be dried below 120 °C to prevent devolatilization. The NCV of pellets in this study, ranging from 17.55 to 27.61 MJ/kg, is comparable to that of SRF classified in the ISO 21640 standard [33], which includes SRF class 1 (≥25 MJ/kg), SRF class 2 (≥20 MJ/kg), and SRF class 3 (≥15 MJ/kg). The addition of plastic waste positively influences the calorific value of pellets, allowing more energy to be generated from the same amount of fuel through blending. Alves et al. [22] reported that the GCV of municipal wastewater sludge and SRF were 18.8 and 24.7 MJ/kg, respectively. The mixture of 90 wt% SRF and 10 wt% sludge has a GCV of 24.1 MJ/kg. RDF is made from municipal sewage sludge mixed with olive and animal wastes; according to Yilmaz et al. [44], its GCV ranges from 9.46 to 15.80 MJ/kg.

3.2.3. Chemical Composition

The pellets must meet specific requirements regarding chemical elements to be applicable as solid fuel. Table 3 summarizes the chemical composition of pellets produced from sludge and plastic waste. The elemental content of the pellets depends on their mixing ratio. The results of the ANOVA indicated that the chemical composition did not significantly vary with temperature and pressure. The mixture of plastic waste also played a predominant role in determining the carbon and hydrogen proportions. The pellets contained 40–51% C content, contributing 40–42% for R100 pellets, 44–47% for R75 pellets, and 48–51% for R50 pellets. Similarly, H content was approximately 6% for R100 pellets, 8% for R75 pellets, and 10% for R50 pellets. The concentration of hydrocarbons significantly correlated with the calorific value. As hydrocarbons decreased, a decline in calorific value was observed, as illustrated in Figure 3. Yang et al. [45] reviewed the RDF classified standards of Italy and explained that the contents of potentially toxic elements should be ≤15 mg/kg for As, ≤600 mg/kg for Pb, ≤500 mg/kg for Cr, ≤100 mg/kg for Co, ≤600 mg/kg for Mn, ≤2000 mg/kg for Cu, ≤200 mg/kg for Ni, and ≤150 mg/kg for V. According to Italian standards, all pellet conditions displayed satisfactory results. Particularly for R50, it achieved the characteristics of SRF according to Italian Law D.M. 22/2013, which requires ≤9 mg/kg for As, ≤100 mg/kg for Cr, and ≤40 mg/kg for Ni [46].
In incineration, high sulfur and chlorine contents can lead to increased emissions of acidic gases, resulting in slagging and corrosion. The S content in the R100, R75, and R50 pellets was approximately 1.4 wt%db, 1.1 wt%db, and 0.7 wt%db, respectively. The S content of R50 pellets was relatively low compared to the 1 wt%db limit for RDF used in the Thai cement industry. In contrast, the total Cl content reached up to 17.1 wt%db, exceeding the 3 wt%db limit according to the SRF classified standard of ISO 21640 [33]. Plastic waste was the main source that contained a high proportion of Cl content. Chiemchaisri et al. [27] found that plastic carry bags contained a higher Cl content of more than 2.5% compared to other plastic wastes. Therefore, solutions for reducing chlorine must be considered. Combining RDF with other low chlorine-containing materials in thermochemical conversion is one alternative solution. For example, adding coal to RDF has proven to be a feasible solution for improving the combustion of RDF [47].

3.2.4. Intensity of Heavy Metals

Heavy metals in the studied pellets and reviewed coals, measured in mg of heavy metal per MJ of solid fuel, are displayed in Figure 4. The intensity of eight metals—Hg, Sb, Cd, Pb, Co, As, Ni, and Cr—is explicitly defined in RDF and SRF standards and measured in European countries such as Austria, Germany, Italy, and Switzerland. The Hg content of the pellets was 0.02–0.04 mg/MJar, lower than the Hg in lignite and higher than that of bituminous and mixed coals but still within the limit value of 0.15 mg/MJar required to meet the SRF standard of ISO 21640 [33]. The Sb level in R50 exceeds the level of Sb in coals, while the R75 shows better results than lignite and mixed coals. Trace amounts of Sb can be detected in PET used as a catalyst during production [48]. The contents of Cd, Co, As, Ni, and Cr in the pellets show similar tendencies. The heavy metals’ intensity decreased as the sludge mixing ratio decreased. The maximum decrease of 11–12 times for Ni, Cd, and Cr between R100 and R50 pellets is especially notable. These declining trends indicate that mixing with plastic waste might effectively dispose of the sludge. The Cd intensity of all pellets exceeds the values of the reviewed coals. However, the Cd level in R50 pellets is even below the limit value of 0.17–0.27 mg/MJ, as specified by the German SRF and Austrian RDF used for co-firing, co-combustion, and cement kilns [49]. The Cr results show that only R50 pellets varied in the range of lignite. However, the available Cr levels were well below the prescribed limits of Austrian RDF at 19–31 mg/MJ [49].
In summary, the heavy metal intensities of R75 and R50 pellets were comparable to those of the reviewed coals, especially the Hg, Pb, Co, As, and Ni levels in lignite. The most critical results are observed in the Cd content, as the Cd levels of all pellets exceed those of the reviewed coals. However, the Cd level in R50 pellets remains well below the prescribed limits of the reviewed RDF.

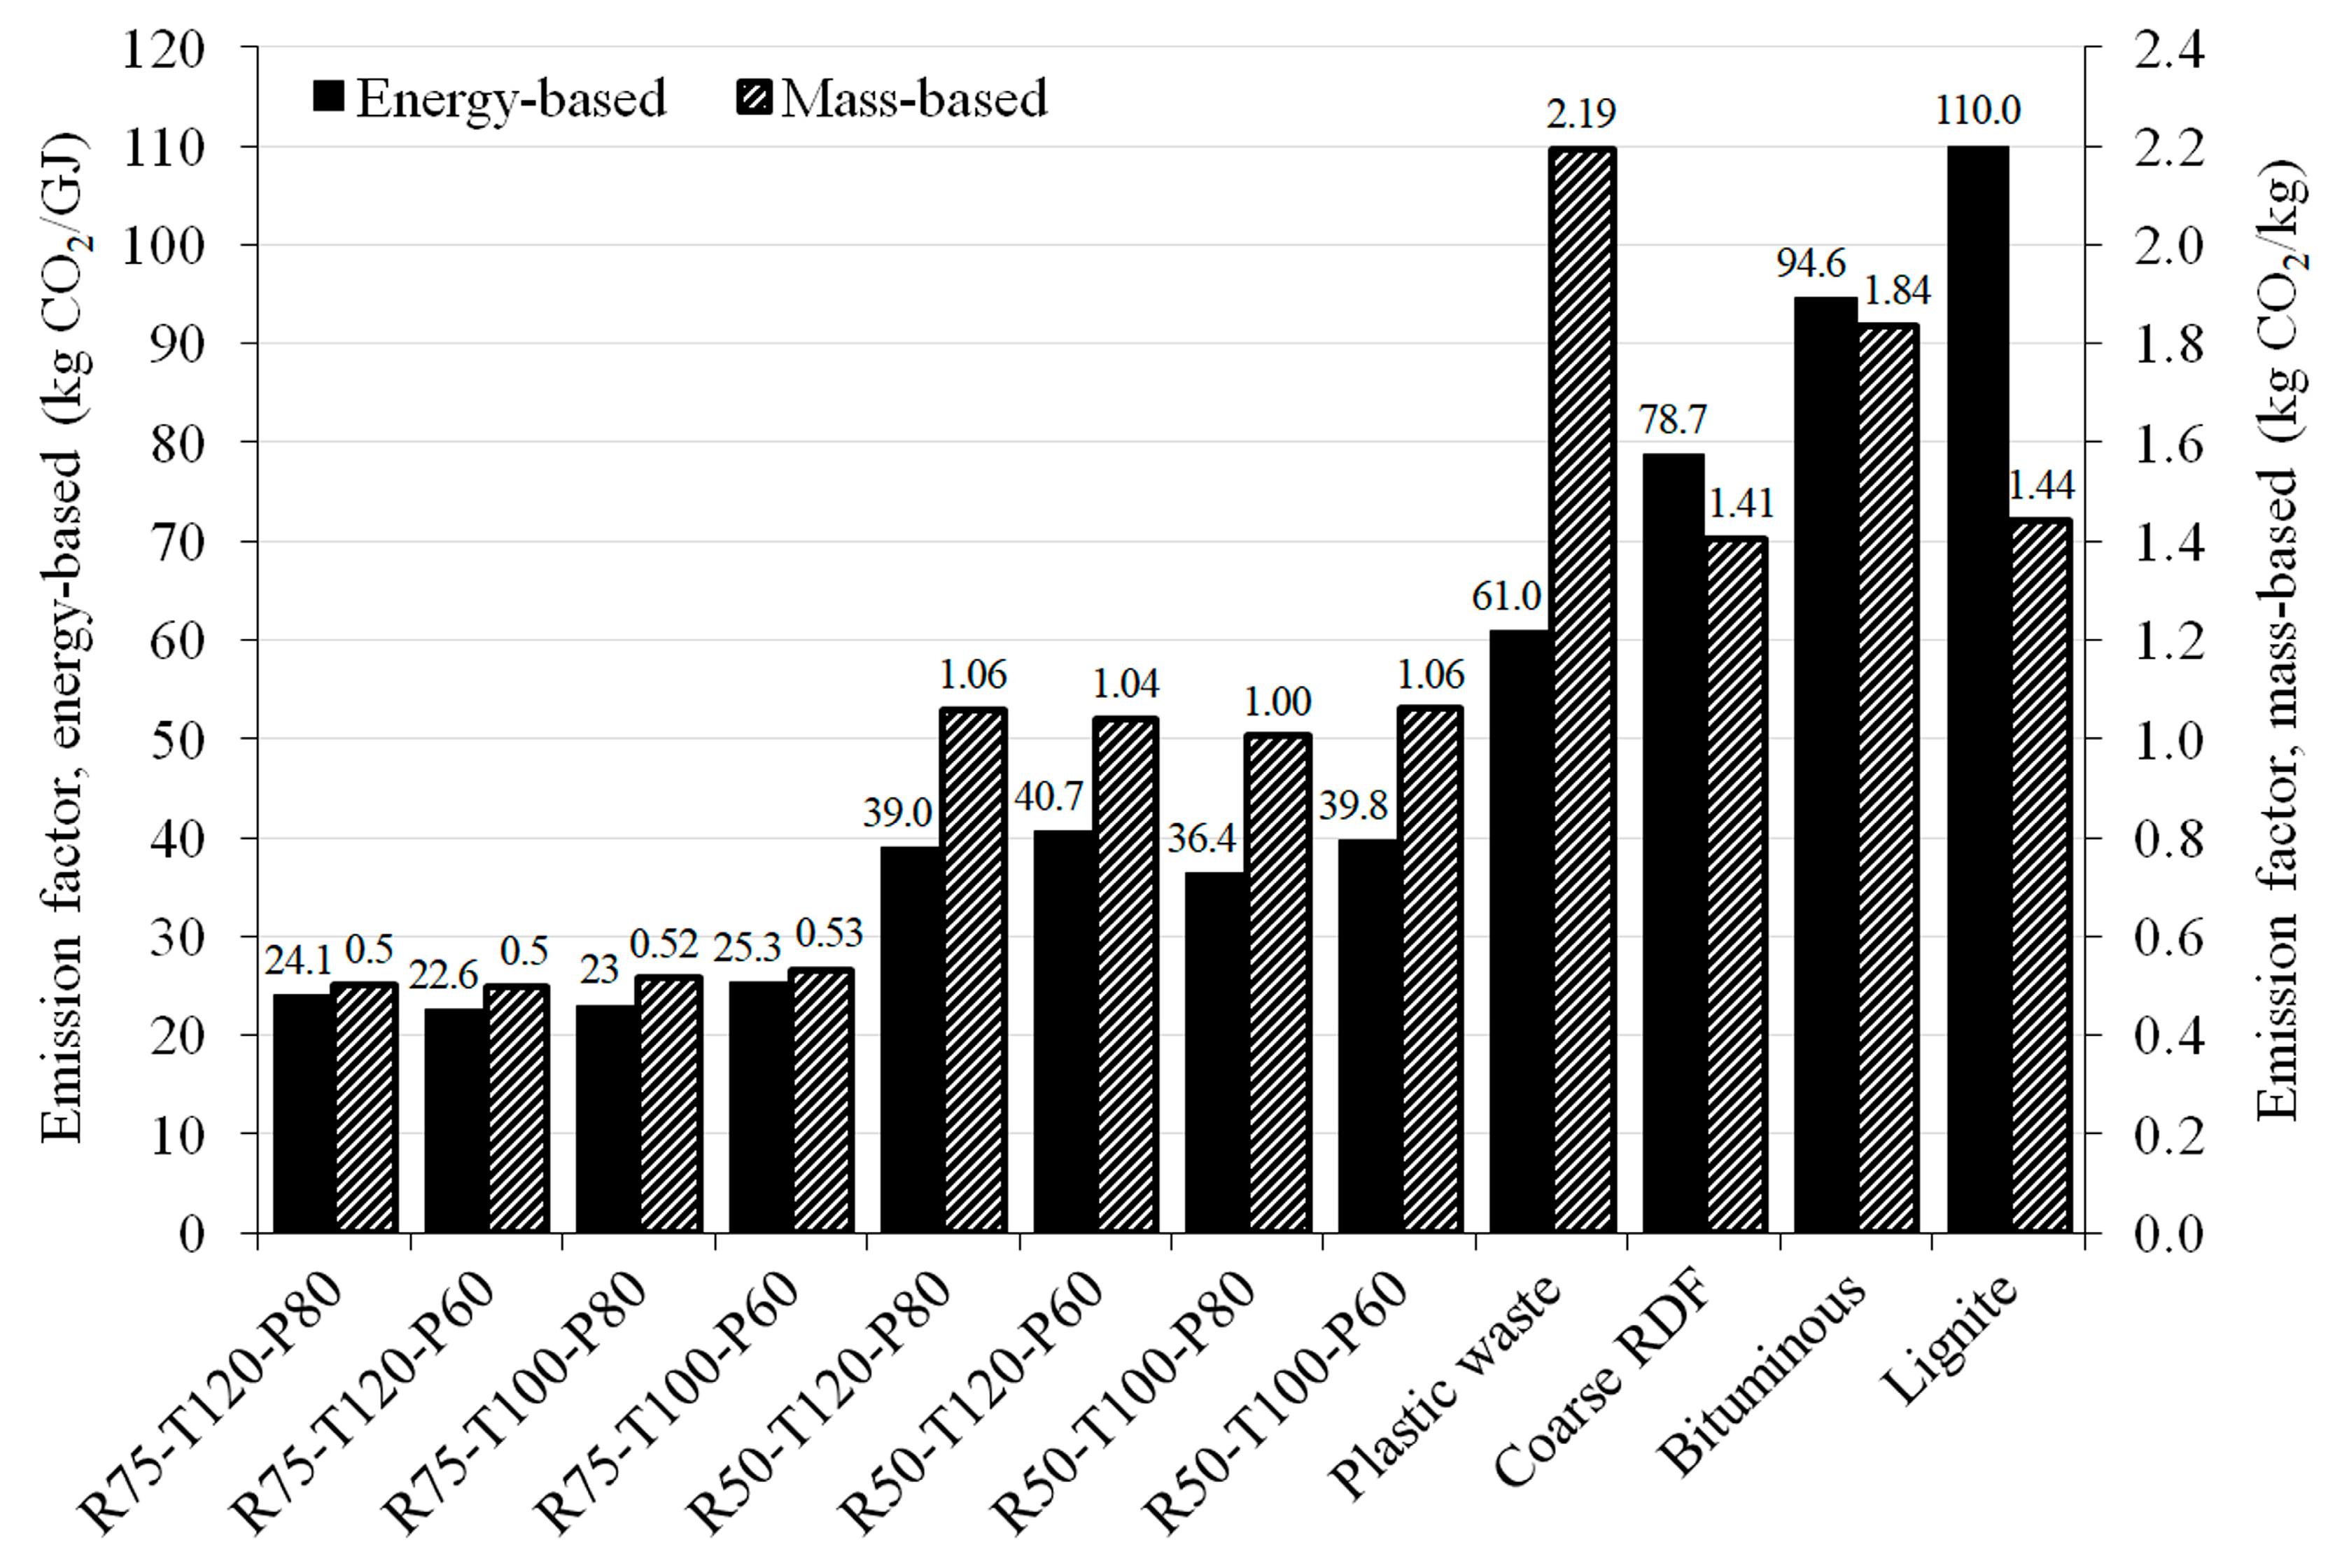
3.3. Emission Factors of Solid Fuels

CO2 emission factors for the combustion of pellets, plastic waste, coarse RDF, and literature coals are shown in Figure 5. R100 pellets are not presented in this case because they were classified as non-fossil CO2 emissions. The energy-based results indicate that the fossil CO2 emitted per GJ of heating value ranges from 23–25 kg for R75 and 36–41 kg for R50. When comparing the findings with those of Schwarzbock et al. [50], the emission factors of RDF from Austria, Finland, Denmark, and Sweden were 43, 40, 37, and 33 kg CO2/GJ, respectively. Moreover, the results for plastic waste and coarse RDF are noteworthy. The mass-based CO2-emission factor of plastic waste is higher than that of coarse RDF due to the higher fossil content in the plastic waste, but the energy-based CO2-emission factor depicts the inverse results. This observation is reflected by the fact that plastic waste has a higher calorific value than coarse RDF, approximately 1.8 times greater, with a difference of around 16 MJ/kg. Thus, this difference in calorific value explains the lower energy-based CO2-emission factor for plastic waste compared to coarse RDF. This inverse trend is also observed between bituminous coal and lignite.

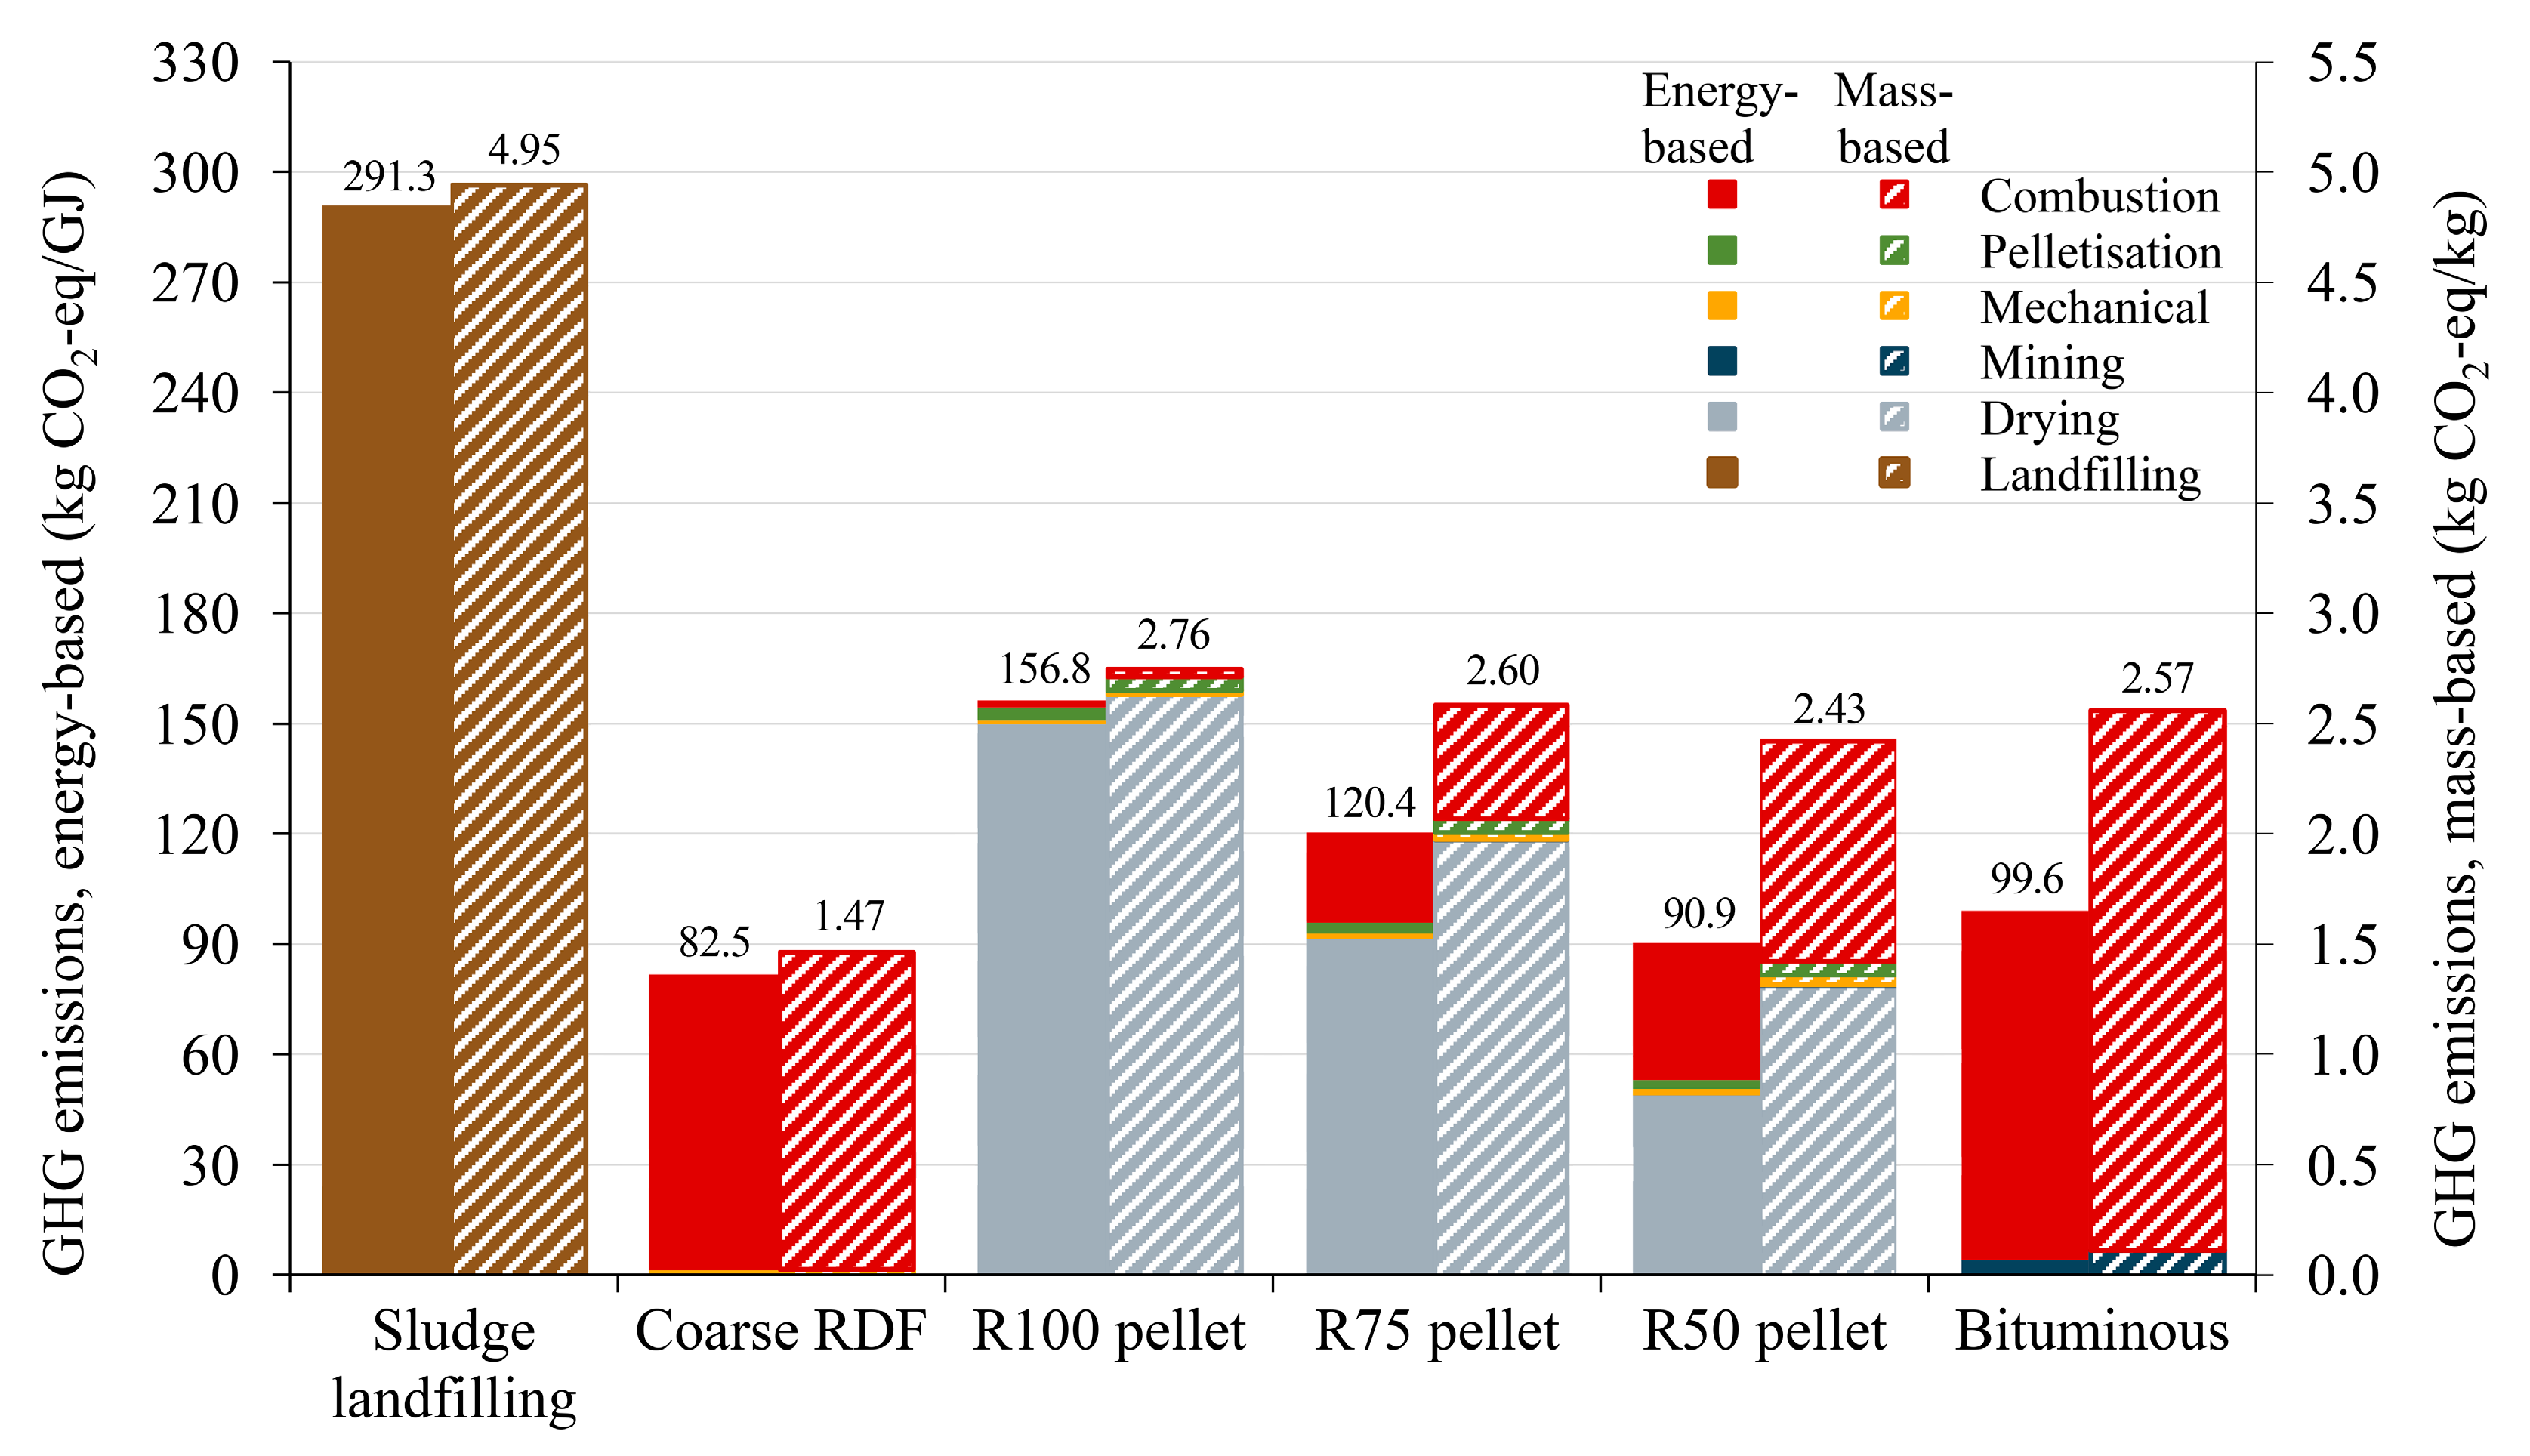
3.4. GHG Emissions from Treatment and Disposal Scenarios

GHG emissions for mass-based and energy-based scenarios are illustrated in Figure 6. Sludge landfilling produced the highest GHG emissions at 291 kg CO2-eq/GJ. In contrast, coarse RDF production emitted the lowest emissions at 82 kg CO2-eq/GJ. The high amount of emissions from the sludge scenarios was primarily caused by methane released during the landfilling of organic content. As discussed in topic 2.5, sludge landfilling and coarse RDF scenarios were assumed to be the baseline scenarios. When comparing the GHG emissions of the pellet scenarios to the baseline, the results show that the R100, R75, and R50 scenarios reduce GHG emissions by 44.3%, 36.5%, and 24.3%, respectively. The potential for GHG reduction mainly results from diverting sludge from landfills to incineration. Co-pelletization with plastic waste revealed a significant decreasing trend in GHG emissions. Although mixing plastic waste increased GHG emissions during combustion by 15–30 times compared to the pure sludge pellet, the R75 and R50 scenarios decreased sludge drying, reducing GHG emissions by 36.5–65.9 kg CO2-eq/GJ or up to 42% compared to R100. According to the results, the R50 scenario also showed lower GHG emissions than the coal scenario, despite not including avoided emissions from the baseline. The drying process in the pellet scenarios was very energy-intensive and greatly influenced total GHG emissions, accounting for 95.9%, 76.4%, and 54.4% for R100, R75, and R50, respectively. Consequently, implementing energy-saving drying technologies or alternative energy sources is crucial. Under these scenarios, they could potentially reduce GHG emissions by up to 150 kg CO2-eq/GJ. Chojnacka et al. [52] found that using renewable energy sources or hybrid drying methods can reduce non-renewable energy consumption by up to 80%. Waste heat recovery from combustion exhaust is a potentially helpful method. Compared to the scenarios in the current study, it might reduce energy consumption by 3–44% or GHG emissions by 2–66 kg CO2-eq/GJ.

4. Conclusions

The co-pelletization of sludge and plastic waste was studied. The pelletizing conditions of mixing ratio, mold temperature, and compression pressure were investigated. The mixing ratios of sludge per plastic waste were 50:50, 75:25, and 100:0 wt%. The mold temperature was set at 100 °C and 120 °C. Compression pressure ranged from 60 to 80 MPa. Wastewater sludge from seafood processing contained 20 MJ/kg of GCV, and landfill-mined plastic waste contained 35 MJ/kg of GCV. The co-pelletization results showed that the calorific value of pellets improved considerably as the mass percentage of plastic waste increased. The NCV of pellets, about 17.55–27.61 MJ/kg, is comparable with that of SRF class 1 to 3, making them suitable for use in energy processes. The lowest and highest CS values were found in the pelletizing conditions of R100 and R75, respectively. CS significantly differed in response to the variance mixing ratio. Mold temperature and compression pressure had insignificant effects on CS. The stress–strain curves also correlated with the mixing ratio. Adding plastic waste can compensate for the low CS caused by sludge. However, CS values improved with adding plastic waste up to 25 wt%; after that, a reduction trend was observed for plastic percentages of 50 wt%.
Chemical element results reiterate that the elemental contents of pellets depend on their mixing ratio. The mixture of plastic waste played a crucial factor in the carbon and hydrogen proportion. The Hg content of the raw sludge, plastic waste, and pellets was within the range required to meet the standard. Other heavy metal intensities of R75 and R50 pellets were comparable to the reviewed coals, especially the Pb, Co, As, and Ni levels in lignite. The Cd content in all pellets exceeded that of the reviewed coals, but R50 pellets remained within the prescribed RDF limits. The total content of Cl of plastic waste and pellets ranged from 8.0 wt%db to 17.1 wt%db, which could be problematic during combustion according to the SRF standard. An alternative strategy could be using the pellets with other fuels to co-fire or co-combust. Selective removal of PVC using near-infrared (NIR) sorting technology, which achieves 95% to 99% sorting accuracy [53], could be an option to reduce Cl in RDF and plastics. The ash-melting ratio of sludge, plastic waste, and pellets indicated that it causes no or fewer ash-related problems. At the same time, the aerosol emissions index could be predicted for medium aerosol emissions.
The study could be summarized as the mixing ratio being the predominant factor. A 75 wt% sludge mixture can produce pellets with high CS, indicating rigid and ductile behaviors. All pellets showed suitable performance following the standard and criteria for calorific value and chemical characteristics. The critical concern is the high value of Cl content. Regarding GWP, the pellets’ CO2 emission factors for combustion were comparable with those of the reviewed RDFs and lower than those of coals. The lowest emission factors are found for the R75 pellets (23–25 kg CO2/GJ). GHG emissions from the pellet scenarios were reduced by 24% to 44% compared to the baseline. However, sludge drying was very energy-intensive and emitted the highest share of up to 96% of total GHG emissions in the pellet scenarios. Therefore, implementing energy-saving drying technologies significantly challenges the commercialization of the pellet’s competitiveness.

Author Contributions

Conceptualization, W.W., A.P., J.F. and S.T.; methodology, W.W., A.P., J.F. and S.T.; validation, A.P., J.F. and S.T.; formal analysis, W.W.; investigation, W.W., A.P., J.F. and S.T.; resources, A.P., J.F. and S.T.; data curation, W.W.; writing—original draft preparation, W.W.; writing—review and editing, W.W., A.P., J.F. and S.T.; visualization, W.W.; supervision, A.P., J.F. and S.T.; project administration, A.P. and S.T.; funding acquisition, A.P., J.F. and S.T. All authors have read and agreed to the published version of the manuscript.

Funding

This research was funded by the Petchra Pra Jom Klao Ph.D. Research Scholarship (Grant no. 60300800208), the Joint Graduate School of Energy and Environment, King Mongkut’s University of Technology Thonburi; the Center of Excellence on Energy Technology and Environment, the Ministry of Higher Education, Science, Research, and Innovation; and the Institute for Water Quality and Resource Management, Vienna University of Technology.

Data Availability Statement

The data presented in this study are available upon request from the corresponding author based on reasonable request.

Acknowledgments

The authors would like to express gratitude to the Joint Graduate School of Energy and Environment (JGSEE), King Mongkut’s University of Technology Thonburi; and the Institute for Water Quality and Resource Management, Vienna University of Technology (TU Wien), for support for analytical instruments and laboratories. The authors sincerely thank the Thai companies in Samut Sakorn and Samut Prakan Province for their support in providing valuable information regarding the current waste management situation and samples of wastewater sludge, coal, and landfill-mined plastic waste.

Conflicts of Interest

The authors declare no conflicts of interest.

References

  1. Thai Tuna Industry Association. Thai Tuna Statistics of Import & Export in 2021–2023; Thai Tuna Industry Association: Bangkok, Thailand, 2024; pp. 11–13. [Google Scholar]
  2. Ketris, M.P.; Yudovich, Y.E. Estimations of Clarkes for carbonaceous biolithes: World averages for trace element contents in black shales and coals. Int. J. Coal Geol. 2009, 78, 135–148. [Google Scholar] [CrossRef]
  3. Tian, H.Z.; Lu, L.; Hao, J.M.; Gao, J.J.; Cheng, K.; Liu, K.Y.; Qiu, P.P.; Zhu, C.Y. A review of key hazardous trace elements in Chinese coals: Abundance, occurrence, behavior during coal combustion and their environmental impacts. Energy Fuels 2013, 27, 601–614. [Google Scholar] [CrossRef]
  4. Altikulac, A.; Turhan, S.; Kurnaz, A.; Goren, E.; Duran, C.; Hancerliogullari, A.; Ugur, F.A. Assessment of the enrichment of heavy metals in coal and its combustion residues. ACS Omega 2022, 7, 21239–21245. [Google Scholar] [CrossRef]
  5. Pollution Control Department. Thailand State of Pollution Report 2023; AP CONNEX Co., Ltd.: Bangkok, Thailand, 2024; pp. 126–129. [Google Scholar]
  6. Muttaraid, A.; Towprayoon, S.; Chiemchaisri, C.; Silalertruksa, T.; Wangyao, K. Enhanced landfill mining in Thailand: Policy implications from qualitative case study analysis. Sustainability 2024, 16, 11181. [Google Scholar] [CrossRef]
  7. Laosena, R.; Palamanit, A.; Luengchavanon, M.; Kittijaruwattana, J.; Nakason, C.; Lee, S.H.; Chotikhun, A. Characterization of mixed pellets made from rubberwood (Hevea brasiliensis) and refuse-derived fuel (RDF) waste as pellet fuel. Materials 2022, 15, 3093. [Google Scholar] [CrossRef]
  8. Rezaei, H.; Yazdan Panah, F.; Lim, C.J.; Sokhansanj, S. Pelletization of refuse-derived fuel with varying compositions of plastic, paper, organic and wood. Sustainability 2020, 12, 4645. [Google Scholar] [CrossRef]
  9. ASTM D3174-12; Standard Test Method for Ash in the Analysis Sample of Coal and Coke from Coal. ASTM International: West Conshohocken, PA, USA, 2018. [CrossRef]
  10. ASTM D5630-13; Standard Test Method for Ash Content in Plastics. ASTM International: West Conshohocken, PA, USA, 2013. [CrossRef]
  11. ASTM D3175-20; Standard Test Method for Volatile Matter in the Analysis Sample of Coal and Coke. ASTM International: West Conshohocken, PA, USA, 2020. [CrossRef]
  12. ISO 22167:2019; Solid Recovered Fuels–Determination of the Content of Volatile Matter. International Organization for Standardization: Geneva, Switzerland, 2021.
  13. ASTM D4208-19; Standard Test Method for Total Chlorine in Coal by the Oxygen Vessel Combustion/Ion Selective Electrode Method. ASTM International: West Conshohocken, PA, USA, 2019. [CrossRef]
  14. Thipkhunthod, P.; Meeyoo, V.; Rangsunvigit, P.; Kitiyanan, B.; Siemanond, K.; Rirksomboon, T. Predicting the heating value of sewage sludges in Thailand from proximate and ultimate analyses. Fuel 2005, 84, 849–857. [Google Scholar] [CrossRef]
  15. ISO 21654:2019; Solid Recovered Fuels – Determination of Calorific Value. International Organization for Standardization: Geneva, Switzerland, 2019.
  16. IPCC. 2006 IPCC Guidelines for National Greenhouse Gas Inventories; Intergovernmental Panel on Climate Change: Hayama, Japan, 2006. [Google Scholar]
  17. IPCC. Climate Change 2014: Synthesis Report. Contribution of Working Groups I, II and III to the Fifth Assessment Report of the Intergovernmental Panel on Climate Change; Intergovernmental Panel on Climate Change: Geneva, Switzerland, 2015. [Google Scholar]
  18. EPPO. Energy Statistics of Thailand 2023; Energy Policy and Planning Office, Ministry of Energy: Bangkok, Thailand, 2023; p. 228. [Google Scholar]
  19. TGO. Grid Emission Factor; Thailand Greenhouse Gas Management Organization: Bangkok, Thailand, 2023; p. 2. [Google Scholar]
  20. Wulyapash, W.; Phongphiphat, A.; Towprayoon, S.; Johann, F. Characterisation and Carbon Intensity of RDF from Landfill Mining: A Case Study in Samut Prakan, Thailand. In Proceedings of the Sixth Symposium on Circular Economy and Urban Mining, Capri, Italy, 18–20 May 2022. [Google Scholar]
  21. Rigamonti, L.; Grosso, M.; Møller, J.; Sanchez, V.M.; Magnani, S.; Christensen, T.H. Environmental evaluation of plastic waste management scenarios. Resour. Conserv. Recycl. 2014, 85, 42–53. [Google Scholar] [CrossRef]
  22. Alves, O.; Calado, L.; Panizio, R.M.; Goncalves, M.; Monteiro, E.; Brito, P. Techno-economic study for a gasification plant processing residues of sewage sludge and solid recovered fuels. Waste Manag. 2021, 131, 148–162. [Google Scholar] [CrossRef]
  23. TGO. Emission Factor of Industrial Sector; Thailand Greenhouse Gas Management Organization: Bangkok, Thailand, 2022; p. 63. [Google Scholar]
  24. Wulyapash, W.; Phongphiphat, A.; Towprayoon, S. Comparative study of hot air drying and microwave drying for dewatered sludge. Clean Technol. Environ. Policy 2021, 24, 423–436. [Google Scholar] [CrossRef]
  25. CEN/TR 15508:2007; Key Properties on Solid Recovered Fuels to be Used for Establishing a Classification System. European Committee for Standardization: Brussels, Belgium, 2006.
  26. Onukak, I.; Mohammed-Dabo, I.; Ameh, A.; Okoduwa, S.; Fasanya, O. Production and characterization of biomass briquettes from tannery solid waste. Recycling 2017, 2, 17. [Google Scholar] [CrossRef]
  27. Chiemchaisri, C.; Charnnok, B.; Visvanathan, C. Recovery of plastic wastes from dumpsite as refuse-derived fuel and its utilization in small gasification system. Bioresour. Technol. 2010, 101, 1522–1527. [Google Scholar] [CrossRef]
  28. Nithikul, J.; Karthikeyan, O.P.; Visvanathan, C. Reject management from a mechanical biological treatment plant in Bangkok, Thailand. Resour. Conserv. Recycl. 2011, 55, 417–422. [Google Scholar] [CrossRef]
  29. Canopoli, L.; Fidalgo, B.; Coulon, F.; Wagland, S.T. Physico-chemical properties of excavated plastic from landfill mining and current recycling routes. Waste Manag. 2018, 76, 55–67. [Google Scholar] [CrossRef]
  30. Bouzar, B.; Mamindy-Pajany, Y. Manufacture and characterization of carbonated lightweight aggregates from waste paper fly ash. Powder Technol. 2022, 406, 117583. [Google Scholar] [CrossRef]
  31. Wang, T.; Li, Y.; Zhang, J.; Zhao, J.; Liu, Y.; Sun, L.; Liu, B.; Mao, H.; Lin, Y.; Li, W.; et al. Evaluation of the potential of pelletized biomass from different municipal solid wastes for use as solid fuel. Waste Manag. 2018, 74, 260–266. [Google Scholar] [CrossRef]
  32. Viczek, S.A.; Aldrian, A.; Pomberger, R.; Sarc, R. Origins of major and minor ash constituents of solid recovered fuel for co-processing in the cement industry. Waste Manag. 2021, 126, 423–432. [Google Scholar] [CrossRef]
  33. ISO 21640:2020; Solid Recovered Fuels—Specifications and Classes. International Organization for Standardization: Geneva, Switzerland, 2020.
  34. Okot, D.K.; Bilsborrow, P.E.; Phan, A.N. Briquetting characteristics of bean straw-maize cob blend. Biomass Bioenerg. 2019, 126, 150–158. [Google Scholar] [CrossRef]
  35. Jiang, L.; Yuan, X.; Li, H.; Chen, X.; Xiao, Z.; Liang, J.; Leng, L.; Guo, Z.; Zeng, G. Co-pelletization of sewage sludge and biomass: Thermogravimetric analysis and ash deposits. Fuel Process. Technol. 2016, 145, 109–115. [Google Scholar] [CrossRef]
  36. Withatanang, K.; Silapanuntakul, S.; Sihabut, T.; Pandii, W. Production of briquette fuel using wastewater sludge and banana peel waste. Asia-Pac. J. Sci. Technol. 2017, 22, 1–7. [Google Scholar] [CrossRef]
  37. Gilvari, H.; de Jong, W.; Schott, D.L. Breakage behavior of biomass pellets: An experimental and numerical study. Comput. Part. Mech. 2020, 8, 1047–1060. [Google Scholar] [CrossRef]
  38. Jiang, L.; Yuan, X.; Xiao, Z.; Liang, J.; Li, H.; Cao, L.; Wang, H.; Chen, X.; Zeng, G. A comparative study of biomass pellet and biomass-sludge mixed pellet: Energy input and pellet properties. Energy Convers. Manag. 2016, 126, 509–515. [Google Scholar] [CrossRef]
  39. Okot, D.K.; Bilsborrow, P.E.; Phan, A.N. Effects of operating parameters on maize COB briquette quality. Biomass Bioenerg. 2018, 112, 61–72. [Google Scholar] [CrossRef]
  40. Bui, N.K.; Satomi, T.; Takahashi, H. Recycling woven plastic sack waste and PET bottle waste as fiber in recycled aggregate concrete: An experimental study. Waste Manag. 2018, 78, 79–93. [Google Scholar] [CrossRef]
  41. Zinchik, S.; Xu, Z.; Kolapkar, S.S.; Bar-Ziv, E.; McDonald, A.G. Properties of pellets of torrefied U.S. waste blends. Waste Manag. 2020, 104, 130–138. [Google Scholar] [CrossRef]
  42. Bahij, S.; Omary, S.; Feugeas, F.; Faqiri, A. Fresh and hardened properties of concrete containing different forms of plastic waste—A review. Waste Manag. 2020, 113, 157–175. [Google Scholar] [CrossRef]
  43. Kannan, S.; Gariepy, Y.; Raghavan, G.S.V. Optimization and characterization of hydrochar produced from microwave hydrothermal carbonization of fish waste. Waste Manag. 2017, 65, 159–168. [Google Scholar] [CrossRef]
  44. Yilmaz, E.; Wzorek, M.; Akcay, S. Co-pelletization of sewage sludge and agricultural wastes. J. Environ. Manag. 2018, 216, 169–175. [Google Scholar] [CrossRef]
  45. Yang, W.S.; Lee, Y.J.; Kang, J.G.; Shin, S.K.; Jeon, T.W. Assessment of quality test methods for solid recovered fuel in South Korea. Waste Manag. 2020, 103, 240–250. [Google Scholar] [CrossRef]
  46. Gisi, S.D.; Chiarelli, A.; Tagliente, L.; Notarnicola, M. Energy, environmental and operation aspects of a SRF-fired fluidized bed waste-to-energy plant. Waste Manag. 2018, 73, 271–286. [Google Scholar] [CrossRef]
  47. Liu, Z.; Wang, H.Q.; Zhou, Y.Y.; Liu, J.W.; Zhang, X.D.; Hu, G.W. Effect of microwave chlorine depleted pyrolyzate on the combustion characteristics of refuse derived fuel derived from package waste. Waste Manag. 2018, 82, 1–8. [Google Scholar] [CrossRef]
  48. Eriksen, M.K.; Pivnenko, K.; Olsson, M.E.; Astrup, T.F. Contamination in plastic recycling: Influence of metals on the quality of reprocessed plastic. Waste Manag. 2018, 79, 595–606. [Google Scholar] [CrossRef] [PubMed]
  49. Waldheim, L. Gasification of Waste for Energy Carriers; International Energy Agency—Bioenergy: Paris, France, 2018; p. 23. [Google Scholar]
  50. Schwarzbock, T.; Rechberger, H.; Cencic, O.; Fellner, J. Determining national greenhouse gas emissions from waste-to-energy using the Balance Method. Waste Manag. 2016, 49, 263–271. [Google Scholar] [CrossRef] [PubMed]
  51. Obermoser, M.; Fellner, J.; Rechberger, H. Determination of reliable CO2 emission factors for waste-to-energy plants. Waste Manag. Res. J. Sustain. Circ. Econ. 2009, 27, 907–913. [Google Scholar] [CrossRef]
  52. Chojnacka, K.; Mikula, K.; Izydorczyk, G.; Skrzypczak, D.; Witek-Krowiak, A.; Moustakas, K.; Ludwig, W.; Kułażyński, M. Improvements in drying technologies—Efficient solutions for cleaner production with higher energy efficiency and reduced emission. J. Clean. Prod. 2021, 320, 128706. [Google Scholar] [CrossRef]
  53. Wu, X.; Li, J.; Yao, L.; Xu, Z. Auto-sorting commonly recovered plastics from waste household appliances and electronics using near-infrared spectroscopy. J. Clean. Prod. 2020, 246, 118732. [Google Scholar] [CrossRef]
Figure 1. Effect of pelletizing parameters: mixing ratio, mold temperature, and compression pressure.
Recycling 10 00052 g001
Figure 2. Stress–strain curves for the uniaxial compressions tests of pellets: (a) mixing ratio of 100 wt% sludge, (b) mixing ratio of 75 wt% sludge, (c) mixing ratio of 50 wt% sludge.
Recycling 10 00052 g002
Figure 3. The calorific value of pellets.
Recycling 10 00052 g003
Figure 4. Intensity of the heavy metals in the pellets, mixed coals, bituminous coal, and lignite [2,3,4], expressed in mg/MJ as received basis calculated at 10 wt%wb of moisture content.
Recycling 10 00052 g004
Figure 5. Fossil-CO2 emission factors for combustion of the pellets, plastic waste, coarse RDF and literature coals [51].
Recycling 10 00052 g005
Figure 6. GHG emissions from dewatered sludge landfilling, RDF production and combustion, pellet production and combustion, and coal mining and combustion scenarios.
Recycling 10 00052 g006
Table 1. Summary of activity data and parameters for GHG emissions estimation from treatment and disposal scenarios.
Scenario and TreatmentActivity ConditionsParameters
Sludge scenario
Landfilling of sludgeDewatered sludge was dealt with managed solid waste disposal sites with covered material under moist and wet tropical conditionsDOC: 0.06
DOCf: 0.7 [16]
MCF: 1 [16]
OF: 0.1 [16]
IPCC defaults for other parameters
There is no CH4 recovery. It was not collected or flared
Coarse RDF scenario
Landfill mining of MSWDiesel consumption by excavators and loaders during excavation of landfilled MSWFCmining, diesel: 1.03 liter/ton RDF
NCVdiesel: 36.42 MJ/liter [18]
EFdiesel: 0.0741 kg CO2/MJ [16]
Mechanical treatment for RDF productionElectricity consumption by machineryECRDF prod.: 58.78 kWh/ton RDF
EFEC: 0.4857 kg CO2/kWh [19]
Diesel consumption of loadersFCRDF prod, diesel: 0.69 liter/ton RDF
Combustion of coarse RDFN2O and CH4 emissionsNCVcoarse RDF: 17.86 GJ/ton
EFN2O, RDF: 0.004 kg N2O/GJ [16]
EFCH4, RDF: 0.03 kg CH4/GJ [16]
CO2 emissions following Equation (6)OF: 1 [16]
CFi; FCFi [16]
WFi; dmi [20]
Treatment of rejected materials was not included
Pellet scenario
Landfill mining of MSWRefer to landfill mining emissions from Coarse RDF scenario
Mechanical treatment for RDF productionRefer to the emissions from mechanical treatment of the Coarse RDF scenario
Plastic waste preparationCoarse RDF was further separated and milledECseparate: 17.7 kWh/ton RDF [21]
ECmilling: 35.51 kWh/ton [22]
Sludge preparationSludge was dried using an electric dryer and then milledECdrying: 5445.68 kWh/ton dried sludge [20]
PelletizationThe prepared sludge and plastic waste were mixed, following the mixing ratios, and pelletizedECmixing: 3.97 kWh/ton [22]
ECpelletizing: 127.98 kWh/ton [22]
WFsludge: WFplastic are 100:0, 75:25, 50:50
Combustion of pelletsCalculating the same method as the RDF scenario
Coal scenario
Coal miningEmissions of coal production at the surface mineEFcoal mining: 0.1187 kg CO2-eq/kg [23]
Combustion of coalEmissions of bituminous coal combustionEFN2O, bituminous: 0.0015 kg N2O/GJ [16]
EFCH4, bituminous: 0.001 kg CH4/GJ [16]
EFCO2, bituminous: 94.6 kg CO2/GJ [16]
NCVbituminous: 0.0258 GJ/kg [16]
Note: 1. Parameter values presented without references following the numbers indicate that these values were directly monitored, measured, or obtained from this study; 2. Emissions from transportation were not calculated for all scenarios because they were outside the scope of the study.
Table 2. Characteristics of the sludge and plastic waste.
CharacteristicsSludge Plastic Waste
MeanRSD%MeanRSD%
Glass transition temperature (°C)79
Melting point (°C)183124
GCV (MJ/kg)200.1360.2
Proximate analysis (wt%, dry basis)
Ash150.81117.2
FC163
VM692.4867.1
Elemental analysis (mg/kg, dry basis)
C448,0000.6587,0001.2
O309,0006.586,8007.5
H62,8001.090,0001.9
N67,4000.349006.0
S16,4000.636001.5
Cl23,00089,200
Ca30,9001.4108,0000.8
P17,6001.523505.9
Fe63501.456001.6
Al478014.6280026.7
Na44000.710301.2
K41000.49001.5
Si34009.910,3004.4
Zn8952.03603.4
Ti4378.943002.0
Sr972.5424.2
Cu960.31401.0
Cr711.61001.0
Sc6926.412023.3
Mn590.2501.2
Ni461.4223.1
Se357.3
Cd110.6117.0
As1033.9223.0
Rb813.5815.3
Mo719.7916.9
Zr720.61212.1
V68.327.2
U541.0
Pb458.1401.9
Nb430.7817.6
Co215.453.2
Hg14.1110.0
Table 3. Chemical composition of pellets produced from sludge and plastic waste.
Characteristics (mg/kgdb)R100 R75 R50
T120-P80T120-P60T100-P80T100-P60T120-P80T120-P60T100-P80T100-P60T120-P80T120-P60T100-P80T100-P60
C407,000418,000417,000398,000443,000441,000456,000471,000505,000496,000479,000506,000
O263,000272,000270,000256,000205,000200,000206,000222,000136,000160,000118,000146,000
H56,30057,80058,50054,00062,00079,40086,60072,500104,00097,00095,700104,000
N61,80067,20066,00060,20047,10047,40044,00049,00025,00029,40019,00026,000
S13,50014,50014,00014,00011,50010,60010,00011,0006700787062506880
Cl108,00080,50081,100122,000106,000131,000107,00086,400108,00095,000171,000110,000
Ca44,20043,00044,00045,60064,70049,20049,00047,00083,60077,30084,10065,000
P17,70017,70018,00018,00019,10014,00013,80014,300010,00011,900872011,900
Fe12,30012,00012,10012,40010,60011,000973011,100665010,300585010,000
Al370037304300466049003400348030003500386029003840
Na36004040473050002590320028302860100018001320510
K3400395046004460250032002510277085016301110420
Si300030003000298052803000354034003000417033004250
Zn1200130013001290139010009301040800925630870
Ti62763163270022002000183020002900235027004030
Cu9710213213290939012030554810
Cr1659112213011612311111437815019
Mn707082867260607015372510
Ni50517065605850541226238
Cd1011121199782431
As1112151298996856
V456644443434
Pb556511101010912135
Co222222121111
Hg111111111111
Disclaimer/Publisher’s Note: The statements, opinions and data contained in all publications are solely those of the individual author(s) and contributor(s) and not of MDPI and/or the editor(s). MDPI and/or the editor(s) disclaim responsibility for any injury to people or property resulting from any ideas, methods, instructions or products referred to in the content.

