Article

Thermal Runaway Early Warning and Risk Estimation Based on Gas Production Characteristics of Different Types of Lithium-Ion Batteries

1
China Automotive Battery Research Institute Co., Ltd., 11 Xingke East Street, Yanqi Economic Development Zone, Huairou District, Beijing 101407, China
2
Ministry of Industry and Information Technology, Equipment Industry Development Center, Beijing 100846, China
3
Chongqing Changan New Energy Vehicles Technology Co., Ltd., Chongqing, 401135, China
*
Authors to whom correspondence should be addressed.
These authors contributed equally to this work.
Batteries 2023, 9(9), 438; https://doi.org/10.3390/batteries9090438
Submission received: 28 July 2023 / Revised: 22 August 2023 / Accepted: 25 August 2023 / Published: 28 August 2023
(This article belongs to the Special Issue Recent Advances in Battery Mechanism)

Abstract

:
Gas production analysis during the thermal runaway (TR) process plays a crucial role in early fire accident detection in electric vehicles. To assess the TR behavior of lithium-ion batteries and perform early warning and risk estimation, gas production and analysis were conducted on LiNixCoyMn1-x-yO2/graphite and LiFePO4/graphite cells under various trigger conditions. The findings indicate that the unique gas signals can provide TR warnings earlier than temperature, voltage, and pressure signals, with an advanced warning time ranging from 16 to 26 min. A new parameter called the thermal runaway degree (TRD) is introduced, which is the product of the molar quantity of gas production and the square root of the maximum temperature during the TR process. TRD is proposed to evaluate the severity of TR. The research reveals that TRD is influenced by the energy density of cells and the trigger conditions of TR. This parameter allows for a quantitative assessment of the safety risk associated with different battery types and the level of harm caused by various abuse conditions. Despite the uncertainties in the TR process, TRD demonstrates good repeatability (maximum relative deviation < 5%) and can be utilized as a characteristic parameter for risk estimation in lithium-ion batteries.

Graphical Abstract

1. Introduction

Lithium-ion batteries (LIBs) have emerged as the primary power sources for electric vehicles. However, in diverse application scenarios, LIBs pose risks of combustion or even explosion, hampering their broader integration into electric vehicles. Several factors contribute to the safety concerns surrounding LIBs. These include mechanical abuse (e.g., crushing or nail penetration), thermal abuse, and electrical abuse (such as overcharging, over-discharging, and internal short circuits) [1,2,3,4,5]. A primary mechanism underlying these safety issues is the accelerated heat generation in the battery relative to its heat dissipation. When this imbalance occurs, the internal pressure and temperature of the battery can increase rapidly, leading to an uncontrolled self-heating state, termed TR. This can culminate in the battery burning or even exploding.
Extensive numerical and experimental studies have been conducted to understand the safety of LIBs, particularly examining the TR process under various abuse conditions [6,7,8,9,10,11,12]. As the temperature rises during the TR process, specific intercellular exothermic reactions are initiated [13,14]. The heat produced from these reactions can intensify the reaction rate, culminating in a TR event [15,16]. Moreover, these reactions yield oxygen and several combustible components, which can ignite upon reaching a certain threshold temperature. Significant efforts are dedicated to analyzing heat production and heat transfer mechanisms within individual battery cells and entire battery systems and contrasting the resultant thermal failure or runaway characteristics [17]. For instance, Ribière [18] and Larsson [19] conducted experiments focusing on the products of LIBs during TR, revealing that the combustion of the electrolyte solution primarily led to jet flames and large amounts of combustible and toxic gases. Roth [20] and Garcia [21] determined that in the context of TR in 18,650 LIBs, the decomposition of the electrolyte solution primarily enabled the production of combustible/toxic gases. Thus, TR in LIBs is typically characterized by intense heat, jet flames, and the release of vast quantities of combustible and toxic gases [22,23,24,25]. Previous research indicates that gases produced during the TR process include hydrogen (H2), carbon monoxide (CO), carbon dioxide (CO2), and various hydrocarbons such as methane (CH4), ethylene (C2H4), ethane (C2H6), and propane (C3H8), with most being combustible [26]. The flammability of the vented gases from cells is intrinsically linked to LIB combustion, ignition, and potential explosion [27,28]. It is worth noting that combustion signifies a gradual explosion, while an explosion embodies intense combustion [29]. Harris et al. [30] highlighted that different carbonate solvents have varying vaporization and combustion enthalpies, which influence the heat and flammability of gases ejected from the cell.
The aforementioned studies primarily focus on assessing battery safety and analyzing the toxicity and flammability of gases produced post-TR. However, in practical applications, understanding the early stages of TR in cells to facilitate early warning is paramount. The TR process induced by heat in cells can be categorized into four phases, as depicted in Figure 1: (1) heating causes the cell casing to expand due to gas generation; (2) gases from the electrolyte are released through the explosion relief vent, allowing oxygen to penetrate the cell; (3) internal sparks ignite the surrounding electrolyte vapors near the relief valve; (4) the flame rapidly spreads, igniting materials within the cell and causing it to explode. The transition from stage 2 to 3 is often swift, making early detection challenging before the cell ignites.
When a single cell within a battery pack undergoes TR, it can trigger a TR event throughout the entire pack, potentially leading to explosions or fires in electric vehicles [31,32,33]. The traditional method of detecting TR in battery packs involves monitoring the voltages [34] of all cells and temperatures [35] in key areas. By analyzing the trends in voltage and temperature changes, one can determine if there is thermal diffusion within the pack. However, the limitations of this method include extensive data processing and delayed alarm responses, among others, which can lead to significant damage during a TR event in the battery pack. Consequently, there is a pressing need to develop more efficient methods for early TR detection. While most battery safety evaluations are qualitative, a quantitative risk assessment post-TR would enhance the selection process for batteries in real-world applications.
In our study, we examined the gas production of cells during TR using different heating methods (namely, air heating and electric heating). We tested this on 50 Ah prismatic hard case cells of LiNixCoyMn1-x-yO2/graphite (NCM) and LiFePO4/graphite (LFP) using a specially designed device. Our primary objective was to investigate the potential of utilizing gas production as an early indicator of TR. We found that a fully charged cell exhibits varying TR behaviors depending on the triggering method. During the TR process, cells emit combustible gases such as H2, CO, and CO2. This release of gases can act as an early warning for both NCM and LFP cells. Additionally, we introduced a metric termed “thermal runaway degree” (TRD), calculated using the molar quantity of the produced gas and the peak temperature. This metric provides a quantitative measure of the severity of a battery’s TR event. The TRD offers a way to gauge the safety or risk level of various cell types and holds promise as a key parameter for risk assessment in LIBs.

2. Materials and Methods

2.1. Battery

Two commercial cell variants were employed for the heating experiments. Details about these samples can be found in Table 1. All cells underwent testing at a state of charge (SOC) of 100%.
To ascertain the actual electrical capacity of each cell, we utilized the constant current/constant voltage technique over three cycles at a 1 C rate. A resting period of 1 h was maintained between the charging and discharging cycles.

2.2. Experimental Apparatus

The experimental setup is housed within an explosion-proof chamber and is equipped with a heating system, a collection hood, and a sampling system. This sampling system comprises four primary components: voltage and temperature measurement, gas pressure measurement, a combustible gas sensor, and an off-line gas composition analysis subsystem.
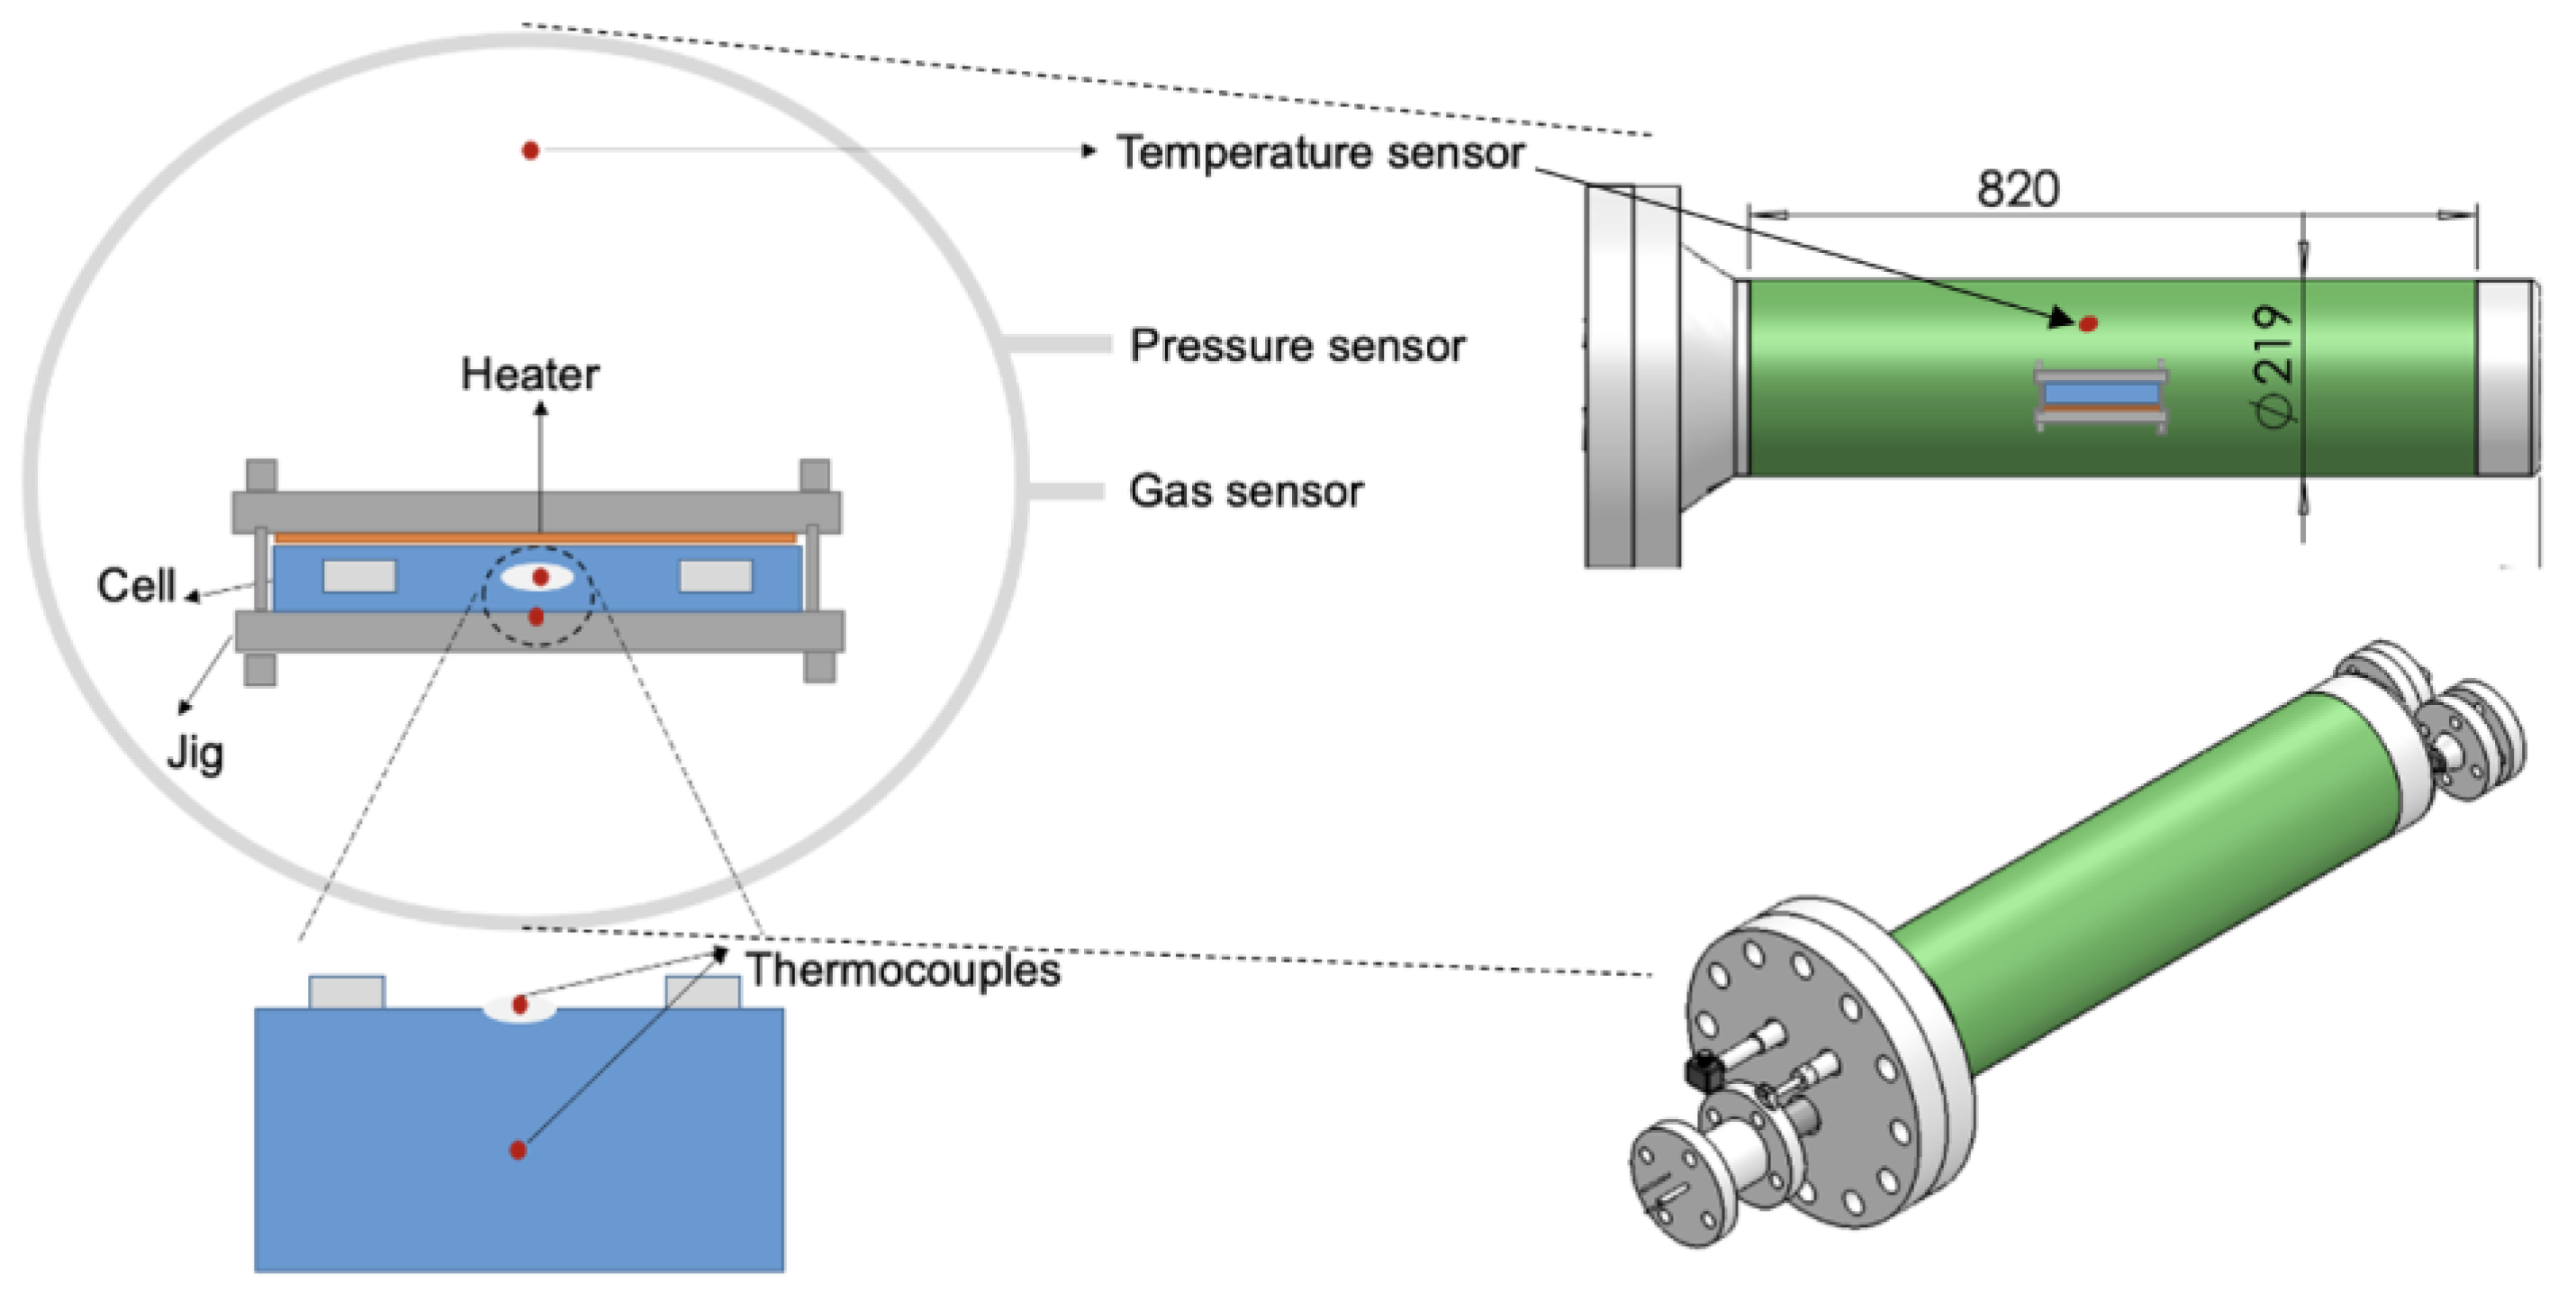
Figure 2 provides a schematic of the experimental configuration. Within the explosion-proof chamber, a cell is placed on a heating plate and secured with jigs. This is housed inside a cylindrical sealed tube (highlighted in green in Figure 2) that has an inner diameter of 188 mm and a length of 820 mm. There are two methods for heating the cell: Utilizing a 300 W heating plate to initiate the cell’s TR. Programmatically heating the chamber through a surrounding heater. Various sensors are installed within the chamber to monitor temperature, gas pressure, and gas composition.

2.3. Experimental Conditions

This study undertook heat-induced TR tests at room temperature and concluded them once the cell’s temperature had approximately returned to this ambient level. We conducted two types of TR experiments. First, a 300 W electric heating plate, matching the cell’s dimensions, was attached to the back of the cell to trigger TR. Heat-resistant tape was then employed to firmly bind the cell and heating plate, ensuring close contact. Subsequently, the duo was steadily and continuously heated. Finally, two steel jigs secured both the cell and the heating plate, replicating the typical battery positioning within a module, as depicted in Figure 2. An alternative heating approach involved increasing the chamber’s temperature at a rate of 5 °C min−1.
Surface and chamber temperatures of the cell were gauged using K-type thermocouples (TCs). Two TCs (TC-1 and TC-2), each 1 mm in diameter, were affixed to the cell’s surface and its relief vent, respectively. Figure 2 offers a more detailed representation of the thermocouple locations. Another thermocouple (TC-3) was positioned at the chamber’s central base to monitor its temperature.
Real-time data concerning gas pressure were captured and logged onto a computer. Once the system was primed, the electric heating plate was activated, consistently warming the battery under a stable radiation to induce TR and potential combustion in LIBs. Given the uniform heat distribution from the heating source, each cell underwent consistent heat transfer and ignited simultaneously. When the heating plate was operational, relevant data were captured using specialized temperature and gas pressure software.
A combustible gas sensor within the chamber detected gas emissions from the cell’s venting valve. To delve into the TR-associated gas production and composition, we employed an off-line gas chromatography (GC) system to gather the chamber’s internal gases. Gas samples were collected post-TR or, in the absence of a TR event, when the cell temperature surpassed 250 °C. The GC was calibrated for various gases, including H2, O2, N2, CO, CO2, CH4, C2H2, C2H4, and C2H6, with N2 serving as both the inert and endogenous reference gas. Given the known N2 volume in the reactor (based on air composition), the absolute volumes of other gases were determined through relative GC analysis.

3. Results

3.1. Heating Trigger Behavior

As heat was conveyed from the heating plate or the chamber’s warm gas to the cell, the temperature of the cell steadily rose. The external heat source contributed to a gradual temperature rise throughout this phase. Subsequently, a swift temperature surge was primarily linked to thermal runaway during cell malfunction, paired with intense reduction and oxidation reactions. Flammable gases were released from the relief vent as the temperature climbed. After sustained heating, a significant short circuit occurred within the cell, leading to a notable voltage drop and the emergence of a jet flame from the relief vent. This event can be characterized as TR.
Figure 3 presents physical representations of the cell before and after the tests, where it was subjected to heat via a heating plate. Figure 3a,d depict the NCM and LFP cells, respectively, prior to heating. Despite the constraining steel clamp, cell surface expansion and deformation are evident, while the anode, cathode, and relief vent exhibit significant carbonization. Figure 3c,f offer a top view of the cell, highlighting the opening of the relief vent. The vent of the NCM cell appears fully open, in contrast to the LFP cell, which only opened from one side. Figure 3b,e showcase the dispersion of internal battery components. The rupture of electrode materials and combustion of the electrolyte are visible, indicating extensive damage to the cell due to TR.

3.2. Cell Temperature Response in TR

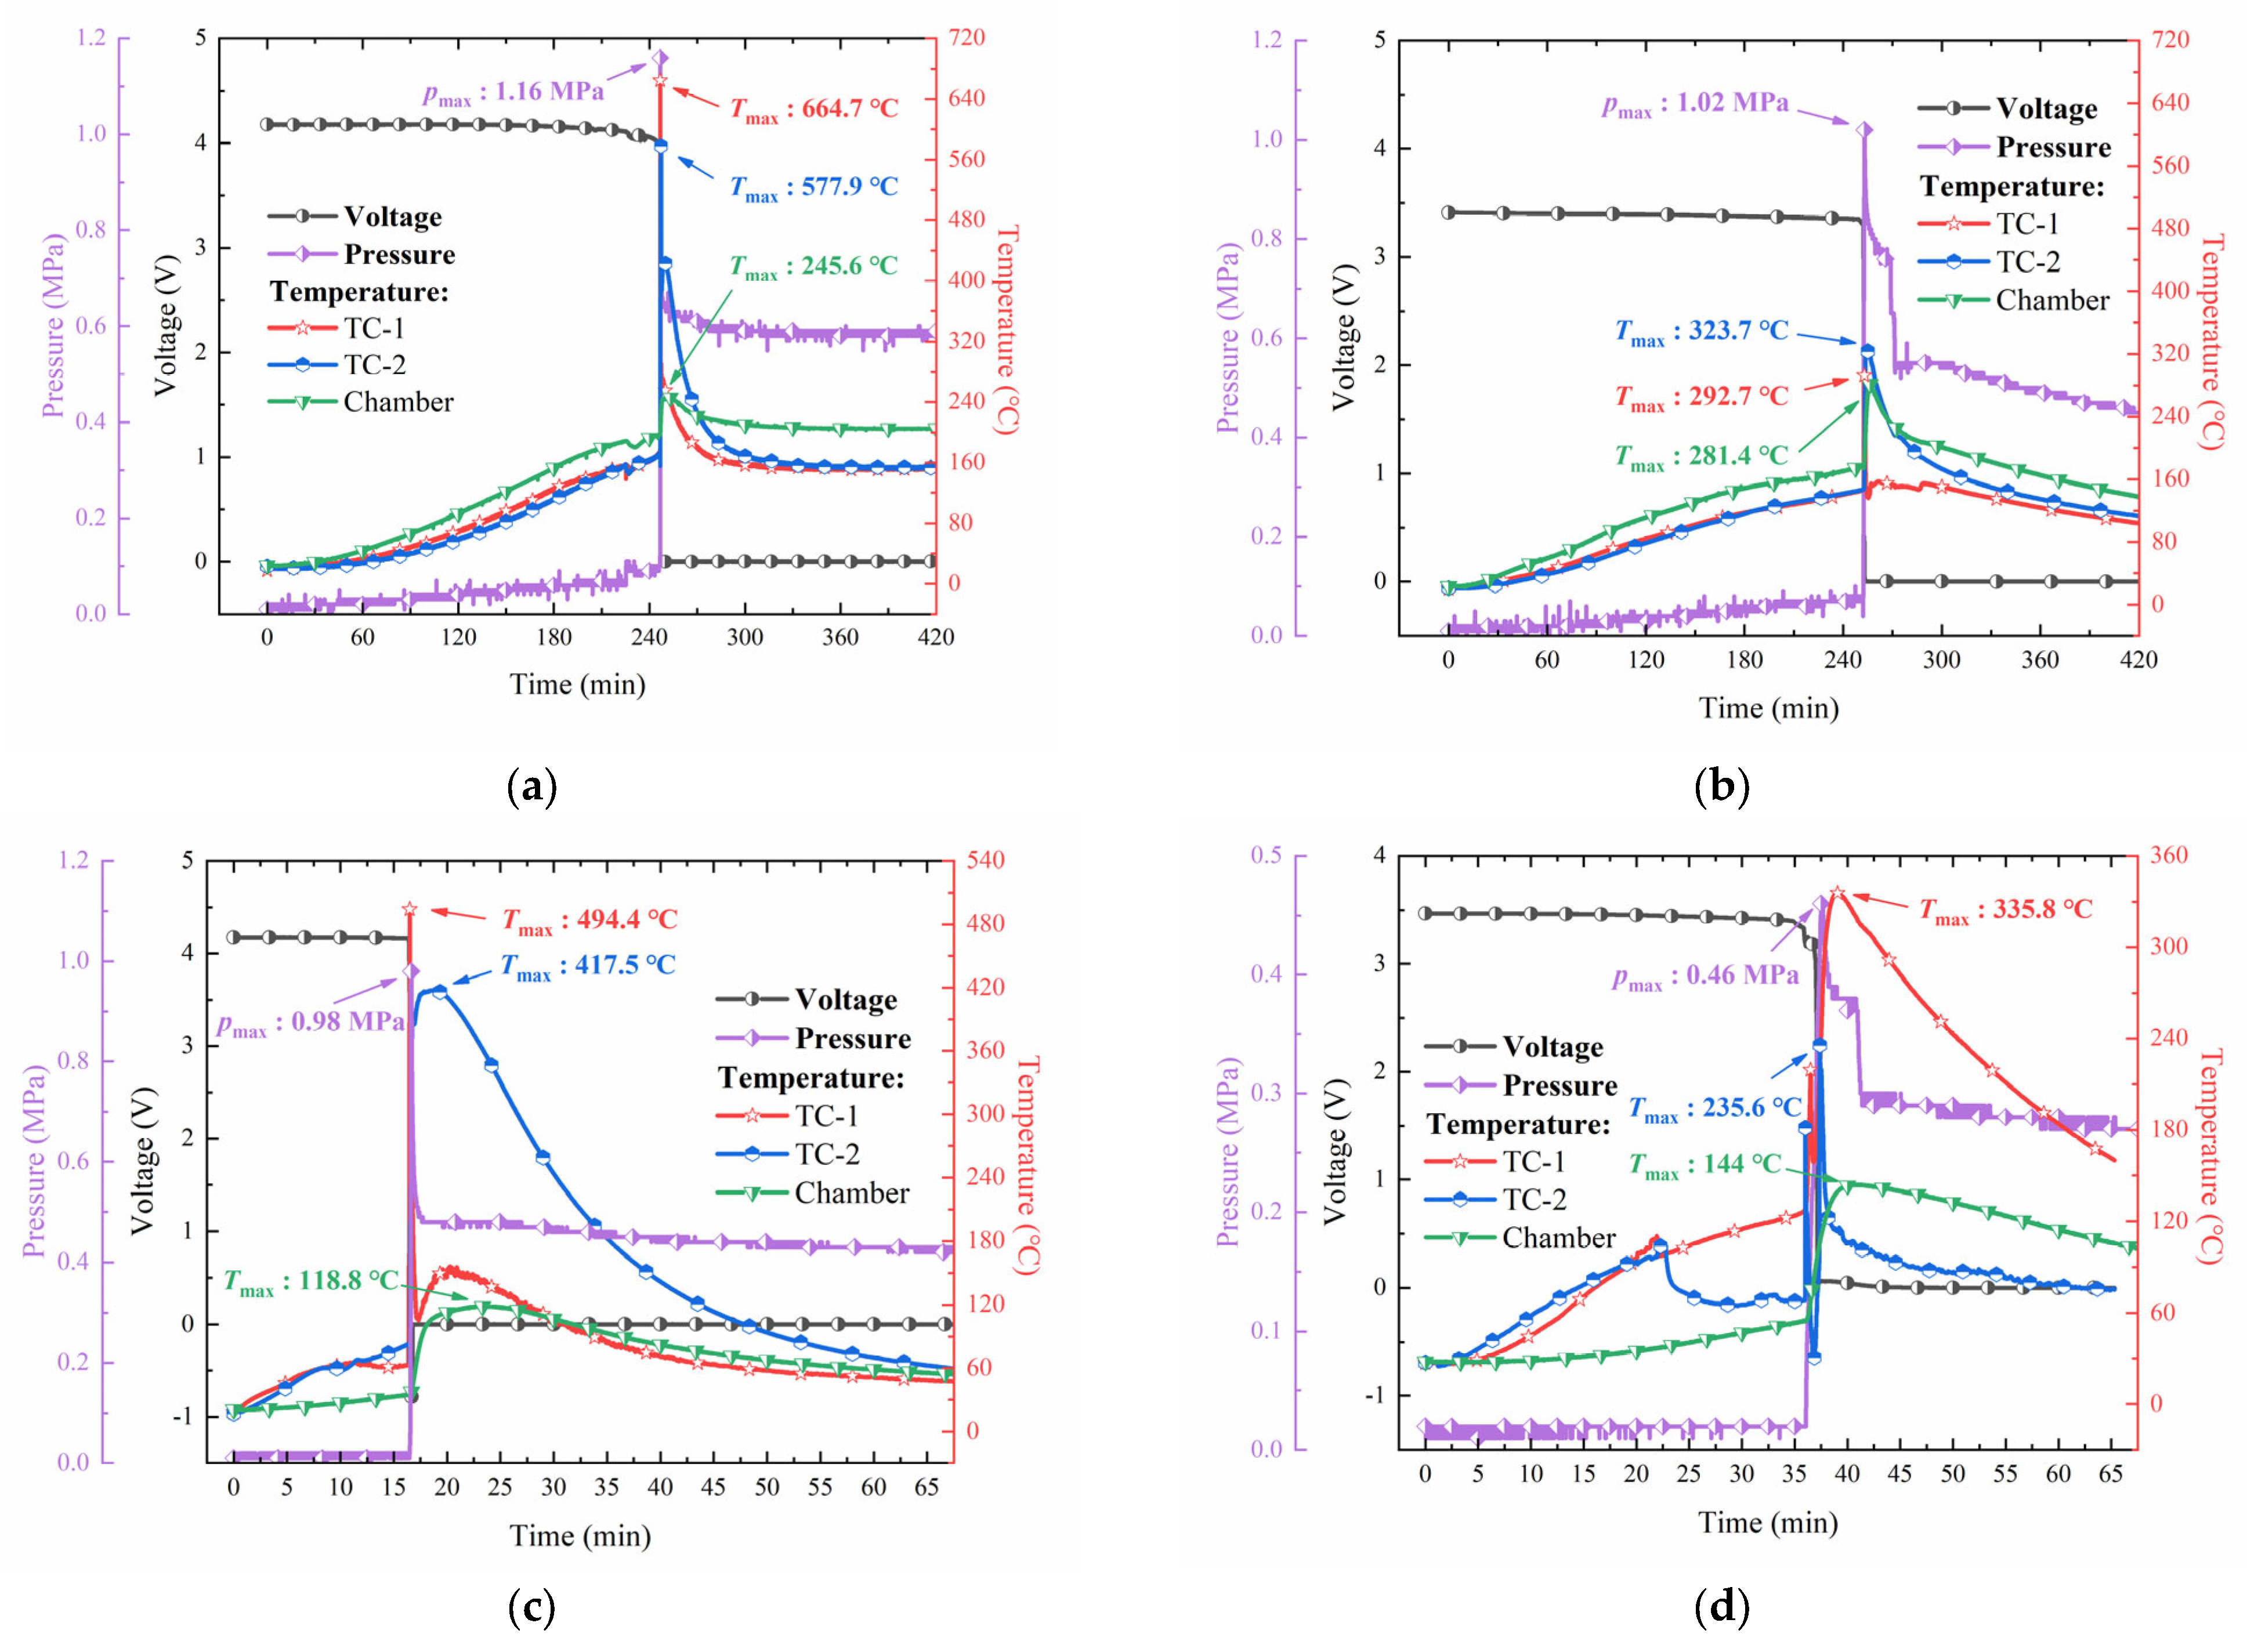
Variations in cell surface temperature and flame dynamics are crucial for understanding cell TR and combustion characteristics. In this study, TR is identified when the rate of cell surface temperature rise surpasses 1 °C s−1. The K-type thermocouple probe was affixed to the central surface region of both NCM and LFP cells using a tinfoil adhesive and wire to monitor surface temperature. The detailed cell surface temperature depicted a steady rise due to thermal conduction prompted by hot gas in the chamber, as illustrated in Figure 4. This temperature surge augmented the decomposition of the solid electrolyte interface (SEI) film and intensified the anode–electrolyte reaction [26]. The cell’s voltage declined preceding the TR, signifying the internal separator’s rupture and the onset of a substantial short circuit [36]. Figure 4a,b detail the heating process at a rate of 5 °C min−1. For the NCM cell, post-240 min of heating, the central battery surface temperature reached 160 °C pre-TR, peaking at 664.7 °C. For the LFP cell, after 250 min of heating, it reached 140 °C pre-TR, with the LFP cell’s peak temperature being 323.7 °C. In summary, post-TR, the central battery surface temperature rose to 323.7 °C for the LFP cell and 664.7 °C for the NCM cell. The NCM cell recorded a much higher peak temperature than the LFP cell, potentially signifying more vigorous combustion in the NCM cell. [37]
For the 300 W heating depicted in Figure 4c,d, the onset of TR through 300 W heating is notably swifter than when heated at 5 °C min−1, as the heat is transferred directly from the heating plate to the cell. For the LFP cell, TR was observed 36 min post-heating commencement, a delay of 15 min compared to the NCM cell. Notably, the LFP cell exhibited a pronounced voltage reduction (from 3.4 V to 3.1 V) before the TR at 35–36 min, indicating a potential warning signal as shown in Figure 4d. For the NCM cell, after 20 min of heating, the central battery surface temperature reached 160 °C pre-TR, peaking at 431 °C. Conversely, for the LFP cell, after 36 min, the temperature was 120 °C pre-TR, with the cell’s peak temperature being 335.8 °C. Interestingly, a marginal temperature decrease (120 °C) was observed in the LFP cell 20 min post-heating, coinciding with the NCM cell’s TR timing. This could be attributed to the rising internal pressure of the battery triggering the relief vent’s opening, leading to the ejection of high-temperature streams and active materials from within the cell. At this juncture, TR had not occurred, so the heating plate remained active. Subsequent exothermic reactions within the cell led to temperature elevation, thus enhancing separator melting and electrolyte–electrode degradation. Post-36 min of heating, TR ensued. After TR, the central battery surface temperature elevated to 335.8 °C for the LFP cell and 431 °C for the NCM cell. The peak surface temperature of the NCM cell was higher than the LFP cell’s during the same TR initiation technique in this study. Furthermore, the cell’s internal temperature was even higher due to a discernible disparity between surface and internal cell temperatures [38]. In our experiment, the NCM cell’s peak temperature ranged between 430 and 660 °C, which is much higher than the possible temperature ranges for the chemical breakdown of LIB during TR events. The temperature of the electrolyte decomposition is 225~350 °C, while, for the cathode, it is 178~250 °C [39]. Collectively, the cells displayed amplified thermal hazards with escalating energy density [40].
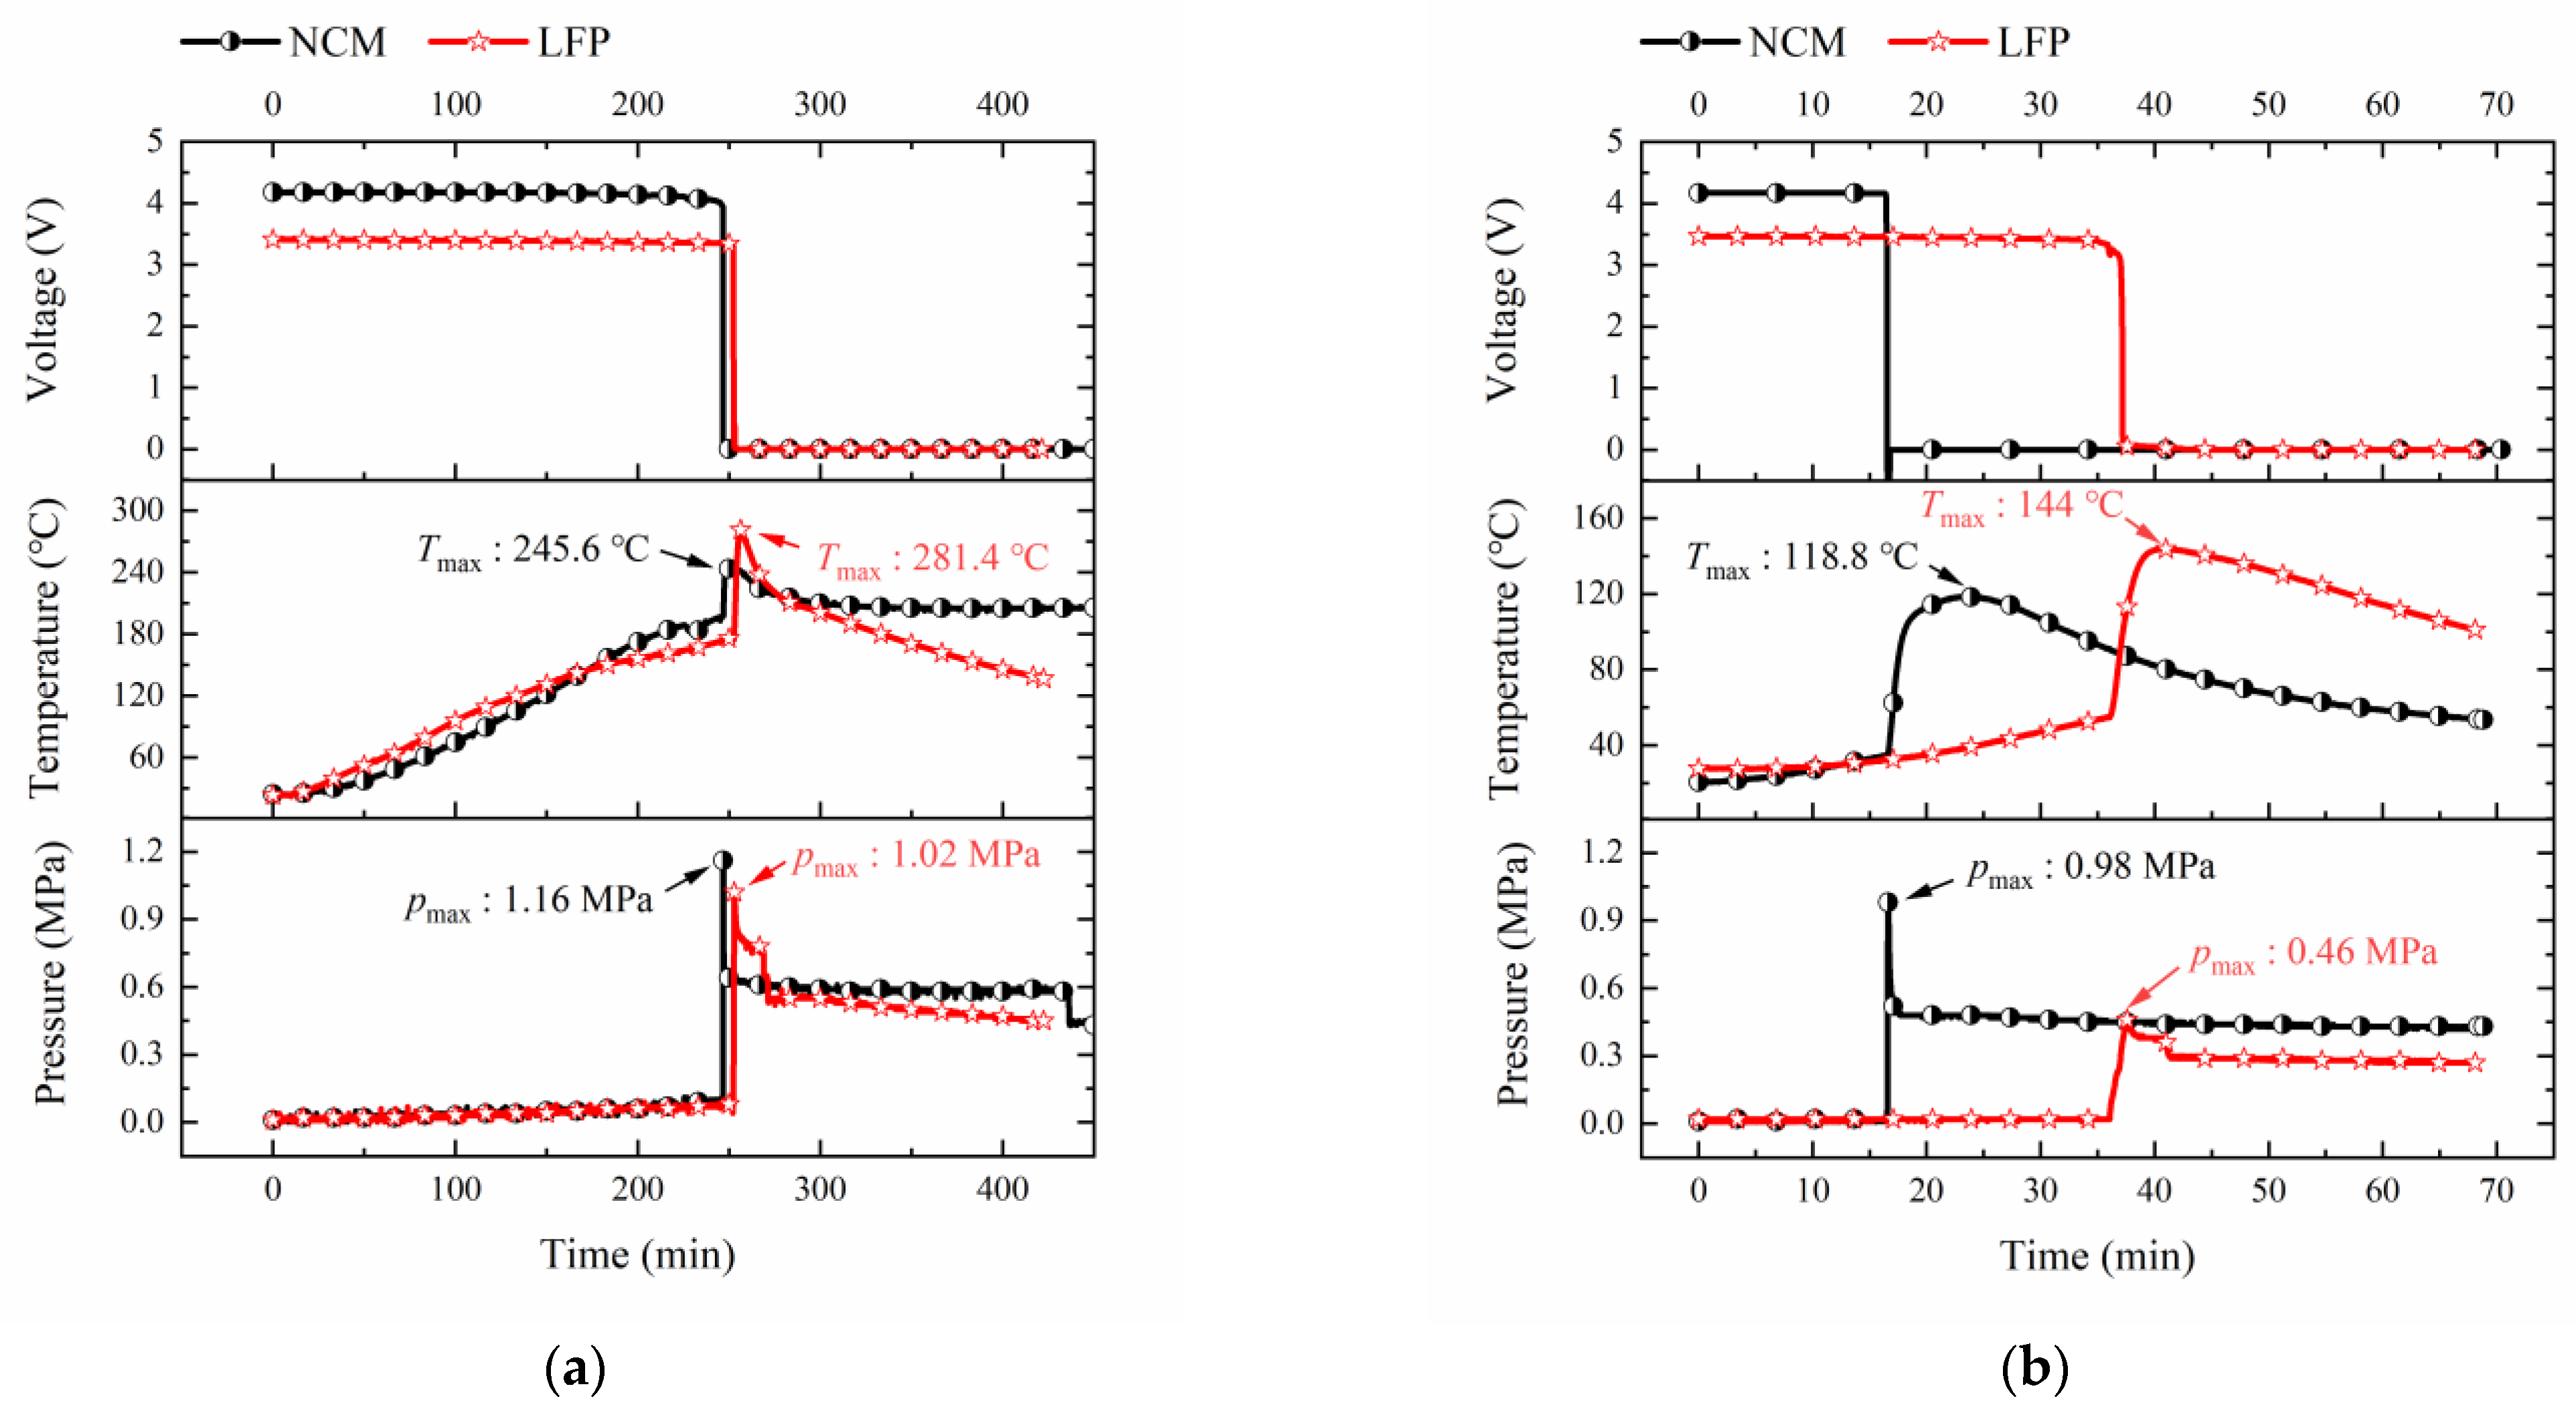
Figure 5 presents the comparative curve of voltage, temperature, and chamber pressure for both NCM and LFP cells when heated at a rate of 5 °C min−1 and with 300 W. For the heating process at 5 °C min−1 depicted in Figure 5a, the LFP cell’s TR time (red line) lags about 10 min behind the NCM cell (black line). Figure 5b illustrates that the TR onset for the NCM cell is considerably sooner than for the LFP cell, aligning with the findings at 5 °C min−1. Additionally, the chamber’s pressure and temperature for the NCM cell exceed those for the LFP cell. Regarding the 300 W heating mechanism, the LFP cell behaves distinctly from the NCM cell. The chamber’s peak pressure is 0.46 MPa for the LFP, significantly lower than the 0.98 MPa recorded for the NCM cell. In essence, a cell with a higher energy density stores more energy, undergoes TR earlier, and exhibits a more complex combustion pattern during TR. If the cell’s temperature escalates uncontrollably, the overall pressure elevates rapidly. For the LFP cell, gas release is the predominant phenomenon, while, for the NCM cell, the primary effect is the impact force [41].
The time leading up to TR is longer with heating at 5 °C min−1, approximately 250 min, compared to the rapid 16 min with the 300 W method. This extended duration is attributed to the cell needing more time to reach thermal runaway when heat is transferred from the air. The heating at 5 °C min−1 provides more distributed heat to the entire cell, potentially causing a widespread internal short circuit almost immediately. In contrast, with the 300 W method, the heating plate warms only one side of the cell, potentially leading to a localized internal short circuit near the plate. This localized effect could explain the observed voltage drop before TR. Thus, the consequences of TR when heating at 5 °C min−1 are more severe than those induced by the 300 W approach.

3.3. Analysis of Gas Production Components during the TR

Heat plays a pivotal role in influencing both TR and fire patterns in LIBs. If heat production surpasses heat dissipation, it leads to a swift temperature surge, thereby intensifying heat generation from chemical reactions. As these reactions unfold, there is an abrupt rise in internal pressure, stemming from gas formation. If the disparity between external air and internal pressures hits a certain threshold, the relief valve might crack. LIBs exposed to external flames or elevated temperatures readily initiate exothermic reactions, potentially triggering TR, fires, or even explosions [42]. The exact electrolyte composition can vary considerably across different cell types and producers. Commonly used electrolyte components include diethyl carbonate (DEC), dimethyl carbonate (DMC), ethylene carbonate (EC), and ethyl methyl carbonate (EMC). The venting typically stems from excessive gas production inside the cell during TR. Gas generation mainly occurs in two ways: (a) solvent vaporization (involving DMC, DEC, EMC, and EC) where, upon reaching the solvent’s boiling point, the cell begins to gasify and (b) gas emerging from the decomposition of cell components. Before TR initiation, source (a) likely dominates cell venting, with the venting temperature nearing the boiling points of solvent components. In terms of source (b), factors include SEI film breakdown, anode material thermal degradation, reactions between organic solvents and anode/cathode, and interactions between volatile compounds and electrolytes. This hints at the complexity of the gas mixture produced during combustion [43].
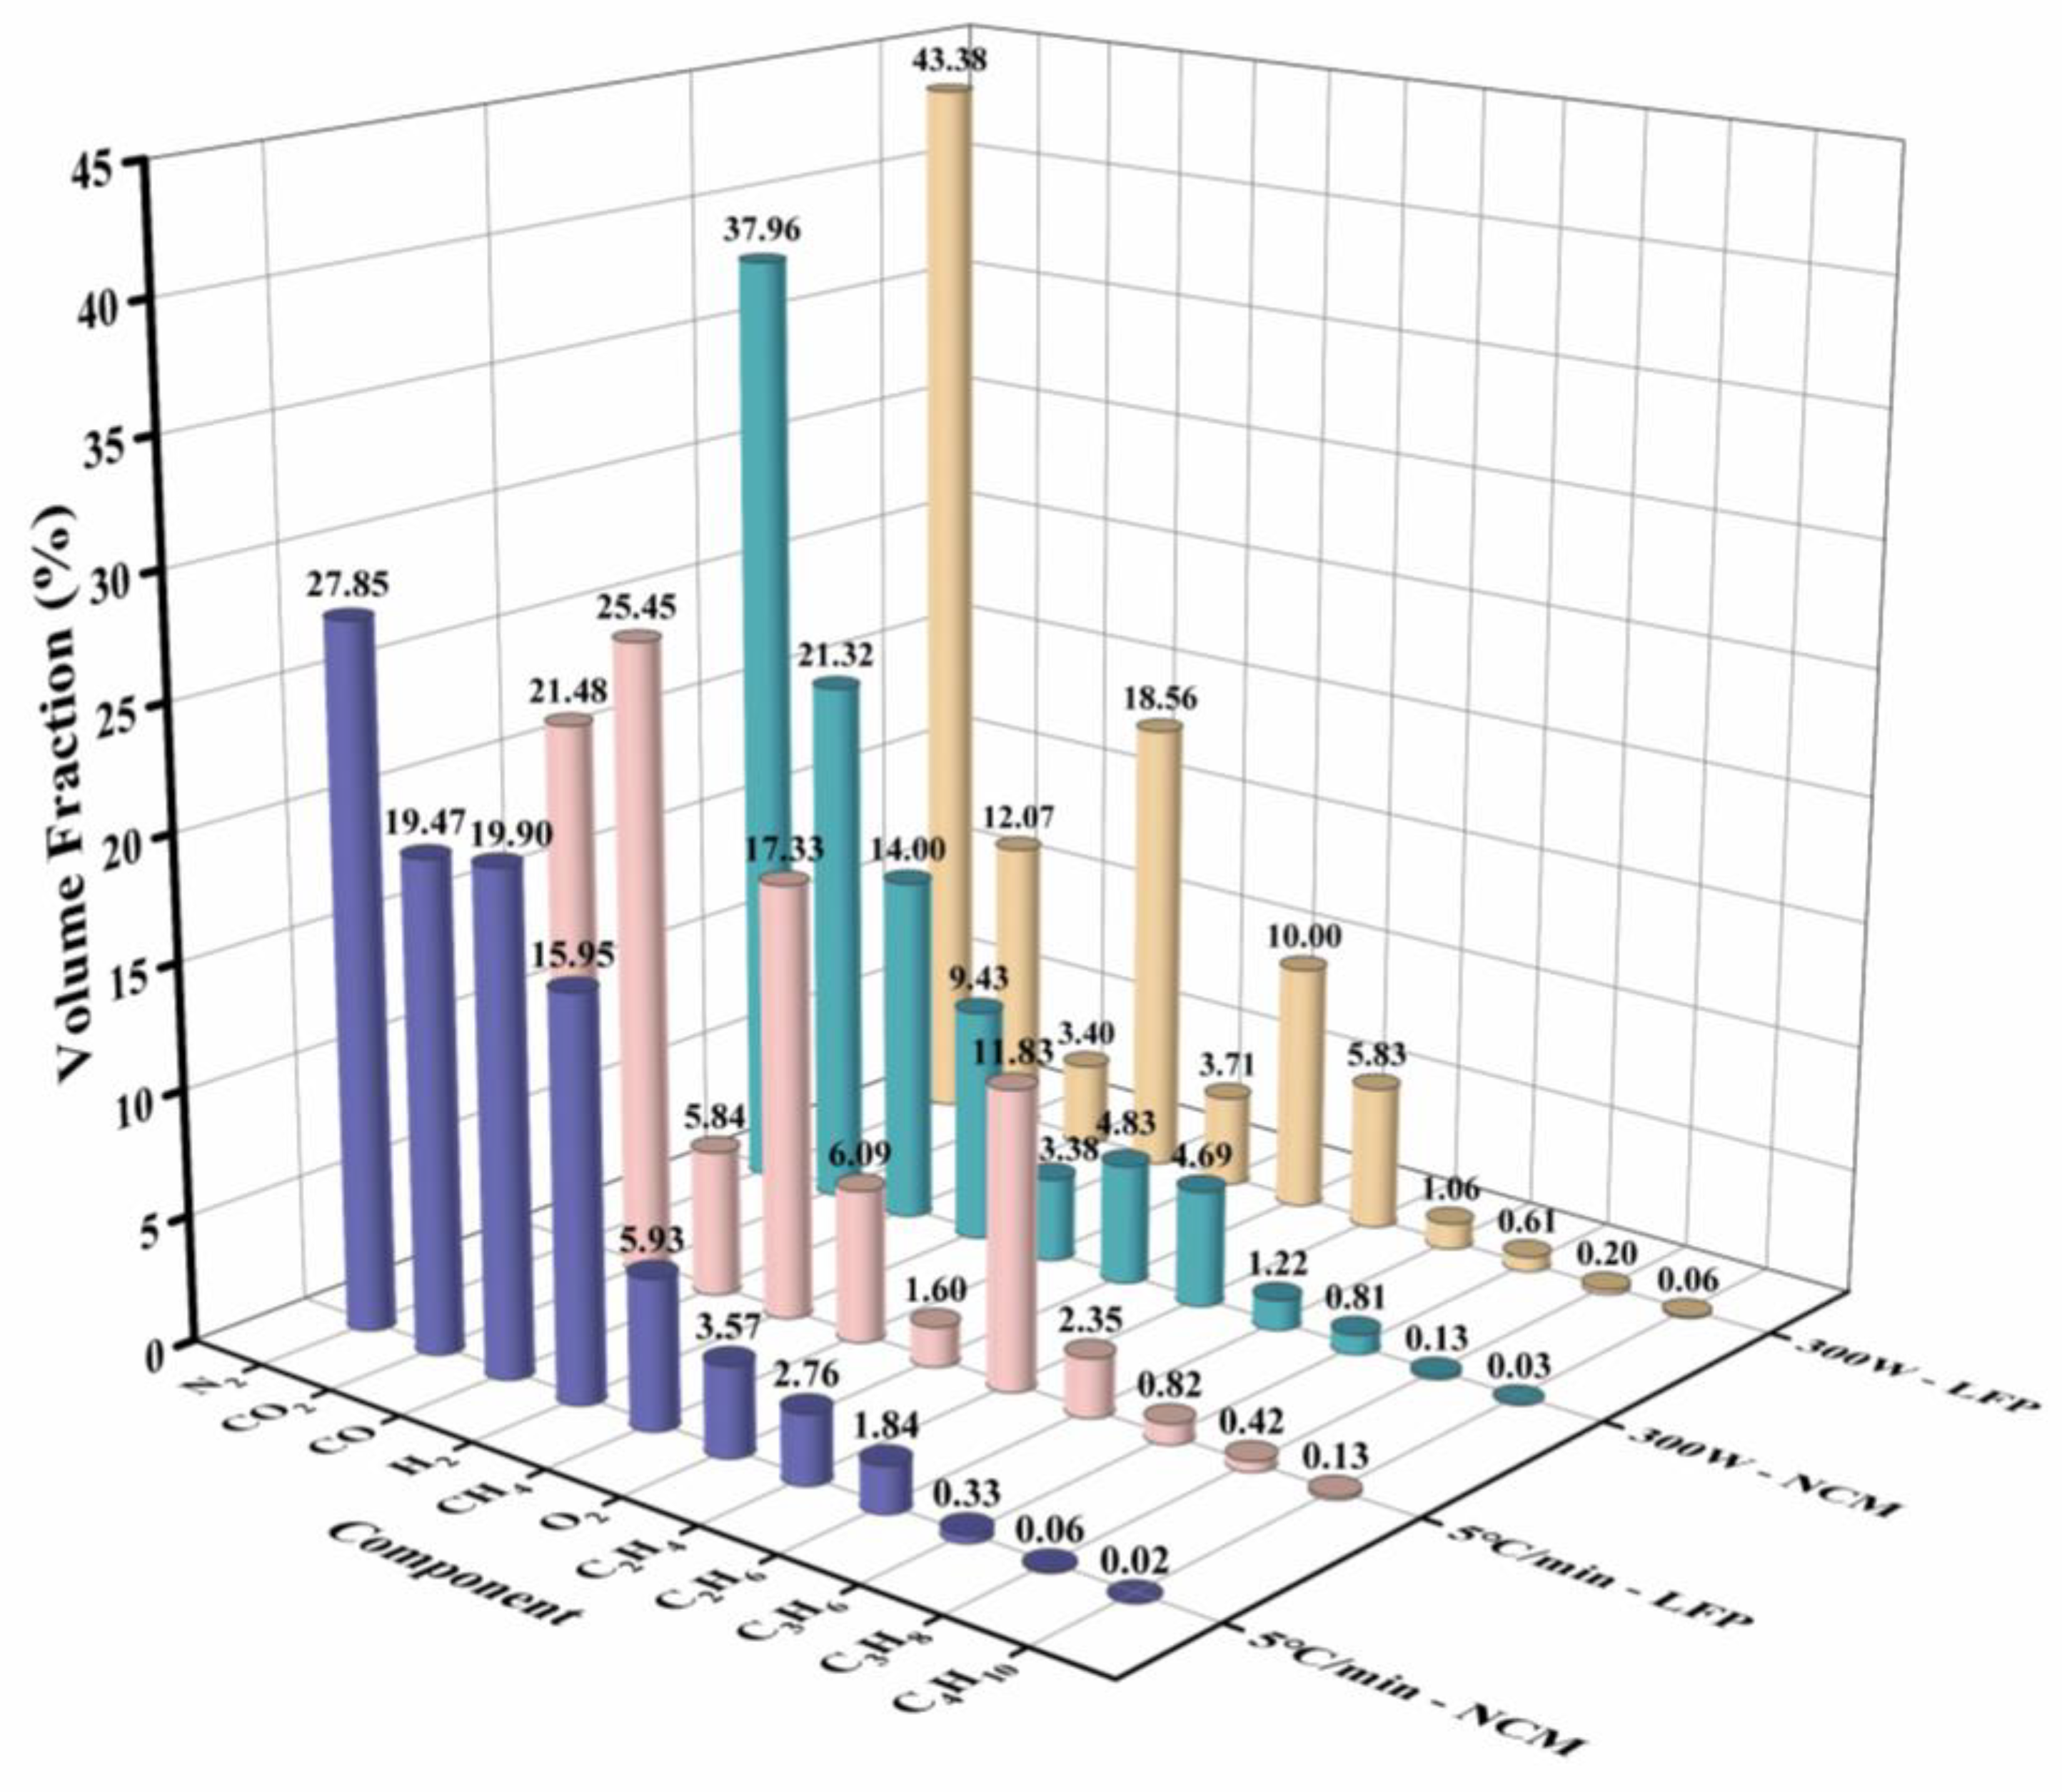
Table 2 and Figure 6 outline the gas constituents in LFP and NCM cells. Blank experiments were carried out in which we used a heating plate to heat the used materials in our tests, such as cables, foam, sealing materials, and thermocouples. Moreover the content of other substances is very low compared to the gas concentration released by the sample. Evidently, the primary gases at lower temperatures are H2, CO2, CO, CH4, and C3H8. These gases can quickly disperse in an environment, potentially causing fires or explosions. CO2 mainly originates from the SEI film degradation, reactions between the electrolyte and LiPF6, and interactions between the electrolyte and oxygen released from the cathode [44,45]. CO primarily results from incomplete hydrocarbon burning and CO2 reduction by lithium ions [46]. The gas venting process in electrolytes is crucial to understanding TR in LIBs, especially concerning flammable gases such as H2, CH4, and C2H4. Predominantly, H2 is formed through the H-abstraction from ethanol during pyrolysis, such as when carboxymethyl cellulose (CMC) and the binder polyvinylidene fluoride (PVDF) break down at elevated temperatures. When more oxygen is present, H-abstraction from acetaldehyde and formaldehyde becomes dominant [47]. It was observed that NCM cells release more CO than LFP cells, while H2 is more abundant in LFP cells [48,49]. The combined CO + CO2 volume in NCM cells hovers around 45%, while in LFP cells it is about 25%. This implies that the NCM cell has a heightened oxidizing capability compared to the LFP cell. Furthermore, the H2 content in the NCM cell (~10%) is lower than in the LFP cell (~20%). Given that H2 has a significantly lower explosion threshold than CO, post-TR vent gas explosion risks are considerably higher for LFP cells compared to NCM cells. This highlights the comparative dangers of vent gas mixtures in LFP cells versus NCM cells [26,39].

3.4. Early Warning Signal for Gas Production before TR

Flammable gas production led to a rise in the cell’s internal pressure, reaching the tolerance threshold of the NCM cell at 5216 s. This activated the relief vent, accompanied by a distinct sound. Immediately, a white electrolyte spill was noticed from the relief vent, coupled with gas evolution within the cell (Figure 7a). It is worth highlighting that the most intense combustion event was observed after the safety venting of the NCM cell. Before this, only a minimal amount of gas was released, paired with a slight electrolyte leak after the rupture of the relief vent, roughly 1585 s before the fire ejection (blue line). This serves as an early indicator during TR. In the case of the LFP cell, this was about 987 s before the fire, as depicted in Figure 7b. The early warning is attributed to minor gas leakage from the relief vent, stemming from the thermal distortion of the cell during TR’s initial phase.
We define the time of TR as the point when the temperature rise rate of the cell exceeds 1 °C s−1. As detailed in Table 3, the NCM cell exhibits a gas release signal approximately 1119 s (around 19 min) before the voltage drop. This is a notably longer lead time than the pressure rise signal. For the LFP cell, the gas release signal precedes the voltage drop by 391 s (roughly 7 min). Thus, the release of gas, which is currently recognized as an early warning indicator, occurs much before noticeable shifts in pressure, temperature, and voltage parameters.

3.5. Risk Assessment of TR Process

3.5.1. Definition of TRD

The TR behavior varies between NCM and LFP cells when subjected to the same trigger method. Similarly, the TR process of a single cell type can differ when initiated by different triggering methods. This highlights the pressing need for a standardized evaluation metric to assess the intensity of TR across various batteries under different triggering conditions.
Considering the external effects of high-temperature gas released during the TR process, especially in confined environments such as battery modules or packs, it becomes crucial to quantify the potential impact force. Such a measure can serve as an indicator of the TR process’s associated risks. Based on the momentum theorem, we can derive:
F t N m v
In this equation, F represents the impact force and t denotes the impact time, while the right-hand side of the equation signifies the collective momentum of all the gas molecules produced during the TR process.
Given that the velocity of the gas molecules is proportional to the square root of the temperature, we have:
v T 0.5
Additionally, the number of gas molecules can be represented in molar terms:
N = n N 0
where N0 is Avogadro’s constant. Therefore, we can obtain:
F t n T 0.5
Even though the impact time varies, the force will differ; however, the source of the impact is derived from the right side of the aforementioned equation. Consequently, TRD is defined as:
T R D = n g a s T m a x 0.5
Wherein ngas represents the molar quantity of gas produced during the TR process, calculated using the Ideal Gas Law [50]. Tmax is the peak temperature of the chamber throughout the test.
It is important to mention that TRD serves as a metric to gauge the severity of TR in various batteries under differing conditions; it is a relative value, not an absolute one.

3.5.2. Verification of TRD

To validate TRD as a consistent evaluation metric, numerous tests employing varied trigger methods were conducted to assess the consistency of the outcomes. NCM cells were used to examine the effect of different trigger methods on the test findings.
As depicted in Table 4 and Figure 8, a heating rate of 5 °C min−1 and an energy input of 300 W were employed to initiate the TR process for NMC and LFP cells. In the case of the heating trigger technique, differing methods imply varying energy levels being delivered to the cell. A higher heating rate means more rapid energy input per unit time. The relative deviation (RD) of results from two parallel tests is presented in Table 4.
Despite the variability observed during TR, the experimental TRD outcomes remain relatively consistent, suggesting that the repeatability can capture distinctions associated with different trigger methods, especially since the maximum RD is below 5%. Hence, TRD can be utilized as a defining metric for risk assessment in LIBs.

3.5.3. Application of TRD for Describing the TR Risk

The TRD, when assessed across varying trigger methods, can quantitatively depict the intensity of the TR process. Furthermore, TRD offers insight into the safety profile or risk evaluation of different cell types. When subjected to identical trigger methods, the TRD for NCM cells surpasses that of LFP cells, given their equivalent capacities. This indicates a heightened intensity in the TR process for NCM cells compared to LFP cells. Figure 8 illustrates the TRD for both NCM and LFP cells under the same trigger method. Utilizing a consistent trigger method, a cell’s TRD is influenced by its energy density and the materials of its anode. Hence, TRD can serve as a distinctive metric for gauging risk associated with LIBs.

4. Discussion and Summary

In this study, we employed various heating and overcharging trigger methods for TR experiments, simulating potential misuse scenarios in real-world applications, to evaluate and contrast the thermal and gas risks in NCM and LFP cells designed for electric vehicles. Our findings indicate that the combustible gas release precedes fire ejection by approximately 1585 s in NCM cells and 987 s in LFP cells. This early gas release can serve as a preemptive alert during the TR process, especially when an appropriate gas sensor is strategically placed within a battery pack. Additionally, by analyzing the molar quantity of gas produced and the peak temperature during the TR process, we can characterize the intensity of the TR behavior as TRD based on the consistency observed across numerous tests with varying trigger methods. The TRD, when assessed across different triggers, offers insight into the intensity of the TR process and the safety profile of various cell types. Given that the maximum RD is less than 5%, TRD emerges as a valuable parameter for risk evaluation in LIBs.
In conclusion, the following aspects could be considered during further research.
First, future experiments will incorporate other triggers, such as gradient heating, overcharging, and nail penetration, to further refine TRD assessments for different cell types. In addition, current studies on the TRD are mainly conducted on fresh cells. Aged LIBs should be analyzed, since the TR characteristics of aged LIBs differ significantly from those of new ones.
Second, the reliability of gas sensors used in battery systems needs further verification. We have begun collaborations with several automotive companies to validate the efficacy and dependability of sensors integrated into battery systems for early warning signals and to harness TRD for assessing risk across different cell types.
Finally, we believe that applying gas sensors in battery systems and TRD evaluation systems could effectively ensure the safety of electric vehicles.

Author Contributions

Conceptualization, Z.Y. and Y.F.; methodology, Y.C. and D.S.; investigation, S.B.; validation, X.Z.; data curation, Z.W.; writing—original draft preparation, Y.C.; writing—review and editing, Z.Y. and Y.F.; resources, L.M., M.O. and T.F. All authors have read and agreed to the published version of the manuscript.

Funding

This research was supported by the National Key Research and Development Program of China (No. 2021YFB2012504) and Beijing Natural Science Foundation (2214066), Beijing Science and technology plan (Z221100005222004), and Beijing Goldbridge Project.

Data Availability Statement

Not applicable.

Acknowledgments

Sheng Fang gave the suggestion of choosing the type of gas sensors in this project. Weiqing Hua and Shiqiang Gao gave the suggestion of chamber design. Hang Zhang simulated the gas production process.

Conflicts of Interest

The authors declare no conflict of interest.

References

  1. Hu, G.; Huang, P.; Bai, Z.; Wang, Q.; Qi, K. Comprehensively analysis the failure evolution and safety evaluation of automotive lithium ion battery. eTransportation 2021, 10, 100140. [Google Scholar] [CrossRef]
  2. Tomaszewska, A.; Chu, Z.; Feng, X.; O’Kane, S.; Liu, X.; Chen, J.; Ji, C.; Endler, E.; Li, R.; Liu, L.; et al. Lithium-ion battery fast charging: A review. eTransportation 2019, 1, 100011. [Google Scholar] [CrossRef]
  3. Aiello, L.; Hanzu, I.; Gstrein, G.; Ewert, E.; Ellersdorfer, C.; Sinz, W. Analysis and Investigation of Thermal Runaway Propagation for a Mechanically Constrained Lithium-Ion Pouch Cell Module. Batteries 2021, 7, 49. [Google Scholar] [CrossRef]
  4. Wilke, S.; Schweitzer, B.; Khateeb, S.; Al-Hallaj, S. Preventing thermal runaway propagation in lithium ion battery packs using a phase change composite material: An experimental study. J. Power Sources 2017, 340, 51–59. [Google Scholar] [CrossRef]
  5. Wang, H.; Du, Z.; Rui, X.; Wang, S.; Jin, C.; He, L.; Zhang, F.; Wang, Q.; Feng, X. A comparative analysis on thermal runaway behavior of Li(NixCoyMnz)O2 battery with different nickel contents at cell and module level. J. Hazard. Mater. 2020, 393, 122361. [Google Scholar] [CrossRef]
  6. Ren, D.; Feng, X.; Lu, L.; Ouyang, M.; Zheng, S.; Li, J.; He, X. An electrochemical-thermal coupled overcharge-to-thermal-runaway model for lithium ion battery. J. Power Sources 2017, 364, 328–340. [Google Scholar] [CrossRef]
  7. Ren, D.; Feng, X.; Lu, L.; Li, J.; Ouyang, M. Comparison of the Overcharge Behaviors of Lithium-ion Batteries Under Different Test Conditions. Energy Procedia 2019, 158, 4921–4926. [Google Scholar] [CrossRef]
  8. Sun, P.; Bisschop, R.; Niu, H.; Huang, X. A Review of Battery Fires in Electric Vehicles. Fire Technol. 2020, 56, 1361–1410. [Google Scholar] [CrossRef]
  9. Spotnitz, R.; Franklin, J. Abuse behavior of high-power, lithium-ion cells. J. Power Sources 2003, 113, 81–100. [Google Scholar] [CrossRef]
  10. Belov, D.; Yang, M.-H. Failure mechanism of Li-ion battery at overcharge conditions. J. Solid State Electrochem. 2008, 12, 885–894. [Google Scholar] [CrossRef]
  11. Zhu, X.; Wang, Z.; Wang, Y.; Wang, H.; Wang, C.; Tong, L.; Yi, M. Overcharge investigation of large format lithium-ion pouch cells with Li(Ni0.6Co0.2Mn0.2)O2 cathode for electric vehicles: Thermal runaway features and safety management method. Energy 2019, 169, 868–880. [Google Scholar] [CrossRef]
  12. Wang, Q.; Ping, P.; Zhao, X.; Chu, G.; Sun, J.; Chen, C. Thermal runaway caused fire and explosion of lithium ion battery. J. Power Sources 2012, 208, 210–224. [Google Scholar] [CrossRef]
  13. Zhang, J.; Zhang, L.; Sun, F.; Wang, Z. An Overview on Thermal Safety Issues of Lithium-ion Batteries for Electric Vehicle Application. IEEE Access 2018, 6, 23848–23863. [Google Scholar] [CrossRef]
  14. Xiao, B.; Xiao, B.; Liu, L. State of Health Estimation for Lithium-Ion Batteries Based on the Constant Current–Constant Voltage Charging Curve. Electronics 2020, 9, 1279. [Google Scholar] [CrossRef]
  15. Mc Carthy, K.; Gullapalli, H.; Ryan, K.M.; Kennedy, T. Use of Impedance Spectroscopy for the Estimation of Li-ion Battery State of Charge, State of Health and Internal Temperature. J. Electrochem. Soc. 2021, 168, 080517. [Google Scholar] [CrossRef]
  16. Ohneseit, S.; Finster, P.; Floras, C.; Lubenau, N.; Uhlmann, N.; Seifert, H.J.; Ziebert, C. Thermal and Mechanical Safety Assessment of Type 21700 Lithium-Ion Batteries with NMC, NCA and LFP Cathodes-Investigation of Cell Abuse by Means of Accelerating Rate Calorimetry (ARC). Batteries 2023, 9, 237. [Google Scholar] [CrossRef]
  17. Zhou, W.; Liu, Z.; Chen, W.; Sun, X.; Luo, M.; Zhang, X.; Li, C.; An, Y.; Song, S.; Wang, K.; et al. A Review on Thermal Behaviors and Thermal Management Systems for Supercapacitors. Batteries 2023, 9, 128. [Google Scholar] [CrossRef]
  18. Ribière, P.; Grugeon, S.; Morcrette, M.; Boyanov, S.; Laruelle, S.; Marlair, G. Investigation on the fire-induced hazards of Li-ion battery cells by fire calorimetry. Energy Environ. Sci. 2012, 5, 5271–5280. [Google Scholar] [CrossRef]
  19. Larsson, F.; Andersson, P.; Blomqvist, P.; Mellander, B.-E. Toxic fluoride gas emissions from lithium-ion battery fires. Sci. Rep. 2017, 7, 10018. [Google Scholar] [CrossRef]
  20. Roth, E.P.; Doughty, D.H. Thermal abuse performance of high-power 18650 Li-ion cells. J. Power Sources 2004, 128, 308–318. [Google Scholar] [CrossRef]
  21. Garcia, M.; Nagasubramanian, G.; Tallant, D.R.; Roth, E.P. Instability of Polyvinylidene Fluoride-Based Polymeric Binder in Lithium-Ion Cells: Final Report; Sandia National Lab.: Livermore, CA, USA, 1999. [CrossRef]
  22. Feng, X.; Fang, M.; He, X.; Ouyang, M.; Lu, L.; Wang, H.; Mingxuan, Z. Thermal runaway features of large format prismatic lithium ion battery using extended volume accelerating rate calorimetry. J. Power Sources 2014, 255, 294–301. [Google Scholar] [CrossRef]
  23. Chen, W.-C.; Wang, Y.-W.; Shu, C.-M. Adiabatic calorimetry test of the reaction kinetics and self-heating model for 18650 Li-ion cells in various states of charge. J. Power Sources 2016, 318, 200–209. [Google Scholar] [CrossRef]
  24. Sun, J.; Li, J.; Zhou, T.; Yang, K.; Wei, S.; Tang, N.; Dang, N.; Li, H.; Qiu, X.; Chen, L. Toxicity, a serious concern of thermal runaway from commercial Li-ion battery. Nano Energy 2016, 27, 313–319. [Google Scholar] [CrossRef]
  25. Ma, L.; Nie, M.; Xia, J.; Dahn, J.R. A systematic study on the reactivity of different grades of charged Li[NixMnyCoz]O2 with electrolyte at elevated temperatures using accelerating rate calorimetry. J. Power Sources 2016, 327, 145–150. [Google Scholar] [CrossRef]
  26. Zhang, Q.; Liu, T.; Hao, C.; Qu, Y.; Niu, J.; Wang, Q.; Chen, D. In situ Raman investigation on gas components and explosion risk of thermal runaway emission from lithium-ion battery. J. Energy Storage 2022, 56, 105905. [Google Scholar] [CrossRef]
  27. Meng, X.; Yang, K.; Zhang, M.; Gao, F.; Liu, Y.; Duan, Q.; Wang, Q. Experimental study on combustion behavior and fire extinguishing of lithium iron phosphate battery. J. Energy Storage 2020, 30, 101532. [Google Scholar] [CrossRef]
  28. Baird, A.R.; Archibald, E.J.; Marr, K.C.; Ezekoye, O.A. Explosion hazards from lithium-ion battery vent gas. J. Power Sources 2020, 446, 227257. [Google Scholar] [CrossRef]
  29. Li, W.; Wang, H.; Zhang, Y.; Ouyang, M. Flammability characteristics of the battery vent gas: A case of NCA and LFP lithium-ion batteries during external heating abuse. J. Energy Storage 2019, 24, 100775. [Google Scholar] [CrossRef]
  30. Harris, S.J.; Timmons, A.; Pitz, W.J. A combustion chemistry analysis of carbonate solvents used in Li-ion batteries. J. Power Sources 2009, 193, 855–858. [Google Scholar] [CrossRef]
  31. Weng, J.; Ouyang, D.; Yang, X.; Chen, M.; Zhang, G.; Wang, J. Alleviation of thermal runaway propagation in thermal management modules using aerogel felt coupled with flame-retarded phase change material. Energy Convers. Manag. 2019, 200, 112071. [Google Scholar] [CrossRef]
  32. Golubkov, A.W.; Scheikl, S.; Planteu, R.; Voitic, G.; Wiltsche, H.; Stangl, C.; Fauler, G.; Thaler, A.; Hacker, V. Thermal runaway of commercial 18650 Li-ion batteries with LFP and NCA cathodes–impact of state of charge and overcharge. RSC Adv. 2015, 5, 57171–57186. [Google Scholar] [CrossRef]
  33. Li, H.; Peng, W.; Yang, X.; Chen, H.; Sun, J.; Wang, Q. Full-Scale Experimental Study on the Combustion Behavior of Lithium Ion Battery Pack Used for Electric Vehicle. Fire Technol. 2020, 56, 2545–2564. [Google Scholar] [CrossRef]
  34. Jia, T.; Zhang, Y.; Ma, C.; Li, S.; Yu, H.; Liu, G. The early warning for overcharge thermal runaway of lithium-ion batteries based on a composite parameter. J. Power Sources 2023, 555, 232393. [Google Scholar] [CrossRef]
  35. Liao, Z.; Zhang, S.; Li, K.; Zhang, G.; Habetler, T.G. A survey of methods for monitoring and detecting thermal runaway of lithium-ion batteries. J. Power Sources 2019, 436, 226879. [Google Scholar] [CrossRef]
  36. Ouyang, D.; Liu, J.; Chen, M.; Wang, J. Investigation into the Fire Hazards of Lithium-Ion Batteries under Overcharging. Appl. Sci. 2017, 7, 1314. [Google Scholar] [CrossRef]
  37. Feng, X.; Zheng, S.; Ren, D.; He, X.; Wang, L.; Cui, H.; Liu, X.; Jin, C.; Zhang, F.; Xu, C.; et al. Investigating the thermal runaway mechanisms of lithium-ion batteries based on thermal analysis database. Appl. Energy 2019, 246, 53–64. [Google Scholar] [CrossRef]
  38. Raijmakers, L.H.J.; Danilov, D.L.; Eichel, R.A.; Notten, P.H.L. A review on various temperature-indication methods for Li-ion batteries. Appl. Energy 2019, 240, 918–945. [Google Scholar] [CrossRef]
  39. Stephens, D.; Shawcross, P.; Stout, G.; Sullivan, E.; Saunders, J.; Risser, S.; Sayre, J. Lithium-Ion Battery Safety Issues for Electric and Plug-in Hybrid Vehicles; National Highway Traffic Safety Administration: Washington, DC, USA, 2017.
  40. Wang, Z.; Zhu, K.; Hu, J.; Wang, J. Study on the fire risk associated with a failure of large-scale commercial LiFePO4/graphite and LiNixCoyMn1-x-yO2/graphite batteries. Energy Sci. Eng. 2019, 7, 411–419. [Google Scholar] [CrossRef]
  41. Jia, Z.; Qin, P.; Li, Z.; Wei, Z.; Jin, K.; Jiang, L.; Wang, Q. Analysis of gas release during the process of thermal runaway of lithium-ion batteries with three different cathode materials. J. Energy Storage 2022, 50, 104302. [Google Scholar] [CrossRef]
  42. Qiu, M.; Liu, J.; Cong, B.; Cui, Y. Research Progress in Thermal Runaway Vent Gas Characteristics of Li-Ion Battery. Batteries 2023, 9, 411. [Google Scholar] [CrossRef]
  43. Zou, K.; He, K.; Lu, S. Venting composition and rate of large-format LiNi0.8Co0.1Mn0.1O2 pouch power battery during thermal runaway. Int. J. Heat Mass Transf. 2022, 195, 123133. [Google Scholar] [CrossRef]
  44. Kong, W.; Li, H.; Huang, X.; Chen, L. Gas evolution behaviors for several cathode materials in lithium-ion batteries. J. Power Sources 2005, 142, 285–291. [Google Scholar] [CrossRef]
  45. Browning, K.L.; Baggetto, L.; Unocic, R.R.; Dudney, N.J.; Veith, G.M. Gas evolution from cathode materials: A pathway to solvent decomposition concomitant to SEI formation. J. Power Sources 2013, 239, 341–346. [Google Scholar] [CrossRef]
  46. Li, Y.; Jiang, L.; Huang, Z.; Jia, Z.; Qin, P.; Wang, Q. Pressure Effect on the Thermal Runaway Behaviors of Lithium-Ion Battery in Confined Space. Fire Technol. 2022, 59, 1137–1155. [Google Scholar] [CrossRef]
  47. Zhang, J.; Zhong, A.; Huang, Z.; Han, D. Experimental and kinetic study on the stabilities and gas generation of typical electrolyte solvent components under oxygen-lean oxidation and pyrolysis conditions. Sci. China Technol. Sci. 2022, 65, 2883–2894. [Google Scholar] [CrossRef]
  48. Song, L.; Huang, Z.; Mei, W.; Jia, Z.; Yu, Y.; Wang, Q.; Jin, K. Thermal runaway propagation behavior and energy flow distribution analysis of 280 Ah LiFePO4 battery. Process Saf. Environ. Prot. 2023, 170, 1066–1078. [Google Scholar] [CrossRef]
  49. Yuan, L.; Dubaniewicz, T.; Zlochower, I.; Thomas, R.; Rayyan, N. Experimental study on thermal runaway and vented gases of lithium-ion cells. Process Saf. Environ. Prot. 2020, 144, 186–192. [Google Scholar] [CrossRef]
  50. Rideout, K. Barron’s AP Physics; Barron’s Educational Series; World Publishing Corporation: New York, NY, USA, 2015; p. 313. [Google Scholar]
Figure 1. Four stages of the heat-triggered TR process of a cell.
Batteries 09 00438 g001
Figure 2. Schematic diagram of experimental platform.
Batteries 09 00438 g002
Figure 3. Physical images of the NCM cell before (a) and after (b,c) the experiment, and the LFP cell before (d) and after (e,f) the experiment.
Batteries 09 00438 g003
Figure 4. Curve of voltage for the NCM cell, chamber temperature and pressure, and the central (TC-1) and relief vent (TC-2) temperatures of the cell when heated at 5 °C min−1 and by 300 W: (a) NCM cell−5 °C min−1, (b) LFP cell−5 °C min−1; (c) NCM cell−300 W; (d) LFP cell−300 W.
Batteries 09 00438 g004
Figure 5. Comparison of the NCM cell (black) and LFP cell (red): curves showing cell voltage, chamber temperature, and pressure during heating at 5 °C min−1 (a) and heating at 300 W (b).
Batteries 09 00438 g005
Figure 6. Percentage of individual gas components in LFP and NCM cells after TR.
Batteries 09 00438 g006
Figure 7. Voltage and surface temperature curve of the cell, along with chamber pressure during heating: (a) NCM cell; (b) LFP cell.
Batteries 09 00438 g007
Figure 8. TRD of NCM and LFP cells during the process of TR.
Batteries 09 00438 g008
Table 1. Specification of the tested lithium-ion cells.
ParameterCell Type #1Cell Type #2
typeprismatic hard caseprismatic hard case
cathode materialNMCLFP
anode materialgraphitegraphite
capacity50 Ah50 Ah
nominal voltage3.6 V3.2 V
gravimetric energy density180 Wh kg−1130 Wh kg−1
electrode designjelly rolljelly roll
separatorPolyethylenePolyethylene
mass of separator17 g24 g
Size175 (W) 100 (H) 28 (D) mm140 (W) 200 (H) 28 (D) mm
Table 2. Proportions of gas components in LFP and NCM cells following TR.
NCM Cell—5 °C min−1LFP Cell—5 °C min−1NCM Cell—300 WLFP Cell—300 W
CH45.93 6.09 4.38 4.71
C2H61.84 2.35 1.22 1.06
C2H42.76 11.83 4.69 5.83
C3H80.06 0.42 0.13 0.20
C3H60.33 0.82 0.81 0.61
C4H100.02 0.13 0.03 0.06
H215.95 17.33 9.43 18.56
CO219.47 25.45 21.32 12.07
O24.57 1.60 4.83 10.00
N227.85 21.48 37.96 43.38
CO19.90 5.84 14.004.40
Table 3. Forewarning time for voltage drop, pressure rise, and gas release during the TR process.
NCM CellLFP Cell
Grel-TR (s)1585987
Vdrop-TR(s)466596
Prise-TR (s)5430
Vdrop: time for the onset of cell voltage drop. Prise: time for the onset of pressure increase in the chamber. Grel: time for the commencement of gas release. TR: time when the temperature rise rate of the cell exceeds 1 °C s−1.
Table 4. TRD of NCM cells during the process of TR.
NCM Cell—5 °C min−1NCM—Cell 300 WLFP Cell—5 °C min−1LFP Cell—300 W
TRD-1191.1190.5 192.0101.4
TRD-2192.9205.0193.195.6
RD0.5%3.7%0.3%2.9%
TRD: TR degree, n g a s T m a x 0.5 ; RD: relative deviation.
Disclaimer/Publisher’s Note: The statements, opinions and data contained in all publications are solely those of the individual author(s) and contributor(s) and not of MDPI and/or the editor(s). MDPI and/or the editor(s) disclaim responsibility for any injury to people or property resulting from any ideas, methods, instructions or products referred to in the content.