Article

New Mass Transport Correlation for Vanadium Redox-Flow Batteries Based on a Model-Assisted Parameter Estimation

Institute of Chemical and Electrochemical Process Engineering, Clausthal University of Technology, 38678 Clausthal-Zellerfeld, Germany
*
Author to whom correspondence should be addressed.
Batteries 2023, 9(5), 253; https://doi.org/10.3390/batteries9050253
Submission received: 21 February 2023 / Revised: 11 April 2023 / Accepted: 23 April 2023 / Published: 28 April 2023
(This article belongs to the Section Battery Modelling, Simulation, Management and Application)

Abstract

:
In this work, a two-dimensional mathematical model is applied to develop a new mass transport correlation for an SGL GFD4.6A carbon felt applied in a 100 cm2 single cell vanadium redox-flow battery under realistic flow conditions. Already published mass transport equations for carbon felt electrodes show a large variation for the resulting Sherwood numbers and are summarized in this work to narrow the probable range of mass transport parameters. A detailed investigation of electrolyte properties, impedance spectroscopic characterization for evaluation of kinetic properties, and the use of potential probe signals to identify the overpotential of positive and negative electrodes are carried out before mass transport parameter estimation by a comparison of model and experimental data. The model validation yields a good agreement between predicted and experimental data with the following new and reliable mass transport equation: Sh = 0.07 Re 0.66 Sc0.45 (0.0018 < Re < 0.11). The characteristic length applied for the Sherwood and Reynolds number is the diameter of the carbon felt fibers.

1. Introduction

In the challenge to reduce carbon dioxide emissions, the capacity of wind power and photovoltaic plants is increasing. Due to their fluctuating power supply, they necessitate energy storage systems to balance power supply and demand. Vanadium redox-flow batteries (VRFB) are promising energy storage utilities with large-scale installations in the kW and MW range [1]. However, further cost reduction and improved performance characteristics are required to compete successfully with other types of batteries, such as lithium-ion batteries [2,3]. Besides further optimization of electrolytes, electrodes, membranes, and bipolar plates, as well as experimental studies on whole cells with or without in-situ tools [4], mathematical modelling is a very helpful method to gain further improvements in the field of cell or stack design [5,6,7,8,9]. Models can be applied to predict the behavior of a specific cell design and to optimize its operational conditions, such as flow rate or current density to achieve high system efficiencies [10,11,12,13]. Other aspects are the identification of limiting system components and the impact of changing critical parameters of these components. Further opportunities are related to the performance prediction of new combinations of components or the estimation of peak power or state of health [11]. However, valid models that are rigorously tested are mandatory to achieve reliable outcomes, and model validation is often carried out quite briefly based on a single or a few charge and discharge cycles or a few polarization curves [14,15,16,17,18,19]. The combined evaluation of reliable kinetic and mass transport parameters for an electrode material, as well as realistic values for membrane resistances, is especially vital to enable the model to predict the behavior of the cell precisely. Although kinetic parameters are easily affected by different functionalization techniques [20,21,22] or by electrochemical aging during operation [23,24], mass transport is mainly dependent on the general structure of the electrode and the flow conditions (Reynolds number, Schmidt number). Therefore, a well-defined mass transport correlation is very useful in model-assisted cell design optimization, provided the electrode structure or electrode type remains unchanged.
This work focuses on the evaluation of a reliable mass transport equation. A literature overview on available mass transport correlations is given at the beginning, followed by the validation of a two-dimension model based on polarization curves for a large variation of flow rate and state of charge. Following our previous work [25], the kinetic parameters of the felt are evaluated based on impedance spectroscopic data, and membrane resistances are evaluated accordingly by signals of liquid phase potential-probes. The mass transport parameters are determined using the parameter estimation tool of gPROMS® Model builder. Through this combined approach of multiple tools such as in-situ potential-probes, impedance spectroscopy, application of a large operation parameter window and use of a mathematical model for parameter estimation, we expect to achieve a robust and valid parameter setting. To the best of the authors’ knowledge, it is the first time that such a cross-sectional setup for parameter estimation has been presented that will help to develop reliable models for VRFBs.

2. Overview of Mass Transport Correlations for Felt Electrodes
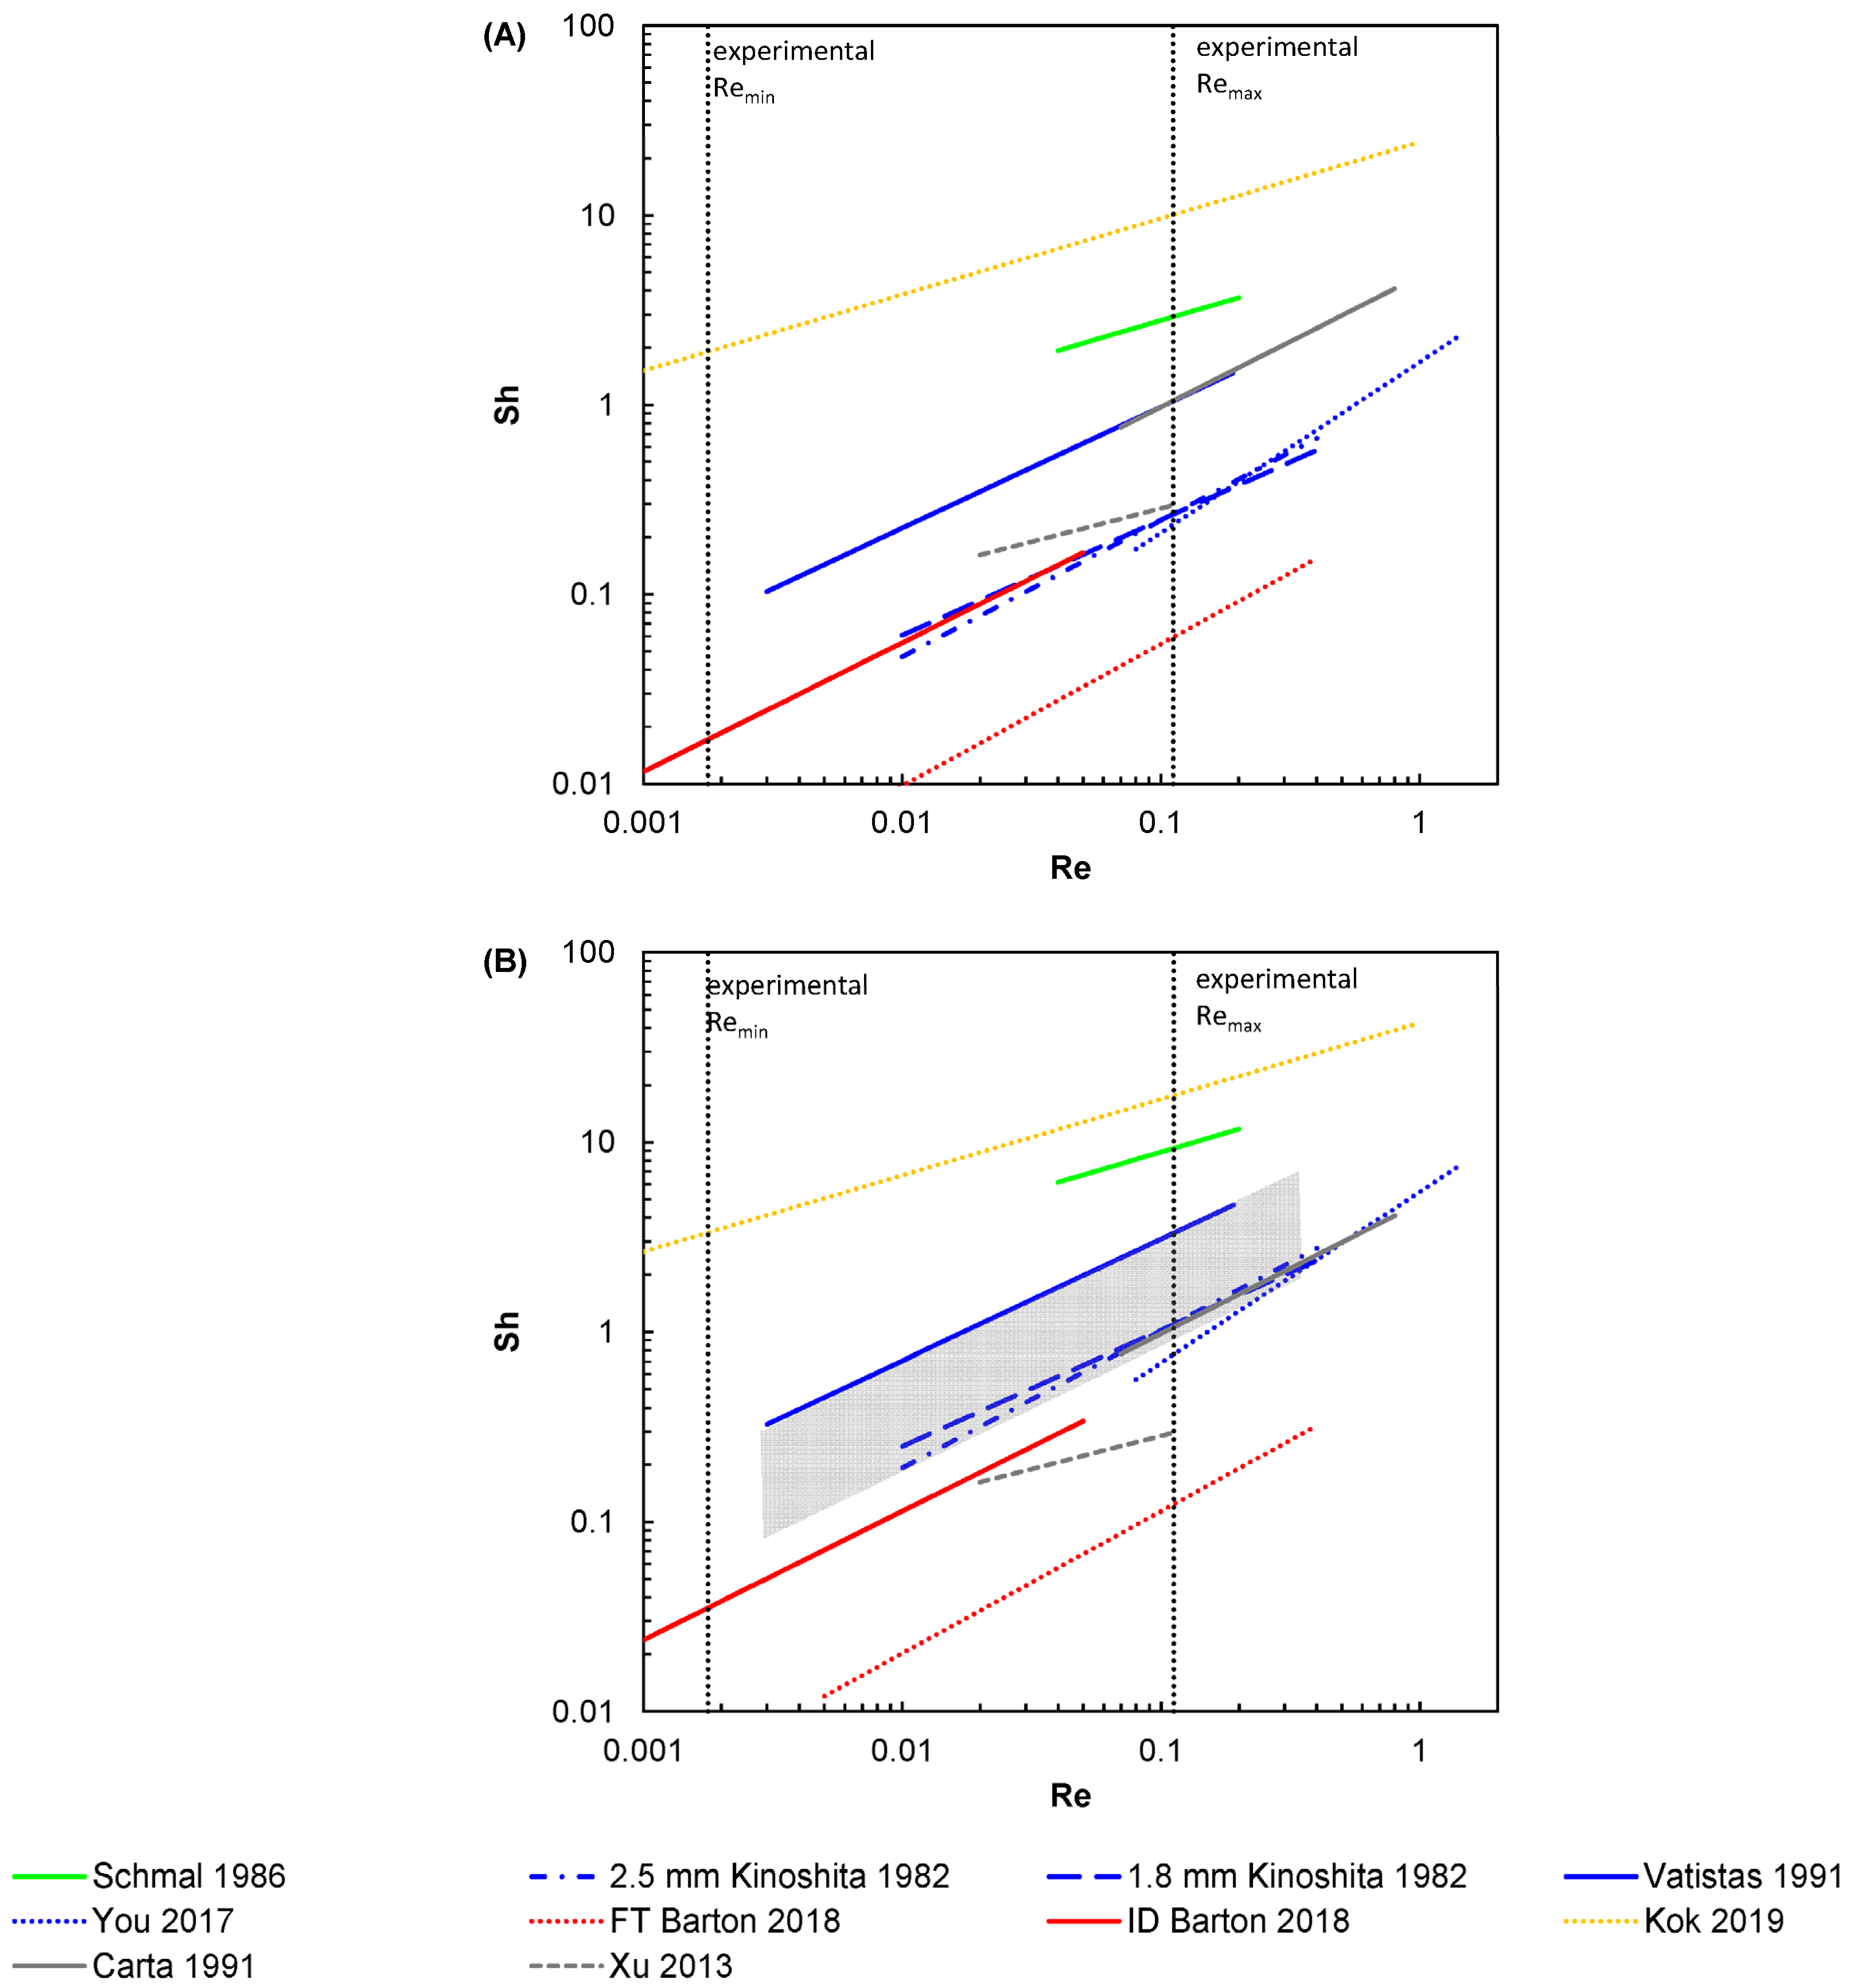
Mass transport in a carbon felt electrode of a redox-flow battery takes place at the interface area between the liquid electrolyte phase and the solid phase of the carbon felt’s fibers (see Figure 1). The mass flux Ji from the bulk electrolyte phase to the carbon fiber surface can be described by Fickian diffusion as shown in Equation (1),
J i = c bulk , i c surf , i δ i · D i
where cbulk,i represents the concentration of species i in the electrolyte phase and csurf,i describes the concentration at the surface of the carbon felt fiber. δi is the thickness of the diffusion boundary layer and Di defines the diffusion coefficient of species i in the surrounding electrolyte. In general, the thickness of the diffusion boundary layer decreases with a higher flow rate, since this leads to higher shear-rates at the fiber electrolyte interface, resulting in higher mass transfer rates to the carbon fiber surface. Another way to describe mass transport is the use of the mass transfer coefficient km,i, representing the ratio of the diffusion coefficient and thickness of the diffusion boundary layer (c.f. Equation (2)). However, it must be considered that the diffusion coefficient of each species influences this parameter and therefore a correlation that describes only one vanadium species (VS) should not be used for other species:
k m , i = D i δ i
On the microscopic scale, a mathematical description of the diffusion boundary layer in a carbon felt electrode with its randomly ordered carbon fibers would be quite complex since the distance between two fibers is constantly changing, and the alignment of the fibers can be parallel or perpendicular to the flow or anything in between, some of the fibers may have contact to each other leading to partially blocked areas and the diffusion boundary layer itself probably won’t have a constant thickness around a single fiber. Thus, an analytical approach to quantify the diffusion boundary layer is quite a challenging task. However, a very common way to describe the dependence between flow rate and mass transport is the use of a dimensionless averaged value for the mass transport coefficient of a certain geometry depending on a dimensionless flow rate [26]. Sherwood Shi and Reynolds Re numbers, describing the dimensionless mass transport and the flow velocity are defined as shown in Equations (3) and (4).
S h i = k m , i · L D i
R e = u · ρ el · L μ el
L is the characteristic length of the applied geometry, u is the superficial flow velocity through the geometry ρel and µel are the density and the dynamic viscosity of the electrolyte, respectively. The dependence between the Reynolds number and the Sherwood number can be expressed in a general form, as depicted in Equation (5).
S h i = a Sh R e b Sh S c i c Sh
In this equation aSh, bSh, and cSh are parameters that can be derived analytically for more simple geometries or experimentally for complex structures or geometries. Usually, the exponents bSh and cSh are in the range of ⅓ to ½, but higher values are also possible [27,28]. Sci is the Schmidt number representing the ratio of kinematic viscosity and diffusion coefficient as defined in equation 6 for a given exemplary species i:
S c i = μ el ρ el · D i
Several publications deal with the mass transport to porous carbon felts or single carbon fibers. One of the first works was published by Kinoshita et al., who investigated the reduction reaction of bromine in a zinc halide electrolyte that was pumped through the electrode [29]. The electrodes under investigation were two carbon felt electrodes with a porosity of 86% and 90% and quite thick carbon fibers with a diameter of 25.4 µm. In their work the carbon fiber diameter was chosen as the characteristic length for the calculation of the Reynolds and Sherwood numbers, as it was repeated in most of the following publications (c.f. Table 1). Schmal et al. determined the mass transport to single carbon fibers in a 1 M potassium hydroxide solution containing small amounts of dissolved potassium hexacyanoferrate(III), that underwent reduction at the carbon fiber [30]. They applied the carbon fiber diameter as characteristic length as well, and their mass transport correlation is applied in a large number of mathematical models describing vanadium redox-flow batteries [14,31,32,33,34,35,36,37,38,39,40,41,42,43,44,45,46,47,48,49,50,51,52,53]. Other mass transport correlations are summarized in Table 1, whereas all correlations apply the carbon fiber diameter as the characteristic length. A different approach can be found in the two correlations of Table 2, where the hydraulic diameter dh of the carbon felt represents the characteristic length. It can be derived from the carbon fiber diameter df and the porosity ε of the electrode, according to Equation (7) [54]:
d h = d f ε 1 ε
The hydraulic diameter—sometimes called pore diameter—is the mean distance between all carbon fibers. If the fibers would be arranged perfectly parallel and evenly distributed, this would imply a maximum diffusion length of half of the hydraulic diameter. Following this assumption, the mass transport correlation of Xu et al. comprises a constant offset of two for the Sherwood number [55]. Independent from the reliability of this assumption, it is important to consider that carbon fibers in the carbon felt electrode are structured quite randomly with some regions where two or more fibers are in contact and other regions where the distance to the adjacent fiber is considerably higher than the mean distance.
Table 1. Mass transport correlations for carbon-based fibrous materials—fiber diameter applied as characteristic length. * Schmidt number was calculated based on the given diffusion coefficient and a kinematic viscosity estimated from the graphical information on flow velocity and Reynolds numbers. ** Parameters fitted to the published graphical data points. Schmidt number derived by the ratio of Peclet to Reynolds number from published data sets (Peclet number: Pei = df·u/DiPei = Re·Sci).
ReferenceCorrelation(s)ElectrolyteElectrodeSchmidt Number
Kinoshita et al.
[29]
Sh = 1.29 Re0.72
Sh = 1.01 Re0.61
0.01 < Re < 0.4
6 to 62 mM Br2 in
2 M ZnBr2 +
1M ZnCl2 +
3 M KCl
Carbon felt, type CH, Fiber Materials Inc.
Fiber diameter:
25.4 µm
~900 *
Schmal et al.
[30]
Sh = 7 Re0.4
0.04 ≤ Re ≤ 0.2
0.1 to 10 mM K3Fe(CN)6 in
1 M KOH
Carbon fiber,
Le Carbone Lorraine AGT/FT10 000
Fiber diameter:
8 µm
~1600
(estimated to be similar to Vatistas et al.)
Vatistas et al.
[56]
Sh = 4.26 Re0.64 **
0.003 < Re < 0.19
1 or 3 mM K3Fe(CN)6 in
3 or 9 mM K4Fe(CN)6 +
0.5 M KOH
Carbon felt, GFD 5, SIGRI GmbH
Fiber diameter:
8 µm
1393–2264
You et al.
[57]
Sh = 1.68 Re0.9
0.08 < Re < 1.43
50 mM FeCl2 in
0.75 M FeCl3 + 2 M HCl
Carbon felt,
type n.a.
Fiber diameter:
10 µm
1522
Barton et al.
[58]
flow through (FT) and interdigitated (ID)
Sh = 0.004 Re0.75 Sc0.51
0.005 < Re < 0.4 (FT)

Sh = 0.018 Re0.68 Sc0.50
0.0006 < Re < 0.05 (ID)
0.5 M FeCl2 +
0.5 M FeCl3 in
2 M HCl
Carbon paper, Sigracet 29AA, SGL Carbon
Fiber diameter:
7 µm
3800–24,000
Kok et al.
[59]
Sh = 0.9 Re0.4 Sc0.4
(rounded)
10−6 < Re < 1
n.a.Carbon felt, GFD,
SGL Carbon
Fiber diameter:
8.2 µm
n.a.
Table 2. Mass transport correlations for carbon-based fibrous materials—hydraulic diameter applied as characteristic length. The subscript dh indicates the Sherwood and Reynolds numbers to be related to the hydraulic diameter.
ReferenceCorrelationElectrolyteElectrodeSchmidt Number
Carta et al.
[54]
Shdh = 3.19 Re 0.69
1 < Redh < 15
2 mM K3Fe(CN)6 in
100 mM K4Fe(CN)6 +
1 M KNO3
and
1 mM CuSO4 in
0.1 M H2SO4
Carbon felt, SIGRI GmbH
Fiber diameter: 11 µm
1203
and
1365
Xu et al.
[55]
Shdh =
2 + 1.534 Redh0.912
0.3 < Redh < 2.4
0.125 M to 1.0 M V
@90% SoC in
3M H2SO4
GFA, SGL Carbon GmbH
Fiber diameter: n.a.
n.a.
For a comprehensive comparison, all mass transport correlations are presented in Figure 2A. The correlations of Barton et al. and Kok et al. were calculated based on an exemplary Schmidt number of 5000. The correlations of Carta et al. and Xu et al. had to be adapted to fit into the same diagram because the characteristic lengths are different from the other correlations. Therefore, the ratio of the fiber diameter to the hydraulic diameter is used to adapt the equations, which itself is just a function of the porosity that was assumed to be 94%. The subscript dh denominates Sherwood and Reynolds numbers that are related to the hydraulic diameter of the felt. Reynolds and Sherwood numbers without subscripts represent those related to the fiber diameter unless otherwise noted.
R e dh , i = R e d h d f = R e ε 1 ε
S h = S h dh d f d h = S h dh 1 ε ε  
Figure 2 reveals that the range of Sherwood numbers can vary around three orders of magnitude, depending on the choice of mass transport correlations and the range of Reynolds numbers. To correct the effect of different electrolyte compositions and thus different Schmidt numbers within the listed publications, it is necessary to add a Schmidt number dependence to each correlation and subsequently compare it for a constant Schmidt number. Only two correlations comprise the parameter cSh (exponent of the Schmidt number), which varies between 0.4 and 0.5, thus we assumed a reasonable mean value of 0.45 for cSh. Consequently, the parameter aSh needs to be corrected as well, to fit a Schmidt number-dependent mass transport correlation according to the following equation:
a Sh = a Sh S c 0.45
The values aSh′ and Sc′ indicate the parameters reported in the publication, whereas aSh represents the corrected mass transport correlation parameter. The resulting correlations are compared in Figure 2B for an exemplary Schmidt number of 20,972, which corresponds to a completely discharged positive electrolyte containing only VO2+ species. The figure still indicates a broad spread of Sherwood numbers with a very slight concentration of correlations in the range of Barton et al. (interdigitated ID), Kinoshita et al. and You et al. [29,57,58]. Some of the presented correlations might be less reliable due to a variety of reasons. Kok et al. [59] based the correlations on a Lattice Boltzmann method for the computation of fluid-flow within the 3D structure of carbon felt derived by tomographic methods. The approach is very reasonable, but the reliability is currently questionable since the evaluation is purely based on a numerical approach and comprises a high deviation from other experimental correlations. The correlation Barton et al. presented for flow-through cells (FT) yields quite low Sherwood numbers [58]. Their cell setup consisted of two small (14 × 16 mm2) layers of SGL Sigracet® GDL29AA carbon paper material with a compressed thickness of approximately 0.3 mm. The active cell area defined by the gasket had dimensions of 15 × 17 mm2, so a 1 mm bypass channel was likely to exist along the edge of the carbon paper. Since the pressure drop across a pure FT cell setup is larger than the pressure drop across an ID design, the bypassing effect is presumably significantly larger for the FT than for the ID design. This can explain the difference between both mass transport correlations quite well and shows that the FT correlation is not that reliable. The ID correlation is presumably more reliable; however, the bypassing may have affected these experiments as well. Thus, a true Sherwood number higher than predicted by the correlation of Barton et al. is likely. Nevertheless, the evaluation of viscosity changes and its effect on Schmidt number dependence is unlikely to be influenced by the bypassing since the laminar flow regime within the cell maintained a constant ration of flow through the electrode and the bypassing channel. The correlation of Xu et al. [55] starts with the physically correct assumption that the minimum Sherwood number is limited to two. Thus, the maximum diffusion boundary layer is limited to half of the average distance between two carbon fibers. Unfortunately, the experiments of Xu et al. were carried out in a cell setup with parallel flow fields. This setup leads to low flow velocity through the electrode since the permeability of the carbon paper is usually much lower than the permeability of a flow channel, thus underestimating the true mass transport in the carbon felt. Although very often applied in mathematical models describing redox-flow batteries, the correlation of Schmal et al. [30] is based on measurements using single fiber electrodes. The extrapolation of their mass transport correlation to carbon felt electrodes with their inhomogeneous structure is at the least questionable. The fibers in carbon felt electrodes might block surface areas of adjacent fibers, so a lower Sherwood number than predicted by Schmal et al. is probable. The correlations of Kinoshita et al., Vatistas et al., and You et al. [29,56,57] measured in FT cell setups remain for the range of most probable mass transfer correlations in carbon felt electrodes (marked as the grey box in Figure 2B)). When considering the Reynolds numbers that are experimentally accessible in this work, the correlation of You et al. must be neglected as well. The exponents bSh for the Reynolds number of the remaining correlations vary between 0.61 and 0.72 and build an average value of 0.66 that is used for further evaluation.

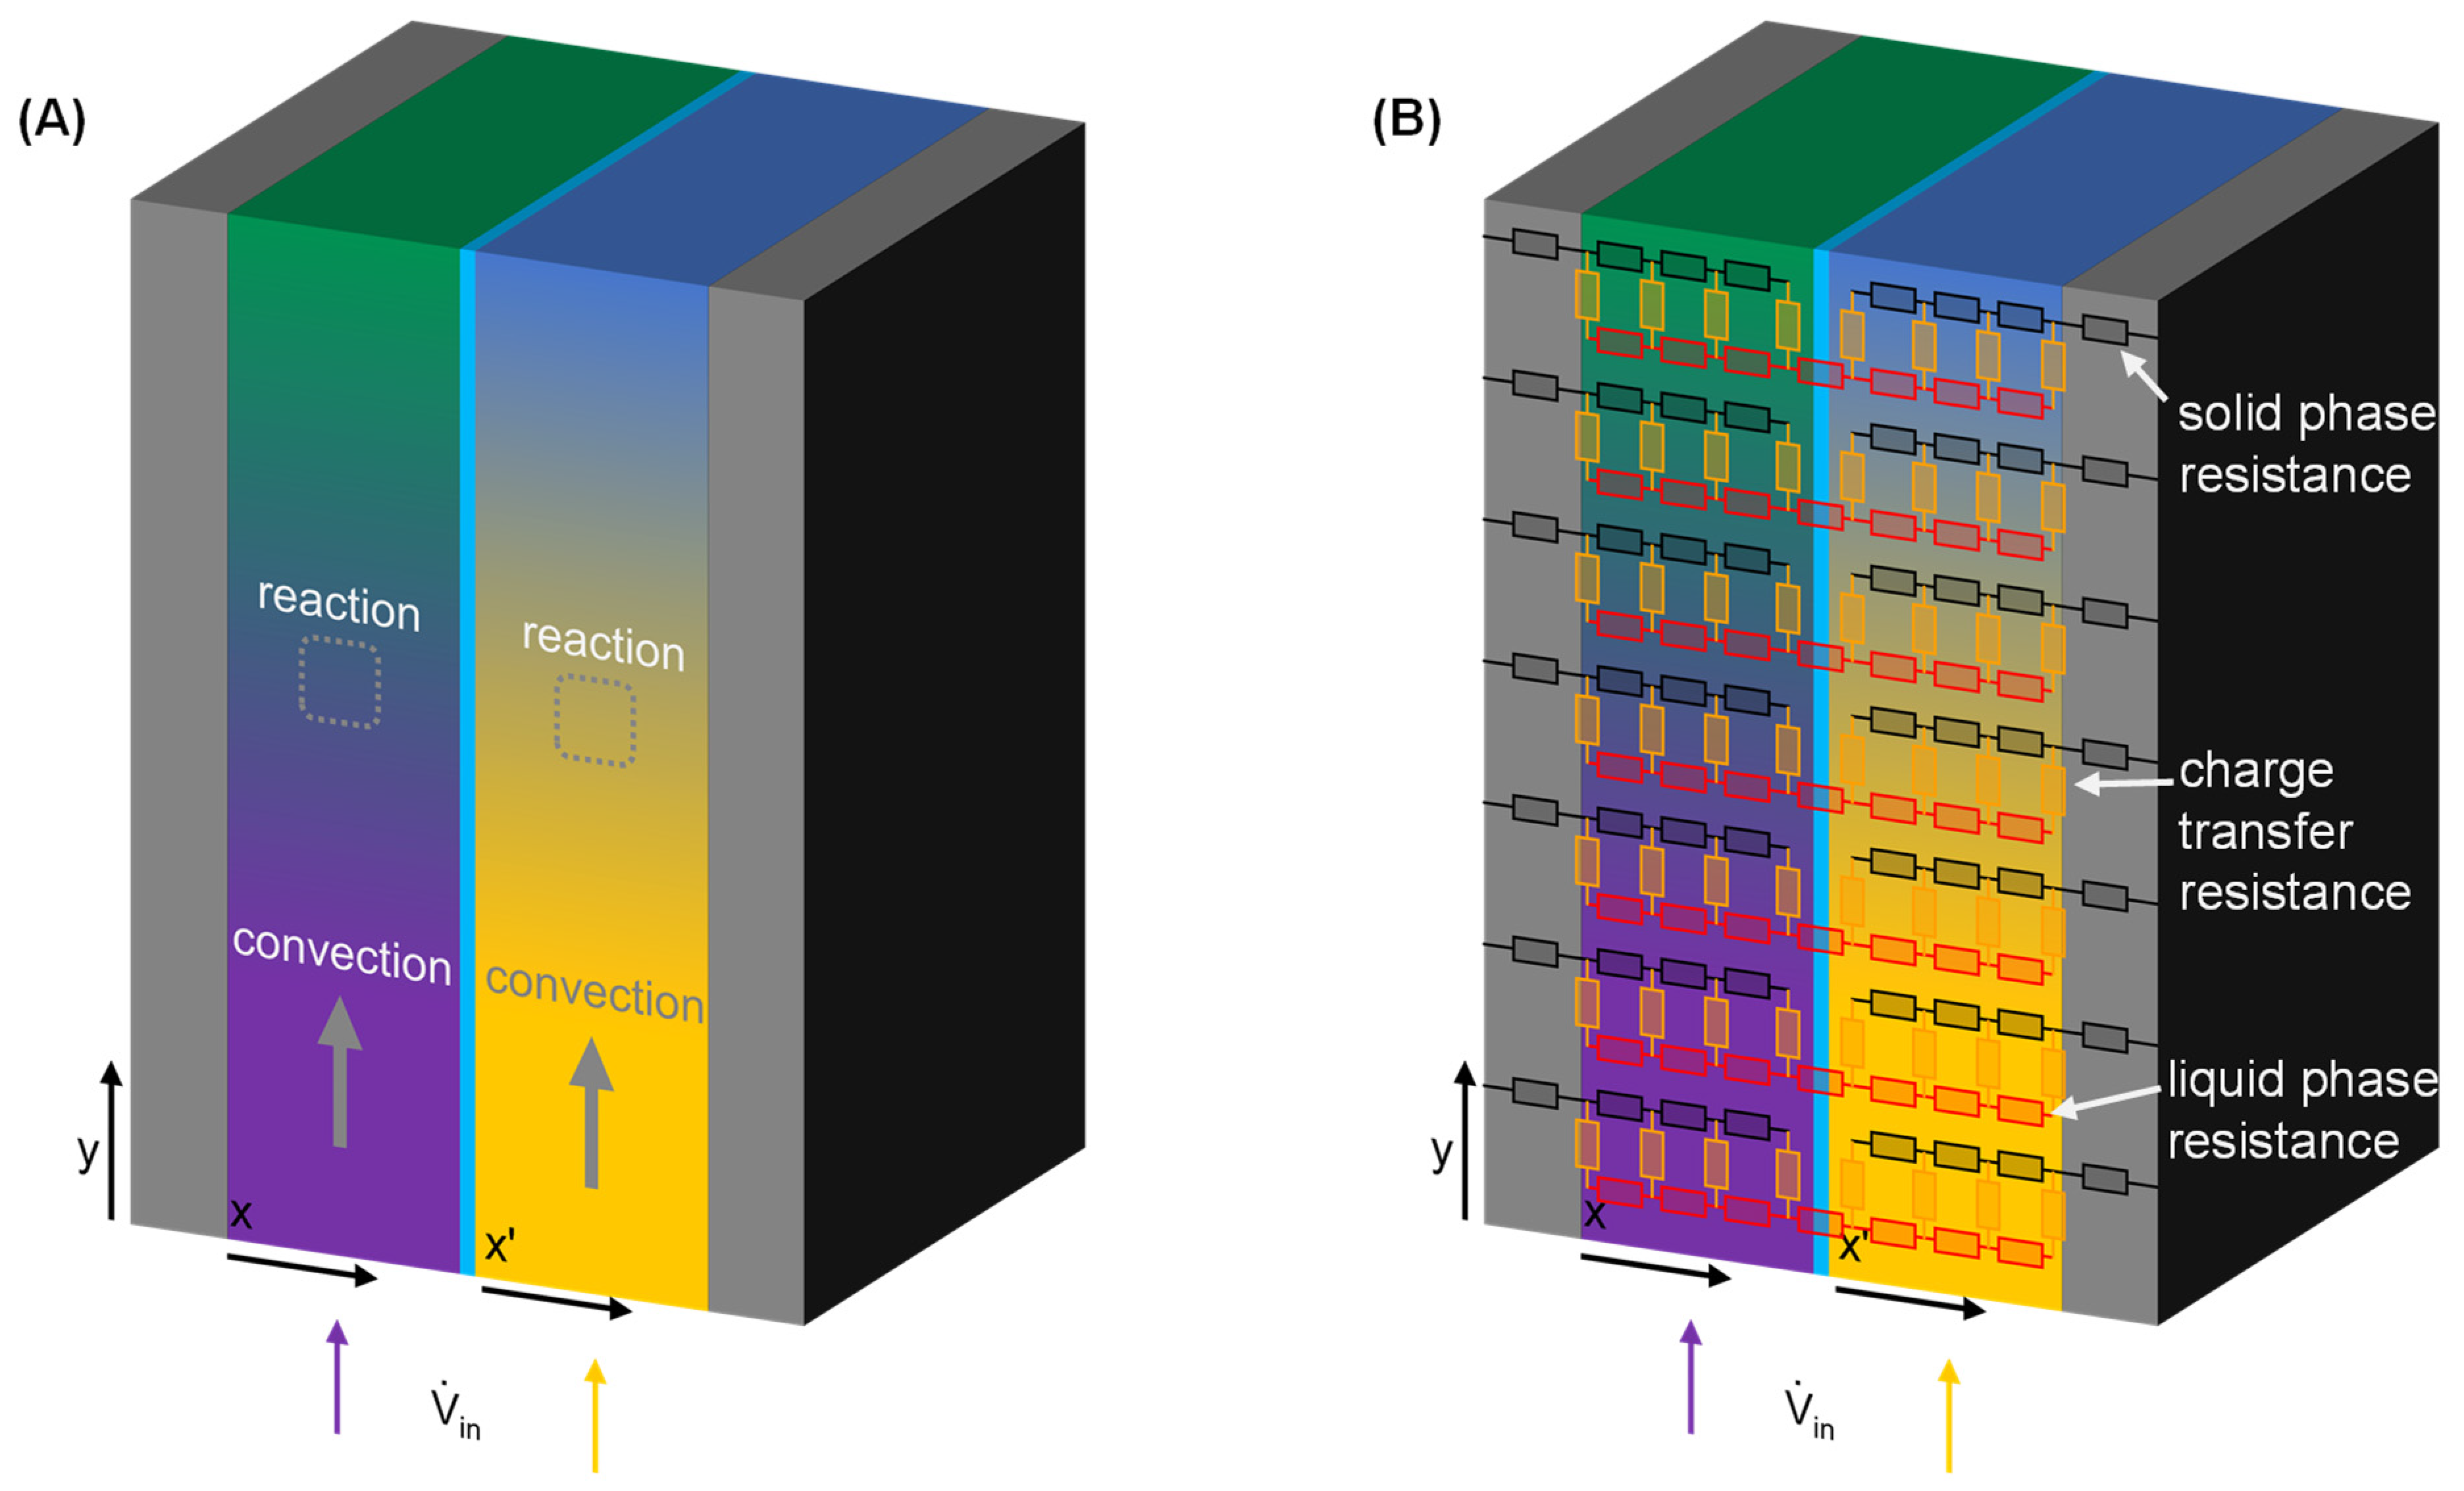
3. Setup of the Mathematical Model

The model is based on the models of Shah et al. published in 2008 [60] and Ma et al. from 2011 [32], with some adaptions and some simplifications where appropriate. The model itself is designed as a two-dimensional model describing the cell processes of a single cell of a redox-flow battery. The model dimensions are placed in the cross-section of a flow-through cell design as presented in Figure 3, since this allows the description of the potential and concentration distribution in the through-plane (x) and the direction of electrolyte flow (y). The third dimension is neglected because a sufficiently good design of the electrolyte manifolds guarantees a homogeneous flow distribution and therefore the behavior in each layer of the third dimension is identical. The model focuses on the processes within the electrodes and neglects the effects of membrane crossover, therefore describing the membrane solely as an ohmic resistance without considering migration, diffusion or convection of vanadium species across the membrane. The electrodes are described in terms of mass transport by convection, diffusion, and reaction and in terms of potential and current density distribution by modelling the solid and liquid phase resistances connected by nonlinear resistances that depend on concentration and overpotential. Mass transport effects due to the migration of vanadium are neglected since the mobility of protons in the electrolyte is significantly faster compared to the vanadium species. The negative electrolyte (NE) electrode is denominated by the through-plane dimension x, whereas the positive electrolyte (PE) electrode is denominated by the through-plane dimension x’.
The different equations required for the model can be separated into several groups. For the sake of readability, the equations are presented in tables, one for each group, and only the key variables are mentioned in the text. Parameters and variables not mentioned in the text are listed in Table A1 and Table A2 of the Appendix A. The basic reactions in the model are the redox reaction between V2+ and V3+ in the NE and the redox reaction between VO2+ and VO2+ in the PE. Any effects of water or protons are neglected and so the reaction is simplified as shown in Equations (11) and (12), whereas the vanadium species in the PE are denominated in the simpler version of V4+ and V5+. The oxidation reaction is defined to result in a positive current. The indices, stoichiometric coefficients ν, and reaction orders (νan, νcat) used in the equations are listed in Table 3.
NE :   V 2 +     V 3 + + e E ref , NE = 0.255   V   vs .   SHE
PE :   V 4 +     V 5 + + e E ref , PE = 1.004   V   vs .   SHE
The potential gradient in x-dimension within the solid phase and the liquid phase of the electrode is depending on its specific electrical resistance and the local current density in the corresponding phase. The specific electrical resistance of the liquid phase is determined by the Bruggeman equation based on the conductivity of the electrolyte as seen in Table 4.
The calculation of current densities is summarized in Table 5. The gradient of the current densities in both phases is depending on the specific surface area and on the transfer current density, which is the current density that is achieved on the surface of a carbon fiber in a differential volume element. It can be calculated by the Butler–Volmer equation. The required charge transfer coefficients are derived from our previous work [25,61,62] and applied to the Butler–Volmer equation. The overpotential is derived by the difference between the solid phase and liquid phase potential minus the equilibrium potential, calculated with the surface concentration of the contributing VS. Required exchange current densities are calculated based on the surface concentrations (or Equation (26)). Mass transport processes are summarized in Table 6. The change in concentration is calculated by the sum of a convective flux in the y-direction and a source term due to the transfer current density. Diffusion in the x- or y-direction is assumed to be negligible due to quite high flow velocities and low diffusion coefficients of the VS. The mass transport from the bulk of the electrolyte to the carbon fiber surface is described by the Sherwood correlation.
Some auxiliary equations to describe the parameters of the carbon felt and the electrolyte are summarized in Table 7. The specific surface area of the electrolyte is derived from the carbon fiber diameter and the porosity [54], whereas the porosity can be calculated by the areal weight and the bulk fiber density of the electrode. The compression ratio is defined as the change from the initial electrode thickness to the thickness under compression. The state of charge (SoC) is the ratio of charged species’ concentration to the total vanadium concentration. Viscosity and conductivity of the electrolyte are assumed to be linear functions of SoC (c.f. [63]) and to depend solely on the inlet concentration of the cell, neglecting changes of SoC within the cell. This assumption is not entirely correct, but the typical cell operation leads only to minor changes in SoC across the cell and the effect of SoC changes on conductivity and viscosity is mitigated by a certain offset value for both properties independent of SoC, hence this assumption causes only a small error.
Boundary conditions that are required to solve the set of equations are listed in Table 8 and Table 9, for NE and PE, respectively. The effective current density can be achieved by the integral of the solid phase current density at the boundary between the bipolar plate and carbon felt electrode for the NE side over height. Liquid phase current density at the interface between the electrode and bipolar plate must be zero, whereas the solid phase current density must be zero at the electrode membrane interface. Additionally, no mass transport can occur through the membrane or the bipolar plate.

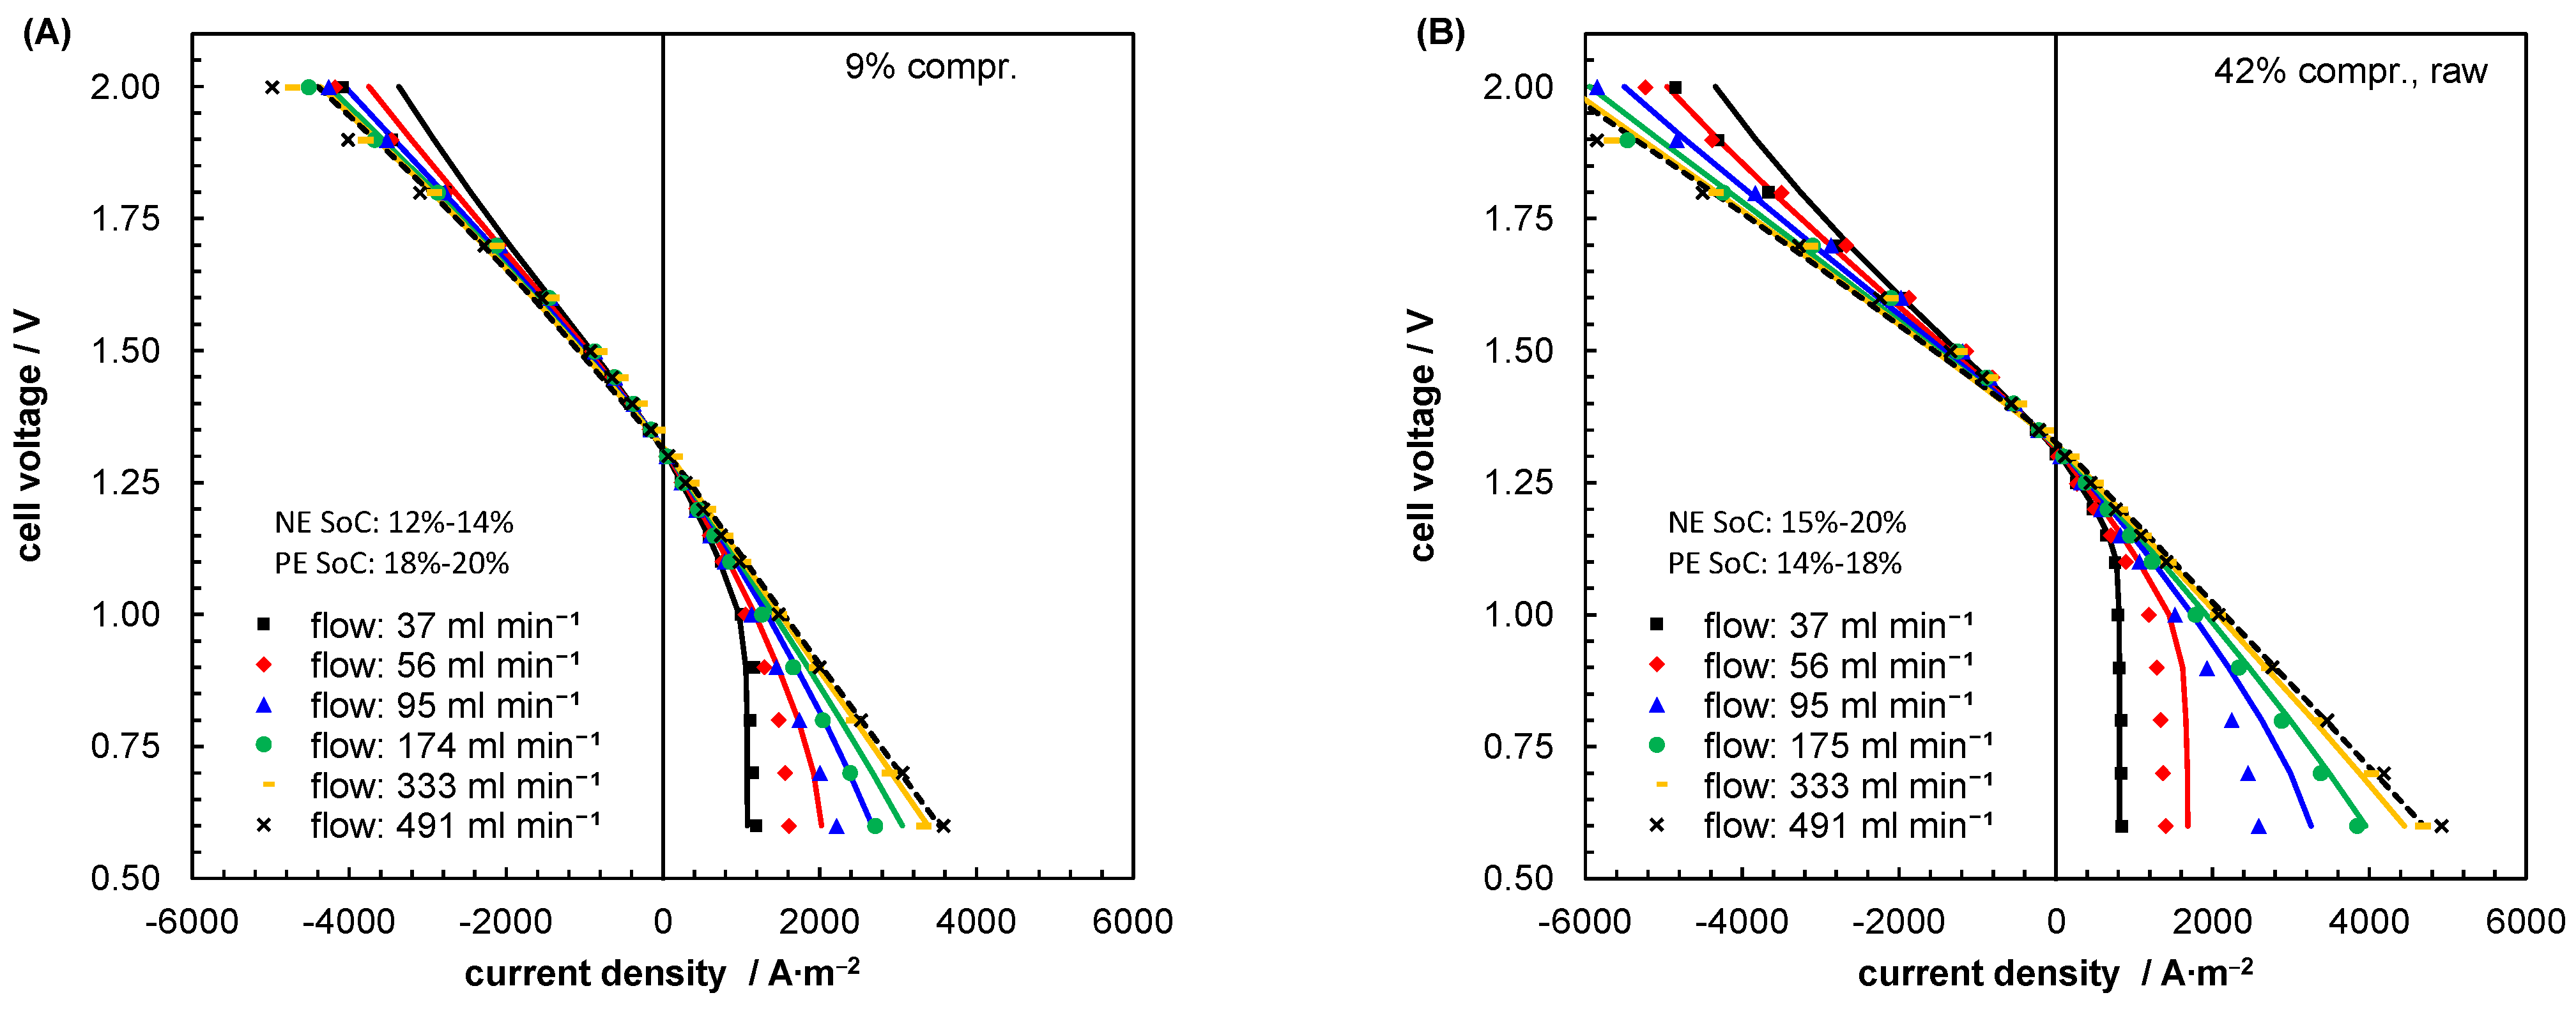
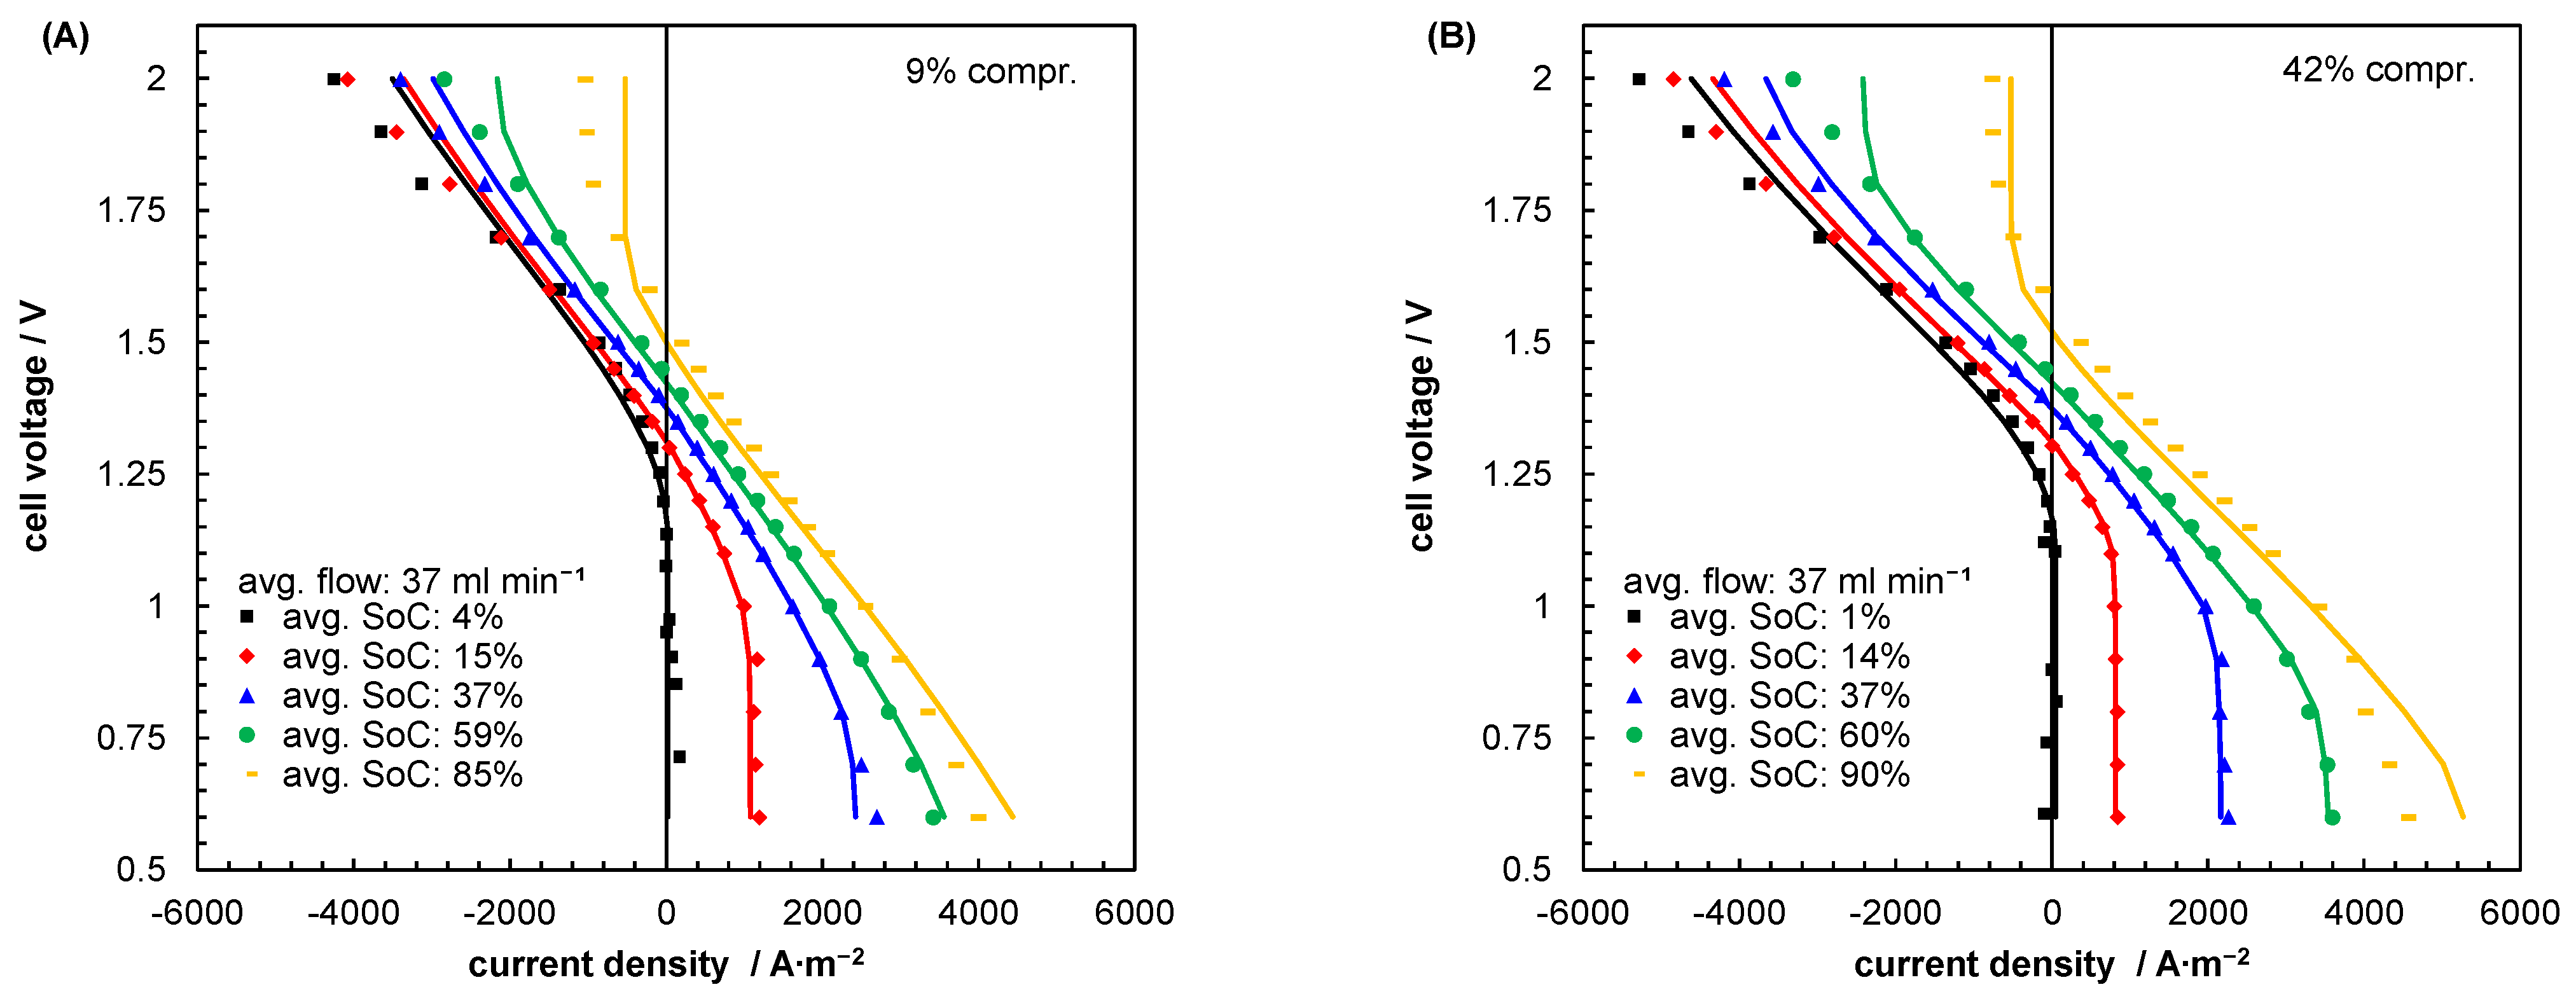
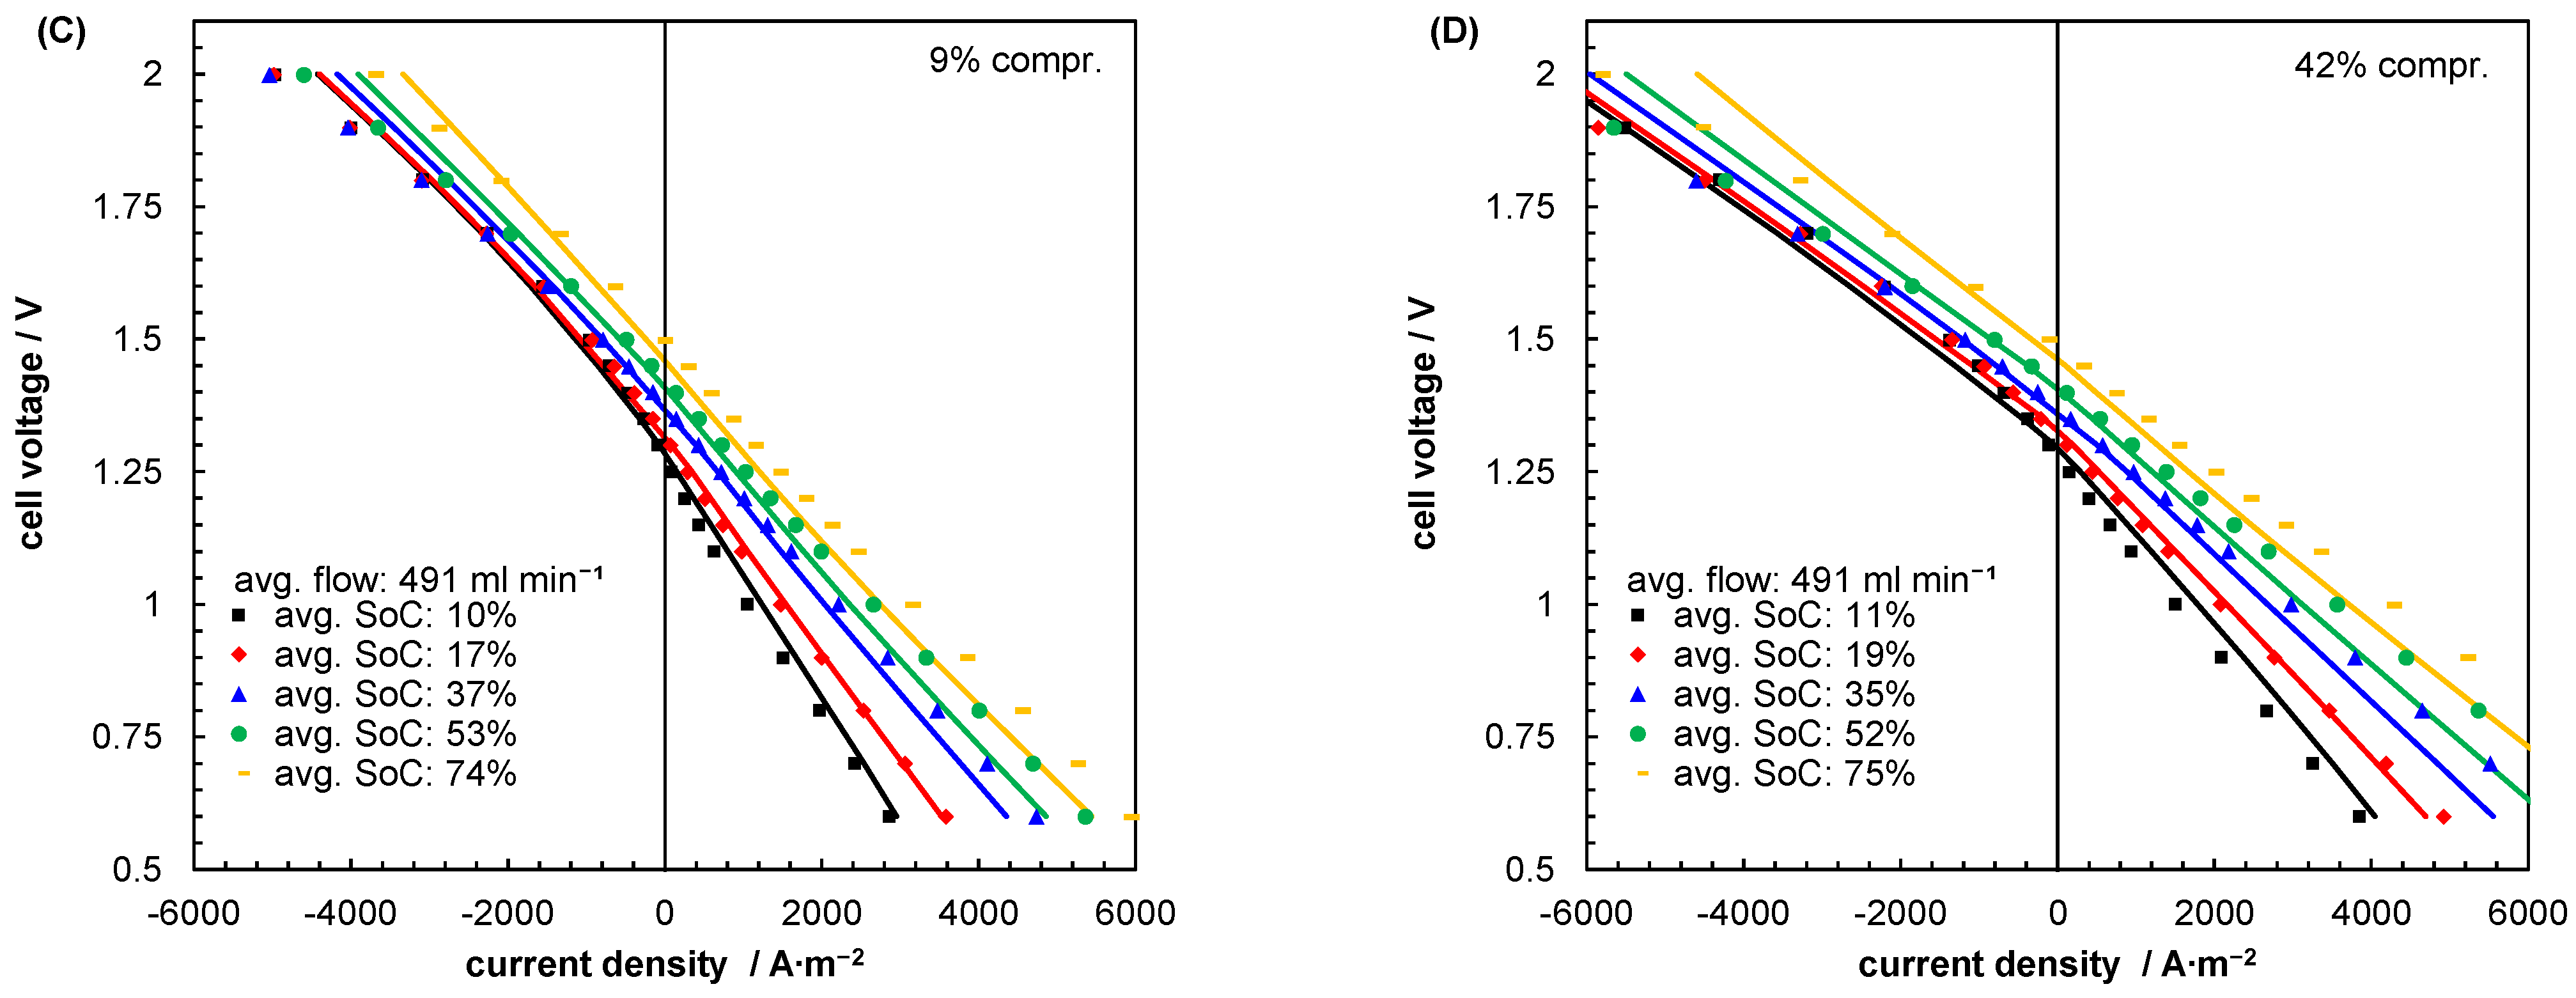
4. Experimental Setup

An automated redox-flow battery test stand (FuelCon AG, Germany) [64] was used for this investigation. Briefly, the test stand comprises two temperature-controlled electrolyte vessels, that are purged with pure nitrogen to prevent side reactions. Gear pumps and flow meters allow a controlled flow rate to be pumped through the cell, which is connected to an electrical load and voltage supply, with the possibility to run the cell in galvanostatic or potentiostatic mode and with the ability to acquire full cell impedance spectra. Online conductivity measurements combined with electrolyte sampling and SoC determination by titration with potassium permanganate give precise information on the SoC of both electrolytes during the measurement. A single 10 × 10 cm2 FT cell is connected to the test stand. The cell is equipped with four self-made liquid and four self-made solid phase potential-probes [25] placed at the electrode-membrane and electrode-bipolar plate interface for each half-cell. The cell comprises untreated GFD4.6EA carbon felt (SGL Carbon, Germany) in both half-cells and a Nafion® 117 membrane (Chemours, USA) separating both electrodes, soaked for at least 24 h in 1% H2SO4. The carbon felt was compressed to 2.67 mm, which corresponds to a compression ratio of 42%. A flat PPG86 bipolar plate (Eisenhuth GmbH & Co. KG, Germany) with a thickness of 6.5 mm is contacted to a gold-coated nickel mesh and a brass current collector, for NE and PE half-cell, respectively. Thirty polarization curves are recorded with alternating voltage steps between 0.6 and 2.0 V, for six different flow rates and five different SoCs. Impedance spectra for similar conditions are recorded before the acquisition of the polarization curves. The results for a GFD4.6EA felt with a compression rate of 9% were obtained in our previous work [25] and additional results of a cell equipped with a similar electrode, but with a compression ratio of 42% are presented as well.
The electrolyte was purchased from GfE (Gesellschaft für Elektrometallurgie, Germany, 3.9 M sulfate, 1.6 M vanadium, 0.06 M phosphate, <10 mM iron, 6 L on each side). Electrolyte characterization was carried out by discharging stepwise a fully charged vanadium electrolyte and sampling sufficient amounts of NE and PE to determine SoC, density, and kinematic viscosity. The SoC was analyzed by titration with potassium permanganate. The density was determined by weighing 1 mL electrolyte, accurately sampled with an Eppendorf pipette, for NE and PE, respectively. Kinematic viscosity was obtained by using an Ubbelohde viscometer, carefully temperature controlled to 25 °C in a water bath. A few samples were analyzed for each SoC, thus allowing the determination of average values and standard deviations.

5. Results and Discussion

Evaluation of electrolyte properties, open circuit cell voltage, kinetic data, membrane, and bipolar plate resistance
Prior to the model validation and parameter estimation of mass transport parameters, it is necessary to evaluate all the data that is accessible without the need for a complex mathematical model. These are the viscosity, density, and conductivity of the electrolyte, open circuit voltages and resulting reference potentials, membrane resistances for charging and discharging, and reaction rate constants.
The electrolyte viscosity and density are given in Figure 4A. In general, the density of the NE is larger compared to the PE and increases with decreasing SoC, whereas the density of the PE decreases at the same time. For high SoC, the density is quite similar for NE and PE with an average value of approximately 1350 kg·m−3. The relative change for low SoC is less than 2% and the average between NE and PE remains quite constant at 1350 kg·m−3. Therefore, the density of the electrolyte is estimated to stay constant at this value independent of SoC or half-cell. The viscosity instead shows a more distinct dependence on SoC, with NE and PE showing both a minimum at high SoC and a quite linear increase for lower SoC. Linear approximations for both viscosities are given in Figure 4A. The conductivity data obtained from the online SoC measurement is shown in Figure 4B, with linear correlations given as well. The NE conductivity is around 8 S·m−1 lower than the PE conductivity and both increase with increasing SoC. This agrees well with the data of Corcuera et al. [63].
During the recording of polarization curves, a couple of data points were acquired under open circuit conditions and for different SoC (Figure 4C). Since the SoC of NE and PE were not necessarily identical, the average SoC is used to present the data, however for calculation of the open circuit voltage both precisely measured SoCs are available. In general, the Nernst equation is a valid tool to calculate open circuit cell voltage (OCV) based on thermodynamic considerations. When applying the standard electrode potentials as given in Equations (11) and (12) (c.f. [60]) and calculating the cell open circuit potential, EOCV potential based on a simplified Nernst equation (c.f. Equations (25) and (57)) considering only VS, a quite strong deviation to the measurements of approximately 200 mV can be found, although the curvature of it is similar to the measurements. Some improvements can be made when the proton concentration in both electrolytes is taken into account. Therefore, the following two equations of charge balance and dissociation equilibrium must be fulfilled for both electrolytes:
0 = k c k z k
K a = c H + · c SO 4 2 c ref · c HSO 4 = 10 1.92
Here, k is an index for all charged species including four VS, H+, HSO4-, and SO42−. ck represents the concentration of each species k and zk is the elementary charge of each species k (i.e., zH+ = 1, zHSO4- = −1). Ka is defined as the acid dissociation constant of the first dissociation of sulfuric acid [65]. The Nernst equation extended by the proton concentration as they take part in the PE reaction (c.f. Equations (1), (2) and (58)) yields a slightly better curve for SoC higher than 40%, however, there is still a remaining deviation of approximately 150 mV. Since not only the redox processes at both electrodes are involved in the entire cell potential, but also Donnan potentials over a cation exchange membrane can arise due to the pH gradient between NE and PE, they can likely influence the entire cell voltage. Knehr et al. implemented this contribution into the Nernst equation (c.f. Equation (59), [66]), resulting in an even better estimation, but still missing the experimental data by around 60 mV.
E OCV = E ref , PE E ref , NE + R T F ln c V 2 + c V 5 + c V 3 + c V 4 +
E OCV = E ref , PE E ref , NE + R T F ln c V 2 + c V 5 + c V 3 + c V 4 + c H + , PE 2
E OCV = E ref , PE E ref , NE + RT F ln c V 2 + c V 5 + c V 3 + c V 4 + c H + , PE 2 c H + , PE c H + , NE
E OCV = E ref , PE E ref , NE + RT F ln c V 2 + c V 5 + c V 3 + c V 4 + c H + , PE c H + , NE  
Since all the previous estimations deviate from the experimental data quite significantly, another estimation approach was applied. The simple variant of the Nernst equation is combined with a constant offset to the reference potential building Eref,PE to allow the best representation of experimental data (by least squares method, c.f. Equation (61)). A resulting potential of 1.151 V is achieved for Eref,PE, corresponding to a potential offset of 147 mV. For the redox-flow battery model, Equation (61) with this optimized reference potential is used.
E OCV = E ref , PE E ref , NE + RT F ln c V 2 + c V 5 + c V 3 + c V 4 +
The data sets from the polarization curve and impedance spectroscopy measurements of the cell with a higher compression rate of 42% can be evaluated according to the procedure described in [25]. This evaluation includes the determination of the bipolar plate resistance by the solid phase potential-probes in contact with the bipolar plate, the determination of the membrane resistance during charge and discharge for several SoC, and the identification of the exchange current densities based on an impedance model of Paasch et al. [67]. The evaluated membrane resistances are presented in Figure 5A,B), whereas the open circuit resistances show a good agreement between the cells with high and low compression rates. The membrane resistances during charge and discharge deviate more distinctly from each other and the membrane resistance for the more intensely compressed electrode shows lower values. However, they agree on their general dependence on SoC. The charge resistance increases with increasing SoC, but the discharge membrane resistance decreases with increasing SoC and remains at a higher level. This behavior fits well with the work of Schafner et al. [68] for the charge resistance and the high SoC region during discharge but is not in agreement with low SoC and discharging currents. Nonetheless, a description of the membrane resistances is necessary for implementation in the redox-flow battery model. Therefore, both membrane resistances are described by a linear function depending on SoC as indicated in Figure 5B).
Figure 4. (A) Measured densities and viscosities for negative and positive electrolytes at different SoC. (B) Calculated conductivity depending on SoC based on the initial and post-run measurements of conductivity and SoC. (C) Comparison of experimental and calculated OCV voltages by using different assumptions [66,69].
Batteries 09 00253 g004
The evaluation of impedance spectroscopic data by application of the model of Paasch et al. requires an appropriate felt resistance, that can be yielded from [25] and which is summarized for the required compression rates in Table 10. Accordingly, the carbon fiber diameter is assumed to be 10 µm as well. The evaluation delivers exchange current densities depending on SoC for two compression rates and NE an PE, respectively (c.f. Figure 6). In general, the reaction rate of the 42% compression rate cell is three or four times higher than for the lower compressed cell, which might be caused by normal variations of the material or due to mechanical stress of the more intensively stressed carbon fibers increasing defect sites and improving kinetics. As expected, the exchange current density for the PE half-cell is considerably larger than for the NE half-cell for both cell setups. The resulting reaction rate constants, felt resistances, and bipolar plate resistances are given in Table 10.

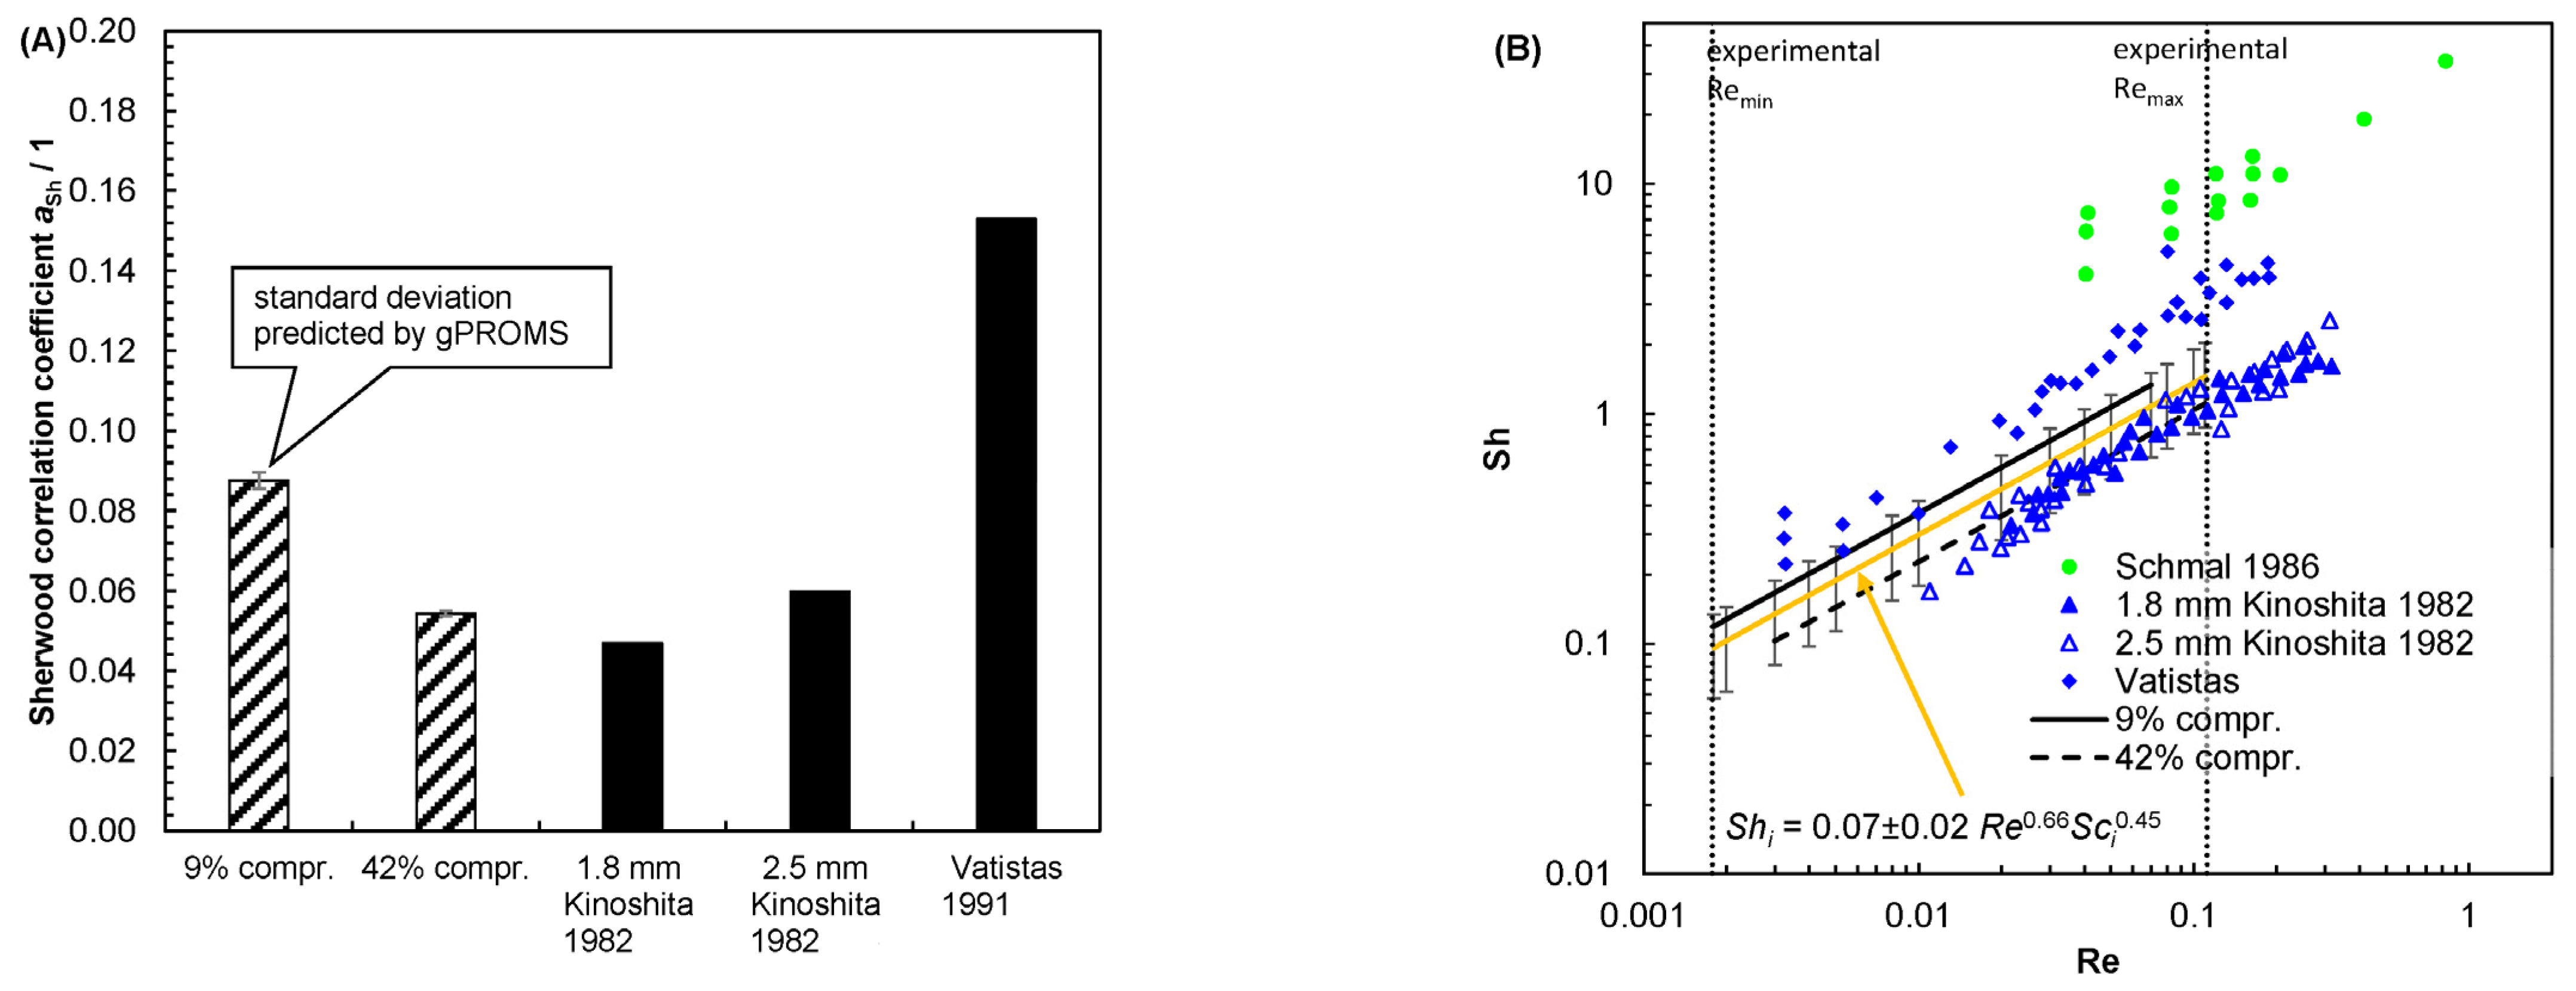
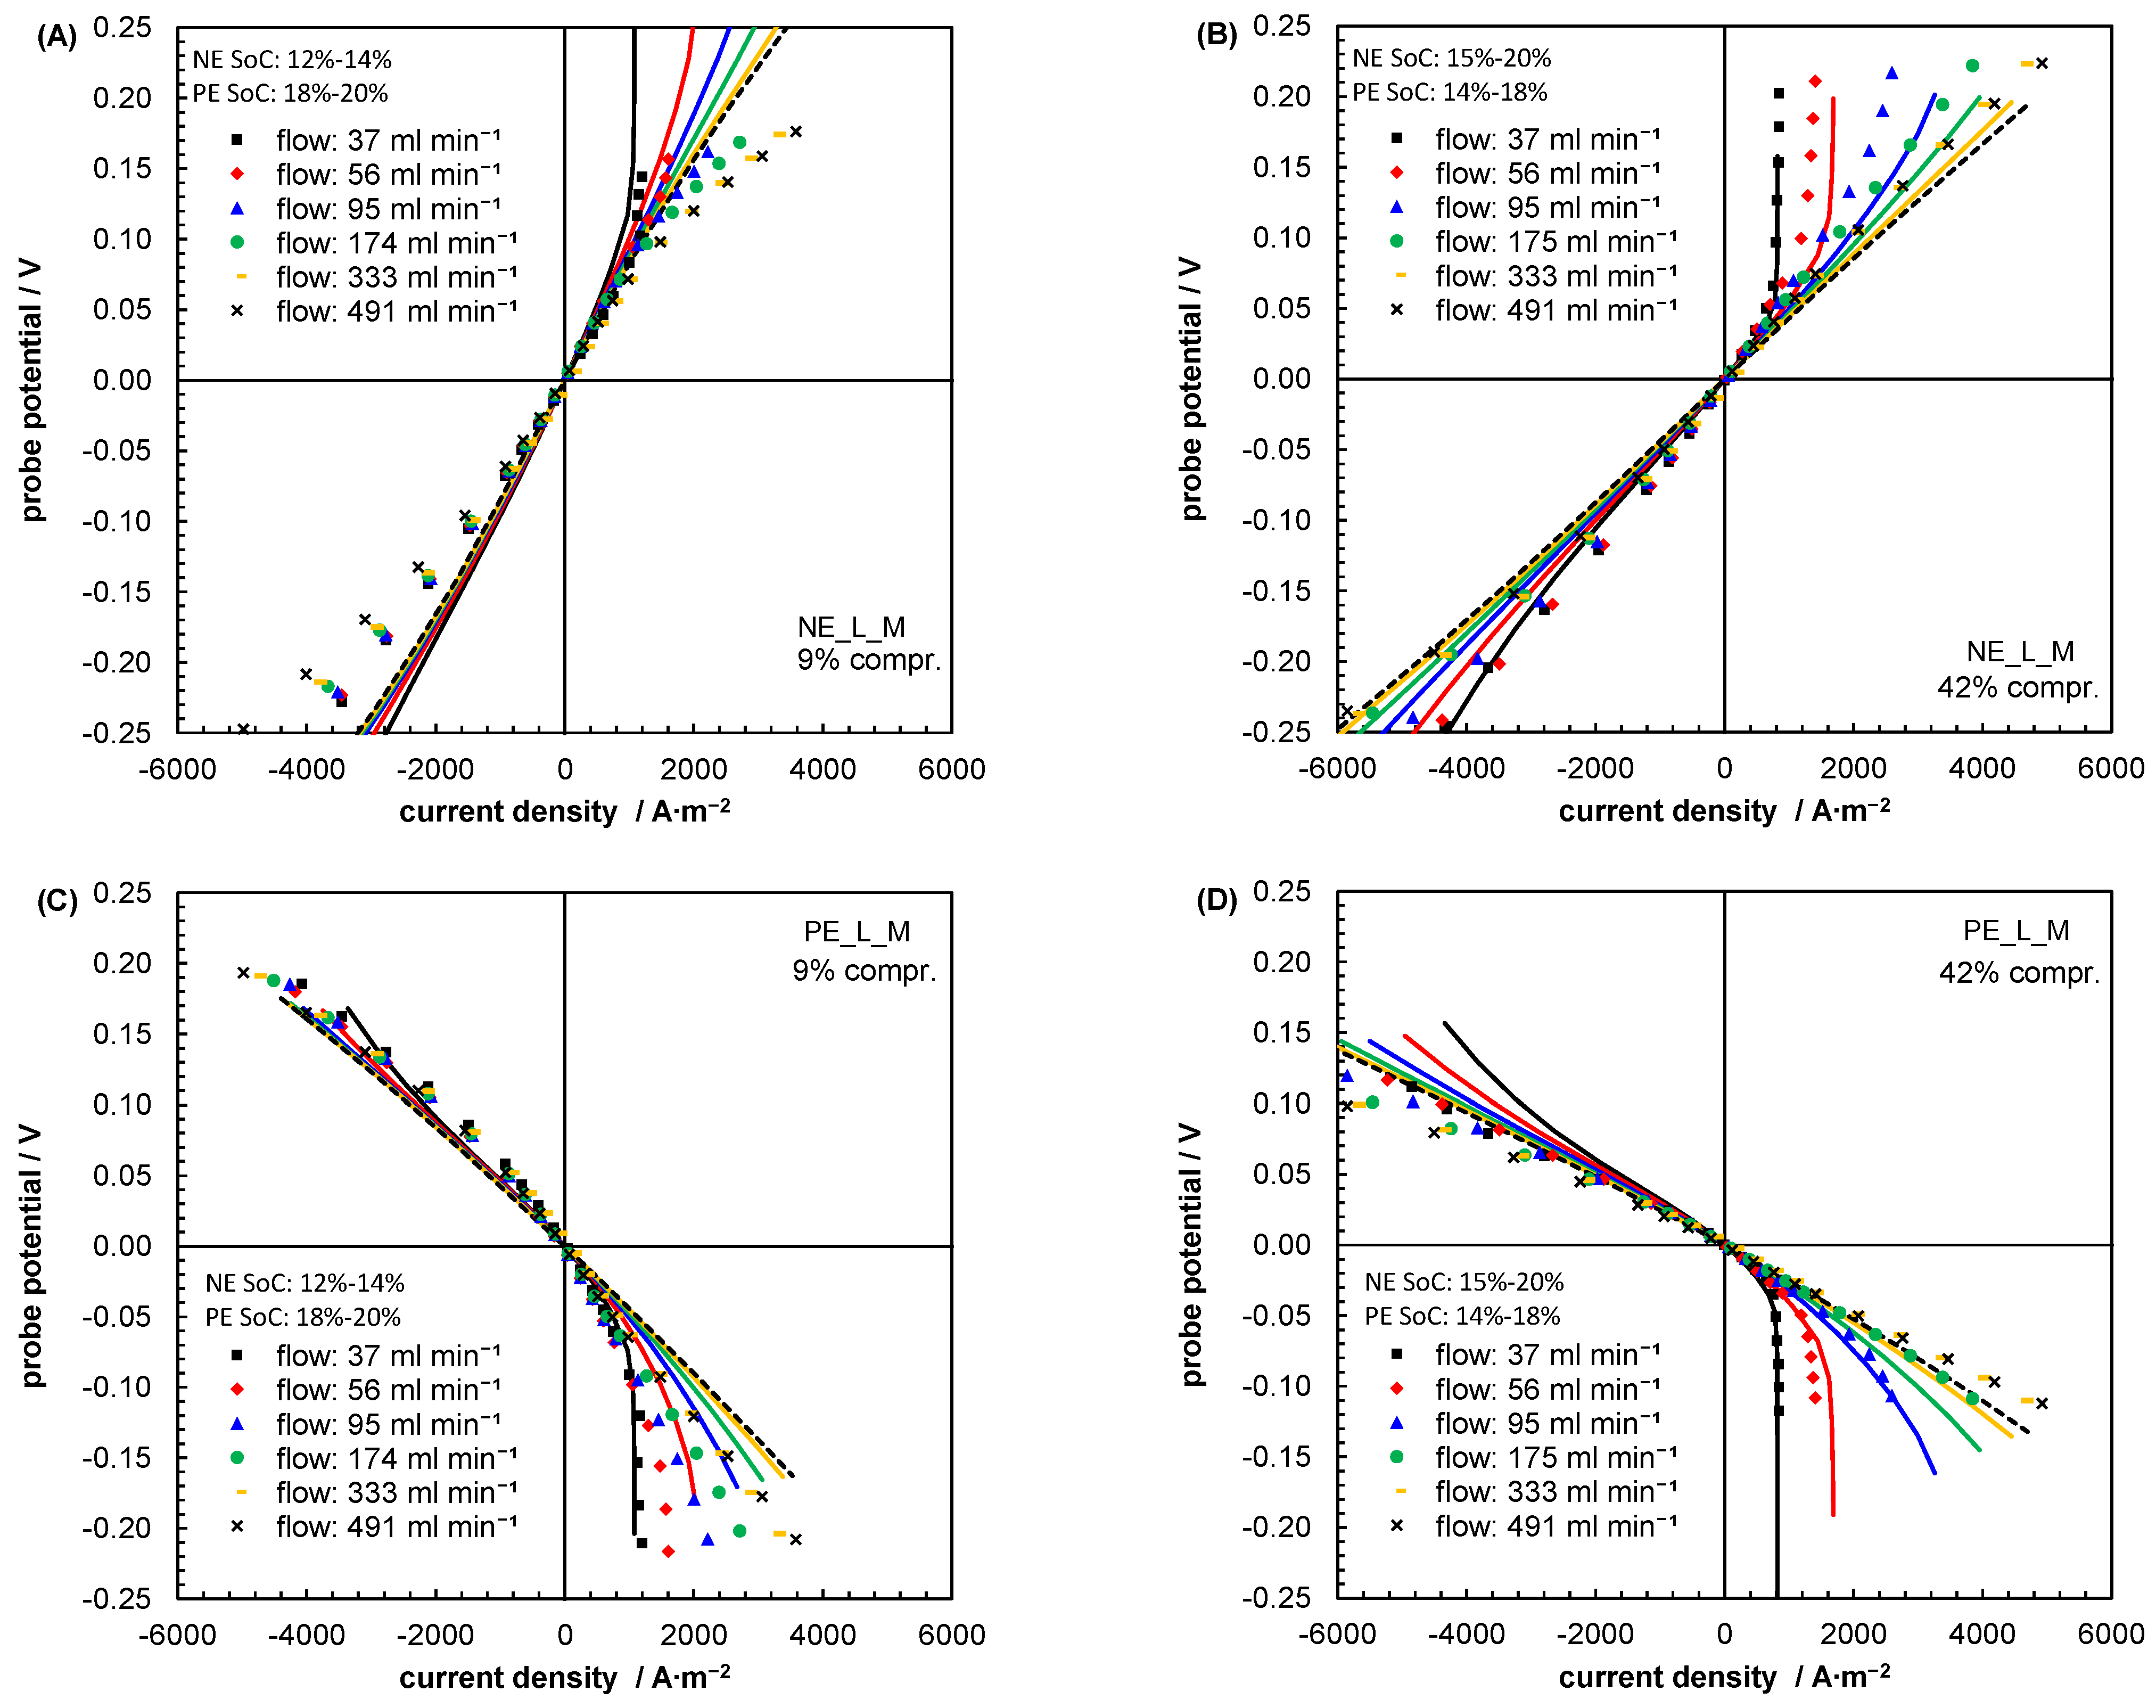
5.1. Evaluating Reasonable Diffusion Coefficients from Literature Data

The parameters derived so far (reaction rate constant, carbon felt resistance, bipolar plate resistance, membrane resistance, electrolyte conductivity, electrolyte viscosity, OCV), combined with the charge transfer coefficients of our previous work [61], form a very good starting point for the mathematical model describing the entire redox-flow cell. The model itself can be applied to determine the mass transport correlation parameter aSh based on the experimental data of the polarization curves for the two cells equipped with potential probes. However, quite precise diffusion coefficients are crucial to determine the mass transport parameter accurately. For application in mathematical models for vanadium redox-flow batteries, the diffusion coefficients of Yamamura et al. [70] are used quite often (such as but not limited to [14,41,49,53,60,66]). Yamamura et al. determined the diffusion coefficients of all four vs. by simulating cyclic voltammograms and estimation of kinetic and mass transport parameters to fit the simulations to the experiments. Additionally, they were assumed to have equal diffusion coefficients for the vanadium pairs in the positive and negative electrolytes (DV4+ = DV5+ and DV2+ = DV3+). The diffusion coefficients they estimated varied between 2.4 and 4.0 × 10⁻¹⁰ m2 s−1, depending mostly on the type of electrode. As the concentration of vanadium was only 50 mM in a 1 M sulfuric acid solution, it is likely to expect different diffusion coefficients for the typical vanadium electrolyte with its higher total sulfate concentration (3.9 M) and its higher vanadium concentration (1.6 M) which might affect the diffusion coefficients. Lawton et al. investigated the effect of varying sulfuric acid concentrations on the diffusion coefficient of VO2+ by electron paramagnetic resonance and linear sweep voltammetry [71]. They could show a clear decrease in the diffusivity of VO2+, effected by the increase in the sulfuric acid’s viscosity and changes in the Stokes radius. The results of Lawton et al., Yamamura et al., and some more publications are shown in Figure 7. Only two of these publications give specific values for the diffusion coefficient of each VS. These are Jiang et al. [72], who calculated the diffusion coefficients by a Car–Parinello molecular dynamics method for an environment in a pure aqueous system, and Oriji et al. who employed galvanostatic oxidation or reduction in an electrolyte comprising 5 M sulfuric acid and evaluation by the dependence on transition time and applied current density using Sand’s equation [72,73]. The results of both studies show the highest value for the diffusion coefficient of V2+ and the lowest value for V3+, while VO2+ and VO2+ are in between and have approximately the same value. The values of Oriji et al. are clearly below those of Jiang et al., most likely due to the higher sulfuric acid concentration, as already emerged from the work of Lawton et al. If the values between these two studies are interpolated linearly, the resulting line for VO2+ runs through the range of the dataset of Yamamura et al. and also corresponds to some extent with the value of Gattrell et al. [74]. The interpolated values for a sulfuric acid concentration of 4 M are indicated as well, and vary between 0.6 × 10⁻¹⁰ m2 s−1 for V3+ and 2.3 × 10⁻¹⁰ m2 s−1 for V2+. Any additional effect due to higher vanadium concentrations is neglected. The resulting Schmidt numbers are presented in Table 11 indicating quite high values for the vanadium electrolyte when compared to the typical Schmidt numbers given for example in Table 1 and Table 2. In particular, the Schmidt number for V3+ species is extremely high and underlines the need to integrate Schmidt number dependence into mass transport correlations for vanadium redox-flow batteries.

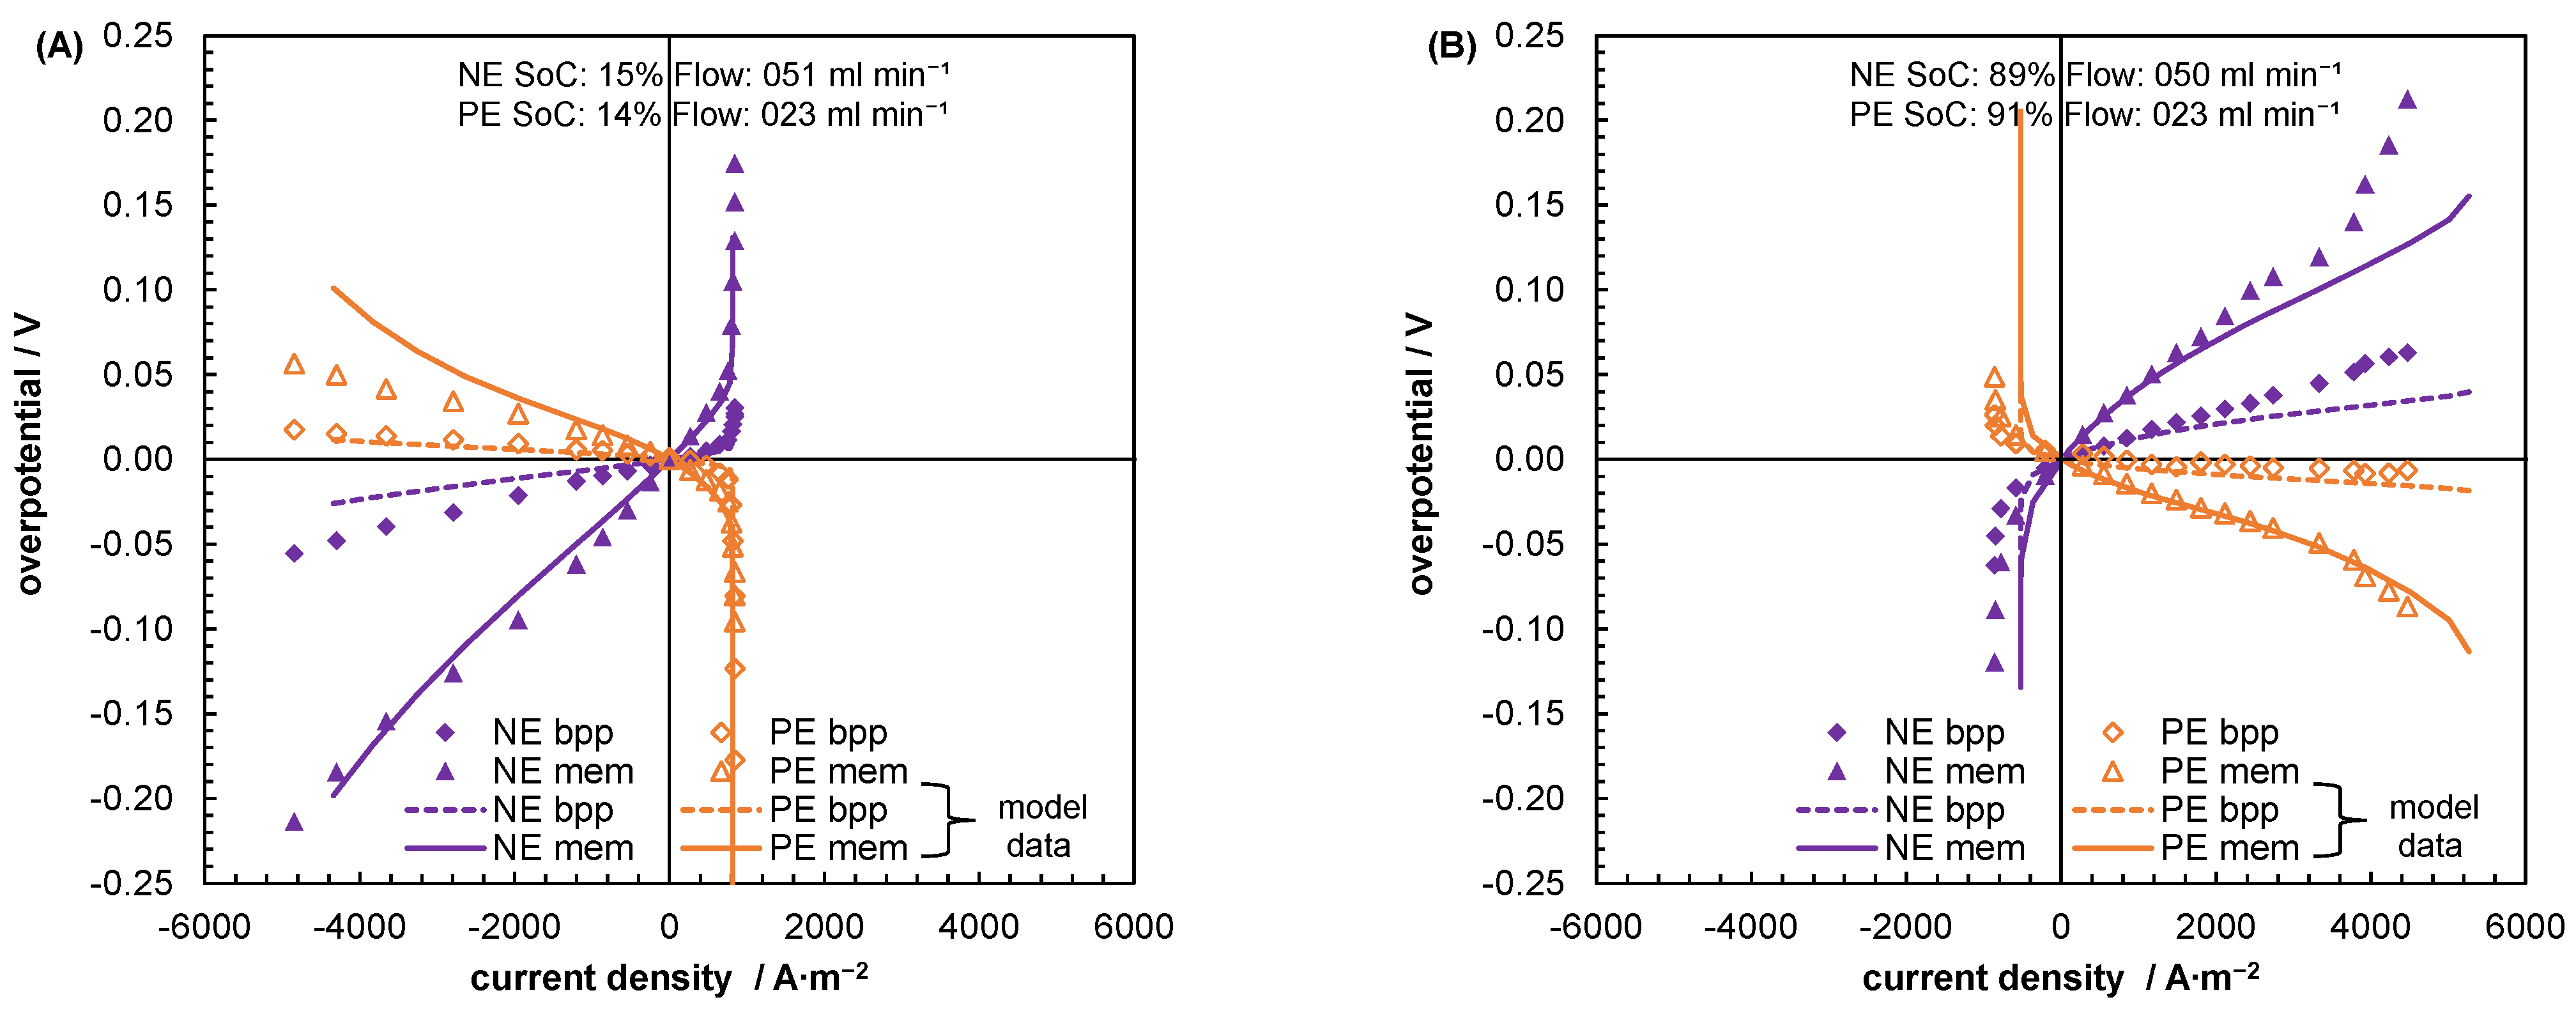
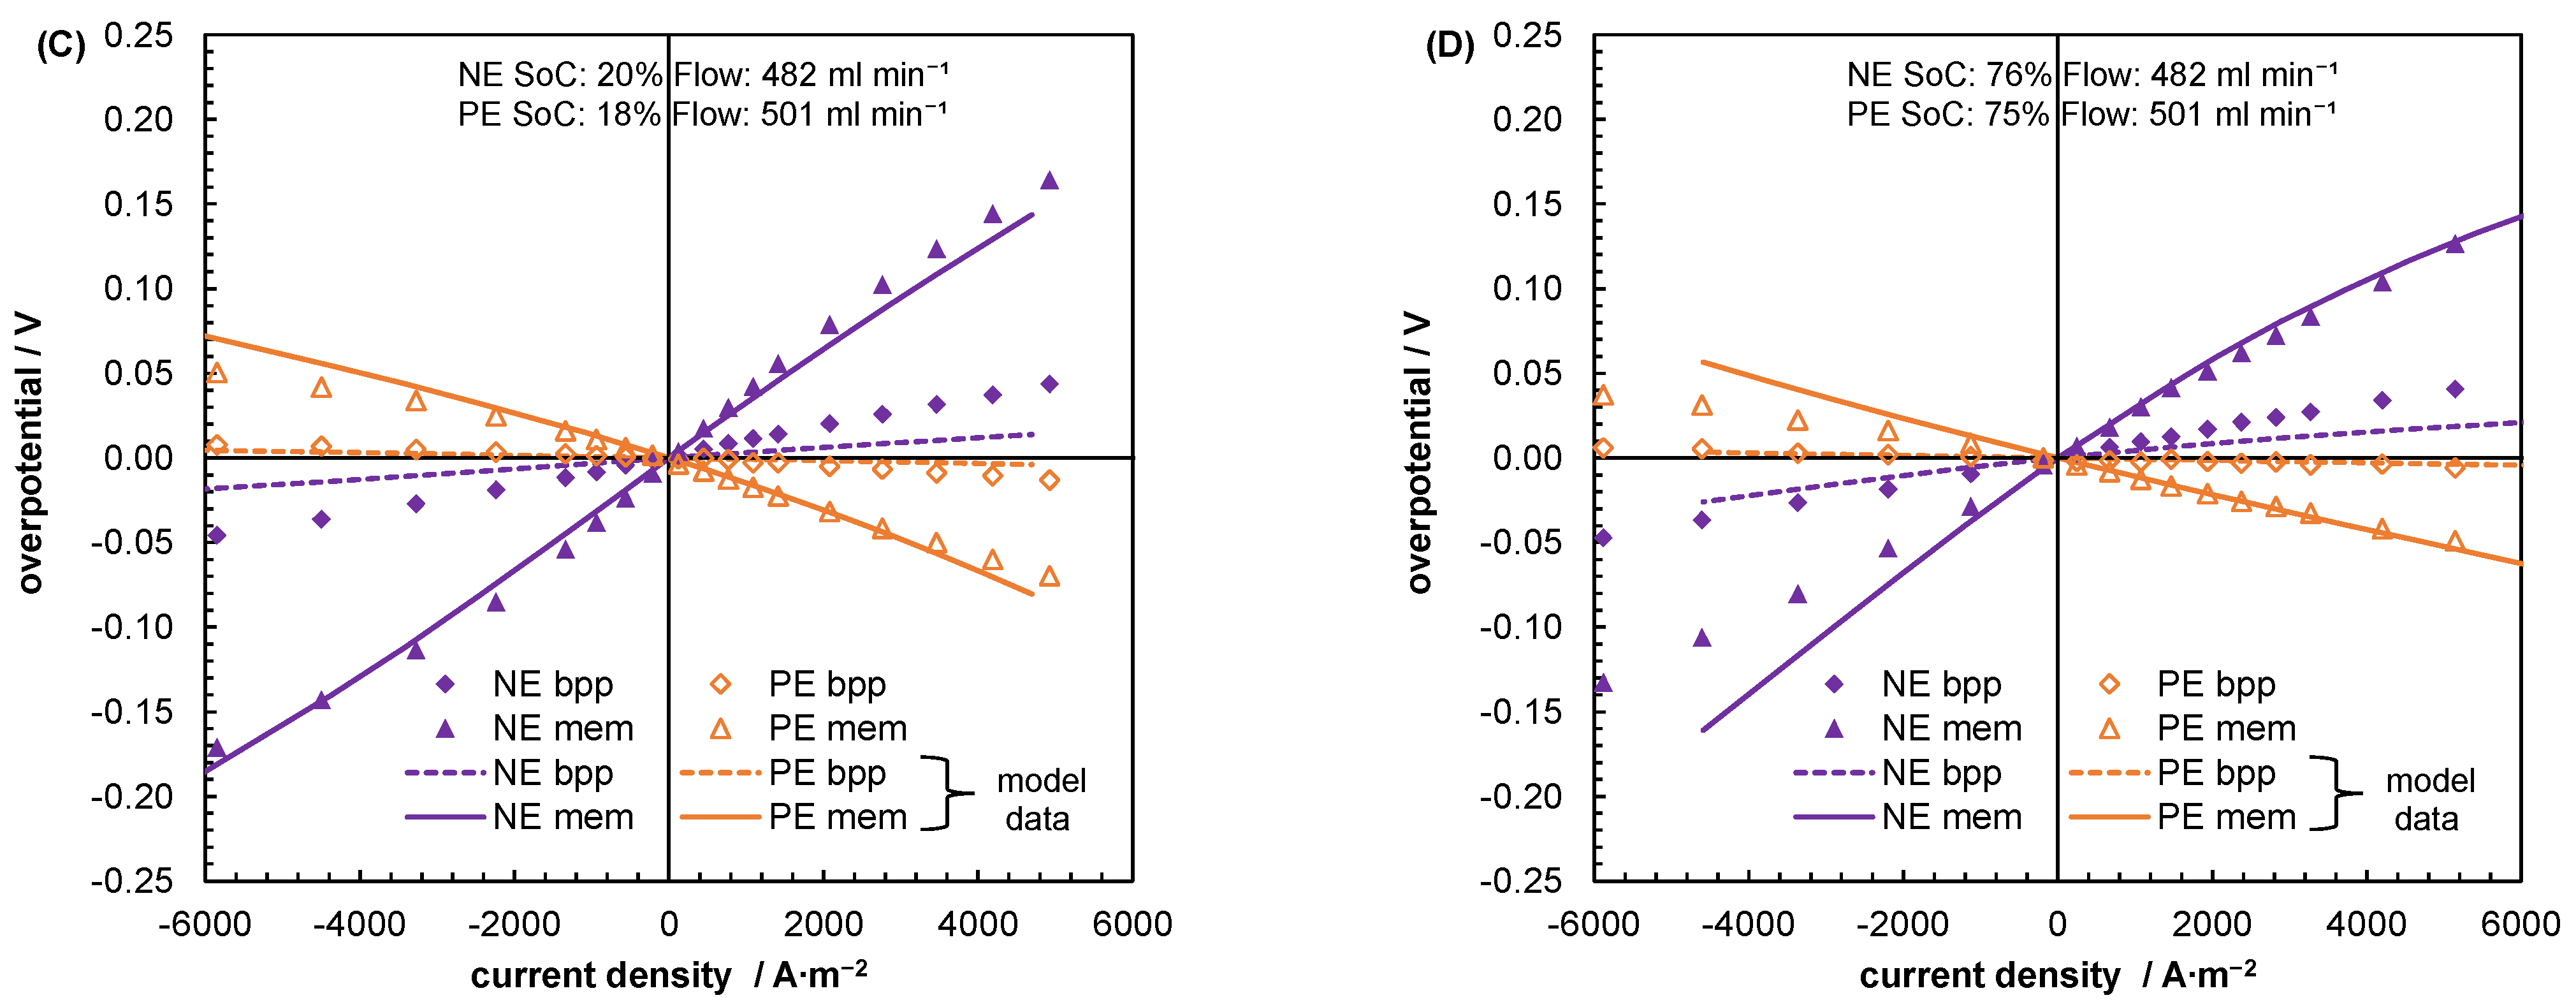
5.2. Mass Transport Parameter Estimation and Model Validation

The mathematical model as described in Section 3 was implemented in gPROMS® ModelBuilder 5.1.1 (Siemens Process Systems Engineering, UK). The grid size of the electrodes plays a critical role in accomplishing a robust and efficient model. Several model evolutions lead to a robust and quite fast model with grid distributions and discretization methods as follows: The y-dimension (parallel to flow) is separated into 50 grid points with a uniform distribution over the height of the electrode and is solved with a second-order backward finite difference method. The x-dimension (through plane) required a manually designed non-uniform grid. The mid-section is designed with a coarse grid and both outer regions possess an exponentially decreasing step size for each grid point, resulting in a symmetric grid of 20 intervals, as presented in Figure 8B. This design is required, since large potential, current density, and concentration gradients occur especially at the boundary layer between the carbon felt electrode and membrane, affecting the stability of the whole model. The discretization method in this dimension is set as a centered finite difference with an order of two.
The experimental data of all polarization curves (five different SoCs each with six variations of flow rate) resulting from the two cell setups of 9% and 42% carbon felt compression rate was implemented in gPROMS® so that quasi-stationary current density and potential probe signals from modelling could be compared to experimental data when operational parameters (flow rate, cell voltage and state of charge of each electrolyte) were assigned in the model. The potential probe signals could be directly extracted from the model data of liquid and solid phase potential distribution when the corresponding positions of the experimental probes were used (c.f. Supplementary materials Figures S1–S12). Other parameters, such as reaction rate constants, membrane resistances, reference potentials, electrolyte properties, and specific electrical resistance of the carbon felt were taken from the evaluation already described in this work. The model validation capability of gPROMS® was executed to determine the mass transport parameter aSh by the maximum likelihood estimation method for both cell setups individually (all involved solvers and solver parameters were kept at the default value).
The results of the parameter estimations of the parameter aSh are given in Figure 9A and are compared to those of Kinoshita et al. and Vatistas et al. [29,56]. The results are in the range of these two publications but are closer to the values of Kinoshita et al. Additionally, the corresponding Sherwood numbers for a given Schmidt number of completely discharged positive electrolytes are compared to those from Kinoshita et al., Vatistas et al., and Schmal et al. [29,30,56], whereas their experimentally derived data points are presented to compare the accuracy of the methods (c.f. Figure 9B). The average correlation from the two-parameter estimations fits quite well with the datasets Kinoshita et al. presented, especially when considering the range of uncertainty from both evaluations. The dataset of Vatistas et al. is in fairly good congruence only for low Reynolds numbers, however, they mentioned a higher uncertainty for their results in this range. The range of Sherwood numbers between those predicted by Kinoshita et al. and those predicted by Vatistas et al. were assumed to be the most reasonable ones (c.f. Section 2), thus it seems that the parameter estimation confirms this assumption, giving a mass transport correlation as follows:
S h i = 0.07 ± 0.02   R e 0.66 S c i 0.45       ( 0.0018   <   R e   <   0.11 )
To check the accuracy of the model predictions for current density and potential probe signals, a subset of characteristic curves is shown in Figure 10, Figure 11, Figure 12 and Figure 13. The full data set can be found in the Supplementary materials (c.f. Figures S1–S12), where experimental data and modelled values are compared in their entirety, but for the sake of readability, the presented results are reduced to the most characteristic ones in this section. Figure 10 presents the comparison of polarization curves for variation of flow rate at low SoC for both cell setups. The low state of charge results in a sufficient mass transport limitation for low flow rates, where a distinct maximum current density can be achieved during discharge. Modelled and experimentally derived curves are generally in acceptable agreement and in particular the polarization curves for low and high flow rates show a reasonable congruence during discharge. Slight deviations occur during the charging process, where the modelled data underestimates the current density, and during the discharge process for medium flow rates, where the current density is slightly overestimated by the model. A possible explanation could be based on additional side reactions during the charging process, in particular the hydrogen evolution reaction in the negative half-cell, which could lead to higher charging current densities. Since the model does not include side reactions, this underestimation of the current density during charging could cause the model to increase the mass transport coefficient, leading to an overestimation of the current density during discharge. At very low and very high flow rates this effect is less important because very low flow rates limit the discharging current density through strong convective mass transport limitations, superimposing the weaker pronounced effects of diffusive mass transport. At high flow rates, the convective mass transport is not limited, and diffusion mass transport limitation becomes negligibly small since the diffusion boundary layer is decreased to low thicknesses. Only at medium flow rates does the diffusion mass transport influence the discharging current more intensively and thus provide a potentially good explanation for the observable deviation.
When considering the results presented in Figure 11, where polarization curves for low and high flow rates under variation of the state of charge are presented for both cell setups, it seems reasonable to assume a certain degree of side reactions during charging, since the current density during charging is underestimated by the model, especially for low flow rates. For higher flow rates, the current densities increase in general due to increased mass transport, thus the deviation due to potential side reactions is mitigated. Nevertheless, the predicted curves are in quite good agreement with the measured polarization curves for all conditions shown, at least for the cell voltage as the key indicator for the cell’s performance.
The difference between liquid and solid phase potentials gives direct information on the locally resolved overpotential in the VRFB. To capture the whole image of operational parameters in a few figures, the overpotential information is given for low and high flow rates as well as for the low and high states of charge in Figure 12. The overpotential is shown for the membrane electrode interface and the bipolar plate electrode interface of the cell setup with 42% carbon felt compression rate for the negative and positive half-cell, respectively. The results indicate in general, a good fit between modelled and experimental data, especially the large spread between the high overpotentials at the membrane interface compared to the low overpotentials at the bipolar plate interface. The “potential jumps” at low flow rates that occur at a low state of charge during discharge and at a high state of charge during charge are predicted quite well, although the maximum current density during charge is underestimated slightly.
The curve of the overvoltage signals at the interface to the membrane is mainly determined by the curve of the liquid phase probe signal. Due to the significantly lower specific electrical resistances in the felt material, the solid phase signals are only very faintly developed and result in an almost always linear curve (the reader might be referred to the Supplementary Materials where all polarization curve data of cell voltage and potential probe signals is included). The signals at the bipolar plate interface typically possess only a very low inclination also, so only the curve of liquid phase probes at the membrane interface with a variation of flow rate at a low state of charge is shown in Figure 13. The low state of charge accentuates mass transport limitations during discharge, while the signals for charging show a very narrow range for flow rate variations. The comparison of experimental and modelled data during discharge indicates at least sufficient agreement. However, the cell setup with a carbon felt compression rate of 9% shows distinct deviations, in particular for the negative half-cell, where the slope for charging seems to be mismatched and the liquid phase potential during discharging is slightly overestimated. This is surprising, since the exchange current densities from impedance spectroscopy showed quite a good fit for the negative half-cell, when compared to the positive half-cell (c.f. Figure 6). Side reactions are unlikely to cause the deviation in overpotentials during charging since the anodic overpotential in the negative half-cell suppresses the hydrogen evolution reaction rather than promoting it. Therefore, the reason for the deviation might be related to uncertainties in the charge transfer coefficients, which showed a slight dependence on the state of charge [61,62]. Nonetheless, this is still not a very likely explanation, since it cannot elucidate the quite good fit for the cell setup with higher a carbon felt compression rate (Figure 13B). The tendencies of the probe potentials are predicted quite well for all liquid phase potential probe signals shown in Figure 13. Although the figures are not given in this section, it should be mentioned that the model is quite precise in predicting the solid phase potential probe signals for almost every operational condition and cell setup. The reader is referred to the Supplementary Materials, where a comparison of all experimental and modelled data is given.

6. Conclusions

In this work, it was shown how a mathematical model can be applied for parameter estimation of critical mass transport coefficients in the carbon felt of a VRFB. To achieve this, the available literature was thoroughly reviewed to identify a basis for the mass transport correlation and to reduce the number of parameters that needed revision to just one; the Sherwood correlation coefficient aSh. The most probable value for this parameter was assumed to be in the range of 0.05–0.15. A two-dimensional model was designed based on literature approaches to describe the electrode processes and all the required input parameters were taken from the evaluation described in previous work or were determined experimentally in-situ or ex-situ. The combination of the liquid phase and solid phase potential-probes was used during polarization curve measurements to acquire information on the bipolar plate resistance including contact resistance, as well as membrane resistance for charging and discharging and depending on SoC. The reaction rate constants were evaluated from impedance spectroscopy, while a reaction order of two was assumed for each reacting VS. The conductivity measurements and OCV voltage measurements during cell operation served as a data basis to estimate the electrolyte’s conductivity and reference potentials of the positive half-cell. Additional measurements of electrolyte viscosity and density were a reliable source to describe these properties of the electrolyte. A literature review on diffusion coefficients for vanadium in a sulfuric acid environment allowed an interpolation of the diffusion coefficient of each species for the sulfuric acid concentration applied in the experiments. The parameter estimation application of gPROMS® ModelBuilder was used to estimate the Sherwood correlation coefficient aSh based on the polarization curves of two cell setups with 9% and 42% carbon felt compression rates. The resulting coefficients are 0.09 and 0.05 and lie well within the expected range, leading to an average value of 0.07. The comparison of modelled data to experimental data exhibits a good congruence although some deviations remain, which might be explained by side reactions and uncertainties in the exact description of charge transfer coefficients and exchange current densities. Possible side reactions that can explain these deviations are self-discharge reactions across the membrane [75] and equilibrium reactions between the various complex vanadium species, that could be described by a general electrochemical formalism [76]. Only a minor contribution to the deviations is attributed to the hydrogen evolution reaction during charging. Nevertheless, the model seems to be sufficiently valid and can therefore be used in further work for the optimization of electrode thicknesses, and optimal flow rates or it might be applied to predict the effect of electrode treatment, adapted carbon fiber diameters, or effects of electrolyte maldistribution due to improperly designed flow fields.

Supplementary Materials

The following supporting information can be downloaded at: https://www.mdpi.com/article/10.3390/batteries9050253/s1, Figures S1–S6: Polarization curves and corresponding overpotentials of a cell setup with 9% carbon felt compression rate (GFD4.6E carbon felts, Nafion 117 membrane) for several states of charge and flow rates.; Figures S7–S12: Polarization curves and corresponding overpotentials of a cell setup with 42% carbon felt compression rate (GFD4.6E carbon felts, Nafion 117 membrane) for several states of charge and flow rates.

Author Contributions

Conceptualization, M.B. and T.T.; Methodology, M.B.; Software, M.B.; Validation, M.B.; Formal Analysis, M.B.; Investigation, M.B.; Resources, M.B. and T.T.; Data Curation, M.B.; Writing—Original Draft Preparation, M.B.; Writing—Review and Editing, T.T.; Visualization, M.B.; Supervision, T.T.; Project Administration, T.T.; Funding Acquisition, T.T. All authors have read and agreed to the published version of the manuscript.

Funding

This work was funded by thyssenkrupp Industrial Solutions AG.

Data Availability Statement

Not applicable.

Acknowledgments

This paper is part of the PhD thesis of the corresponding author [77] and we acknowledge the permission of Cuvillier Verlag to publish the main results in this journal.

Conflicts of Interest

The authors declare no conflict of interest.

Appendix A

Table A1. Symbols applied in the mathematical model.
SymbolNameUnit
aSpecific surface area of the electrodem2 m−3
aSh, bSh, cShEmpirical coefficients for the calculation of the Sherwood number-
cinConcentration of vanadium species in cell inletmol m−3
cbulkConcentration in the bulk of the electrolytemol m−3
CRCompression rate of the electrode%
crefReference concentration according to standard conditions1000 mol m−3
csurfConcentration on the fiber surface of the carbon-felt electrodemol m−3
DDiffusion coefficientm2 s−1
dfDiameter of the graphite fibersm
dhHydraulic diameter of the carbon feltm
EeqEquilibrium potential of a single reactionV
EOCVOpen circuit potential of a full cellV
ErefStandard electrode potentialV
FFaradaic constant (96,485)96,485 C mol−1
HHeight of the electrodem
iCharge transfer current densityA m−2
i0Exchange current densityA m−2
JMass fluxmol m−2 s−1
jLocal current densityA m−2
jeffEffective current density applied to the whole cellA m−2
jLCurrent density in the liquid phase of the electrode areaA m−2
jSCurrent density in the solid phase of the electrodeA m−2
k0Reaction rate constantm s−1
KsAcid dissociation constant-
kmMass transfer coefficientm s−1
RIdeal gas constant8.314 J mol−1 K−1
rbppBipolar plate resistanceΩ m2
ReReynolds number-
rmem,chMembrane resistance during chargingΩ m2
rmem,disMembrane resistance during dischargingΩ m2
ShSherwood number-
SoCState of Charge%
TTemperatureK
tThickness of the compressed electrodem
t0Uncompressed thickness of the electrodem
uElectrolyte flow velocitym s−1
UCell voltageV
V ˙ Flow rate through the electrodem3 s−1
WWidth of the electrodem
wAreal weight of the electrodekg m−2
xHorizontal dimension in the NE electrodem
x’Horizontal dimension in the PE electrodem
yVertical dimension m
zElementary charge-
αanAnodic charge transfer coefficient-
αcatCathodic charge transfer coefficient-
δDiffusion layer thicknessm
εPorosity of the electrode%
κelElectrolyte conductivityS m−1
κoffestElectrolyte conductivity, offset parameterS m−1
κslopeElectrolyte conductivity, slope parameterS m−1
µelElectrolyte viscosityPa s
µoffsetElectrolyte viscosity, offset parameterPa s
µslopeElectrolyte viscosity, slope parameterPa s
νStoichiometric coefficient-
νanReaction order for the anodic reaction-
νcatReaction order for the cathodic reaction-
ρcarbonCarbon fiber density of the carbon felt electrodekg m−3
ρLSpecific electrical resistance of the liquid phaseΩ m
ρSSpecific electrical resistance of the solid phase/carbon felt electrodeΩ m
ρelDensity of the electrolytekg m−3
φLPotential in the liquid phase of the electrodeV
φSPotential in the solid phase of the electrodeV
Table A2. Indexes and Subscripts applied in the description of the mathematical model.
Index/SubscriptName
bulkVariable or parameter related to the bulk phase of the electrolyte in the electrode
elElectrolyte parameter
iIndex of the vanadium species
inInlet conditions
kIndex of acid species
LLiquid phase
NENegative electrolyte
offsetOffset value of a parameter for an SoC of 0%
PEPositive electrolyte
rIndex of the reaction
SSolid phase
slopeSlope of a parameter in dependence of SoC
surfVariable or parameter related to the surface of the carbon fibers

References

  1. Minke, C.; Kunz, U.; Turek, T. Techno-Economic Assessment of Novel Vanadium Redox Flow Batteries with Large-Area Cells. J. Power Sources 2017, 361, 105–114. [Google Scholar] [CrossRef]
  2. Sánchez-Díez, E.; Ventosa, E.; Guarnieri, M.; Trovò, A.; Flox, C.; Marcilla, R.; Soavi, F.; Mazur, P.; Aranzabe, E.; Ferret, R. Redox Flow Batteries: Status and Perspective towards Sustainable Stationary Energy Storage. J. Power Sources 2021, 481, 228804. [Google Scholar] [CrossRef]
  3. Huang, Z.; Mu, A.; Wu, L.; Yang, B.; Qian, Y.; Wang, J. Comprehensive Analysis of Critical Issues in All-Vanadium Redox Flow Battery. ACS Sustain. Chem. Eng. 2022, 10, 7786–7810. [Google Scholar] [CrossRef]
  4. Ghimire, P.C.; Bhattarai, A.; Lim, T.M.; Wai, N.; Skyllas-Kazacos, M.; Yan, Q. In-Situ Tools Used in Vanadium Redox Flow Battery Research—Review. Batteries 2021, 7, 53. [Google Scholar] [CrossRef]
  5. Soloveichik, G.L. Flow Batteries: Current Status and Trends. Chem. Rev. 2015, 115, 11533–11558. [Google Scholar] [CrossRef]
  6. Noack, J.; Roznyatovskaya, N.; Herr, T.; Fischer, P. The Chemistry of Redox-Flow Batteries. Angew. Chem. Int. Ed. 2015, 54, 9776–9809. [Google Scholar] [CrossRef]
  7. Winsberg, J.; Hagemann, T.; Janoschka, T.; Hager, M.D.; Schubert, U.S. Redox-Flow Batteries: From Metals to Organic Redox-Active Materials. Angew. Chem. Int. Ed. Engl. 2017, 56, 686–711. [Google Scholar] [CrossRef]
  8. Zhang, C.; Zhang, L.; Ding, Y.; Peng, S.; Guo, X.; Zhao, Y.; He, G.; Yu, G. Progress and Prospects of Next-Generation Redox Flow Batteries. Energy Storage Mater. 2018, 15, 324–350. [Google Scholar] [CrossRef]
  9. Ke, X.; Prahl, J.M.; Alexander, J.I.D.; Wainright, J.S.; Zawodzinski, T.A.; Savinell, R.F. Rechargeable Redox Flow Batteries: Flow Fields, Stacks and Design Considerations. Chem. Soc. Rev. 2018, 47, 8721–8743. [Google Scholar] [CrossRef]
  10. König, S. Model-Based Design and Optimization of Vanadium Redox Flow Batteries. Ph.D. Thesis, Karlsruhe Institute of Technology, Karlsruhe, Germany, 2017. [Google Scholar] [CrossRef]
  11. Puleston, T.; Clemente, A.; Costa-Castelló, R.; Serra, M. Modelling and Estimation of Vanadium Redox Flow Batteries: A Review. Batteries 2022, 8, 121. [Google Scholar] [CrossRef]
  12. Viswanathan, V.V.; Crawford, A.J.; Thomsen, E.C.; Shamim, N.; Li, G.; Huang, Q.; Reed, D.M. An Overview of the Design and Optimized Operation of Vanadium Redox Flow Batteries for Durations in the Range of 4–24 Hours. Batteries 2023, 9, 221. [Google Scholar] [CrossRef]
  13. Huang, Z.; Mu, A.; Wu, L.; Wang, H. Vanadium Redox Flow Batteries: Flow Field Design and Flow Rate Optimization. J. Energy Storage 2022, 45, 103526. [Google Scholar] [CrossRef]
  14. You, D.; Zhang, H.; Chen, J. A Simple Model for the Vanadium Redox Battery. Electrochim. Acta 2009, 54, 6827–6836. [Google Scholar] [CrossRef]
  15. Wandschneider, F.T.; Röhm, S.; Fischer, P.; Pinkwart, K.; Tübke, J.; Nirschl, H. A Multi-Stack Simulation of Shunt Currents in Vanadium Redox Flow Batteries. J. Power Sources 2014, 261, 64–74. [Google Scholar] [CrossRef]
  16. Pugach, M.; Kondratenko, M.; Briola, S.; Bischi, A. Numerical and Experimental Study of the Flow-by Cell for Vanadium Redox Batteries. Energy Procedia 2017, 142, 3667–3674. [Google Scholar] [CrossRef]
  17. Zugschwert, C.; Dundálek, J.; Leyer, S.; Hadji-Minaglou, J.-R.; Kosek, J.; Pettinger, K.-H. The Effect of Input Parameter Variation on the Accuracy of a Vanadium Redox Flow Battery Simulation Model. Batteries 2021, 7, 7. [Google Scholar] [CrossRef]
  18. Huang, S.; Lu, Y. Numerical Parametric Investigation of Nonaqueous Vanadium Redox Flow Batteries. Batteries 2022, 8, 75. [Google Scholar] [CrossRef]
  19. Vudisi, P.K.; Jayanti, S.; Chetty, R. Model for Rating a Vanadium Redox Flow Battery Stack through Constant Power Charge–Discharge Characterization. Batteries 2022, 8, 85. [Google Scholar] [CrossRef]
  20. Eifert, L.; Banerjee, R.; Jusys, Z.; Zeis, R. Characterization of Carbon Felt Electrodes for Vanadium Redox Flow Batteries: Impact of Treatment Methods. J. Electrochem. Soc. 2018, 165, A2577. [Google Scholar] [CrossRef]
  21. Hassan, A.; Tzedakis, T. Enhancement of the Electrochemical Activity of a Commercial Graphite Felt for Vanadium Redox Flow Battery (VRFB), by Chemical Treatment with Acidic Solution of K2Cr2O7. J. Energy Storage 2019, 26, 100967. [Google Scholar] [CrossRef]
  22. Pezeshki, A.M.; Clement, J.T.; Veith, G.M.; Zawodzinski, T.A.; Mench, M.M. High Performance Electrodes in Vanadium Redox Flow Batteries through Oxygen-Enriched Thermal Activation. J. Power Sources 2015, 294, 333–338. [Google Scholar] [CrossRef]
  23. Nibel, O.; Taylor, S.M.; Pătru, A.; Fabbri, E.; Gubler, L.; Schmidt, T.J. Performance of Different Carbon Electrode Materials: Insights into Stability and Degradation under Real Vanadium Redox Flow Battery Operating Conditions. J. Electrochem. Soc. 2017, 164, A1608. [Google Scholar] [CrossRef]
  24. Eifert, L.; Jusys, Z.; Behm, R.J.; Zeis, R. Side Reactions and Stability of Pre-Treated Carbon Felt Electrodes for Vanadium Redox Flow Batteries: A DEMS Study. Carbon 2020, 158, 580–587. [Google Scholar] [CrossRef]
  25. Becker, M.; Turek, T. Combination of Impedance Spectroscopy and Potential Probe Sensing to Characterize Vanadium Redox-Flow Batteries. J. Power Sources 2020, 446, 227349. [Google Scholar] [CrossRef]
  26. Belfiore, L.A. Laminar Boundary Layer Mass Transfer around Solid Spheres, Gas Bubbles, and Other Submerged Objects. In Transport Phenomena for Chemical Reactor Design; John Wiley & Sons, Ltd.: Hoboken, NJ, USA, 2003; pp. 275–360. ISBN 978-0-471-47162-2. [Google Scholar]
  27. Belfiore, L.A. Dimensional Analysis of the Equations of Change for Fluid Dynamics Within the Mass Transfer Boundary Layer. In Transport Phenomena for Chemical Reactor Design; John Wiley & Sons, Ltd.: Hoboken, NJ, USA, 2003; pp. 361–368. ISBN 978-0-471-47162-2. [Google Scholar]
  28. Perry, R.H.; Green, D.W. Mass Transfer. In Perry’s Chemical Engineers’ Handbook; Mcgraw-Hill Professional: New York, NY, USA, 1997; pp. 5–59. ISBN 978-0-07-049841-9. [Google Scholar]
  29. Kinoshita, K.; Leach, S.C. Mass-Transfer Study of Carbon Felt, Flow-Through Electrode. J. Electrochem. Soc. 1982, 129, 1993–1997. [Google Scholar] [CrossRef]
  30. Schmal, D.; Van Erkel, J.; Van Duin, P.J. Mass Transfer at Carbon Fibre Electrodes. J. Appl. Electrochem. 1986, 16, 422–430. [Google Scholar] [CrossRef]
  31. Bayanov, I.M.; Vanhaelst, R. The Numerical Simulation of Vanadium RedOx Flow Batteries. J. Math. Chem. 2011, 49, 2013–2031. [Google Scholar] [CrossRef]
  32. Ma, X.; Zhang, H.; Xing, F. A Three-Dimensional Model for Negative Half Cell of the Vanadium Redox Flow Battery. Electrochim. Acta 2011, 58, 238–246. [Google Scholar] [CrossRef]
  33. Xu, Q.; Zhao, T.S.; Leung, P.K. Numerical Investigations of Flow Field Designs for Vanadium Redox Flow Batteries. Appl. Energy 2013, 105, 47–56. [Google Scholar] [CrossRef]
  34. Zheng, Q.; Zhang, H.; Xing, F.; Ma, X.; Li, X.; Ning, G. A Three-Dimensional Model for Thermal Analysis in a Vanadium Flow Battery. Appl. Energy 2014, 113, 1675–1685. [Google Scholar] [CrossRef]
  35. Wang, Y.; Cho, S.C. Analysis and Three-Dimensional Modeling of Vanadium Flow Batteries. J. Electrochem. Soc. 2014, 161, A1200–A1212. [Google Scholar] [CrossRef]
  36. Yu, Y.; Zuo, Y.; Zuo, C.; Liu, X.; Liu, Z. A Hierarchical Multiscale Model for Microfluidic Fuel Cells with Porous Electrodes. Electrochim. Acta 2014, 116, 237–243. [Google Scholar] [CrossRef]
  37. Chen, C.L.; Yeoh, H.K.; Chakrabarti, M.H. An Enhancement to Vynnycky’s Model for the All-Vanadium Redox Flow Battery. Electrochim. Acta 2014, 120, 167–179. [Google Scholar] [CrossRef]
  38. Wandschneider, F.T.; Kuettinger, M.; Noack, J.; Fischer, P.; Pinkwart, K.; Tuebke, J.; Nirschl, H. A Coupled-Physics Model for the Vanadium Oxygen Fuel Cell. J. Power Sources 2014, 259, 125–137. [Google Scholar] [CrossRef]
  39. Rudolph, S.; Schröder, U.; Bayanov, I.M.; Hage, D. Measurement, Simulation and in Situ Regeneration of Energy Efficiency in Vanadium Redox Flow Battery. J. Electroanal. Chem. 2014, 728, 72–80. [Google Scholar] [CrossRef]
  40. Yu, V.K.; Chen, D. Peak Power Prediction of a Vanadium Redox Flow Battery. J. Power Sources 2014, 268, 261–268. [Google Scholar] [CrossRef]
  41. Wandschneider, F.T.; Finke, D.; Grosjean, S.; Fischer, P.; Pinkwart, K.; Tübke, J.; Nirschl, H. Model of a Vanadium Redox Flow Battery with an Anion Exchange Membrane and a Larminie-Correction. J. Power Sources 2014, 272, 436–447. [Google Scholar] [CrossRef]
  42. Xu, Q.; Zhao, T.S. Fundamental Models for Flow Batteries. Prog. Energy Combust. Sci. 2015, 49, 40–58. [Google Scholar] [CrossRef]
  43. Khazaeli, A.; Vatani, A.; Tahouni, N.; Panjeshahi, M.H. Numerical Investigation and Thermodynamic Analysis of the Effect of Electrolyte Flow Rate on Performance of All Vanadium Redox Flow Batteries. J. Power Sources 2015, 293, 599–612. [Google Scholar] [CrossRef]
  44. Gandomi, Y.A.; Aaron, D.S.; Zawodzinski, T.A.; Mench, M.M. In Situ Potential Distribution Measurement and Validated Model for All-Vanadium Redox Flow Battery. J. Electrochem. Soc. 2016, 163, A5188–A5201. [Google Scholar] [CrossRef]
  45. Li, Y.; Skyllas-Kazacos, M.; Bao, J. A Dynamic Plug Flow Reactor Model for a Vanadium Redox Flow Battery Cell. J. Power Sources 2016, 311, 57–67. [Google Scholar] [CrossRef]
  46. Crawford, A.; Thomsen, E.; Reed, D.; Stephenson, D.; Sprenkle, V.; Liu, J.; Viswanathan, V. Development and Validation of Chemistry Agnostic Flow Battery Cost Performance Model and Application to Nonaqueous Electrolyte Systems. Int. J. Energy Res. 2016, 40, 1611–1623. [Google Scholar] [CrossRef]
  47. Zago, M.; Casalegno, A. Physically-Based Impedance Modeling of the Negative Electrode in All-Vanadium Redox Flow Batteries: Insight into Mass Transport Issues. Electrochim. Acta 2017, 248, 505–517. [Google Scholar] [CrossRef]
  48. Fu, J.; Wang, T.; Wang, X.; Sun, J.; Zheng, M. Dynamic Flow Rate Control for Vanadium Redox Flow Batteries. Energy Procedia 2017, 105, 4482–4491. [Google Scholar] [CrossRef]
  49. Yue, M.; Zheng, Q.; Xing, F.; Zhang, H.; Li, X.; Ma, X. Flow Field Design and Optimization of High Power Density Vanadium Flow Batteries: A Novel Trapezoid Flow Battery. Aiche J. 2018, 64, 782–795. [Google Scholar] [CrossRef]
  50. Koenig, S.; Suriyah, M.R.; Leibfried, T. Validating and Improving a Zero-Dimensional Stack Voltage Model of the Vanadium Redox Flow Battery. J. Power Sources 2018, 378, 10–18. [Google Scholar] [CrossRef]
  51. Wang, T.; Fu, J.; Zheng, M.; Yu, Z. Dynamic Control Strategy for the Electrolyte Flow Rate of Vanadium Redox Flow Batteries. Appl. Energy 2018, 227, 613–623. [Google Scholar] [CrossRef]
  52. Kim, Y.; Choi, Y.Y.; Yun, N.; Yang, M.; Jeon, Y.; Kim, K.J.; Choi, J.-I. Activity Gradient Carbon Felt Electrodes for Vanadium Redox Flow Batteries. J. Power Sources 2018, 408, 128–135. [Google Scholar] [CrossRef]
  53. Zhang, B.W.; Lei, Y.; Bai, B.F.; Xu, A.; Zhao, T.S. A Two-Dimensional Mathematical Model for Vanadium Redox Flow Battery Stacks Incorporating Nonuniform Electrolyte Distribution in the Flow Frame. Appl. Therm. Eng. 2019, 151, 495–505. [Google Scholar] [CrossRef]
  54. Carta, R.; Palmas, S.; Polcaro, A.M.; Tola, G. Behaviour of a Carbon Felt Flow by Electrodes Part I: Mass Transfer Characteristics. J. Appl. Electrochem. 1991, 21, 793–798. [Google Scholar] [CrossRef]
  55. Xu, Q.; Zhao, T.S. Determination of the Mass-Transport Properties of Vanadium Ions through the Porous Electrodes of Vanadium Redox Flow Batteries. Phys. Chem. Chem. Phys. 2013, 15, 10841–10848. [Google Scholar] [CrossRef] [PubMed]
  56. Vatistas, N.; Marconi, P.F.; Bartolozzi, M. Mass-Transfer Study of the Carbon Felt Electrode. Electrochim. Acta 1991, 36, 339–343. [Google Scholar] [CrossRef]
  57. You, X.; Ye, Q.; Cheng, P. The Dependence of Mass Transfer Coefficient on the Electrolyte Velocity in Carbon Felt Electrodes: Determination and Validation. J. Electrochem. Soc. 2017, 164, E3386–E3394. [Google Scholar] [CrossRef]
  58. Barton, J.L.; Milshtein, J.D.; Hinricher, J.J.; Brushett, F.R. Quantifying the Impact of Viscosity on Mass-Transfer Coefficients in Redox Flow Batteries. J. Power Sources 2018, 399, 133–143. [Google Scholar] [CrossRef]
  59. Kok, M.D.R.; Jervis, R.; Tranter, T.G.; Sadeghi, M.A.; Brett, D.J.L.; Shearing, P.R.; Gostick, J.T. Mass Transfer in Fibrous Media with Varying Anisotropy for Flow Battery Electrodes: Direct Numerical Simulations with 3D X-Ray Computed Tomography. Chem. Eng. Sci. 2019, 196, 104–115. [Google Scholar] [CrossRef]
  60. Shah, A.A.; Watt-Smith, M.J.; Walsh, F.C. A Dynamic Performance Model for Redox-Flow Batteries Involving Soluble Species. Electrochim. Acta 2008, 53, 8087–8100. [Google Scholar] [CrossRef]
  61. Becker, M.; Bredemeyer, N.; Tenhumberg, N.; Turek, T. Kinetic Studies at Carbon Felt Electrodes for Vanadium Redox-Flow Batteries under Controlled Transfer Current Density Conditions. Electrochim. Acta 2017, 252, 12–24. [Google Scholar] [CrossRef]
  62. Kroner, I.; Becker, M.; Turek, T. Determination of Rate Constants and Reaction Orders of Vanadium-Ion Kinetics on Carbon Fiber Electrodes. ChemElectroChem 2020, 7, 4314–4325. [Google Scholar] [CrossRef]
  63. Corcuera, S.; Skyllas-Kazacos, M. State-of-Charge Monitoring and Electrolyte Rebalancing Methods for the Vanadium Redox Flow Battery. Eur. Chem. Bull. 2012, 1, 511–519. [Google Scholar] [CrossRef]
  64. Becker, M.; Bredemeyer, N.; Tenhumberg, N.; Turek, T. Polarization Curve Measurements Combined with Potential Probe Sensing for Determining Current Density Distribution in Vanadium Redox-Flow Batteries. J. Power Sources 2016, 307, 826–833. [Google Scholar] [CrossRef]
  65. Küster, F.W.; Thiel, A. Rechentafeln Für Die Chemische Analytik; Walter de Gruyter & Co. KG: Berlin, Germany; New York, NY, USA, 2002; p. 239. ISBN 3-11-017566-5. [Google Scholar]
  66. Knehr, K.W.; Agar, E.; Dennison, C.R.; Kalidindi, A.R.; Kumbur, E.C. A Transient Vanadium Flow Battery Model Incorporating Vanadium Crossover and Water Transport through the Membrane. J. Electrochem. Soc. 2012, 159, A1446–A1459. [Google Scholar] [CrossRef]
  67. Paasch, G.; Micka, K.; Gersdorf, P. Theory of the Electrochemical Impedance of Macrohomogeneous Porous Electrodes. Electrochim. Acta 1993, 38, 2653–2662. [Google Scholar] [CrossRef]
  68. Schafner, K.; Becker, M.; Turek, T. Membrane Resistance of Different Separator Materials in a Vanadium Redox Flow Battery. J. Membrane Sci. 2019, 586, 106–114. [Google Scholar] [CrossRef]
  69. Pavelka, M.; Wandschneider, F.; Mazur, P. Thermodynamic Derivation of Open Circuit Voltage in Vanadium Redox Flow Batteries. J. Power Sources 2015, 293, 400–408. [Google Scholar] [CrossRef]
  70. Yamamura, T.; Watanabe, N.; Yano, T.; Shiokawa, Y. Electron-Transfer Kinetics of Np3+/Np4+, NpO2+/NpO2+, V2+/V3+, and VO2+/VO2+ at Carbon Electrodes. J. Electrochem. Soc. 2005, 152, A830. [Google Scholar] [CrossRef]
  71. Lawton, J.S.; Tiano, S.M.; Donnelly, D.J.; Flanagan, S.P.; Arruda, T.M. The Effect of Sulfuric Acid Concentration on the Physical and Electrochemical Properties of Vanadyl Solutions. Batteries 2018, 4, 40. [Google Scholar] [CrossRef]
  72. Jiang, Z.; Klyukin, K.; Alexandrov, V. Structure, Hydrolysis, and Diffusion of Aqueous Vanadium Ions from Car-Parrinello Molecular Dynamics. J. Chem. Phys. 2016, 145, 114303. [Google Scholar] [CrossRef]
  73. Oriji, G.; Katayama, Y.; Miura, T. Investigations on V(IV)/V(V) and V(II)/V(III) Redox Reactions by Various Electrochemical Methods. J. Power Sources 2005, 139, 321–324. [Google Scholar] [CrossRef]
  74. Gattrell, M.; Park, J.; MacDougall, B.; Apte, J.; McCarthy, S.; Wu, C.W. Study of the Mechanism of the Vanadium 4+/5+ Redox Reaction in Acidic Solutions. J. Electrochem. Soc. 2004, 151, A123–A130. [Google Scholar] [CrossRef]
  75. Lemmermann, T.; Becker, M.; Stehle, M.; Drache, M.; Beuermann, S.; Bogar, M.S.; Gohs, U.; Fittschen, U.E.A.; Turek, T.; Kunz, U. In Situ and in Operando Detection of Redox Reactions with Integrated Potential Probes during Vanadium Transport in Ion Exchange Membranes. J. Power Sources 2022, 533, 231343. [Google Scholar] [CrossRef]
  76. Di Noto, V.; Vezzù, K.; Crivellaro, G.; Pagot, G.; Sun, C.; Meda, L.; Rutkowska, I.A.; Kulesza, P.J.; Zawodzinski, T.A. A General Electrochemical Formalism for Vanadium Redox Flow Batteries. Electrochim. Acta 2022, 408, 139937. [Google Scholar] [CrossRef]
  77. Becker, M. Validation of a two-dimensional model for vanadium redox-flow batteries. Ph.D. Thesis, Clausthal University of Technology, Clausthal-Zellerfeld, Germany, 2020. [Google Scholar]
Figure 1. Schematic drawing of the diffusion layer between two exemplary sketched fibers.
Batteries 09 00253 g001
Figure 2. (A) Mass transport correlations for carbon electrodes as reported in different publications of Schmal et al. [30], Kinoshita et al. [29], Vatistas et al. [56], You et al. [57], Barton et al. with FT and ID cell design [58], Kok et al. [59], Carta et al. [54], Xu et al. [55], whereas the Schmidt number was fixed to 5000 and the porosity of the electrode was assumed to be 94%. The Sherwood and Reynolds numbers are related to the fiber diameter as the characteristic length. (B) Appropriate mass transport correlations as in (A) but including a Schmidt number dependence for all correlations with a Schmidt number of 20,972 (completely discharged positive electrolyte). The grey box indicates the most probable range for correct mass transport correlation as discussed in the text.
Batteries 09 00253 g002
Figure 3. (A) Model setup of the redox-flow battery for mass transport and (B) for the potential and current density distribution. Bipolar plate and membrane are considered pure ohmic resistances while the carbon felt in the NE and PE region is a combination of electronic and ionic resistance connected by the electrochemical reaction as a nonlinear resistance, that is depending on mass transport properties.
Batteries 09 00253 g003
Figure 5. (A) Membrane resistances under open circuit conditions from EIS-evaluation for two cell setups and linear regression of its dependence on averaged SoC. (B) Discharge and charge resistances of the membrane depending on averaged SoC and resulting linear regression lines for charge and discharge resistances.
Batteries 09 00253 g005
Figure 6. (A) Exchange current densities for the NE derived from EIS measurements of two cell setups with different compression rates of the carbon felts. (B) Exchange current densities for the PE derived from EIS measurements of two cell setups with different compression rates of the carbon felts.
Batteries 09 00253 g006
Figure 7. Diffusion coefficients of four vanadium species for different total sulfate concentrations based on several publications [70,71,72,73,74] (data of Lawton et al. is reduced to the published data received only by electron paramagnetic resonance) and interpolated values for 4 M total sulfate concentration based on the marked data sets.
Batteries 09 00253 g007
Figure 8. (A) Sketch of the grid distribution within the electrode with the correct ratio of electrode height to electrode thickness for a compression rate of 9%. (B) Distorted and dimensionless representation of the grid within the electrode to illustrate the non-uniform grid size in the through-plane direction of the electrode.
Batteries 09 00253 g008
Figure 9. (A) Resulting Sherwood correlation coefficients aSh of both experimental setups compared to the values of Kinoshita and Vatistas et al. [29,56]. (B) Sherwood–Reynolds dependencies shown for an exemplary Schmidt number of 20,972 (fully discharged PE). The black lines are the correlations resulting from parameter estimation, whereas the yellow line represents the average of both estimations. To achieve a better comparison between the results from parameter estimation and the results of Schmal et al., Vatistas et al., and Kinoshita et al. their datasets of the experimentally accessible data points are presented instead of the resulting correlation [30].
Batteries 09 00253 g009
Figure 10. (A) Polarization curves for variation of flow rate at low states of charge for the cell setup with a compression rate of 9%. The lines represent modeled data and data points indicate the experimental data. (B) Polarization curves for variation of flow rate at low states of charge for the cell setup with a compression rate of 42%.
Batteries 09 00253 g010
Figure 11. Polarization curves of both cell setups for compression rates of 9% and 42% as a function of SoC. (A) A 9% carbon felt compression rate for low flow rates. (B) A 42% carbon felt compression rate for low flow rates. (C) A 9% carbon felt compression rate for high flow rates. (D) A 42% carbon felt compression rate for high flow rates. Data points represent experimental data, lines indicate data from model validation.
Batteries 09 00253 g011aBatteries 09 00253 g011b
Figure 12. Exemplary overpotentials for the positive and negative half-cell of the cell setup with 42% carbon felt compression rate measured at the membrane electrode interface (mem) and the bipolar plate electrode interface (bpp) under variation of flow rate and SoC. (A) low flow rate and low SoC (B) low flow rate and high SoC (C) high flow rate and low SoC (D) high flow rate and high SoC. Points represent experimental data, whereas lines indicate results from the mathematical model.
Batteries 09 00253 g012aBatteries 09 00253 g012b
Figure 13. Liquid phase potential probe signals at the carbon felt membrane interface for a low state of charge under variation of flow rate for positive and negative half-cell, respectively. (A) Liquid phase potential in the negative half-cell for the cell setup with 9% carbon felt compression rate (B) Liquid phase potential in the negative half-cell for the cell setup with 42% carbon felt compression rate. (C,D) as in (A,B), but for the liquid phase potential in the positive half-cell. Data points represent experimental data, lines indicate data from model validation.
Batteries 09 00253 g013
Table 3. Indices and reaction orders used in the model.
Index/OrderEquation
Reaction r = NE , PE (13)
Vanadium species i = V 2 + ,   V 3 + , V 4 + , V 5 + 1 ,   2 ,   3 ,   4 (14)
Stoichiometric
coefficient
υ = 1 1 0 0 0 0 1 1 (15)
Anodic reaction
order [25]
υ an = 2 0 0 0 0 0 2 0 (16)
Cathodic reaction
order [25]
υ cat = 0 2 0 0 0 0 0 2 (17)
Table 4. Equations applied in the model for the description of the potential distribution.
Described ProcessEquation
Potential gradient in solid phase d φ S , r d x = ρ S · j S , r (18)
Potential gradient in liquid phase d φ L , r d x = ρ L , r · j L , r (19)
Specific electrical resistance of the electrolyte ρ L , r = 1 κ el , r · ε 1.5 (20)
Table 5. Equations applied in the model for the description of the current density distribution.
Described ProcessEquation
Gradient of current density in solid phase d j S , r d x = a · i r (21)
Gradient of current density in liquid phase d j L , r d x = a · i r (22)
Transfer current density i r = i 0 , r · exp α an , r F R T η r exp α cat , r F R T η r (23)
Overpotential η r = φ S , r φ L , r E eq , r (24)
Equilibrium potential E eq , r = E ref , r + R T F ln i = 1 4 c surf , r , i ν r , i (25)
Exchange current density i 0 , r = F k 0 , r c ref i = 1 4 c surf , r , i c ref υ an , r , i · α cat , r c surf , r , i c ref υ cat , r , i · α an , r (26)
Table 6. Equations applied in the model for the description of the mass transport.
Described ProcessEquation
Mass transport equation 0 = u r · d c bulk , r , i d y + a F i r · ν r , i (27)
Inner mass transport c surf , r , i = c bulk , r , i + δ · i r D i · F ν r , i (28)
Sherwood correlation S h i , r = a Sh R e b Sh S c i , r c Sh (29)
Reynolds number R e r = u r · ρ el · d f μ el , r (30)
Schmidt number S c i , r = μ el , r D i · ρ el (31)
Diffusion layer thickness δ i , r = d f S h i , r (32)
Table 7. Auxiliary equations for the characterization of the carbon felt electrode and the description of the electrolyte.
DescriptionEquation
Specific surface area of the electrode a = 4 d f 1 ε (33)
Porosity of the electrode ε = 1 w t · ρ carbon (34)
Compression rate of the electrode C R = 1 t t 0 (35)
State of charge of positive and negative electrolyte S o C NE = c in , 1 c in , 1 + c in , 2
S o C PE = c in , 4 c in , 3 + c in , 4
(36)
Electrolyte viscosity μ el , r = μ offset , r + μ slope , r · S o C r (37)
Electrolyte conductivity κ el , r = κ offset , r + κ slope , r · S o C r (38)
Table 8. Boundary conditions for the negative electrode.
DescriptionEquation
Current density distributed over the height of the cell j = j S , NE x = 0 , y (39)
Current density applied to the cell j eff = 1 H 0 H j y d y (40)
Liquid phase current density at the bipolar plate interface of the NE j L , NE x = 0 , y = 0
for 0 < y < H
(41)
Solid phase current density at the membrane interface of the NE j S , NE x = t , y = 0
for 0 < y < H
(42)
Solid phase potential at the bipolar plate interface of the NE φ S , NE x = 0 , y = 0 r b p p , N E · j y
for 0 < y < H
(43)
No mass transport through the bipolar plate of the NE d c bulk ,   NE , i x = 0 , y d x = 0
for 0 < y < H
(44)
No mass transport through the membrane from the NE d c bulk , NE , i x = t , y d x = 0
for 0 < y < H
(45)
Inlet concentration for the NE c bulk , NE , i x , y = 0 = c NE , in , i
for 0 < x < t
(46)
Table 9. Boundary conditions for the positive electrode.
DescriptionEquation
Liquid phase potential at the membrane interface of the PE φ L , PE x = 0 , y = φ L , NE x = t , y r mem · j y
for 0 < y < H
(47)
Solid phase current density at the membrane interface of the PE j S , PE x = 0 , y = 0
for 0 < y < H
(48)
Solid phase current density at the bipolar plate interface of the PE j S , PE x = t , y = j y
for 0 < y < H
(49)
Liquid phase current density at the membrane interface of the PE j L , PE x = 0 , y = j y
for 0 < y < H
(50)
No mass transport through the bipolar plate of the PE d c bulk , PE , i x = 0 , y d x = 0
for 0 < y < H
(51)
No mass transport through the membrane from the PE d c bulk , PE , i x = 0 , y d x = 0
for 0 < y < H
(52)
Total cell voltage U = φ S , PE x = t , y r b p p , P E · j y
(53)
Inlet concentration for the PE c bulk , PE , i x , y = 0 = c PE , in , i
for 0 < x < t
(54)
Table 10. Reaction rate constants (k0,NE, k0,PE) derived from the evaluation of electrochemical impedance spectroscopy under open circuit conditions, carbon felt resistance from ex-situ measurements (ρS), bipolar plate resistance from evaluation of solid phase potential probe signals (rbpp) and calculated porosity of the carbon felt under compression (ε).
k0,NEk0,PEρSrbppε
m·s−1m·s−1Ω·mΩ·m2%
9% compression rate3.0·10−71.6·10−62.2·10−30.9·10−594.4
42% compression rate8.3·10−75.3·10−61.9·10−30.65·10−591.2
Table 11. Diffusion coefficients and exemplary Schmidt numbers for electrolytes containing only one vanadium species.
Vanadium SpeciesDiffusion CoefficientSchmidt Number
m2·s−1Dimensionless
V2+2.3·10−1013,398
V3+0.6·10−1074,198
VO2+1.6·10−1020,972
VO2+1.6·10−1017,454
Disclaimer/Publisher’s Note: The statements, opinions and data contained in all publications are solely those of the individual author(s) and contributor(s) and not of MDPI and/or the editor(s). MDPI and/or the editor(s) disclaim responsibility for any injury to people or property resulting from any ideas, methods, instructions or products referred to in the content.

