Abstract
Because of the unique crystal framework, bronze TiO2 (or TiO2(B)) is considered the prospective choice for high-performance lithium-ion battery anodes. Nevertheless, TiO2(B) requires efficient modification, e.g., suitable doping with other elements, to improve the electronic properties and enhance the stability upon insertion/extraction of guest ions. However, due to the metastability of TiO2(B), doping is challenging. Herein, for the first time, TiO2(B) co-doped with Mn, F, and N were synthesized through a successive method based on a hydrothermal technique. The prepared doped TiO2(B) consists of ultrathin nanotubes (outer diameter of 10 nm, wall thickness of 2–3 nm) and exhibits a highly porous structure (pore volume of up to 1 cm3 g−1) with a large specific surface area near 200 m2 g−1. The incorporation of Mn, F, and N into TiO2(B) expands its crystal lattice and modifies its electronic structure. The band gap of TiO2(B) narrows from 3.14 to 2.18 eV upon Mn- and N-doping and electronic conductivity improves more than 40 times. Doping with fluorine improves the thermal stability of TiO2(B) and prevents its temperature-induced transformation into anatase. It was found that the diffusivity of Li is about two times faster in doped TiO2(B). These properties make Mn, F, and N co-doped TiO2(B) nanotubes promising for application as high-performance anodes in advanced lithium-ion batteries. In particular, it possesses a good reversible capacity (231.5 mAh g−1 after 100 cycles at 70 mA g−1) and prominent rate capability (134 mAh g−1 at 1500 mA g−1) in the half-cell configuration. The (Mn, F, N)-doped TiO2(B) possesses a remarkable low-temperature Li storage performance, keeping 70% of capacity at −20 °C and demonstrating potentialities to be employed in full-cell configuration with LiMn2O4 cathode delivering a reversible capacity of 123 and 79 mAh g−1 at 35 and 1500 mA g−1, respectively, at a voltage of ~2.5 V. This research underlies that regulation of electronic and crystal structure is desired to uncover capabilities of nanoparticulate TiO2(B) for electrochemical energy storage and conversion.
1. Introduction
Titanium dioxide is characterized by unique physical and chemical properties along with non-toxicity, abundance, environmental benignity, and economical production. TiO2, first mass-produced a century ago, is considered to be an important substance for preparing materials with valuable qualities to use in diversified areas of industry. Because of its whiteness and brightness, TiO2 is allowed as a pigment and gloss agent for paints, cosmetics, hygienic products, foods, papers, plastics, pharmaceuticals, etc. [1,2]. Due to resistance to ultraviolet radiation, titanium dioxide is applied as a UV filtering ingredient in sunscreens protecting against the sun’s light that may affect a person’s skin [3,4]. Discovering the photoassisted electrolysis of water by TiO2 resulted in its applications for the decontamination of aqueous media via the degradation of organic wastes into harmless substances and hydrogen generation through water splitting [5,6]. Over the past decades, TiO2 has been intensively studied to be used in a range of innovative technologies, including gas sensors [7,8], biomedical applications [9,10], superhydrophilic surfaces [11,12], memory devices [13,14], solar cells [15,16], dilute magnetic semiconductors [17,18], and metal-ion batteries [19,20].
TiO2 has thirteen polymorphic forms: rutile (tetragonal, P42/mnm), anatase (tetragonal, I41/amd), brookite (orthorhombic, Pbca), bronze-type TiO2(B) (monoclinic, C2/m), columbite-like TiO2(II) (orthorhombic, Pbcn), hollandite-structured TiO2(H) (tetragonal, I4/m), ramsdellite-type TiO2(R) (orthorhombic, Pbnm), TiO2(OI) (orthorhombic, Pbca), cotunnite-like TiO2(OII) (orthorhombic, Pnma), baddeleyite-like TiO2(MI) (monoclinic, P21/c), fluorite- (cubic, Fmm) and pyrite-structured (cubic, Pa) phases, tridymite-type TiO2 (hexagonal, P63/mmc) [21,22,23,24]. Nevertheless, at atmospheric pressure, titanium dioxide can exist just in the first four crystalline polymorphs, whereas other ones are high-pressure structures. Among these four phases, bronze TiO2 is of most interest to the battery’s application because of its structural singularities, such as reduced crystallographic density and open-framework structure with channels in both b and c directions providing intercalation sites and facilitating diffusion paths (so-called pseudocapacitive (de-)insertion behavior) [25,26,27]. The redox chemistry of TiO2(B) in lithium-ion batteries is based on a (de-)intercalation mechanism and driven by a Ti4+/Ti3+ couple operating at ~1.5 V [28]. When used as anode-active material the elevated operating potential of TiO2(B) decreases the energy density of the battery as opposed to that based on conventional graphite (~0.1 V vs. Li/Li+ [29]). In contrast, carbonate-based electrolytes almost do not decompose at the TiO2(B) surface (because its potential lies within their electrochemical window [29,30]), which is critical for high-performance materials offering high current densities. In contrast to Li4Ti5O12 (~1.55 V vs. Li/Li+), studied for the same reasons, TiO2(B) has almost twice higher the lithium storage capacity of 335 mAh g−1 [31]. Other materials based on conversion and (de-)alloying reactions offering higher energy densities suffer from dramatic volume changes upon (de-)lithiation (e.g., about 150, 300, and 400% for Sb, Sn, and Si) and/or irreversibility (chemistry of conversion-type materials is changed during initial lithiation), which limits their cyclic performance [32,33]. On the contrary, the volume expansion of lithiated TiO2 did not exceed 4% which is even less than for graphitic materials (9–13%) [34,35]. Unfortunately, TiO2(B) which is an n-type semiconductor with a wide band gap of 3.09–3.23 eV [36,37] possesses poor conductive properties.
The conductivity of TiO2(B) can be adjusted by doping with appropriate ions or atoms. Additionally, doping can expand the crystal lattice of TiO2(B) reducing the volume changes upon (de)insertion of lithium ions. However, due to its metastable nature and low thermodynamically stable temperature, TiO2(B) doping is challenging and accompanied by the formation of other phases (most often anatase) as undesirable by-products. For the same reason (transition of bronze phase to anatase occurs at temperatures below 500 °C), it is impossible to address the TiO2(B) conductivity issues through the construction of carbon-coated composite structures (carbonization takes place at high temperatures around 700–900 °C) that is most often used strategy for electrode materials. The reported dopants, which show a more or less favorable effect on the electrical conductivity and, hence, the performance of TiO2(B) in lithium-ion batteries (LIBs), including Fe [38], Ca [39], Cu [40], Ni [41], V [42], Co/V [43], P [44], N [45], N/B [46], Nb [47], C [48,49], and Na [50].
Besides the aforementioned, it is well recognized that the conductive properties demonstrate the particle size-dependent behavior, hence, the control of morphology is strongly required to obtain the high-performance TiO2(B) intercalation host for LIBs. Hydro(solvo)thermal synthesis is a suitable method to prepare the nanocrystalline TiO2(B), which allows modifying (doping or hybridization) it at a time via a one-step process [51,52,53].
Within the present study we have fabricated, for the first time, TiO2(B) co-doped with Mn, F, and N having nanotubular morphology via a one-stage hydrothermal method. The synergistic effect of Mn, F, and N doping increases the electronic conductivity and expands the crystal lattice of TiO2(B). When tested as an anode for lithium-ion batteries, co-doped TiO2(B) exhibit enhanced electrochemical performance with both improved cyclability and rate capability.
2. Materials and Methods
2.1. Materials Synthesis
Mn, F, and N co-doped titanium dioxide structures were prepared by a successive method involving hydrothermal treatment of precursors, cation exchange process, and calcination. In a typical procedure, 0.4 g anatase with an average particle size of 15 nm (99.7%; Alfa Aesar, Ward Hill, MA, USA), manganese(II) nitrate hexahydrate (Mn(NO3)2·6H2O, >99%; Unichim, St. Petersburg, Russia) and ammonium hydrogen fluoride (NH4HF2, >98%, Unichim, Russia) in certain amounts were stirred together with 40 mL 14 M aqueous solution of sodium hydroxide (NaOH, >99%, Ekos-1, Moscow, Russia) and transferred into the 50 mL polytetrafluoroethylene autoclave. The reaction was carried out for 48 h at 160 °C. After cooling at room temperature, the precipitate (based on sodium titanate(s)) was separated using an Eppendorf 5804R centrifuge. Then, the product was rinsed in 0.05 M HNO3 solution for a few days to rid of the Na+ ions through a cation-exchange reaction. At last, the obtained Mn-, F-, and N-containing protonated titanate (single or polyphase) was washed in deionized water until the neutral pH, dried, and heat treated at 350 °C for 3 h. To examine the doping degree effect, manganese was added in the following concentrations: 2 at.% (TO-Mn/F/N-02), 4 at.% (TO-Mn/F/N-04), and 6 at.% (TO-Mn/F/N-06); where TO is a short-term representation of TiO2. The fluorinating/nitriding agent was added in excess amounts at a Mn to F ratio of 1 to 3. Undoped titanium dioxide was synthesized via the same procedure but without Mn(NO3)2·6H2O and NH4HF2.
2.2. Characterization
The morphology and composition of materials were observed by scanning electron microscopy (SEM) on a Thermofisher Helios 450S, high-resolution transmission (HRTEM) and scanning transmission electron microscopy (STEM), and selected area electron diffraction (SAED) on a Thermofisher Titan 60–300 coupled with energy-dispersive X-ray spectroscopy (EDX) attachment. Electron energy loss spectroscopy (EELS) measurements were done using Gatan Quantum 965. Low-temperature (77 K) nitrogen adsorption–desorption experiments were carried out using a Quantachrome Autosorb iQ analyzer to estimate the porosity and specific surface area of samples (using the non-local density functional theory (NLDFT)). The chemical state of elements was investigated by X-ray photoelectron spectroscopy (XPS) using a monochromatic MgKα (hν = 1253.6 eV) X-ray source on a SPECS spectrometer equipped with a Phobios-150 hemispherical energy analyzer. The binding energies were determined by referencing XPS data to the C 1s emission of ubiquitous carbon contaminations at 285 eV. To analyze the phase composition of materials and changes in the crystalline structure of phases, the X-ray powder diffraction studies (XRD, Rigaku SmartLab) were performed using CuKα (λ = 1.5418 Å). Measurements were conducted in the Bragg-Brentano geometry (θ/2θ mode) with 2θ step of 0.01°. Diffrac EVA software (ver. 6) from Bruker (Billerica, MA, USA) and PDF2 database (2015) were applied for phase identification. To calculate lattice parameters the Rietveld method (in a 2θ range of 7–83°) was applied. For the refinement of structures, the JANA2006 program [54] was used. The optical properties and changes in the electronic structure of materials were studied using a Shimadzu UV2600 UV-vis spectrophotometer between the wavelengths of 200 and 800 nm. BaSO4 was applied as a reflectance standard. To detect and identify the paramagnetic species in materials electron paramagnetic resonance (EPR) studies were conducted on a JEOL JES-X330 spectrometer in the X- and Q-band regions using 2.0 mW microwave power and 100 kHz modulation frequency. The integral intensities and g-factors of the EPR lines were calibrated, respectively, by the integral intensity and the value g = 2.002293 ± 0.000003 of the conduction electron spin resonance signal of Li nanoparticles in the reference LiF:Li sample. The conductivity was investigated using a measuring complex from Solartron consisting of SI 1260 impedance/gain-phase analyzer and a 1296 dielectric interface. Measurements were carried out in a frequency range of 1 Hz–20 MHz with an AC amplitude of 0.4 V. Fitting of impedance spectra was performed using an equivalent electrical circuit (EEC) approach with Zview software (ver. 3.5 g) from Scribner Associates (Southern Pines, NC, USA).
2.3. Electrochemical Measurements
The electrochemical performance of samples was examined using two-electrode El-Cell ECC-STD laboratory cells and CR2025 coin-type cases in both half-cell and full-cell configuration with metallic lithium or LiMn2O4 (Sigma-Aldrich, St. Louis, MO, USA), respectively, as a counter/reference electrode. For cell assembly, an argon-filled dried (O2, H2O < 1 ppm) glove box from Vilitek (Moscow, Russia) was used. The electrode was fabricated by the Doctor Blade method spreading a slurry composed of 87 wt.% TiO2(B) or LiMn2O4 as an active material and 13 wt.% Tuball Bat NMP (0.4%; OCSiAl, Russia) as a conductive/binder agent in 1-Methyl-2-pyrrolidinone on a copper or aluminium foil. After drying the electrode was pressed at 800 kg cm−2 and treated under vacuum at 110 °C for 12 h. The electrode mass loading in the range of 2–4 mg cm−2 was achieved. The mass of anode to cathode in TiO2(B)/LiMn2O4 full-cell was balanced at a ratio of 1:1.5. The electrolyte was a 1 M LiPF6 solution in a mixture (1:1 by volume) of ethylene carbonate and dimethyl carbonate (Merck, Rahway, NJ, USA) for experiments under ambient conditions or 1 M solution of LiClO4 in the mixture (84:16, vol. ratio) of propylene carbonate and 1,2-dimethoxyethane (Ekotekh, Chernogolovka, Russia) for low-temperature tests. Celgard 2325 microporous triple-layer membrane was used as a separator. Electrochemical characterization was carried out using a Solartron 1400 system within the potential range of 1–3 V (TiO2(B)) or 3–4.5 V (LiMn2O4) in the half-cell configuration and 2.1–2.9 V in the full-cell assembly. Cyclic voltammograms (CV) were registered at a potential scan rate of 0.1 mV s−1. Charge/discharge tests were conducted in a galvanostatic mode at different current densities. In the case of half-cell assembly, during the discussions, the charge designates a lithiation process, while the discharge implies delithiation. Electrochemical impedance spectra (EIS) were collected with an AC amplitude of 10 mV over the frequency range of 1 MHz to 0.1 Hz. At least four cells were applied for each test.
3. Results and Discussion
Due to the same synthesis conditions, the morphology of all obtained materials is similar. Figure 1(a,a*) depict the SEM micrographs of TO-Mn/F/N-04 as an example. For other samples, these data are presented in the Supplementary Materials in Figure S1. From SEM-imaging the prepared products possess a multimodal dispersion and uniformity of particle size distribution which are valuable parameters for functional materials, including electrodes for batteries. They consist of one-dimensional (1D) elongated cylindrical nanoobjects. Under deeper insight using STEM-mode (Figure 1b), it can be seen that these objects are nanotubes. The diameter of tubes is around 10 nm and the length could be up to several hundred nanometers. The nanotube’s wall thickness was measured as 2–3 nm. In general, hollow nanostructures provide benefits for the transfer of charge carriers or transportation of substances, e.g., drugs.
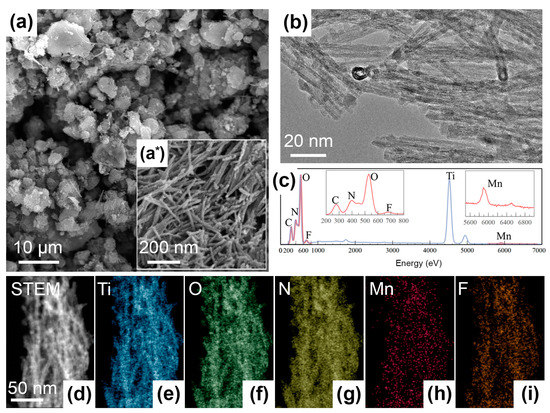
Figure 1.
Morphology and elemental analysis for Mn, F, N co-doped TiO2: (a,a*) SEM- and (b) STEM-images of the TO-Mn/F/N-04 sample, (c) EDX-spectrum and (d–i) elemental mapping for the TO-Mn/F/N-02.
Figure 1c depicts the EDX-spectrum for the TO-Mn/F/N-02 sample and chemical composition mapping is shown in Figure 1d–i. The EDX analysis results are evidencing the presence of Ti, O, Mn, F, and N and their homogeneous distribution across the bunch of nanotubes. The corresponding Mn to Ti atomic ratio can be determined as 0.016.
HRTEM imaging and SAED experiments confirmed the TiO2(B) structure in the examined samples. Figure 2a shows a bunch of nanotubes where different lattice spacings could be resolved. Most of them are in good agreement with theoretical ones for TiO2(B) and it is shown in more detail in Figure S2. The electron diffraction pattern for this area (Figure 2b) reveals a number of reflections which could be associated with the TiO2(B) phase. However, some observed spacings may also belong to the anatase phase (marked with *). To clarify this point, we have found a well-oriented nanocrystal (Figure 2c). This nanocrystal’s structure can be uniquely determined as a monoclinic TiO2(B) phase (PDF No. 46-1238) because it has a specific period d001 = 0.62 nm. Figure 2d shows a Fourier transform of image Figure 2c.
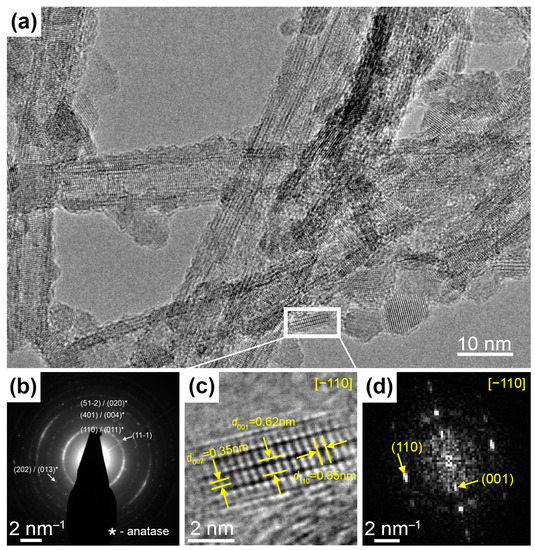
Figure 2.
(a) HRTEM-image of several TiO2 nanotubes. (b) The electron diffraction pattern identifying bronze titania. (c) The magnified region of HRTEM-image shows the nanocrystal oriented in [−110] zone axis and (d) the corresponding Fast Fourier Transform image.
For advanced phase analysis of the materials, the Ti L2,3 edges EELS spectra were studied, as shown in Figure S3 for the TO-Mn/F/N-04 sample as an example. The data clearly identify reflections of the bronze TiO2 phase [55] in the Ti edge EELS.
In order to evaluate the texture of the studied materials, N2 adsorption–desorption tests were carried out. It is established that the type IV isotherms with H3 hysteresis loops (Figure 3) are observed for all prepared products, indicating their porous structure.
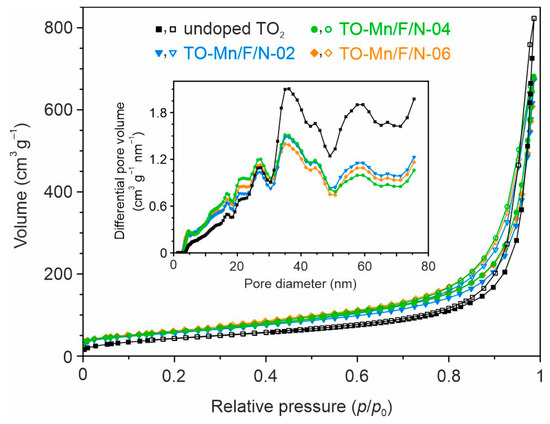
Figure 3.
Nitrogen adsorption–desorption isotherms and pore size distribution curves (inset) for the undoped and Mn, F, N co-doped TiO2 structures (the filled and open symbols represent, respectively, the adsorption and desorption data).
The pore size distribution curves (Figure 3, inset) show a wide range of pore sizes with maximums near 35–36 nm. From the NLDFT calculations, the total pore volume for materials can be regarded as 0.87–0.99 cm3 g−1, as listed in Table S1. The specific surface area estimation by NLDFT presents that (Mn, F, N)-doped samples exhibit larger values as compared to undoped ones (Table S1). Indeed, this parameter is 145.6 m2 g−1 for undoped TO2, whereas TO-Mn/F/N-02, TO-Mn/F/N-04, and TO-Mn/F/N-06 samples exhibited 197.7, 188.9, and 203.0 m2 g−1, respectively. The observed phenomenon agrees with that from the literature [56,57] and suggests that dopants have an inhibiting effect on the growth of TiO2 crystallites. It should be pointed out that an increase in the concentration of dopants insignificantly influenced texture.
Next, XPS studies were performed to identify the chemical composition of (Mn, F, N)-doped TiO2 (TO-Mn/F/N-06 product). As can be seen in Figure 4a, there are distinguishable peaks for titanium, oxygen, manganese, and fluorine in the XPS survey spectrum. Besides, carbon in aliphatic and oxidized states was found on the material surface. These results agree with the EDX findings.
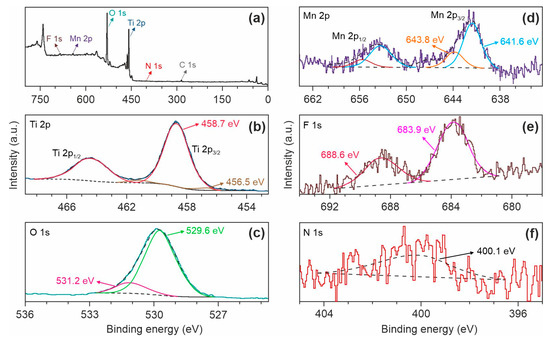
Figure 4.
(a) XPS survey spectrum and corresponding high-resolution scans of the (b) Ti 2p, (c) O 1s, (d) Mn 2p, (e) F 1s, and (f) N 1s peaks for the TO-Mn/F/N-06 sample.
Figure 4b shows the Ti 2p core level that is split into a doublet of 2p3/2 and 2p1/2. Two components were identified through deconvolution suggesting several different oxidation states of titanium: dominating Ti4+ at a binding energy (Ti 2p3/2) of 458.7 eV and Ti3+ situated at Eb(Ti 2p3/2) = 456.5 eV. The existence of Ti with a valence of +3 in the TO-Mn/F/N-06 can be explained by an incorporation of F− anions into the TiO2 oxygen sublattice during doping. The deconvolution of O 1s XPS spectrum (Figure 4c) shows the intensive peak centered at 529.6 eV due to O2− in the TiO2 lattice and the contribution at a higher binding energy of 531.2 eV resulted from oxygen forming a double bond with carbon (i.e., amides, esters, and carboxyl moieties) [58,59]. The Mn 2p XPS spectrum (Figure 4d) is split due to spin–orbit coupling into a 2p1/2–2p3/2 doublet. The computation reveals components with binding energies (Mn 2p3/2) of 641.6 eV (manganese in the +3 oxidation state [57]) and 643.8 eV (tetravalent manganese [60]). The F 1s line (Figure 4e) is divided into two peaks. The contribution at 683.9 eV is associated with fluorine anions adsorbed physically on the material surface, whereas the component at 688.6 eV indicates the substitution of F− for O2− in the TiO2 lattice due to which nonstoichiometric solid solution is formed [61,62]. Treatment with a help of ammonium fluorides (NH4F, NH4HF2) is a recognized route for materials fluorination. At the same time, as reported in [45], NH4F or NH4HF2 can serve as a source of nitrogen for preparing F and N co-doped titanium dioxide. The profound insight shows that nitrogen exists in the analyzed sample. Figure 4f demonstrates the N 1s XPS peak located at 400.1 eV. Based on the literature [63,64], it can be concluded that nitrogen occupies an interstitial position in the TiO2 crystal lattice forming NOx species. Table S2 summarizes the positions and relative atomic percentages for the interpreted components.
In the XRD patterns of undoped and Mn, F, N co-doped TiO2 (Figure 5) a broadening of peaks is observed suggesting crystallites with nanoscopic dimensions. All considered samples contained two phases of titanium dioxide. Most of the reflections refer to the bronze titanium dioxide having a monoclinic structure with a C2/m space group (PDF No. 46-1238), whereas other ones belong to the anatase modification (PDF No. 73-1764).
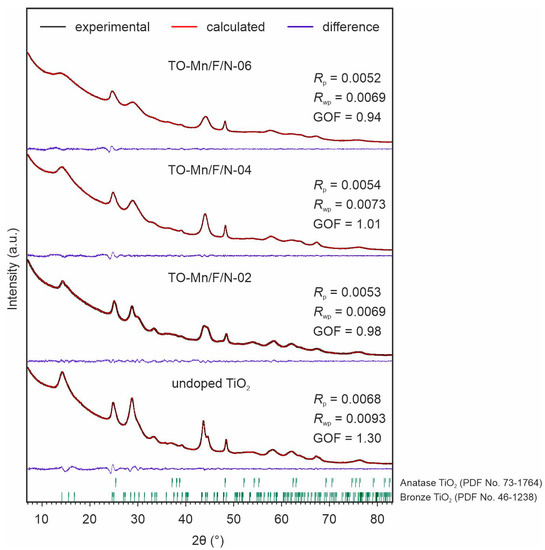
Figure 5.
XRD patterns and Rietveld refinement results for the unmodified TiO2, TO-Mn/F/N-02, TO-Mn/F/N-04, and TO-Mn/F/N-06 samples.
The bronze TiO2 is a metastable phase and under heat treatment can be easily converted to anatase [65]. The temperature of TiO2(B) to anatase phase transformation depends on several factors [66,67,68,69], including shape and dimensions of particles, and porosity, which are determined by the methodology of synthetic procedure (e.g., pressure, temperature, and process duration, pH of the medium, etc. in case of hydro- or solvothermal method). Herein, it was found that the synthesis of manganese-containing TiO2 in absence of ammonium hydrofluoride leads to the predominance of anatase in the composition of products (Figure S4). It is known that the phase transformations in titanium dioxide can be promoted/inhibited by the incorporation of impurities changing the diffusion mobility of ions in the lattice. E.g., as reported in [70] doping with 1, 5, and 10 at.% manganese decreases the temperature of anatase to rutile transition by 50, 100, and 200 °C, respectively. Similar data are presented in [71,72,73] indicating the promotion effect of Mn on phase transition kinetics. The phase transformation is a result of a substitution of Ti4+ ions within the TiO2(B) lattice by Mn species with a smaller oxidation state, i.e., Mn3+ ions, as found by XPS (Figure 4d). Indeed, in such a scenario, in order to maintain charge neutrality, the doubly positively charged oxygen vacancies (so-called F2+-centers) would be formed in the crystal structure (Equation (1), hereinafter Kröger-Vink notation is used), allowing the TiO2(B) to anatase phase transition at lower temperatures.
here the defect equilibria are achieved because of doubly positively charged oxygen vacancy compensate two (Mn replacing Ti in its lattice site) defects with a single negative charge.
At the same time, as known doping the oxygen-deficient structures with fluorine frequently occurs through the annihilation of vacancies in the anionic sublattice (Equation (2)) [74]. The annihilation of such type of defects in the titanium dioxide is accompanied by changing the oxidation state of titanium (and/or manganese in our case) in the cation sublattice [75].
Besides the abovementioned, or in the case of elimination (completely “healing”) of oxygen vacancies, another outcome is possible: substitution of lattice O2− ions by F− species with a compensative (according to the electroneutrality principle) formation of Ti3+ defect states [74,75].
Concerning anatase both these mechanisms stabilize it, inhibiting transformation into rutile induced by the thermal treatment [75]. As seems, these effects may inhibit TiO2(B)→anatase phase transition in the case of Mn-, F-, and N-containing samples studied in this work.
Lastly, as it was found in [76], the modification of titanium dioxide by fluorine through a way that is not associated with its incorporation in the crystal lattice, namely if F− ions are physically adsorbed at the surface, also influences thermal stability of anatase and dynamics of its transformation into rutile.
Riveted refinement data (Table S3) indicates the changes in lattice constants of both TiO2(B) and anatase phases when co-doped with (Mn, F, N). The calculated values of corresponding unit cell volumes demonstrate an increase of up to ~1.5% for modified samples as compared to the undoped ones. When in an octahedral environment, the ionic radius of Mn4+ (0.58 Å) is lesser than that of Ti4+ (0.605 Å). The radius of six-fold coordinated Mn3+ ion in the high-spin and low-spin states equals 0.645 or 0.58 Å, respectively. Because oxygen is a weak field ligand, the high-spin state can be predicted for trivalent manganese. The fluoride ion (1.3 Å) in a three-fold octahedral coordination geometry is smaller by 4.6% than the oxygen anion (1.36 Å). However, as mentioned above, fluorine incorporation into the TiO2 lattice results in the appearance of Ti3+ with an ionic radius of 0.67 Å (coordination number–6). The interstitial doping mechanism suggests a formation of NOx or NHx species at the interstitial sites within the TiO2 lattice [75,77], which could cause its expansion. As opposed to substitutional nitrogen-doping (replacement of O2− by N3− anions with a formation of vacancy-type defects in the oxygen sublattice), the interstitial type may be preferable in terms of stability of crystal framework due to slowing down of the temperature-induced dynamics of lattice and its evolution across the transition [75]. Thus, the observed distortions of TiO2(B) and anatase crystal lattices can be explained by a combination of factors, including the incorporation of Mn3+/Mn4+ cations into the Ti4+ positions, F− anions into the sites of oxygen vacancies or/and lattice O2−, and nitrogen species into interstitials. On top of everything else, it should be pointed out that no other phases were detected in the XRD patterns of samples containing 2 at.% (TO-Mn/F/N-02) and 4 at.% (TO-Mn/F/N-04) manganese, confirming the successful dissolution of Mn3+/Mn4+ ions in the titanium dioxide structure with a formation of substitutional solid solutions. Traces of MnO2 were found in the TO-Mn/F/N-06 sample.
Figure 6a represents the UV-vis diffuse reflectance spectra of analyzed materials. It can be clearly seen that as compared to the undoped TiO2 the modified products absorb electromagnetic irradiation more intensively in both ultraviolet and visible regions. Besides, it is obvious that TO-Mn/F/N-02, TO-Mn/F/N-04, and TO-Mn/F/N-06 have an identical mechanism of optical activity. The improvement of light absorption properties correlates with a concentration of dopants. Furthermore, an analysis shows that (Mn, F, N) co-doping in titanium dioxide shifts the absorption edge to higher wavelengths (so-called redshift effect) indicating modification of the electronic band structure. Applying Kubelka–Munk theory (putting instead of ) to the Tauc relation (Equation (3)) for allowed indirect transitions (), the (F(R∞)·)1/2 against dependences were further plotted (Figure 6b). The band gaps of analyzed products can be identified by points of intersection of the tangent lines and the horizontal axis, as shown in these graphs. Table S1 lists the band gaps of analyzed materials obtained by this technique. The for undoped TiO2 has been estimated as 3.14 eV which is consistent with the literature data on bronze titanium dioxide [36,37]. At the same time, co-doping TiO2 decreases the band gap energy to 2.93, 2.69, and 2.18 eV with an increase in the Mn, F, and N content. It should be pointed out that doping degree has an influence on the color of products (inset in Figure 6b), which changes from white (undoped TiO2) to light grey (TO-Mn/F/N-02), grey (TO-Mn/F/N-04), and grey-brown (TO-Mn/F/N-06).
where is the absorption coefficient, is the photon’s energy, is the Kubelka–Munk function, is the reflectivity, is the constant called the band tailing parameter.
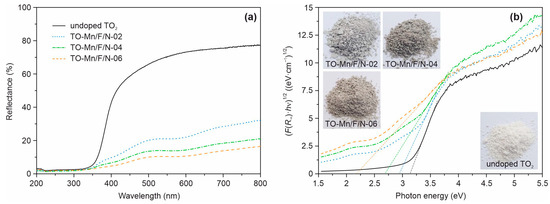
Figure 6.
(a) UV-Vis diffuse reflectance spectra and (b) corresponding (F(R∞)·hν)1/2 vs. hν plots of unmodified TiO2, TO-Mn/F/N-02, TO-Mn/F/N-04, and TO-Mn/F/N-06 samples. The insets show photos of the analyzed powder products.
The observed effects can be explained by the appearing impurity and defect energy levels between valence and conduction bands of titanium dioxide. Indeed, manganese depending on the oxidation state can tend to generate localized electronic levels with different positions (energies) closer to the middle of the band gap [78]. In the diffuse reflectance spectra of (Mn, F, N)-containing materials absorption band in the region of 520–650 nm, becoming intense through doping, is assigned to 5T2g ← 2Eg transition in Mn3+ ions with six-fold coordination [79,80]. The absorption band of Mn4+ in an octahedral environment (wavelengths up to 480 nm) lies within the region of the fundamental absorption of TiO2 [81]. The thorough observations allow us to distinguish the shoulder near 420 nm in analyzed UV-Vis spectra. For illustrative purposes, the registered diffuse reflectance spectra are represented as Kubelka–Munk function against wavelength plots, as displayed in Figure S5a. Doping with nitrogen is accompanied by the appearance of N 2p states above the valence band (O 2p): in the case of interstitial N–higher by 0.73 eV [63]. According to [82] in UV-Vis spectra of N-doped titanium dioxide the absorption bands at 400–550 nm are assigned to the nitrogen within the lattice. At the same time in analyzed TiO2(B)-based products this region corresponds also to the bands of Mn4+ ions. The 2p energy level of fluorine lies below O 2p (by 1.19 eV [83]), hence it has no response in the UV-Vis spectra. In contrast, as mentioned above, the incorporation of a fluorine atom into the crystal lattice of titanium dioxide donates one extra (with respect to lattice oxygen or ) electron, which is expected to localize in the 3d orbitals of the Ti atom forming Ti3+ defect states. The energy level related to Ti3+ is located at 0.82 eV below the conduction band [84], i.e., it lies within the band gap of TiO2. To investigate the effect of fluorine and nitrogen on the electronic properties of analyzed materials, (F, N) co-doped titanium dioxide was synthesized and studied by UV-Vis spectroscopy (Figure S5b). As can be seen, narrowed to 3.07 eV due to doping indicating F and/or N participation in tuning the electronic structure of (Mn, F, N) co-doped TiO2(B). It should be noted that in overall the absorption profile of (F, N)-doped titanium dioxide (insert in Figure S5b) agrees with the literature ones for nitrogen-containing products [84,85]. The obtained results did not allow us to declare the predominance effect of nitrogen or fluorine on the electronic properties of studied (F, N) co-doped TiO2(B) and deeper insight is required in further work. Lastly, it should be mentioned that due to appearance of oxygen vacancies caused by charge compensation mechanisms in doped titanium dioxide (TiO2−δ), as discussed ahead, the localized energy states at 0.75–1.18 eV below the conduction band [86,87] would be generated modifying electronic band structure.
To reveal and study the paramagnetic centers existing in the analyzed materials based on TiO2(B) the EPR investigations have been carried out. X-band EPR spectra of the TO-Mn/F/N-04 sample at 24, −80 and −160 °C are presented in Figure 7a. At room temperature, the spectra contain an intense resonance band with the value of g-factor ~2.00, which exhibits a feebly pronounced sextet structure, and two low-intensity resonances with the g-factors being equal to ~5.27 and ~4.32. As the temperature decreases, the intensities of all EPR lines increase, while their characteristic features remain and become more pronounced. The component of the spectrum with g ~2.00, taking into account its sextet structure, can be assigned to paramagnetic manganese ions. As far as Mn3+ centers are not detected by the EPR method down to liquid helium temperatures due to the short spin-lattice relaxation times, it can be attributed to Mn2+ and/or Mn4+ ions. Moreover, the better resolution of the sextet structure in the Q-band (Figure S6a) indicates that it does not represent a superposition of resonances on these ions, but it is a resonance on one of them only. A clue to understanding the nature of the considered component of the spectrum is the average value of the peak-to-peak intervals of the sextet structure. The value of this parameter determined from the spectra measured in the Q-band (Figure S6a) is 8.96 mT. It is typical of the value of hyperfine structure constant of the EPR spectra of compounds containing Mn2+ ions in oxygen octahedra [88,89] and is noticeably larger than the average value of the same parameter for the EPR spectra of Mn4+ ions in the same crystal fields [89,90,91,92]. An acceptable approximation of the experimental Q-band EPR spectrum of the TO-Mn/F/N-04 sample at room temperature is possible by the sum of the spectrum with a sextet structure and the broad line with a Gaussian contour (Figure S6a). The second component of the spectrum can belong to manganese ions located in interstitial (non-lattice) positions. It can also belong to the “islands” of manganese oxide (MnO) on the surfaces and/or in the cavities of tubular TiO2(B) particles. The resonance with g ~4.32 is characteristic of ions with 3d5 configuration in crystal fields with a strong rhombic component [93,94]. Therefore, a low-intensity resonance with this value of g-factor can result from both Mn2+ and Fe3+ ions. However, taking into account its width of ~8.5 mT (Figure S6b), which is significantly below the expected value (~45 mT) for the sextet of Mn2+ ions, it should be considered as a resonance exactly on Fe3+ ions, which, apparently, enter the samples in trace amounts from their precursors. Note that it is also present in the spectrum of undoped TiO2(B) (Figure S6c). To comprehend the origin of another low-intensity resonance with g~5.27, we have calculated the EPR spectra of the Mn4+ ion in a crystal field with strong rhombic distortion (Figure S6d), using the spin Hamiltonian parameters given in Table S4. The theoretical spectrum contains three sextets with g-factors being equal to 1.46, 2.00 and 5.46. For the low-field sextet the g-factor and width (~55 mT) are close to the values of the same parameters of the corresponding component of the experimental spectrum (~52 mT). Consequently, a small part of the manganese ions in the samples is in the +4 oxidation state. It is worth noticing that the EPR spectra of doped products do not contain resonances on electrons localized in oxygen vacancies, as well as resonances on Ti3+ ions. Taking into account the narrowing of the band gap due to co-doping (F, N) (Figure S5b), the above confirms the effect of nitrogen impurity on the electronic properties of TiO2(B).
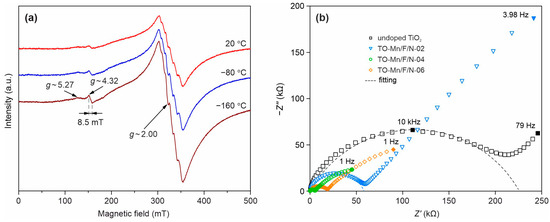
Figure 7.
(a) X-band EPR spectra of (Mn, F, N) co-doped TiO2(B) at different temperatures and (b) Impedance spectra of undoped TiO2, TO-Mn/F/N-02, TO-Mn/F/N-04, and TO-Mn/F/N-06 samples with corresponding fitting curves.
The enhancement in conductive properties due to doping is confirmed by impedance measurements illustrated in Figure 7b.
The registered spectra represented as Nyquist plots have a typical form: a semicircle located in the high-frequency region of the spectrum (from 0.8 kHz–4 MHz to 8 kHz–5 MHz) and a straight line in the rest of the low-frequency range that does not intersect the real impedance axis. Such spectra as a whole demonstrate both the presence of kinetic control and a diffusion-controlled region. The bulk resistance was calculated in a certain frequency range of each sample impedance spectrum (zoom-in view of spectra is shown in Figure S7; calculated EIS parameters are summarized in Table S5) using the EEC displayed in the inset of Figure S7. The applied EEC involves the following elements: Rel including the resistance of lead wires–assuming that both contacts are of identical nature (may include capacitance, inductance)–and appearing when analyzing the impedance of low-resistance materials; Rb and Cg corresponding to the resistance and geometric capacitance of the sample; Rct and Cdl associating with the resistance to charge transfer and capacitance of the electrical double layer, which represent the processes occurring at the electrode/sample interface and related with the redistribution of charge near the interface. The calculated values of conductivity for unmodified TiO2, TO-Mn/F/N-02, TO-Mn/F/N-04, and TO-Mn/F/N-06 samples were as follows: 2.9 × 10⁻⁷, 2.3 × 10⁻⁶, 5.7 × 10⁻⁶, and 4.0 × 10⁻⁶ S cm−1 (Table S1) Hence, in general, there is a clear tendency for the samples to increase the conductive properties due to doping. As can be seen from the data, the maximum decrease in resistance was recorded for TO-Mn/F/N-04 material that has a conductivity of more than 40 times higher in comparison with undoped TiO2.
Figure 8a depicts charge/discharge profiles of the first cycle at a current density of 70 mA g−1 for unmodified and (Mn, F, N) co-doped TiO2 samples in the half-cell configuration.
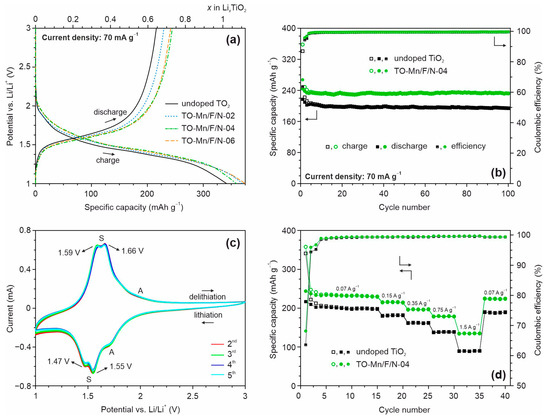
Figure 8.
(a) Charge/discharge profiles of the first cycle and (b) subsequent cycling at 70 mA g−1 for undoped TiO2 and TO-Mn/F/N-04 material, (c) CV curves for TO-Mn/F/N-02 electrode at a scan rate of 0.1 mV s−1, (d) rate capability at different current densities of unmodified and (Mn, F, N) co-doped TiO2 (TO-Mn/F/N-04 sample) in the half-cell configuration.
As can be seen, the curves contain voltage regions with a slope during charging and discharging at the potentials of approximately 1.5 and 1.6 V, respectively, which is typical for TiO2(B), lithiation and delithiation which can be expressed as follows:
where n is the number of electrons transferred in the redox process (n = 1.01 for nanocrystalline TiO2(B) [80]).
Upon initial charge (lithiation of TiO2) the electrodes yield the following specific capacities: 341 mAh g−1 (undoped product), 369 mAh g−1 (TO-Mn/F/N-02), 358 mAh g−1 (TO-Mn/F/N-04), and 374 mAh g−1 (TO-Mn/F/N-06). The obtained values exceed the theoretical capacity of titanium dioxide (335 mAh g−1). This phenomenon has been repeatedly noted in the literature for LIBs anodes based on TiO2 nanomaterials having a large specific surface area. As reported in [95,96], this is due to decomposition reactions of lithium-ion battery electrolyte (at the potentials near 1 V [97,98]) resulting in the formation of a solid electrolyte interphase layer at the electrode surface. The first cycle discharge (delithiation) capacity for undoped TiO2 is equal to 217 mAh g−1 corresponding to the extraction of about 0.65 lithium ion per formula unit. The TO-Mn/F/N-02, TO-Mn/F/N-04, and TO-Mn/F/N-06 electrodes during initial discharge deliver a capacity of 228 mAh g−1 (extraction of around 0.68 Li+), 244 mAh g−1 (0.73 Li+), and 237 mAh g−1 (0.71 Li+), respectively. Among the studied materials, TO-Mn/F/N-04 shows the best efficiency during the first cycle of approximately 68.2%. It should be noted that for modified materials the smaller hysteresis (voltage gap) between charge and discharge voltage profiles is detected. This indicates an improved carrier transport properties due to high specific surface area and porosity, changes in the crystal and electronic structure. Figure 8b shows the varying of capacity during the subsequent cycling for undoped titanium dioxide and (Mn, F, N) co-doped TiO2 (TO-Mn/F/N-04 sample). The data represent that (Mn, F, N)-containing TiO2 maintains a capacity of 231.5 mAh g−1 after 100 charge/discharge cycles with a Coulombic efficiency of 99.6%. This corresponds to the capacity retention of almost 95%. By the way, the major capacity loss occurs during the initial 5–7 cycles. The drop in capacity is calculated as 0.009 mAh g−1 per cycle between 7 and100 cycles for the TO-Mn/F/N-04 electrode. The unmodified titanium dioxide realizes the capacity of 194 mAh g−1 after 100 cycles with the retention of about 90%. The obtained data indicate that doping enhances the lithium insertion/extraction ability of TiO2(B). The cycling performance for TO-Mn/F/N-02 and TO-Mn/F/N-06 electrodes is illustrated in Figure S8a.
Cyclic voltammetry studies in the half-cell assembly were carried out to visualize the mechanism of reduction/oxidation of TiO2 co-doped with manganese, fluorine, and nitrogen. CV curves registered between the 2nd and the 5th cycles at a scan rate of 0.1 mV s−1 for the TO-Mn/F/N-02 are represented in Figure 8c. The voltammograms exhibited peaks near 1.47 and 1.55 V at the cathodic region and around 1.59 and 1.66 V at the anodic branch. These maxima (so-called S-peaks) are characteristic of the lithiation/delithiation of bronze TiO2 [26]. Remarkably, S-peaks possess a high symmetry and starting from the 4th cycle almost overlap with each other representing that this electrochemical reaction is highly reversible. Slight irreversible losses which occur within 2nd and 3rd cycles can be associated with lithium trapped in the material (not extracted) and/or continuing formation (evolution) of the solid electrolyte interphase layer. Besides S-peaks, it is observed a cathodic maximum at around 1.7 V and a weak shoulder in the anodic region near 2 V in the CV curves. These peaks correspond to the reduction/oxidation of anatase (A-peaks) [99]. Besides S-peaks, a cathodic maximum at around 1.7 V and a weak shoulder in the anodic region near 2 V are observed in CV curves which correspond to the reduction/oxidation of anatase (A-peaks). No other redox peaks were observed in the CVs indicating that except Ti4+/Ti3+ no other redox couple is involved.
The rate capability of unmodified and (Mn, F, N) co-doped TiO2 materials were tested in the half-cell configuration by charge/discharge at various current loads of 150, 350, 750, and 1500 mA g−1 for every five cycles (Figure 8d and Figure S7a). Before these tests, the activation at 70 mA g−1 for the initial fifteen cycles was performed. As observed, doping improves the rate performance of bronze titanium dioxide. Indeed, the reversible capacities of about 214, 196, 178, and 134 mAh g−1 were obtained at 150, 350, 750, and 1500 mA g−1, respectively, for the TO-Mn/F/N-04 electrode. Whereas, undoped TiO2 delivered the capacities of 180, 161, 138, and 89 mAh g−1 at the same current densities. Notably, no obvious capacity loss is detected for samples when a current load was returned to 70 mA g−1 after the rate experiments due to the favorable features of the tubular nanostructures. The difference in rate capability of analyzed electrodes can be revealed obviously from the capacity retention against the applied current density plot (Figure S8b). As viewed from these data, the capacity retention of TO-Mn/F/N-04 material is about 57.5% for the discharge between 70 and 1500 mA g−1, while it is only 44.3% for unmodified TiO2. Thus, doping increases the tolerance of TiO2(B) to current loads. As seems it could be due to enhanced conductive properties of doped TiO2(B). Table S6 represents the electrochemical parameters of previously reported LIBs anodes based on doped bronze TiO2 as compared to that for (Mn, F, N)-containing TiO2(B) [38,39,40,41,42,43,44,45,46,47,48]. The results show that nanotubular (Mn, F, N) co-doped TiO2(B) is not inferior to others of the same type.
In order to understand the mechanism of improved electrochemical performances of the co-doped TiO2(B) nanotubes, EIS experiments were carried out in the half-cell configuration for electrodes based on undoped TiO2 and TO-Mn/F/N-04 sample, as shown in Figure 9. The spectra were collected at the potential of 3 V of the first charge (prior cycling). As can be seen from obtained data, the impedance spectra in Nyquist coordinates of both electrodes show depressed paired semicircles at the high and middle frequencies representing information about the solid electrolyte interphase layer and charge transfer process. The low-frequency region of spectra is represented by an arc with a slope exceeding 45°, which characterizes the diffusion-controlled process. The spectra were fitted using an equivalent electrical circuit (inset of Figure 9) composed of the ohmic resistance of cell (Rs), ionic resistance (Rf) and geometrical capacitance (Cf) of the SEI film, charge-transfer resistance (Rct) and double layer capacitance (Cdl), Warburg impedance (ZW) associated with the diffusion of lithium ions. The results of fitting are presented in Table S7. The data indicate that in comparison with TO-Mn/F/N-04 electrode undoped TiO2 has higher Rs and Rct due to the poorer conductivity and the smaller Rf because of lower specific surface area. To understand the effects of TiO2(B) doping on Li+ diffusion kinetics, the low-frequency region of spectra was next analyzed. To determine the lithium diffusion coefficients (DLi) for studied samples the following equation was used:
where R is the gas constant (8.31 J K−1 mol−1); S is the electrode surface area (0.50 cm2); T is the absolute temperature (298.15 K); F is the Faraday constant (96,485.33 C mol−1); CLi is the concentration of lithium in the TiO2(B) (1.39·10−3 mol cm−3); is the Warburg factor (), which can be estimated from the slope of the linear fitting of Z′ vs. ω−1/2 plots (inset of Figure 9).
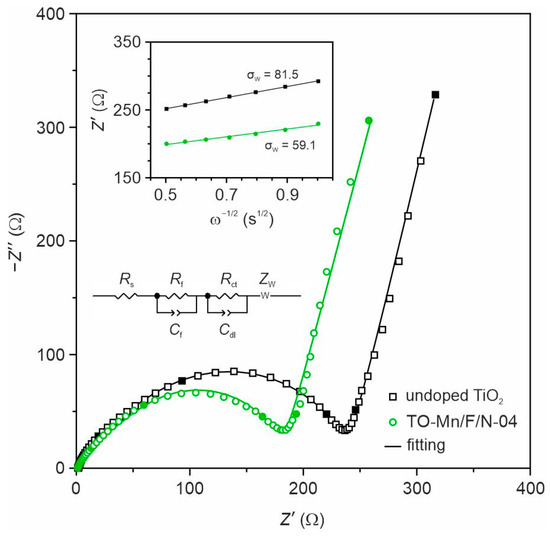
Figure 9.
EIS spectra for undoped TiO2 and TO-Mn/F/N-04 electrodes in the half-cells registered at 3 V (frequencies of 0.1, 1, 10, 100, and 1000 Hz are marked with filled symbols). The insets show EEC applied for fitting and plots of real impedance against the inverse square root of the angular frequency used for estimation of the Warburg factor.
The calculated lithium diffusion coefficients were 1.0 × 10⁻¹¹ and 2.1 × 10⁻¹¹ cm2 s−1 for undoped TiO2 and TO-Mn/F/N-04 electrodes, respectively, which are close to the values reported by other authors [40,100]. It is seen that doping is accompanied by facilitating and fastening the charge carriers’ diffusion, probably, due to structural changes in TiO2(B) lattice. The observed effects can serve as another reason for the improved electrochemical behavior of doped samples.
Because of TiO2-based materials owing capability to use for both high-rate and low-temperature LIBs the performance of Mn, F, N co-doped TiO2(B) was studied at –15 and –20 °C using the 1 M solution of LiClO4 in the mixture of propylene carbonate and 1,2-dimethoxyethane (84:16, vol. ratio) as electrolyte. The measurements were carried out at the current rate of 70 mA g−1 after the pre-cycling at room temperature. Figure 10 represents the charge/discharge profiles registered at different temperature conditions.
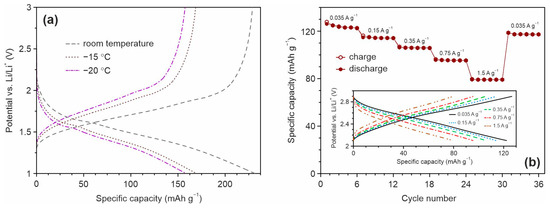
Figure 10.
(a) Charge and discharge profiles for TO-Mn/F/N-04 electrode at room temperature, −15 and −20 °C registered at a current density of 70 mA g−1 in the half-cell configuration and (b) rate capability studies (after pre-cycling CV experiments) of the TiO2(B)/LiMn2O4 full-cell in the range of 2.1 and 2.9 V at various current densities with the corresponding charge/discharge profiles (inset).
The results demonstrate that the material could deliver a reversible capacity of around 169 and 158 mAh g−1 at –15 and −20 °C, respectively, resulting in a retention of about 74 and 69% in comparison with that at room temperature (229 mAh g−1). Thus, these experiments reveal the remarkable steadiness of Mn, F, and N co-doped TiO2(B) nanotubes, even when used under extreme specifications, and additionally demonstrate their feasibility for practical lithium-ion storage.
To further evaluate the practicalities of Mn, F, and N co-doped TiO2(B) nanotubes, full-cell experiments with the LiMn2O4 cathode between 2.1 and 2.9 V were performed. Figure 10b illustrates the variation of the specific capacity of TiO2(B)/LiMn2O4 at different current loads registered after pre-cycling CV tests. It is obvious to note that the rate performance of nanotubular (Mn, F, N)-doped TiO2(B) in the full-cell configuration is attractive. The reversible capacity of about 123, 114, 106, 95, and 79 mAh g−1 was obtained when the current density increased in the range from 35 to 150, 350, 750, and 1500 mA g−1. The corresponding charge/discharge profiles for TiO2(B)/LiMn2O4 cell is shown in the inset in Figure 10b. Importantly, after the high-current charge/discharge cycling capacity of the full cell is returned to 117 mA g−1 indicating the noteworthy recovery ability. It should be noted that LiMn2O4 due to an operating voltage of around 4 V vs. Li/Li+ is not the proper cathode to test the performance of TiO2-based anodes. To make good use of the TiO2(B), LiMn1.5Ni0.5O4 operating at a potential of 4.7 V vs. Li/Li+ or LiFePO4 having a capacity of 160–170 mAh g−1 are recommended to apply [101,102].
4. Conclusions
In summary, a Mn, F, and N co-doping strategy has been developed to enhance the electrochemical performance of TiO2(B) nanotubes for lithium storage. The doping of TiO2(B) was realized via one-step hydrothermal synthesis. The obtained TiO2(B) has a nanotubular morphology and possesses high porosity (total volume of around 1 cm3 g−1) and a large specific surface area (about 200 m2 g−1). It is found that doping with manganese decreases the temperature of TiO2(B) to the anatase phase transition. The importance of co-doping with fluorine is explained by the stabilization of bronze titanium dioxide. The incorporation of dopants causes the crystallographic changes in TiO2(B) accompanied by the increase of its unit cell volume. Through Mn and N co-doping the electronic structure of TiO2(B) is modified and band gap energy reduces from 3.14 to 2.18 eV. This results in an increase of TiO2(B) electronic conductivity by one order of magnitude. Doping of TiO2(B) gives rise to a chemical diffusion coefficient (about two times) facilitating and fastening the Li-ion diffusivity. The synergistic effect of Mn, F, and N doping improves the electrochemical properties of TiO2(B) nanotubes in lithium-ion batteries. In the half-cell configuration, the specific capacity is equal to 231.5 mAh g−1 after 100 charge/discharge cycles at 70 mA g−1 and 134 mAh g−1 can be retained at a current density of 1500 mA g−1. Combining (Mn, F, N) co-doped TiO2(B) with LiMn2O4 in the full-cell configuration a capacity of 123, 114, 106, 95, and 79 mAh g−1 was realized at 35, 150, 350, 750, and 1500 mA g−1 with the average operating voltage of ~2.5 V. The (Mn, F, N)-containing TiO2(B) demonstrates a good low-temperature lithium storage performance with a capacity retention of 70% at −20 °C. This study provides new insight into the doping strategy of TiO2(B). The results demonstrate that (Mn, F, N) co-doping is an effective approach to tune the conductivity, structure, and texture of TiO2(B) nanomaterials as well as to control phase purity in order to design advanced lithium-ion batteries based on high-performance and environmentally benign materials. Furthermore, this doping strategy can also be applied for applications beyond batteries to develop next-generation devices (photocatalysts, sensors, solar cells, magnetics, etc.) based on such materials in the near future.
Supplementary Materials
The following supporting information can be downloaded at: https://www.mdpi.com/article/10.3390/batteries9040229/s1, Figure S1: SEM-micrographs for the undoped TiO2, TO-Mn/F/N-02 and TO-Mn/F/N-06 products; Figure S2: (a) Crystallographic orientation of TiO2(B) crystals determined by HRTEM imaging in the TO-Mn/F/N-04 sample and (b) corresponding Fast Fourier Transform pattern; Figure S3: Experimental EELS spectra of Ti L2,3-edges for the for the TO-Mn/F/N-04 sample and the commercial anatase TiO2 examined for comparison; Figure S4: XRD pattern of product doped with 4 at.% Mn, synthesized without NH4HF2 (Bruker D8Advance diffractometer, CuKα-radiation); Figure S5: (a) UV-vis diffuse reflectance spectra represented as Kubelka-Munk function against wavelength plots for the undoped TiO2, TO-Mn/F/N-02, TO-Mn/F/N-04, and TO-Mn/F/N-06 products and (b) Tauc plot for the (F, N) co-doped TiO2 with the corresponding UV-vis absorption curve (inset); Figure S6: (a) Approximation (1) of the experimental Q-band EPR spectrum of the TO-Mn/F/N-04 sample at room temperature (2) by the sum of the spectrum with a sextet structure (3) and a single line with a Gaussian contour (4), (b) low field region of the X-band EPR spectrum at −160 °C, (c) the X-band EPR spectrum of undoped titanium dioxide, (d) simulated X-band EPR spectra of Mn4+ ions in the crystal fields with strong rhombic distortion; spectra “a” and “b” differ in the width (ΔB) of the hyperfine structure lines (see Table S4); Figure S7: Zoom-in impedance spectra of the undoped TiO2, TO-Mn/F/N-02, TO-Mn/F/N-04, and TO-Mn/F/N-06 materials and the EEC (inset) used for fitting; Figure S8: (a) Evolution of capacity during cycling under various current loads for TO-Mn/F/N-02 and TO-Mn/F/N-06 electrodes, (b) capacity retention at various current densities as compared to that at 70 mA g−1 for undoped TiO2, TO-Mn/F/N-02, TO-Mn/F/N-04, and TO-Mn/F/N-06 materials; Table S1: Specific surface area, total pore volume, band gap energy, and conductivity of TiO2 samples co-doped with Mn, F, N as compared to unmodified one; Table S2: Quantification results obtained by XPS analysis for TO-Mn/F/N-06 sample; Table S3: The Riveted refinement results for structures existed in unmodified and (Mn, F, N) co-doped TiO2 samples; Table S4: Spin-Hamiltonian parameters used to simulate the EPR spectra of Mn4+ ions in crystal fields with strong rhombic distortion; Table S5: Calculated EIS parameters for unmodified and (Mn, F, N) co-doped TiO2 samples; Table S6: Electrochemical performance of the doped TiO2(B) anodes in lithium-ion batteries; Table S7: The fitting results for EIS spectra of electrodes based on undoped TiO2 and TO-Mn/F/N-04 sample and the calculated lithium diffusion coefficient values.
Author Contributions
Conceptualization, D.P.O., S.L.S. and S.V.G.; data curation, D.P.O., S.L.S. and S.V.G.; formal analysis, D.P.O., E.B.M., A.A.S., A.B.P., A.M.Z., A.Y.U. and V.Y.M.; funding acquisition, D.P.O.; investigation, D.P.O., A.A.S., E.B.M., A.B.P., A.M.Z., A.Y.U. and V.Y.M.; methodology, D.P.O., E.B.M., A.A.S., A.B.P., A.M.Z. and A.Y.U.; project administration, D.P.O., S.L.S. and S.V.G.; resources, D.P.O., A.A.S. and S.V.G.; supervision, S.V.G.; validation, D.P.O., A.A.S., S.L.S. and S.V.G.; visualization, D.P.O., E.B.M., A.B.P., A.Y.U., V.Y.M. and A.M.Z.; writing—original draft preparation, D.P.O., E.B.M., A.B.P., A.Y.U., S.L.S. and S.V.G.; writing—review and editing, D.P.O., A.B.P., A.M.Z., S.L.S. and S.V.G. All authors have read and agreed to the published version of the manuscript.
Funding
Financial support from the Russian Science Foundation (grant No. 19-73-10017) is gratefully acknowledged.
Data Availability Statement
The data presented in this study are available on request from the corresponding author.
Acknowledgments
X-ray diffraction studies were carried out in the Core Faculty “Far East Center of Structural Investigations” at the Institute of Chemistry of Far Eastern Branch of the Russian Academy of Sciences (Vladivostok, Russia) with budgetary financing (theme No. FWFN-2022-0004). The authors are grateful to colleagues, namely Valery G. Kuryavyi (collection of SEM data), Denis A. Saritsky (EPR spectra analysis), and A.V. Gerasimenko (Rietveld refinement).
Conflicts of Interest
The authors declare no conflict of interest.
References
- Zhao, J.; Liu, K.; Lin, X. Toxic Effects of the Interaction of Titanium Dioxide Nanoparticles with Chemicals or Physical Factors. Int. J. Nanomed. 2013, 8, 2509–2520. [Google Scholar] [CrossRef] [PubMed]
- Shejale, K.P.; Krishnapriya, R.; Patil, H.; Laishram, D.; Rawal, P.; Sharma, R.K. Recent Advances in Ultra-Low Temperature (Sub-Zero to 100 °C) Synthesis, Mechanism and Applications of Titania (TiO2) Nanoparticles. Mater. Adv. 2021, 2, 7502–7529. [Google Scholar] [CrossRef]
- Jacobs, J.F.; van de Poel, I.; Osseweijer, P. Sunscreens with Titanium Dioxide (TiO2) Nano-Particles: A Societal Experiment. Nanoethics 2010, 4, 103–113. [Google Scholar] [CrossRef] [PubMed]
- Morsella, M.; D’Alessandro, N.; Lanterna, A.E.; Scaiano, J.C. Improving the Sunscreen Properties of TiO2 through an Understanding of Its Catalytic Properties. ACS Omega 2016, 1, 464–469. [Google Scholar] [CrossRef] [PubMed]
- Fujishima, A.; Honda, K. Electrochemical Photolysis of Water at a Semiconductor Electrode. Nature 1972, 238, 37–38. [Google Scholar] [CrossRef]
- Yan, H.; Zhang, D.; Qilu; Duo, X.; Sheng, X. A Review of Spinel Lithium Titanate (Li4Ti5O12) as Electrode Material for Advanced Energy Storage Devices. Ceram. Int. 2021, 47, 5870–5895. [Google Scholar] [CrossRef]
- Mele, G.; Del Sole, R.; Lü, X. Applications of TiO2 in Sensor Devices. In Titanium Dioxide (Tio2) and Its Applications; Elsevier: Amsterdam, The Netherlands, 2021; pp. 527–581. [Google Scholar]
- Bai, J.; Zhou, B. Titanium Dioxide Nanomaterials for Sensor Applications. Chem. Rev. 2014, 114, 10131–10176. [Google Scholar] [CrossRef]
- Yin, Z.F.; Wu, L.; Yang, H.G.; Su, Y.H. Recent Progress in Biomedical Applications of Titanium Dioxide. Phys. Chem. Chem. Phys. 2013, 15, 4844. [Google Scholar] [CrossRef]
- Jafari, S.; Mahyad, B.; Hashemzadeh, H.; Janfaza, S.; Gholikhani, T.; Tayebi, L. Biomedical Applications of TiO2 Nanostructures: Recent Advances. Int. J. Nanomed. 2020, 15, 3447–3470. [Google Scholar] [CrossRef]
- Adachi, T.; Latthe, S.S.; Gosavi, S.W.; Roy, N.; Suzuki, N.; Ikari, H.; Kato, K.; Katsumata, K.; Nakata, K.; Furudate, M.; et al. Photocatalytic, Superhydrophilic, Self-Cleaning TiO2 Coating on Cheap, Light-Weight, Flexible Polycarbonate Substrates. Appl. Surf. Sci. 2018, 458, 917–923. [Google Scholar] [CrossRef]
- Kameya, Y.; Yabe, H. Optical and Superhydrophilic Characteristics of TiO2 Coating with Subwavelength Surface Structure Consisting of Spherical Nanoparticle Aggregates. Coatings 2019, 9, 547. [Google Scholar] [CrossRef]
- Kim, S.K.; Kim, K.M.; Jeong, D.S.; Jeon, W.; Yoon, K.J.; Hwang, C.S. Titanium Dioxide Thin Films for Next-Generation Memory Devices. J. Mater. Res. 2013, 28, 313–325. [Google Scholar] [CrossRef]
- Kim, B.; Kang, T.; Song, S.; Jung, C.; Lee, J.; Cheon, S.; Jeon, H. The Effect of O2 Plasma Post-Treatment on Atomic Layer Deposited TiO2 Thin Films. Vacuum 2022, 199, 110957. [Google Scholar] [CrossRef]
- Nematov, D.D.; Khusenzoda, M.A.; Burhonzoda, A.S.; Kholmurodov, K.T.; Lyubchyk, A.; Ibrahim, M. Investigation of Structural and Optoelectronic Properties of N-Doped Hexagonal Phases of TiO2 (TiO2–xNx) Nanoparticles with DFT Realization: Optimization of the Band Gap and Optical Properties for Visible-Light Absorption and Photovoltaic Applications. Biointerface Res. Appl. Chem. 2021, 12, 3836–3848. [Google Scholar] [CrossRef]
- Wang, W.; Tadé, M.O.; Shao, Z. Research Progress of Perovskite Materials in Photocatalysis- and Photovoltaics-Related Energy Conversion and Environmental Treatment. Chem. Soc. Rev. 2015, 44, 5371–5408. [Google Scholar] [CrossRef]
- Gupta, A.; Zhang, R.; Kumar, P.; Kumar, V.; Kumar, A. Nano-Structured Dilute Magnetic Semiconductors for Efficient Spintronics at Room Temperature. Magnetochemistry 2020, 6, 15. [Google Scholar] [CrossRef]
- Fajariah, N.; Prabowo, W.A.E.; Fathurrahman, F.; Melati, A.; Dipojono, H.K. The Investigation of Electronic Structure of Transition Metal Doped TiO2 for Diluted Magnetic Semiconductor Applications: A First Principle Study. Procedia Eng. 2017, 170, 141–147. [Google Scholar] [CrossRef]
- Parangi, T.; Kumar Mishra, M. Titanium Dioxide as Energy Storage Material: A Review on Recent Advancement. In Titanium Dioxide; IntechOpen: London, UK, 2021. [Google Scholar]
- Wang, W.; Liu, Y.; Wu, X.; Wang, J.; Fu, L.; Zhu, Y.; Wu, Y.; Liu, X. Advances of TiO2 as Negative Electrode Materials for Sodium-Ion Batteries. Adv. Mater. Technol. 2018, 3, 1800004. [Google Scholar] [CrossRef]
- Zhang, H.; Banfield, J.F. Structural Characteristics and Mechanical and Thermodynamic Properties of Nanocrystalline TiO2. Chem. Rev. 2014, 114, 9613–9644. [Google Scholar] [CrossRef]
- Sutrisno, H.; Sunarto, S. Polymorphic Transformation of Titanium Dioxide Caused by Heat Treatment of Protonic Lepidocrocite Titanate. Indones. J. Chem. 2010, 10, 143–148. [Google Scholar] [CrossRef]
- Zhu, T.; Gao, S.-P. The Stability, Electronic Structure, and Optical Property of TiO2 Polymorphs. J. Phys. Chem. C 2014, 118, 11385–11396. [Google Scholar] [CrossRef]
- Mattesini, M.; de Almeida, J.S.; Dubrovinsky, L.; Dubrovinskaia, N.; Johansson, B.; Ahuja, R. Cubic TiO2 as a Potential Light Absorber in Solar-Energy Conversion. Phys. Rev. B 2004, 70, 115101. [Google Scholar] [CrossRef]
- Fehse, M.; Ventosa, E. Frontispiece: Is TiO2 (B) the Future of Titanium-Based Battery Materials? Chempluschem 2015, 80, 785–795. [Google Scholar] [CrossRef] [PubMed]
- Zukalová, M.; Kalbáč, M.; Kavan, L.; Exnar, I.; Graetzel, M.; Kalbáč, M.; Kavan, L.; Exnar, I.; Graetzel, M.; Kalbáč, M.; et al. Pseudocapacitive Lithium Storage in TiO2(B). Chem. Mater. 2005, 17, 1248–1255. [Google Scholar] [CrossRef]
- Osman, S.; Peng, C.; Li, F.; Chen, H.; Shen, J.; Zhong, Z.; Huang, W.; Xue, D.; Liu, J. Defect-Induced Dense Amorphous/Crystalline Heterophase Enables High-Rate and Ultrastable Sodium Storage. Adv. Sci. 2022, 9, 2205575. [Google Scholar] [CrossRef] [PubMed]
- Farooq, U.; Ahmed, F.; Pervez, S.A.; Rehman, S.; Pope, M.A.; Fichtner, M.; Roberts, E.P.L. A Stable TiO2–Graphene Nanocomposite Anode with High Rate Capability for Lithium-Ion Batteries. RSC Adv. 2020, 10, 29975–29982. [Google Scholar] [CrossRef]
- Liao, C.; Li, F.; Liu, J. Challenges and Modification Strategies of Ni-Rich Cathode Materials Operating at High-Voltage. Nanomaterials 2022, 12, 1888. [Google Scholar] [CrossRef]
- Sångeland, C.; Sun, B.; Brandell, D.; Berg, E.J.; Mindemark, J. Decomposition of Carbonate-Based Electrolytes: Differences and Peculiarities for Liquids vs. Polymers Observed Using Operando Gas Analysis. Batter. Supercaps 2021, 4, 785–790. [Google Scholar] [CrossRef]
- Zhang, W.; Zhang, Y.; Yu, L.; Wu, N.-L.; Huang, H.; Wei, M. TiO2-B Nanowires via Topological Conversion with Enhanced Lithium-Ion Intercalation Properties. J. Mater. Chem. A 2019, 7, 3842–3847. [Google Scholar] [CrossRef]
- Liu, J.; Li, P.; Li, F.; Liu, Z.; Xu, X.; Liu, J. Galvanic Replacement Preparation of Spindle-Structured Sb@C@NC as Anode for Superior Lithium-Ion Storage. Batteries 2022, 8, 245. [Google Scholar] [CrossRef]
- Zeng, T.; Ji, P.; Shang, B.; Peng, Q.; Zhang, Y.; Hu, X. Electrochemical Performances of Carbon Coated FeSbO4 as Anode Material for Lithium Batteries. Mater. Lett. 2017, 201, 198–202. [Google Scholar] [CrossRef]
- Paul, S.; Rahman, M.A.; Sharif, S.B.; Kim, J.-H.; Siddiqui, S.-E.-T.; Hossain, M.A.M. TiO2 as an Anode of High-Performance Lithium-Ion Batteries: A Comprehensive Review towards Practical Application. Nanomaterials 2022, 12, 2034. [Google Scholar] [CrossRef] [PubMed]
- Schweidler, S.; de Biasi, L.; Schiele, A.; Hartmann, P.; Brezesinski, T.; Janek, J. Volume Changes of Graphite Anodes Revisited: A Combined Operando X-ray Diffraction and In Situ Pressure Analysis Study. J. Phys. Chem. C 2018, 122, 8829–8835. [Google Scholar] [CrossRef]
- Cai, J.; Wang, Y.; Zhu, Y.; Wu, M.; Zhang, H.; Li, X.; Jiang, Z.; Meng, M. In Situ Formation of Disorder-Engineered TiO2(B)-Anatase Heterophase Junction for Enhanced Photocatalytic Hydrogen Evolution. ACS Appl. Mater. Interfaces 2015, 7, 24987–24992. [Google Scholar] [CrossRef]
- Yin, S.; Wu, J.; Aki, M.; Sato, T. Photocatalytic Hydrogen Evolution with Fibrous Titania Prepared by the Solvothermal Reactions of Protonic Layered Tetratitanate (H2Ti4O9). Int. J. Inorg. Mater. 2000, 2, 325–331. [Google Scholar] [CrossRef]
- Grosjean, R.; Fehse, M.; Pigeot-Remy, S.; Stievano, L.; Monconduit, L.; Cassaignon, S. Facile Synthetic Route towards Nanostructured Fe-TiO2(B), Used as Negative Electrode for Li-Ion Batteries. J. Power Sources 2015, 278, 1–8. [Google Scholar] [CrossRef]
- Zhang, K.; Katz, M.B.; Li, B.; Kim, S.J.; Du, X.; Hao, X.; Jokisaari, J.R.; Zhang, S.; Graham, G.W.; Van der Ven, A.; et al. Water-Free Titania-Bronze Thin Films with Superfast Lithium-Ion Transport. Adv. Mater. 2014, 26, 7365–7370. [Google Scholar] [CrossRef]
- Zhang, Y.; Meng, Y.; Zhu, K.; Qiu, H.; Ju, Y.; Gao, Y.; Du, F.; Zou, B.; Chen, G.; Wei, Y. Copper-Doped Titanium Dioxide Bronze Nanowires with Superior High Rate Capability for Lithium Ion Batteries. ACS Appl. Mater. Interfaces 2016, 8, 7957–7965. [Google Scholar] [CrossRef]
- Opra, D.P.; Gnedenkov, S.V.; Sinebryukhov, S.L.; Gerasimenko, A.V.; Ziatdinov, A.M.; Sokolov, A.A.; Podgorbunsky, A.B.; Ustinov, A.Y.; Kuryavyi, V.G.; Mayorov, V.Y.; et al. Enhancing Lithium and Sodium Storage Properties of TiO2(B) Nanobelts by Doping with Nickel and Zinc. Nanomaterials 2021, 11, 1703. [Google Scholar] [CrossRef]
- Opra, D.P.; Gnedenkov, S.V.; Sokolov, A.A.; Podgorbunsky, A.B.; Ustinov, A.Y.; Mayorov, V.Y.; Kuryavyi, V.G.; Sinebryukhov, S.L. Vanadium-Doped TiO2-B/Anatase Mesoporous Nanotubes with Improved Rate and Cycle Performance for Rechargeable Lithium and Sodium Batteries. J. Mater. Sci. Technol. 2020, 54, 181–189. [Google Scholar] [CrossRef]
- Amirsalehi, M.; Askari, M. Influence of Vanadium, Cobalt-Codoping on Electrochemical Performance of Titanium Dioxide Bronze Nanobelts Used as Lithium Ion Battery Anodes. J. Mater. Sci. Mater. Electron. 2018, 29, 13068–13076. [Google Scholar] [CrossRef]
- Cao, M.; Tao, L.; Lv, X.; Bu, Y.; Li, M.; Yin, H.; Zhu, M.; Zhong, Z.; Shen, Y.; Wang, M. Phosphorus-Doped TiO2-B Nanowire Arrays Boosting Robust Pseudocapacitive Properties for Lithium Storage. J. Power Sources 2018, 396, 327–334. [Google Scholar] [CrossRef]
- Han, Z.; Peng, J.; Liu, L.; Wang, G.; Yu, F.; Guo, X. Few-Layer TiO2-B Nanosheets with N-Doped Graphene Nanosheets as a Highly Robust Anode for Lithium-Ion Batteries. RSC Adv. 2017, 7, 7864–7869. [Google Scholar] [CrossRef]
- Chen, C.; Hu, X.; Zhang, B.; Miao, L.; Huang, Y. Architectural Design and Phase Engineering of N/B-Codoped TiO2(B)/Anatase Nanotube Assemblies for High-Rate and Long-Life Lithium Storage. J. Mater. Chem. A 2015, 3, 22591–22598. [Google Scholar] [CrossRef]
- Ventosa, E.; Mei, B.; Xia, W.; Muhler, M.; Schuhmann, W. TiO2(B)/Anatase Composites Synthesized by Spray Drying as High Performance Negative Electrode Material in Li-Ion Batteries. ChemSusChem 2013, 6, 1312–1315. [Google Scholar] [CrossRef]
- Goriparti, S.; Miele, E.; Prato, M.; Scarpellini, A.; Marras, S.; Monaco, S.; Toma, A.; Messina, G.C.; Alabastri, A.; de Angelis, F.; et al. Direct Synthesis of Carbon-Doped TiO2-Bronze Nanowires as Anode Materials for High Performance Lithium-Ion Batteries. ACS Appl. Mater. Interfaces 2015, 7, 25139–25146. [Google Scholar] [CrossRef]
- Li, Y.; Shen, J.; Li, J.; Liu, S.; Yu, D.; Xu, R.; Fu, W.-F.; Lv, X.-J. Constructing a Novel Strategy for Carbon-Doped TiO2 Multiple-Phase Nanocomposites toward Superior Electrochemical Performance for Lithium Ion Batteries and the Hydrogen Evolution Reaction. J. Mater. Chem. A 2017, 5, 7055–7063. [Google Scholar] [CrossRef]
- Hasegawa, G.; Tanaka, M.; Vequizo, J.J.M.; Yamakata, A.; Hojo, H.; Kobayashi, M.; Kakihana, M.; Inada, M.; Akamatsu, H.; Hayashi, K. Sodium Titanium Oxide Bronze Nanoparticles Synthesized via Concurrent Reduction and Na+-Doping into TiO2(B). Nanoscale 2019, 11, 1442–1450. [Google Scholar] [CrossRef]
- Su, J.; Li, Z.; Zhang, Y.; Wei, Y.; Wang, X. N-Doped and Cu-Doped TiO2-B Nanowires with Enhanced Photoelectrochemical Activity. RSC Adv. 2016, 6, 16177–16182. [Google Scholar] [CrossRef]
- Zhang, Z.; Zhou, Z.; Nie, S.; Wang, H.; Peng, H.; Li, G.; Chen, K. Flower-like Hydrogenated TiO2(B) Nanostructures as Anode Materials for High-Performance Lithium Ion Batteries. J. Power Sources 2014, 267, 388–393. [Google Scholar] [CrossRef]
- Song, W.; Chen, J.; Ji, X.; Zhang, X.; Xie, F.; Riley, D.J. Dandelion-Shaped TiO2/Multi-Layer Graphene Composed of TiO2(B) Fibrils and Anatase TiO2 Pappi Utilizing Triphase Boundaries for Lithium Storage. J. Mater. Chem. A 2016, 4, 8762–8768. [Google Scholar] [CrossRef]
- Petříček, V.; Dušek, M.; Palatinus, L. Crystallographic Computing System JANA2006: General Features. Z. Für Krist. Cryst. Mater. 2014, 229, 345–352. [Google Scholar] [CrossRef]
- Autthawong, T.; Chimupala, Y.; Haruta, M.; Kurata, H.; Kiyomura, T.; Yu, A.; Chairuangsri, T.; Sarakonsri, T. Ultrafast-Charging and Long Cycle-Life Anode Materials of TiO2-Bronze/Nitrogen-Doped Graphene Nanocomposites for High-Performance Lithium-Ion Batteries. RSC Adv. 2020, 10, 43811–43824. [Google Scholar] [CrossRef]
- Moreira, A.J.; Malafatti, J.O.D.; Giraldi, T.R.; Paris, E.C.; Pereira, E.C.; de Mendonça, V.R.; Mastelaro, V.R.; Freschi, G.P.G. Prozac® Photodegradation Mediated by Mn-Doped TiO2 Nanoparticles: Evaluation of by-Products and Mechanisms Proposal. J. Environ. Chem. Eng. 2020, 8, 104543. [Google Scholar] [CrossRef]
- Birlik, I.; Dagdelen, D. Synergistic Effect of Manganese and Nitrogen Codoping on Photocatalytic Properties of Titania Nanoparticles. Bull. Mater. Sci. 2020, 43, 85. [Google Scholar] [CrossRef]
- Huang, Z.; Hu, L.; Zhou, Q.; Guo, Y.; Tang, W.; Dai, J. Effect of Aging on Surface Chemistry of Rice Husk-Derived Biochar. Environ. Prog. Sustain. Energy 2018, 37, 410–417. [Google Scholar] [CrossRef]
- Singh, A.P.; Wang, R.B.; Tossi, C.; Tittonen, I.; Wickman, B.; Hellman, A. Hydrogen Induced Interface Engineering in Fe2O3–TiO2 Heterostructures for Efficient Charge Separation for Solar-Driven Water Oxidation in Photoelectrochemical Cells. RSC Adv. 2021, 11, 4297–4307. [Google Scholar] [CrossRef] [PubMed]
- Guo, M.; Gao, Y.; Shao, G. Complex Doping Chemistry Owing to Mn Incorporation in Nanocrystalline Anatase TiO2 Powders. Phys. Chem. Chem. Phys. 2016, 18, 2818–2829. [Google Scholar] [CrossRef]
- Zhou, J.K.; Lv, L.; Yu, J.; Li, H.L.; Guo, P.-Z.; Sun, H.; Zhao, X.S. Synthesis of Self-Organized Polycrystalline F-Doped TiO2 Hollow Microspheres and Their Photocatalytic Activity under Visible Light. J. Phys. Chem. C 2008, 112, 5316–5321. [Google Scholar] [CrossRef]
- Yu, J.C.; Yu, J.; Ho, W.; Jiang, Z.; Zhang, L. Effects of F-Doping on the Photocatalytic Activity and Microstructures of Nanocrystalline TiO2 Powders. Chem. Mater. 2002, 14, 3808–3816. [Google Scholar] [CrossRef]
- Viswanathan, B.; Krishanmurthy, K.R. Nitrogen Incorporation in TiO2: Does It Make a Visible Light Photo-Active Material? Int. J. Photoenergy 2012, 2012, 269654. [Google Scholar] [CrossRef]
- Lee, S.; Cho, I.-S.; Lee, D.K.; Kim, D.W.; Noh, T.H.; Kwak, C.H.; Park, S.; Hong, K.S.; Lee, J.-K.; Jung, H.S. Influence of Nitrogen Chemical States on Photocatalytic Activities of Nitrogen-Doped TiO2 Nanoparticles under Visible Light. J. Photochem. Photobiol. A Chem. 2010, 213, 129–135. [Google Scholar] [CrossRef]
- Lei, Y.; Li, J.; Wang, Z.; Sun, J.; Chen, F.; Liu, H.; Ma, X.; Liu, Z. Atomic-Scale Investigation of a New Phase Transformation Process in TiO2 Nanofibers. Nanoscale 2017, 9, 4601–4609. [Google Scholar] [CrossRef] [PubMed]
- Cai, Y.; Wang, H.-E.; Huang, S.-Z.; Jin, J.; Wang, C.; Yu, Y.; Li, Y.; Su, B.-L. Hierarchical Nanotube-Constructed Porous TiO2-B Spheres for High Performance Lithium Ion Batteries. Sci. Rep. 2015, 5, 11557. [Google Scholar] [CrossRef] [PubMed]
- Qu, J.; Cloud, J.E.; Yang, Y.; Ding, J.; Yuan, N. Synthesis of Nanoparticles-Deposited Double-Walled TiO2-B Nanotubes with Enhanced Performance for Lithium-Ion Batteries. ACS Appl. Mater. Interfaces 2014, 6, 22199–22208. [Google Scholar] [CrossRef] [PubMed]
- Hu, H.; Yu, L.; Gao, X.; Lin, Z.; Lou, X.W. Hierarchical Tubular Structures Constructed from Ultrathin TiO2(B) Nanosheets for Highly Reversible Lithium Storage. Energy Environ. Sci. 2015, 8, 1480–1483. [Google Scholar] [CrossRef]
- Li, X.; Li, M.; Liang, J.; Wang, X.; Yu, K. Growth Mechanism of Hollow TiO2(B) Nanocrystals as Powerful Application in Lithium-Ion Batteries. J. Alloys Compd. 2016, 681, 471–476. [Google Scholar] [CrossRef]
- Banerjee, D.; Gupta, S.K.; Patra, N.; Raja, S.W.; Pathak, N.; Bhattacharyya, D.; Pujari, P.K.; Thakare, S.V.; Jha, S.N. Unraveling Doping Induced Anatase–Rutile Phase Transition in TiO2 Using Electron, X-ray and Gamma-ray as Spectroscopic Probes. Phys. Chem. Chem. Phys. 2018, 20, 28699–28711. [Google Scholar] [CrossRef]
- Lin, Y.-W. Cation-Doped Titania Thin Films; University of New South Wales: Sydney, Australia, 2015. [Google Scholar]
- Borkar, S.A.; Dharwadkar, S.R. Temperatures and Kinetics of Anatase to Rutile Transformation in Doped TiO2 Heated in Microwave Field. J. Therm. Anal. Calorim. 2004, 78, 761–767. [Google Scholar] [CrossRef]
- Arroyo, R.; Córdoba, G.; Padilla, J.; Lara, V. Influence of Manganese Ions on the Anatase–Rutile Phase Transition of TiO2 Prepared by the Sol–Gel Process. Mater. Lett. 2002, 54, 397–402. [Google Scholar] [CrossRef]
- Lee, H.B.; Ginting, R.T.; Tan, S.T.; Tan, C.H.; Alshanableh, A.; Oleiwi, H.F.; Yap, C.C.; Jumali, M.H.H.; Yahaya, M. Controlled Defects of Fluorine-Incorporated ZnO Nanorods for Photovoltaic Enhancement. Sci. Rep. 2016, 6, 32645. [Google Scholar] [CrossRef] [PubMed]
- Hanaor, D.A.H.A.H.; Sorrell, C.C.C. Review of the Anatase to Rutile Phase Transformation. J. Mater. Sci. 2011, 46, 855–874. [Google Scholar] [CrossRef]
- Lv, K.; Xiang, Q.; Yu, J. Effect of Calcination Temperature on Morphology and Photocatalytic Activity of Anatase TiO2 Nanosheets with Exposed {0 0 1} Facets. Appl. Catal. B Environ. 2011, 104, 275–281. [Google Scholar] [CrossRef]
- Jin, J.; Wu, L.; Huang, S.; Yan, M.; Wang, H.; Chen, L.; Hasan, T.; Li, Y.; Su, B.-L. Hierarchy Design in Metal Oxides as Anodes for Advanced Lithium-Ion Batteries. Small Methods 2018, 2, 1800171. [Google Scholar] [CrossRef]
- Kolesnik, I.V.; Lebedev, V.A.; Garshev, A.V. Optical Properties and Photocatalytic Activity of Nanocrystalline TiO2 Doped by 3d-Metal Ions. Nanosyst. Phys. Chem. Math. 2018, 9, 401–409. [Google Scholar] [CrossRef]
- Smirnova, N.; Petrik, I.; Vorobets, V.; Kolbasov, G.; Eremenko, A. Sol-Gel Synthesis, Photo- and Electrocatalytic Properties of Mesoporous TiO2 Modified with Transition Metal Ions. Nanoscale Res. Lett. 2017, 12, 239. [Google Scholar] [CrossRef]
- Kijlstra, W.S.; Poels, E.K.; Bliek, A.; Weckhuysen, B.M.; Schoonheydt, R.A. Characterization of Al2O3-Supported Manganese Oxides by Electron Spin Resonance and Diffuse Reflectance Spectroscopy. J. Phys. Chem. B 1997, 101, 309–316. [Google Scholar] [CrossRef]
- Zhang, D.-A.; Wang, Q.; Wang, Q.; Sun, J.; Xing, L.-L.; Xue, X.-Y. Core–Shell SnO2@TiO2-B Nanowires as the Anode of Lithium Ion Battery with High Capacity and Rate Capability. Mater. Lett. 2014, 128, 295–298. [Google Scholar] [CrossRef]
- Du, S.; Lian, J.; Zhang, F. Visible Light-Responsive N-Doped TiO2 Photocatalysis: Synthesis, Characterizations, and Applications. Trans. Tianjin Univ. 2022, 28, 33–52. [Google Scholar] [CrossRef]
- Dozzi, M.V.; Selli, E. Doping TiO2 with P-Block Elements: Effects on Photocatalytic Activity. J. Photochem. Photobiol. C Photochem. Rev. 2013, 14, 13–28. [Google Scholar] [CrossRef]
- Zhao, H.; Pan, F.; Li, Y. A Review on the Effects of TiO2 Surface Point Defects on CO2 Photoreduction with H2O. J. Mater. 2017, 3, 17–32. [Google Scholar] [CrossRef]
- Cheng, X.; Yu, X.; Xing, Z.; Yang, L. Synthesis and Characterization of N-Doped TiO2 and Its Enhanced Visible-Light Photocatalytic Activity. Arab. J. Chem. 2016, 9, S1706–S1711. [Google Scholar] [CrossRef]
- Feng, N.; Liu, F.; Huang, M.; Zheng, A.; Wang, Q.; Chen, T.; Cao, G.; Xu, J.; Fan, J.; Deng, F. Unravelling the Efficient Photocatalytic Activity of Boron-Induced Ti3+ Species in the Surface Layer of TiO2. Sci. Rep. 2016, 6, 34765. [Google Scholar] [CrossRef] [PubMed]
- Marques, F.C.; Jasieniak, J.J. Ionization Potential and Electron Attenuation Length of Titanium Dioxide Deposited by Atomic Layer Deposition Determined by Photoelectron Spectroscopy in Air. Appl. Surf. Sci. 2017, 422, 504–508. [Google Scholar] [CrossRef]
- Umek, P.; Bittencourt, C.; Guttmann, P.; Gloter, A.; Škapin, S.D.; Arčon, D. Mn2+ Substitutional Doping of TiO2 Nanoribbons: A Three-Step Approach. J. Phys. Chem. C 2014, 118, 21250–21257. [Google Scholar] [CrossRef]
- Popa, A.; Raita, O.; Stan, M.; Pana, O.; Borodi, G.; Giurgiu, L.M. Electron Paramagnetic Resonance of Mn-Doped Sn1−xMnxO2 Powders. Appl. Magn. Reson. 2012, 42, 453–462. [Google Scholar] [CrossRef]
- Güler, S.; Rameev, B.; Khaibullin, R.I.; Lopatin, O.N.; Aktaş, B. EPR Study of Mn-Implanted Single Crystal Plates of TiO2 Rutile. J. Magn. Magn. Mater. 2010, 322, L13–L17. [Google Scholar] [CrossRef]
- Sakaguchi Miyamoto, N.; Miyamoto, R.; Giamello, E.; Kurisaki, T.; Wakita, H. Evaluation of Coexistent Metal Ions with TiO2: An EPR Approach. Res. Chem. Intermed. 2018, 44, 4563–4575. [Google Scholar] [CrossRef]
- Müller, K.A. Electron Paramagnetic Resonance of Manganese IV in SrTiO3. Phys. Rev. Lett. 1959, 2, 341–343. [Google Scholar] [CrossRef]
- Castner, T.; Newell, G.S.; Holton, W.C.; Slichter, C.P. Note on the Paramagnetic Resonance of Iron in Glass. J. Chem. Phys. 1960, 32, 668–673. [Google Scholar] [CrossRef]
- Griscom, D.L.; Griscom, R.E. Paramagnetic Resonance of Mn2+ in Glasses and Compounds of the Lithium Borate System. J. Chem. Phys. 1967, 47, 2711–2722. [Google Scholar] [CrossRef]
- Brutti, S.; Gentili, V.; Reale, P.; Carbone, L.; Panero, S. Mitigation of the Irreversible Capacity and Electrolyte Decomposition in a LiNi0.5Mn1.5O4/Nano-TiO2 Li-Ion Battery. J. Power Sources 2011, 196, 9792–9799. [Google Scholar] [CrossRef]
- Dylla, A.G.; Henkelman, G.; Stevenson, K.J. Lithium Insertion in Nanostructured TiO2(B) Architectures. Acc. Chem. Res. 2013, 46, 1104–1112. [Google Scholar] [CrossRef] [PubMed]
- Aurbach, D.; Talyosef, Y.; Markovsky, B.; Markevich, E.; Zinigrad, E.; Asraf, L.; Gnanaraj, J.S.; Kim, H.-J. Design of Electrolyte Solutions for Li and Li-Ion Batteries: A Review. Electrochim. Acta 2004, 50, 247–254. [Google Scholar] [CrossRef]
- Xia, L.; Yu, L.; Hu, D.; Chen, G.Z. Electrolytes for Electrochemical Energy Storage. Mater. Chem. Front. 2017, 1, 584–618. [Google Scholar] [CrossRef]
- Kavan, L. Electrochemistry of Titanium Dioxide: Some Aspects and Highlights. Chem. Rec. 2012, 12, 131–142. [Google Scholar] [CrossRef]
- Zhang, Y.; Fu, Q.; Xu, Q.; Yan, X.; Zhang, R.; Guo, Z.; Du, F.; Wei, Y.; Zhang, D.; Chen, G. Improved Electrochemical Performance of Nitrogen Doped TiO2-B Nanowires as Anode Materials for Li-Ion Batteries. Nanoscale 2015, 7, 12215–12224. [Google Scholar] [CrossRef]
- Armstrong, G.; Armstrong, A.R.; Bruce, P.G.; Reale, P.; Scrosati, B. TiO2(B) Nanowires as an Improved Anode Material for Lithium-Ion Batteries Containing LiFePO4 or LiNi0.5Mn1.5O4 Cathodes and a Polymer Electrolyte. Adv. Mater. 2006, 18, 2597–2600. [Google Scholar] [CrossRef]
- Wang, L.; Zuo, P.; Yin, G.; Ma, Y.; Cheng, X.; Du, C.; Gao, Y. Improved Electrochemical Performance and Capacity Fading Mechanism of Nano-Sized LiMn0.9Fe0.1PO4 Cathode Modified by Polyacene Coating. J. Mater. Chem. A 2015, 3, 1569–1579. [Google Scholar] [CrossRef]


Disclaimer/Publisher’s Note: The statements, opinions and data contained in all publications are solely those of the individual author(s) and contributor(s) and not of MDPI and/or the editor(s). MDPI and/or the editor(s) disclaim responsibility for any injury to people or property resulting from any ideas, methods, instructions or products referred to in the content. |
© 2023 by the authors. Licensee MDPI, Basel, Switzerland. This article is an open access article distributed under the terms and conditions of the Creative Commons Attribution (CC BY) license (https://creativecommons.org/licenses/by/4.0/).