Article

Solid–Electrolyte Interface Formation on Si Nanowires in Li-Ion Batteries: The Impact of Electrolyte Additives

1
Consiglio Nazionale delle Ricerche, Istituto dei Sistemi Complessi, Piazzale Aldo Moro 5, 00185 Rome, Italy
2
Department of Chemistry, Sapienza University of Rome, Piazzale Aldo Moro 5, 00185 Rome, Italy
3
GISEL-Centro di Riferimento Nazionale per i Sistemi di Accumulo Elettrochimico di Energia, INSTM, Via G. Giusti 9, 50121 Firenze, Italy
4
Synchrotron SOLEIL, L’Orme des Merisiers, Saint-Aubin, BP 48, CEDEX, 91192 Gif-sur-Yvette, France
5
Agenzia Nazionale per le Nuove Tecnologie, l’Energia e lo Sviluppo Economico Sostenibile (ENEA), Materials and Physicochemical Processes Technical Unit (SSPT-PROMAS-MATPRO), Via Anguillarese 301, 00123 Rome, Italy
6
Department of Chemical Sciences and Bernal Institute, University of Limerick, V94 T9PX Limerick, Ireland
*
Author to whom correspondence should be addressed.
These authors contributed equally to this work.
Present address: Microscopy Center, University of L’Aquila, Via Vetoio, 67100 L’Aquila, Italy.
Batteries 2023, 9(3), 148; https://doi.org/10.3390/batteries9030148
Submission received: 29 November 2022 / Revised: 20 February 2023 / Accepted: 24 February 2023 / Published: 26 February 2023

Abstract

:
The morphological changes of Si nanowires (Si NWs) cycled in 1:1 ethylene–carbonate (EC)/diethyl–carbonate (DEC) with or without different additives, fluoroethylene carbonate (FEC) or vinylene carbonate (VC), as well as the composition of the deposited solid–electrolyte interphase layer, are investigated by a combination of experimental microscopic and spectroscopic techniques. Scanning electron microscopy and optical spectroscopy highlight that the NW morphology is better preserved in samples cycled in the presence of FEC and VC additives compared to the additive-free electrolyte. However, only the use of FEC is capable of slightly mitigating the amorphization of silicon upon cycling. The solid electrolyte interphase (SEI) formed over the Si NWs cycled in the additive-free electrolyte is richer in organic and inorganic carbonates compared to the SEI grown in the presence of the VC and FEC additives. Furthermore, both additives are able to remarkably limit the degradation of the LiPF6 salt. Overall, the use of the FEC-additive in the carbonate-based electrolyte promotes both morphological and structural resilience of the Si NWs upon cycling thanks to the optimal composition of the SEI layer.

1. Introduction

Silicon is a versatile material that is being used for innumerable advanced applications in modern technologies [1,2,3,4,5,6]. Besides photovoltaics and micro-electronics, nanostructured silicon is finding application in high-capacity negative electrodes for Li-ion batteries (LIBs) [3,7,8,9]. The maximum theoretical performance of silicon electrodes in aprotic LIBs is about 4212 mAhg−1 at high temperatures (lithiation to Li4.4Si) and 3579 mAhg−1 at roomtemperature (lithiation to Li15Si4) to be compared to 372 mAhg−1 of graphite [10]. In real cells, due to kinetic hinderance and the consequent overpotentials, figures above 2500–3000 mAhg−1 can only be achieved by a careful selection and optimization of nanostructures as well as by tailoring the Si surface by electrode additives, particle coatings or grafting supramolecular aggregates on the electrode film [7,11,12,13,14,15,16,17,18]. In fact, nano-structuring, electrode formulation and the electrolyte composition strongly impact on the reversibility of the lithiation/de-lithiation of silicon electrodes [3,10]. Overall, the role played by the electrode surface, and in particular the solid electrolyte interphase (SEI) in silicon electrodes is an active and insufficiently understood field for research [19,20,21,22,23]. Experimental evidences of an active role played by the SEI are consolidating, thus suggesting a remarkable complexity in the real electrochemical reactions occurring in silicon electrodes upon discharge and charge in batteries [19,20,21,22,23,24].
The SEI forms in any negative electrode in LIBs during the initial lithiation/de-lithiation cycles, the so-called electrode formation; it is the result of a complex sequence of irreversible chemical and electrochemical reactions between the electrode components (i.e., active material, binder, carbon additive) and the electrolyte (solvent and salt anion) [20,25,26,27,28]. A stable SEI is a composite soft material constituted by organic and inorganic compounds able to stop the charge transfer between the electrode and the electrolyte upon cycling, thus blocking parasitic chemistries, without hindering the lithium ion motion through the SEI itself. A good SEI must combine: (a) excellent morphological homogeneity over the electrode surface; (b) good mechanical properties (elasticity) to support the electrode volume breath upon lithium incorporation/de-incorporation; (c) strong electric insulator character to hinder the charge transfer from the electrode to the electrolyte to block the parasitic chemistries upon cycling; and (d) a good ionic conductivity to facilitate the transportation of lithium ions from and to the electrode [20,24,27,28]. Overall the key function played by the SEI layer is the asymmetrical increase of the charge transfer resistances of the lithium incorporation reaction into the silicon lattice and the concurrent parasitic reduction of the electrolyte components to strongly slow down the second process in respect to the first one.
In silicon electrodes for LIBs, the SEI composition is remarkably different depending on the binder and electrolyte composition [3,10,16,17,21,29,30,31,32,33,34,35,36,37]. More importantly, the SEI grown on silicon during formation is often unstable and has been reported to change, showing compositional alterations, increasing impedance, lithium-ion depletion and thickness growth [38,39,40,41]. The optimization of a stable SEI layer on silicon unavoidably needs the analysis of the reactivity in LIBs of a specific silicon morphology with specific surface properties. The results of this analysis provide indications to assess the experimental conditions that drive the passivation film precipitation and consolidation: e.g., the electrolyte composition (physical state, solvent, salt and additives); the nature of the electrode binders (non-aqueous vs. aqueous); and the electrochemical formation conditions (i.e., galvanostatic vs. potentiostatic regimes, current regimes, voltage cutoffs, etc.). Given the complex interrelated variables involved in SEI formation, it is important to decouple the role of each of them and to unpuzzle this complex chemical–electrochemical landscape. In this respect, properly designed casestudies can shed light on selected aspects of the SEI formation and composition.
With this aim, we here present a comprehensive investigation on the impact of electrolyte composition on the SEI layer grown on silicon nanowires within galvanostatic cycling at room temperature. We selected a binder and conductive-additive-free silicon electrode grown by a wet chemical method [42,43]. The Si nanowire system has previously demonstrated excellent performance in aprotic lithium batteries and is ideal for studying SEI characteristics in detail [42,43]. Our current experimental approach exploits ex-situ analysis of electrodes collected from electrochemical cells using a variety of spectroscopic methods resolved at the microscale (micro-spectroscopy) and scanning electron microscopy (SEM). Besides SEM, we used Raman micro-spectroscopy, Fast Fourier Transform Infrared Attenuated Total Reflectance spectroscopy (FTIR-ATR) and Optical-Photothermal Infrared Spectroscopy (O-PTIR). This last technique was for the first time exploited for lithium cell materials. The combination of these techniques allows an investigation of the micro-morphology of electrodes after cycling, in parallel with the chemical speciation of the surfaces at the microscale. The present study significantly extends a previous publication focused on the SEI grown on silicon using additives in a 1M LiPF6 electrolyte solution in an ethylene–carbonate/diethyl–carbonate (EC:DEC 1:1 in vol) mixture [44]. Here, extensive characterizations, including synchrotron-based techniques, are used to develop a comprehensive understanding of the role of electrolyte additives in determining SEI morphology and chemical composition. In passing, it is important to underline the limits of the adoption of an extended ex-situ investigation protocol to critically evaluate the complexity of our goal. In fact ex-situ samples are inevitably analyzed outside the battery, thus requiring mechanical and chemical procedures to collect electrodes and probe them by spectroscopy/microscopy. This inevitable manipulation can lead to artifacts. However and unfortunately, there is not an easy alternative as there is not an artifact-free way to analyze the SEI layer. As an example, operando X-ray photoemission spectroscopy is possible only using solid-state electrolytes or poorly volatile solvents (i.e., unrealistic conditions); operando Raman spectroscopy requires laser excitations and easily damages nanomaterials by heating locally all chemical components close to the electrode surface; operando FTIR is barely possible due to the massive signals from the electrolyte; operando SEM unavoidably requires unrealistic experimental setups, whereas operando X-ray spectroscopy is again strongly affected by the massive signals from all the electrolyte components. Therefore, there is not an ideal technique to probe the chemical composition of a SEI. On the other hand, ex-situ analyses have been exploited by innumerable authors in battery science all around the world for more than 30 years to analyze the SEI layer or to describe the interplay between redox bulk and surface (electro-)chemistry. Overall, ex-situ approaches are unfortunately an inevitable compromise. In this paper, therefore, we will exploit ex-situ vibrational spectroscopy techniques to investigate the evolution of the SEI and of the amorphization of Si NWs. In particular, we will exploit the use of the O-PTIR experimental technique for the first time in the available literature concerning lithium batteries. Overall, the main novelty of this work is the systematic investigation of ex- situ Si NW negative electrode materials collected from aprotic secondary lithium batteries after cycling, by exploiting a plethora of combined techniques. Based on this large dataset, we shed new light on the interplay between the growth of the SEI, the amorphization of silicon and the nature of the electrolytes.

2. Materials and Methods

2.1. Silicon Nanowires (Si NWs): Direct Electrode Manufacture

Si nanowires (Si NWs) are grown with high density directly from a Sn layer evaporated (“Sn-seed”) on stainless steel (SS, MTI Corp) using phenylsilane (Sigma-Aldrich (St. Louis, MO, USA), 97%) as precursor and squalane (Sigma-Aldrich, 96%) as growth solvent. The synthesis was carried out at 460 °C for 1.5 h in a low-cost glassware apparatus [42,43,44,45]. The resulting samples are Si NWs directly supported onto SS foils with a mean mass loading of 0.1 mg cm−2. Electrode areas were approximately 1–1.5 cm2. The net Si mass loading over each electrode has been evaluated by using a digitalized image at 10× magnification and the ImageJ-embedded routines (version 1.53n of ImageJ) to estimate the corresponding surface area and therefore the corresponding SS tare.

2.2. Cell formulation and Electrochemical Test Conditions

Electrochemical cells were assembled in an Ar-filled glove box by coupling Si NW working electrodes with Li counter electrodes, using a PP separator within Swagelok cells (diameter 10 mm). Three electrolyte formulations were tested, namely: (a) 1M LiPF6 solution in an EC:DEC mixture 1:1 in volume (BE; benchmark electrolyte); (b) BE added with 3% of vinylene carbonate (VC); and (c) BE added with 3% of fluoroethylene carbonate (FEC). Constant volumes (60 μL) of electrolytes were absorbed over the PP separator, and the assembly was sealed in Swagelok cells. Electrochemical tests were performed in galvanostatic conditions using a Biologic BCS-805 potentiostat. Each cell was discharged and charged at constant current (galvanostatic conditions) at 0.2 C (1C = 3500 mAg−1) in the 10 Mv–1 V voltage range at room temperature. All cells were stopped after 5, 10 or 50 cycles of discharge/charge in the de-lithiated state. Electrodes for ex-situ analysis were collected postmortemfrom each electrochemical cell following a simple routine: (a) cell de-assembling in an Ar-filled glove box; (b) electrode washing in diethyl–carbonate; (c) vacuum drying at room temperature; and (d) storage in sealed vials in the Ar-filled glove box. The absence of DMC residues on electrodes has been checked by FTIR on pristine samples submitted to the above mentioned washing/drying procedure.

2.3. Scanning Electron Microscopy

Scanning Electron Microscopy (SEM) was used for the morphological characterization of Si NW anodes in pristine condition and cycled with the different combination of electrolyte and additives mentioned before. Images were recorded using a Field Emission Scanning Electron Microscope (FESEM) Zeiss Auriga 405 (Zeiss, Oberkochen, Germany), with a voltage level of 8 kV and a working distance of 5.5 mm. SEM measurements were performed at the Research Center on Nanotechnology Applied to Engineering (CNIS) of Sapienza University.

2.4. Raman Micro-Spectroscopy

Raman measurements were performed by a DXR2 Thermo Fisher Raman micro-spectrometer, equipped with a solid-state green laser (532 nm of wavelength), and a 900 line/mm grating, that allows an estimated spectral resolution of about 5 cm−1, in a spectral range between 50 cm−1 and 3500 cm−1. The spectrometer is coupled with a confocal microscope with various optical objectives (reported spectra were acquired with an Olympus Mplan50X/0.75NA) and a motorized mapping stage with a spatial resolution of 0.1 μm.
In order to have a statistical investigation of the degree of amorphization, we acquired Raman maps on all specimens. Moreover, in order to consolidate the trend of the silicon amorphization upon cycling, we extended the post mortemRaman maps analysis to samples obtained after 5, 10 and 50 repeated lithiation/de-lithiation cycles.In all cases, Raman spectra were acquired on a matrix of points displaced by 5 μm along two perpendicular coordinates. A matrix 7 × 7 points was used in all cases, except for the sample cycled in the VC-added electrolyte, where we used a 10 × 9 points matrix. All the spectra that build the mapsresult from averaging 2 scans of 5 acquisitions each, with a laser power on the sample of 6 mW. The reported spectra were corrected with a polynomial baseline.

2.5. FTIR-ATR Spectroscopy

FTIR-ATR spectra were collected by a Thermo Nicolet 8700 Continuum microscope, equipped with a 15X Schwarzschild ATR objective, that employs a ZnSe crystal with a refractive index of n = 2.4 (ISP Optics Corp., Rīga, Latvia). The spectra were recorded in the mid-infrared spectral range (from 600 cm−1 to 4000 cm−1) using synchrotron light as source, a KBr beam-splitter and a liquid nitrogen cooled MCT detector. All the reported spectra were obtained by adding up 500 scans, with a spectral resolution of about 2 cm−1. The use of the synchrotron radiation allowed to measure ATR spectra on spots of about 10 μm of diameter.

2.6. Optical-Photothermal Infrared Spectroscopy

Optical-Photothermal Infrared Spectroscopy (O-PTIR) is a novel technique that measures the photothermal response of a sample, monitoring the changes induced by a pulsed infrared beam in sample reflectivity, through a visible laser probe. O-PTIR measurements on Si NW anodes were performed through a “mIRage” Infrared Microscope (Photothermal Spectroscopy Corp., Santa Barbara, CA, USA), equipped with a pulsed quantum cascade IR laser, tunable between 800 cm−1 and 1900 cm−1, and a visible (532 nm) continuous wave laser probe. Spectra reported in this paper were acquired through a 40X Schwarzschild objective (0.78 NA, 8 mm WD) in reflection mode, with a 2 cm−1 spectral resolution.
Raman, FTIR-ATR and O-PTIR measurements were performed at the SMIS beamline of the Synchrotron SOLEIL (Saint-Aubin, France).

3. Results

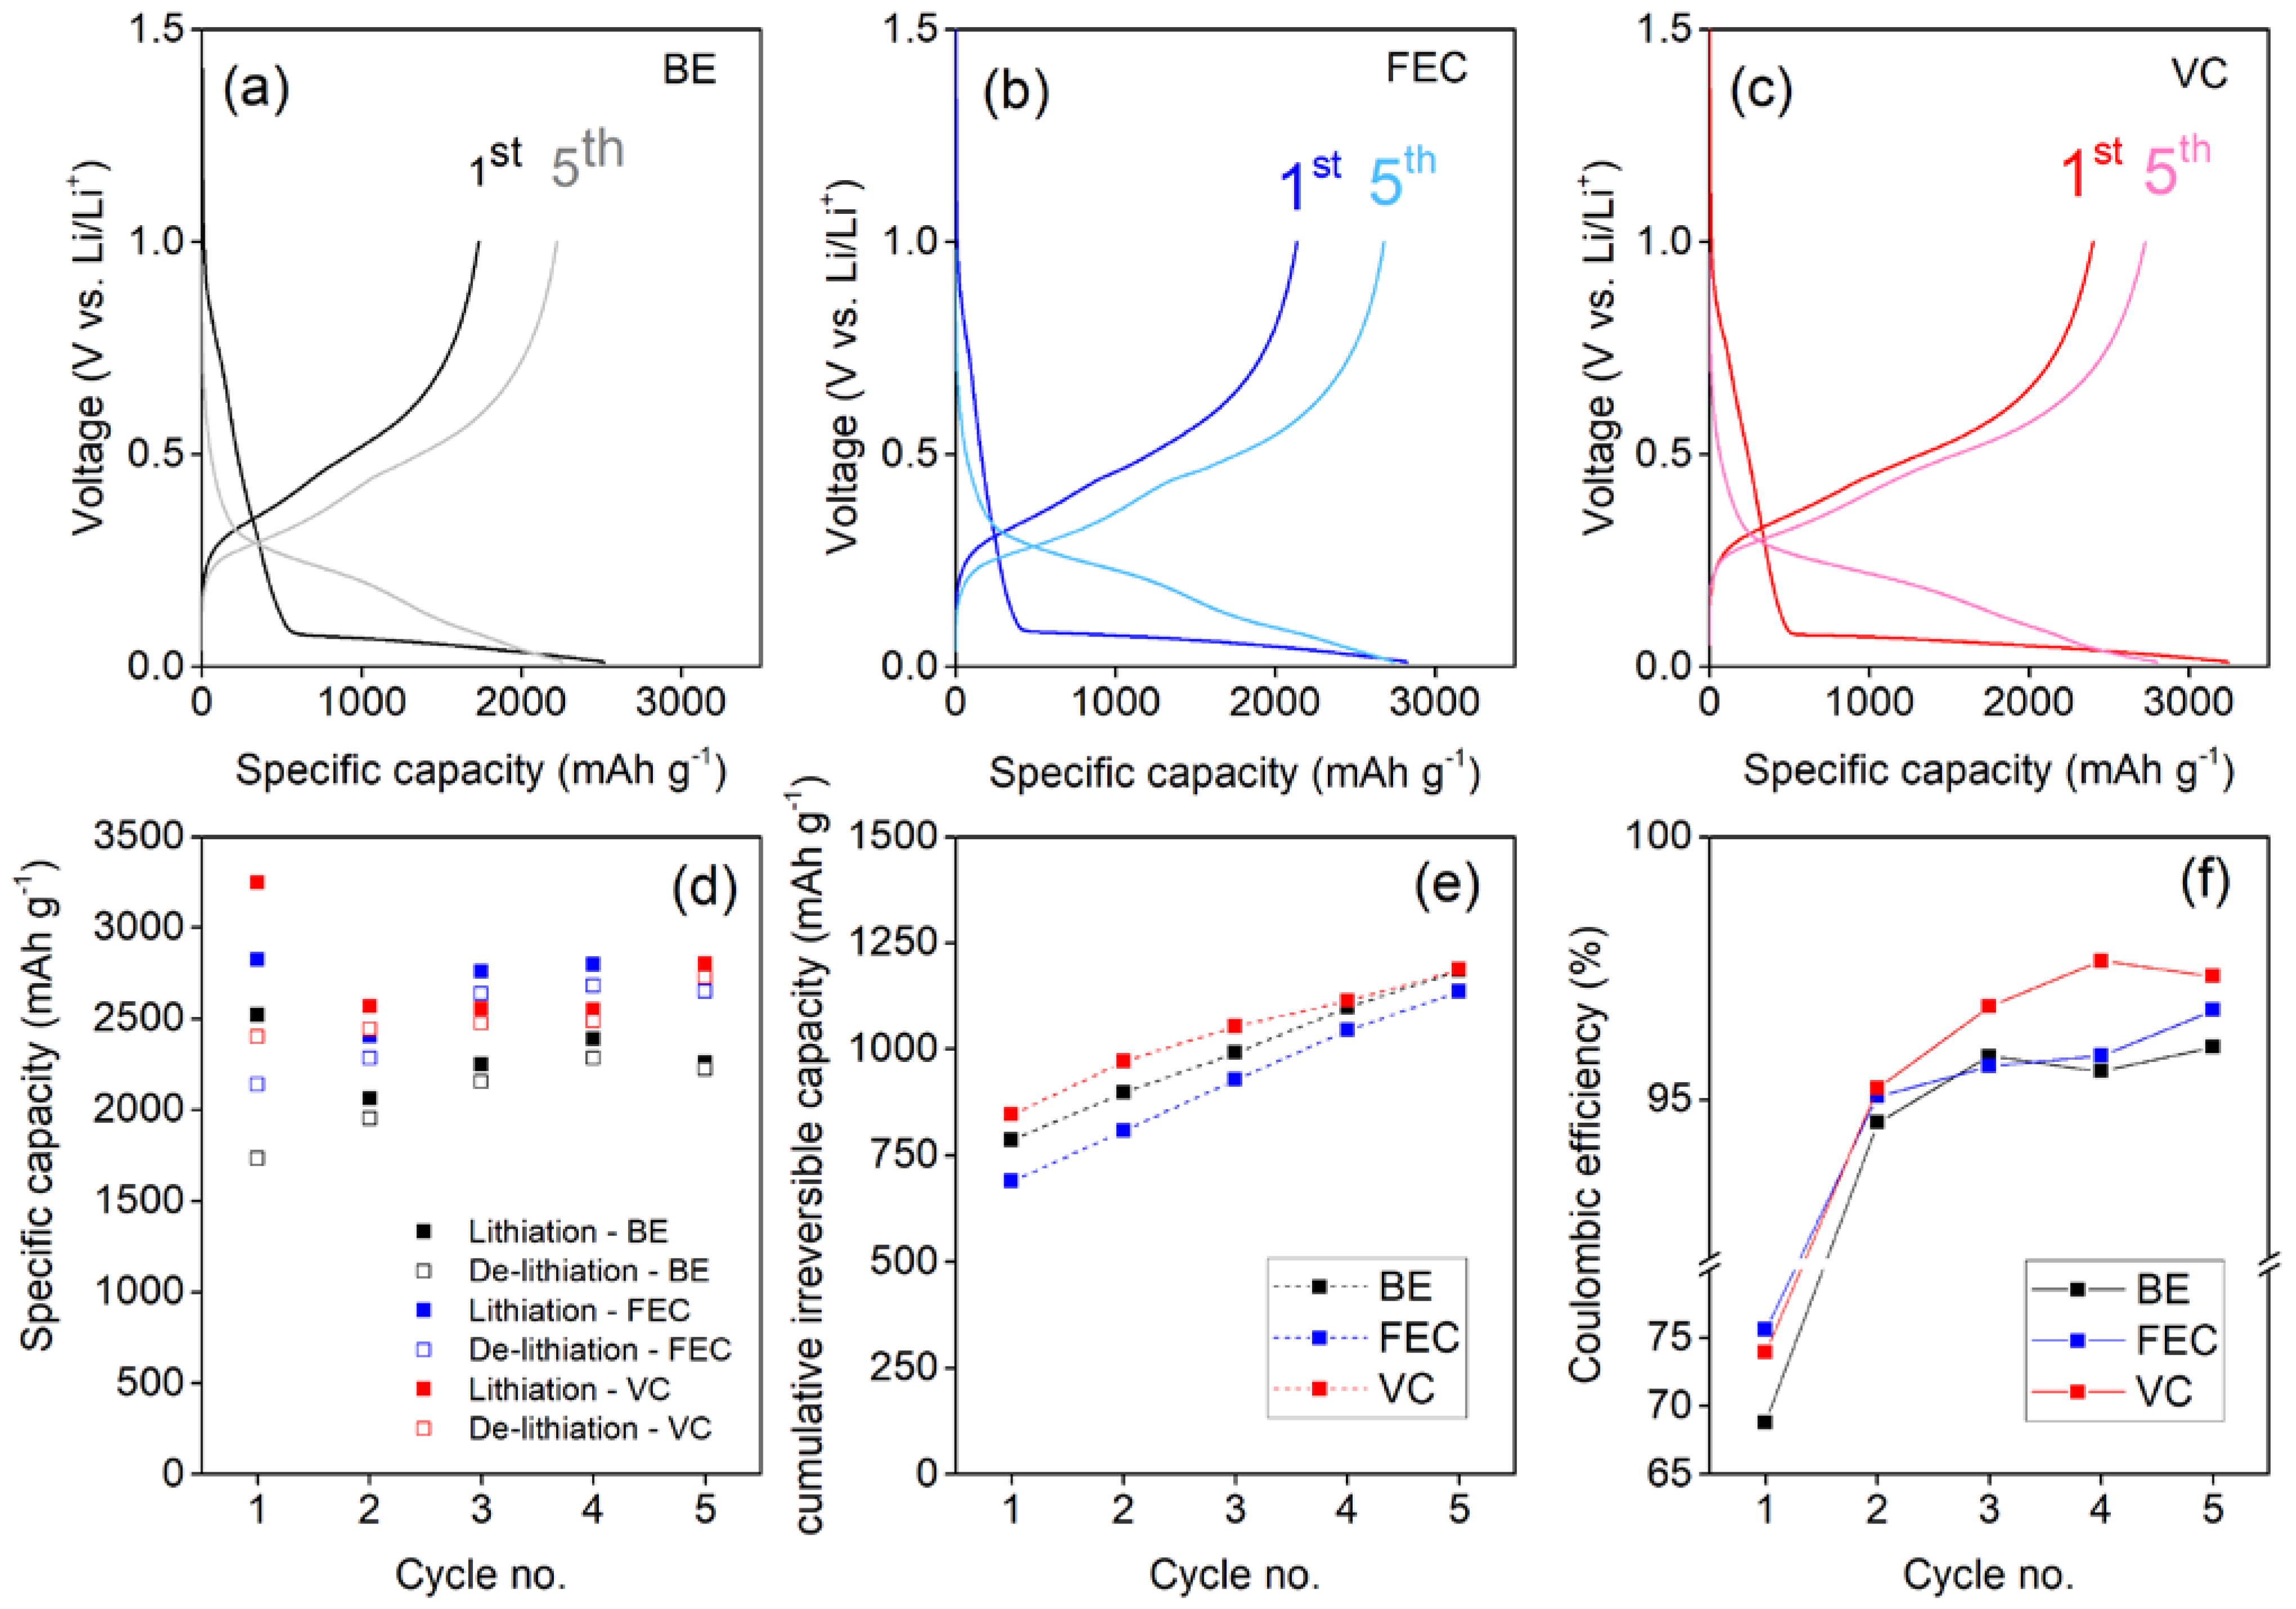
3.1. Electrochemical Formation and Consolidation of the SEI

The electrochemical performance delivered by the Si NW electrodes in the first five galvanostatic discharge–charge cycles in the three different electrolytes is shown in Figure 1. Here we focus on the first five cycles in batteries because the main investigation is devoted to the formation of the SEI. Indeed, long term cycling of the anodes is not the primary target here as the positive impact of electrolyte additives in enabling cycling stability has been demonstrated previously by us and others [21,23,33,39,41]. Instead, a complete investigation of the SEI layer was carried out at the fifthcycle, considered as a good point of the development of the SEI formation process. Electrodes show similar lithiation and de-lithiation voltage curves in the first and in the following cycles in all the electrolytes. Cells have been replicated in order to consolidate the relative trends and capacity values.
VC and FEC additives improve the specific capacity compared to the BE electrolyte performance (see Figure 1d). It is interesting to underline that in all cases the specific capacity exchanged in the first discharge step is below the theoretical value of 3579 mAhg−1. These capacity values are a possible clue of a kinetic hinderance to form Li-rich LixSi alloys. This limitation likely originates by the inevitable overpotentials that shift downwards the alloying redox potentials, below 0 V vs. Li+/Li, in the last stage of lithiations. Furthermore, for all the NW electrodes, the capacity slightly increases after the first cycle. This behavior is not unexpected and has been reported in many literature studies [3,7,8]: It is related to the increase in the lithium loading ability induced by the amorphization of silicon cycle-by-cycle; in fact amorphous silicon is able to reversibly incorporate–de-incorporate lithium ions better that the crystalline phase [3,7,8]. The link between capacity and amorphization of the Si NWs upon cycling will be further commented upon in Section 3.3.
From the point of view of the irreversible capacity losses, all electrolytes present a coulombic efficiency below 80% in the first cycle, which is well-established for Si anodes [35,46,47]. The use of additives enhances reversibility, starting from cycle 2, beyond the benchmark formulation [44]. In terms of cumulative irreversible capacity, at the end of the fifth cycle, the FEC-added electrolyte gives better performances than the other two formulations. Recalling the ability of the FEC additive to promote excellent and stable performance also in prolonged cycling demonstrated by us [43], the electrochemical data suggests a less reactive electrolyte–electrode interface and a better SEI compared to both additive-free and the VC-added electrolytes, directly related to the onset formation of the passivation film over the silicon nanostructures. The small reduction of the coulombic efficiency between cycle 4 and 5 in the case of the VC-added cell formulations is within the experimental error in repeated tests.
Overall, the performance of the Si NW electrodes in the first cycles suggests that the largest part of irreversible capacity loss occurs in the first discharge in half cells, and thus, the SEI grows mainly during the first lithiation of the silicon lattice in line with the literature [8,20,24,33]. On the other hand, the use of electrolyte additives has a remarkable effect on the electrochemical reversibility of lithiation–de-lithiation, thus suggesting the formation of a better SEI layer, able to facilitate charge transfer to silicon without wasting capacity in the parasitic degradation of the electrolyte.

3.2. Morphological Characterization

To investigate the effects of SEI growth on the morphology of the Si NW electrodes in the various electrolytes, SEM measurements have been performed on postmortem samples in comparison to the reference uncycled sample (Figure 2).
The nanowire morphologyis observed in the pristine Si NW sample (Figure 2a and Figure S1), with a Sn-seed of~100 nm diameter atop Si NWs several microns in length [45,48,49]. In contrast, postmortemelectrodes cycled in the BE electrolyte (Figure 2b and Figure S1) show the occurrence of a massive alteration of the overall morphology. The Si NWs are tangled and embedded in an amorphous-like matrix, likely constituted by organic by-products of the electrolyte degradation.Conversely, the morphology is better preserved in electrodes cycled in electrolytes with additives (Figure 2c,d). Both FEC- and VC-added electrolytes induce a better morphological retention of the nanowires shapewith expansion of the diameter upon cycling. At lower and higher magnifications, electrodes are rather homogeneous (see Figures S1 and S2 of Supplementary Materials). In all cases, surfaces and nanowires are covered with an amorphous-like matrix that is more compact and denser in the electrodes cycled with the BE electrolyte.

3.3. Micro-Spectroscopic Characterization

To analyze the preservation of the silicon active materials and to identify the chemical fingerprint of the SEI layers formed upon cycling on the Si NW electrodes in the three electrolytes, we applied a combined micro-spectroscopic characterization using both Raman and infrared spectroscopy. Typical Raman spectra measured on the Si NWs are shown in Figure 3.
In the low frequency region (200 cm−1–550 cm−1), the characteristic peaks of silicon nanowires are visible. In particular, the strong broad peak around 500 cm−1 contains phonon modes of amorphous and crystalline silicon, i.e., the crystalline TO mode (c-TO) at ≈514 cm−1, and the amorphous TO mode (a-TO) and LO mode (a-LO) at ≈495 cm−1 and 480 cm−1, respectively [50,51]. The weak band centeredon 290 cm−1 can be assigned to the 2TA phonon mode of the amorphous silicon [49]. Focusing in the region between 720 cm−1 and 2250 cm−1, it is possible to observe, besides the silicon overtone mode 2TO (at ≈925 cm−1) [52], the characteristic Raman bands of carbon films (1200–1600 cm−1, 2450 cm−1) [53,54,55]. The carbon G and D bands in the range 1200–1600 cm−1 are clearly distinguishable in the samples cycled without additives and with FEC (red and blue spectra in Figure 3, respectively), while they are less pronounced in the VC cycled sample (green spectrum) and in the uncycled one (dark grey spectrum). Carbon signals in the uncycled sample can be due to the synthesis residues of the carbon-containing precursor (squalene), possibly also inducing the local formation of SiC, as also suggested by the shoulder detected at about 790 cm−1 [56]. It is important to mention that the crystallinity of the pristine silicon sample has been already demonstrated by some of us by X-ray diffraction as reported in ref. [15].
Visible white light optical images (Figure 4), acquired by the confocal microscope coupled with the Raman spectrometer, highlight morphological changes in the post mortem samples compared to the uncycled one. Indeed, different from the uncycled sample, where the nanowires are visible and recognizable, in the cycled samples, the nanowire structure is no longer clearly detectable. Indeed, in the samples cycled in the BE electrolyte and in the electrolyte with the FEC additive, some morphological inhomogeneities are observed across the surface (e.g., some structures similar to stripes). Differently, the sample cycled in the electrolyte with VC additiveshows a more homogeneous surface. These features confirm the differences already highlighted in the low magnification SEM images (1000 X) and reported in Figure 2. We can speculate that the alteration of the large-scale morphology is possibly linked to the volume expansion–shrinking mechanisms suffered upon cycling by NWs; we suggest that the surface chemistry driving the passivation film formation is altered by additives likely inducing different mechanical stress.
Raman spectroscopy measurements can provide essential information about the degree of amorphization of the Si NWs. Indeed, the silicon characteristic bands at 480–520 cm−1 result from the contribution of amorphous and crystalline phonons. By deconvoluting this region into the occurring modes, as shown in Figure 5, it is possible to estimate the amorphous fraction (AF) as the ratio between the a–TO and the c–TO peak areas, weighed for the cross-section ratio σ ( c - S i ) σ ( a - S i ) 0.8 , using the following relation [50].
A F = a T O a r e a a T O a r e a + 1.25 c T O a r e a
The superimpositions of the white-light optical microscopic images with the corresponding distribution maps of the amorphous-to-crystalline silicon ratio derived from Raman analysis are shown in Figure 4 for the 10 samples (pristine and post mortem samples after 5, 10 and 50 cycles for all the three electrolytes). For each point of the matrixes, we evaluated from the Raman spectrum the amorphous fraction by means of Equation (1). For each spectrum an uncertainty of 2% on this value was obtained from the fit parameters.
An inhomogeneous distribution of the amorphous fraction inside each map was observed (the statistical distributions obtained after 5, 10 and 50 cycles are reported in Figure 6).
The average values of the four amorphous fraction distributions are summarized in Table 1.
The comparison between the Raman analysis of the amorphous fraction and the optical images (Figure 4) shows that the morphology at the micron-scale slightly correlates with the inhomogeneous distributions of the amorphous silicon fraction in the pristine sample. All electrolytes promote the amorphization of the Si NWs upon cycling. Indeed, for all the electrolytes during cycling, the formation of amorphous silicon occurs, and its amount changes with the number of cycles. Apparently, the use of the FEC additive is able to limit the amorphization in the initial 5 cycles and mitigates its increase after 10 and 50 cycles. On the opposite side, the use of the VC additive promotes the amorphization even after a few cycles. The broader distribution of amorphous-rich area observed upon initial cycling without additives may originate from an inhomogeneous accumulation of the SEI layer throughout the sample. In fact, the formation of thicker-SEI may act as a kinetic hinderance limiting the degree of lithiation upon discharge, thus decreasing the degree of amorphization of silicon after de-lithiation (charge). When the number of cycles increases, instead, an increase of the mean amorphization can be observed for all the electrolytes. Indeed after 50 cycles, an almost complete amorphization is reached for all the electrolytes. However, (see curves at 10 cycles in Figure 4 and Figure 6) the presence of the FEC additive in the electrolytes induces a lower increase rate of the amorphization with the increasing number of cycles.
The amorphization of Si NWs after cycling is of fundamental importance for the performances of the battery. Crystalline silicon particles are able to incorporate only small amounts of lithium ions in reduction, typically confined in the outer shells of the crystallites [57]. Upon lithiation, c-Si particles undergo a simultaneous amorphization [58]. Therefore c-Si is unable to deliver limited reversible capacity beyond 1000 mAh/g [59]: It is expected to convert cycle-by-cycle into a-Si, thus activating additional electrochemical activity.
Raman estimates of the silicon amorphization upon cycling can be combined with the electrochemical data to decouple some of the electro-active phenomena occurring in the electrodes upon cycling. Upon lithium loading, several phenomena contribute to the Qdischarge capacity:
Qdischarge = Qa-Si,red + Qc-Si,red + QSEI,red/mAhg−1
where Qa-Si,red is the capacity delivered by the lithium insertion into the a-Si, Qc-Si,red is the capacity originated from the lithium insertion into the c-Si that leads to its amorphization [59] and QSEI,red is the capacity exchanged in the parasitic reactions leading to the precipitation of the SEI. The Qa-Si,red can be estimated by:
Qa-Si,red = (%a-Si/100) · Qth,Si/mAhg−1
being Qth,Si = 3579 mAhg−1. On the other hand, it is possible to estimate Qc-Si,red by exploiting the Raman evaluation of the a-Si fraction after 5 cycles, namely %a-Si(5). In fact, the a-Si fraction increases, as an example, in the case of the additive-free electrolyte, from %a-Si(pristine) = 49% to %a-Si(5) = 57%, and this implies the amorphization of Δ%amorphization = 8% of the total silicon in 5 cycles, with an amorphization rate a-R = +1.6%total-Si per cycle. This a-R corresponds to an implicit amorphization capacity ΔQamorphization per cycle = a-R · 3579 = 59.3 mAhg−1 in each discharge. Being the increase in the amorphous fraction directly related to the amount of lithium incorporated into the c-Si particles (see the discussion above), this last value is a reasonable evaluation of Qc-Si,red = ΔQamorphization per cycle.
By using these estimates, it is possible to evaluate the fraction of capacity wasted in the parasitic reactions that leads to the SEI growth (QSEI,red) at any cycle number n, namely QSEI,red(n).
QSEI,red(n) = (Qdischarge(n) − Qa-Si,red(n) − ΔQamorphization per cycle)/mAhg−1
It is important to underline that, in view of the amorphization of c-Si upon lithiation, the a-Si fraction after each discharge step of cycle (n) increases. Thus, the fraction of amorphous silicon after n-cycles, i.e., %a-Si(n), is given by:
%a-Si(n) = %a-Si(pristine) + a-R · (n)
Upon charge, three major phenomena contribute to the total capacity, Qcharge:
Qcharge = Qa-Si,ox + QSEI,ox − QLi-trapping(n)/mAhg−1
where Qa-Si,ox is the capacity delivered by the lithium de-insertion from the a-Si, QSEI,ox is the capacity exchanged in the parasitic oxidative reactions involving the SEI and QLi-trapping(n) is the capacity eventually trapped in the electrode due to kinetics constraints in the charge step of cycle (n). In passing, it is important to recall that many authors reported that SEI oxidation between 0 and 1 V versus Li/Li+ is unlikely to occur as the typical SEI components are thermodynamically stable against oxidation at these potentials [60,61,62,63]. However, re-oxidation of the SEI has been reported in a few studies [64,65,66], possibly driven by nanophases formed out of equilibrium. Furthermore, in line with the relevant literature concerning the simultaneous lithiation-amorphization of c-Si (see the above discussion), here we assume that all the lithiated fraction of c-Si is converted into lithiated a-Si and therefore there is not a net contribution upon charge originating from the lithiated c-Si.
In each charge (de-lithiation) step of cycle n, the capacity delivered starting from the lithiated a-Si after the discharge (n) (see Equation (5)) is given by Qa-Si,ox = %a-Si(n) · 3579mAhg−1. Therefore Equation (6) can be reformulated:
Qcharge(n) = (%a-Si(n) · 3579 − QLi-trapping(n)) + QSEI,ox(n)/mAhg−1
where Qcharge(n) can be easily determined experimentally and %a-Si(n) can be estimated byEquation (5). Therefore, it is possible to evaluate the following quantity at any cycle number n:
(QSEI,ox(n) − QLi-trapping(n)) = Qcharge(n) − (%a-Si(n) · 3579)/mAhg−1
This difference can be either positive or negative, depending on the predominant phenomena at cycle (n), i.e., oxidation of the SEI or the lithium trapping. However, we can approximate the total net effect to the sole QSEI,ox(n) or QLi-trapping(n), depending on the sign of the difference estimated by the relation (8). Therefore, it is possible to evaluate the net capacity delivered by the de-lithiation of the a-Si, Qa-Si,red,net, by:
Qa-Si,red,net = Qcharge(n) − ΔQ(n)/mAhg−1
being ΔQ(n) = | Q SEI , ox ( n ) Q Li - trapping ( n ) | , the absolute value of the difference determined by Equation (8).
All these evaluations allow drawing a comprehensive decoupling of the various source of capacity either upon discharge or charge for the three different electrolytes in each cycle. Cumulated results for the first 5 cycles are shown in Table 2.
In summary, the use of additives promotes the capacity delivered by parasitic reactions involving the SEI layer that are partially reversible. In this respect, the FEC additive promotes a stronger degradation of the electrolyte compared to the VC one. In particular, our quantitative evaluation of the QSEI,ox is uncommon in the literature, and the final values observed in the case of the FEC-added electrolyte (24%) areremarkably large. Thus, our evaluations are novel in the landscape of the analysis of the electrochemical lithiation of silicon that typically consider the SEI inactive upon oxidation [60,61,62,63]. Focusing on the overall reduction–oxidation redox reaction mediated by the SEI, it is remarkable to observe that the VC additive also promotes the reversibility both compared to the additive-free and the FEC added electrolytes.
The composition of the post mortem electrolytes has been studied by ATR-FTIR and O-PTIR measurements. Direct experimental evidence of the presence of reduced carbon in the cycled samples has been highlighted in Raman spectra, as previously reported. On the other hand, ATR-FTIR and O-PTIR are more sensitive to organic by-products and therefore can complement the analysis of the chemical fingerprints of the different SEI grown in the different electrolytes.
ATR-FTIR measurements (see Figure 7) suggest a remarkable similarity between the uncycled sample (black) and the sample cycled using the VC-added electrolyte (green). A similar paired ATR-FTIR fingerprint is observed between samples cycled in the BE electrolyte (red) and in the FEC-added one (blue). In the uncycled sample, the wide band between 750 cm−1 and 1100 cm−1 can be related to the presence of Si–O–Si stretching vibration and Si–C fundamental vibration [55], in line with Raman results. The sample cycled in the VC-added electrolyte shows a spectrum very similar to the uncycled one for bands below 1100 cm−1. Here one narrow band at about 800 cm−1 and two weak bands at 940 cm−1 and 1065 cm−1 can be likely assigned to P–F stretching of PF6 as well as the OCOO bending in carbonates [28]. For what concerns the other post mortem samples, ATR-FTIR spectra suggest the presence of two bands in the C–O stretching region between 1280 cm−1 and 1390 cm−1, which could be due to decomposition products of the solvent electrolyte, e.g., diethyl 2,5-dioxahexane dicarboxylate (DEDOHC) and lithium ethylene di-carbonate (LiEDC), respectively [67]. The formation of LiEDC is also confirmed by the band at 1625 cm−1. Furthermore, a broad band at 800 cm−1 can be detected, which could be likely due to the P–F stretching, as well as a weak band at 940 cm−1 possibly assigned to Si–F stretching [68].
The chemical fingerprints identified in the ATR-FTIR spectra are also visible in O-PTIR (lower panel of Figure 7), despite the small frequency shift due to the absence of dispersive artefacts in comparison to ATR. All the cycled samples show a strong peak at 870 cm−1 and a weaker one at 940 cm−1, assigned to P–F and Si–F vibrations. In the C–O frequency region, indeed, three bands at 1435 cm−1, 1500 cm−1 and 1620 cm−1, attributable to the asymmetric and symmetric C=O stretching of decomposition products of EC (Li2CO3), and C=C stretching of unsaturated compounds are clearly recognizable [69]. Moreover, thanks to the remarkable penetration depth of O-PTIR, in the spectral range between 1000 cm−1 and 1200cm−1, the vibration modes of the underlying silicon (SiC and Si–O) are also observed in all samples. In particular, at 990cm−1 the Si–C stretching vibrations occur [70]. It is reasonable to assume that silicon carbide is a synthesis side-product, and its concentration is not affected by cycling. Therefore, the 990 cm−1 peak has been used to normalize all spectral intensity (like in Figure 7) in order to obtain a quasi-quantitative evaluation, considering the O-PTIR amplitude linear proportionality to the number of vibrationalcenters.
The normalized spectra (see Figure 7) indicate that the postmortemsamples collected from BE electrolyte without additives show the highest content of carbonates (1400–1600 cm−1) and LiPF6 decomposition products (870 cm−1). On the other hand, Si NW electrodes cycled with FEC and VC show similar carbonate content but a different content of LiPF6 decomposition residues that is higher for the samples cycled with the FEC-added electrolyte. In summary, Raman, ATR-FTIR and O-PTIR spectroscopies disclose a complex scenario. The Si NW electrodes cycled, without additives, with FEC and VC show different features in terms of silicon amorphization and SEI composition after cycling as summarized in Table 3.
The Si NW electrodes cycled without electrolyte additives show a much larger carbonate content accompanied by the accumulation of F-containing by-products. On the other hand, samples cycled with FEC and VC show a smaller content of electrolyte degradation by-products but a very different silicon amorphization degree, after 5 cycles. This last evidence is compatible with higher first cycle silicon pulverization [71], in line with the larger activation specific capacity measured in the electrochemical first discharge.

4. Conclusions

The use of a combination of morphological and spectroscopic characterizations of Si NWs subject to cycling in Li half cells with different electrolytes based on organic carbonates and LiPF6 salt, with the possible presence of FEC or VC additives, evidenced a complex scenario for the changes induced by the electrochemical tests. Both FEC and VC additives increased the exchanged specific capacity and the reversibility compared to the pure electrolyte. FEC and VC helped in retaining the single nanowire morphology, at least after five charge–discharge cycles, which on the contrary starts to be embedded in a gel-like matrix in the additive-free electrolyte. VC has a beneficial effect also in retaining the morphology on a larger scale (10 μm) compared to the benchmark electrolyte and the FEC added one. Carbon deposits on the electrode surface giving rise to the typical G and D bands in the Raman spectra, with a maximum concentration in the pure electrolyte and in the FEC added. However, VC promotes the amorphization of the Si NWs much more than FEC and more than the pure electrolyte in the first 5 cycles. Less carbonates deposit on the electrode cycled in the electrolyte containing both additives, while the concentration of the LiPF6 products of decomposition decreases in the order BE>FEC>VC. On the other hand, the electrochemical performance upon short-term cycling is slightly improved in the case of the use of the FEC additive. One may speculate about the beneficial balancing of competitive effects on the overall performance in cells, i.e., structural retention, SEI stability, limited electrolyte degradation. In particular, our final message is that FEC, which allows preserving the nanowire morphology and an extended crystalline character of the silicon matrix, seems to be the most suitable additive to carbonate-based electrolytes for a reversible cycling in lithium batteries. However, we would like to stress that the morphology, crystalline character and surface moieties of the silicon nanostructured electrode may have a remarkable role on the SEI stability, being strongly interplayed with the chemical–electrochemical degradation of the electrolyte. Thus, it is likely that each silicon-based nanomaterial requires a tailored electrolyte with specific additives to disclose the optimal performance.

Supplementary Materials

The following supporting information can be downloaded at: https://www.mdpi.com/article/10.3390/batteries9030148/s1, Figure S1. Scanning Electron micrographs at high magnification (35,000 X) of Si NW electrodes uncycled (a) and after 5 galvanostatic cycles in (b) BE electrolyte, (c) FEC-added electrolyte and (d) VC-added electrolyte; Figure S2. Scanning Electron Microscopy low magnification (1000 X) images of (a) pristine Si NW anode, (b) Si NW anode cycled with 1M LiPF6 electrolyte, (c) added with 3% of fluoroethylene carbonate (FEC) or (d) added with 3% of vinylene carbonate (VC) additive.

Author Contributions

Conceptualization, S.B., G.B.A. and A.P.; Data curation, A.S. and O.P.; Formalanalysis, A.S., O.P., N.C. and A.P.; Funding acquisition, K.R. and A.P.; Investigation, A.S., S.B., O.P., F.C., F.B., N.C., S.A.A., H.G., K.R. and A.P.; Methodology, A.P.; Resources, S.A.A., H.G. and K.R.; Validation, G.B.A.; Visualization, S.B.; Writing—original draft, A.S. and S.B.; Writing—review & editing, A.P. All authors have read and agreed to the published version of the manuscript.

Funding

The authors would like to acknowledge the financial support from the European Union Horizon 2020 research and innovation program within the Si-DRIVE project, grant agreement No. 814464, and the CALIPSOplus project, grant agreement No. 730872, for the beamtimes 20210263, 20201395, 20200423 and 20190616 at SOLEIL Synchrotron.

Data Availability Statement

Data are contained within the article or Supplementary Materials.

Conflicts of Interest

The authors declare no conflict of interest.

References

  1. Martinho, F. Challenges for the Future of Tandem Photovoltaics on the Path to Terawatt Levels: A Technology Review. Energy Environ. Sci. 2021, 14, 3840–3871. [Google Scholar] [CrossRef]
  2. Marri, I.; Ossicini, S. Multiple Exciton Generation in Isolated and Interacting Silicon Nanocrystals. Nanoscale 2021, 13, 12119–12142. [Google Scholar] [CrossRef] [PubMed]
  3. Guo, J.; Dong, D.; Wang, J.; Liu, D.; Yu, X.; Zheng, Y.; Wen, Z.; Lei, W.; Deng, Y.; Wang, J.; et al. Silicon-Based Lithium Ion Battery Systems: State-of-the-Art from Half and Full Cell Viewpoint. Adv. Funct. Mater. 2021, 31, 2102546. [Google Scholar] [CrossRef]
  4. Sarkar, A.; Lee, Y.; Ahn, J.-H. Si Nanomebranes: Material Properties and Applications. Nano Res. 2021, 14, 3010–3032. [Google Scholar] [CrossRef]
  5. Liu, C.; Guo, J.; Yu, L.; Li, J.; Zhang, M.; Li, H.; Shi, Y.; Dai, D. Silicon/2D-Material Photodetectors: From near-Infrared to Mid-Infrared. Light Sci. Appl. 2021, 10, 123. [Google Scholar] [CrossRef]
  6. Siffert, P.; Krimmel, E.F. Silicon: Evolution and Future of a Technology; Springer: Berlin, Germany, 2004; p. 549. [Google Scholar]
  7. Kim, H.; Seo, M.; Park, M.H.; Cho, J. A Critical Size of Silicon Nano-Anodes for Lithium Rechargeable Batteries. Angew. Chim. Int. Ed. 2010, 49, 2146–2149. [Google Scholar] [CrossRef]
  8. Su, X.; Wu, Q.; Li, J.; Xiao, X.; Lott, A.; Lu, W.; Sheldon, B.W.; Wu, J. Silicon-Based Nanomaterials for Lithium-Ion Batteries: A Review. Adv. Energy Mater. 2014, 4, 1300882. [Google Scholar] [CrossRef]
  9. Liu, J.; Kopold, P.; van Aken, P.A.; Maier, J.; Yu, Y. Energy Storage Materials from Nature through Nanotechnology: ASustainable Route from Reed Plants to a Silicon Anode for Lithium-Ion Batteries. Angew. Chem. Int. Ed. 2015, 127, 9768–9772. [Google Scholar] [CrossRef]
  10. Jin, Y.; Zhu, B.; Lu, Z.; Liu, N.; Zhu, J. Challenges and Recent Progress in the Development of Si Anodes for Lithium-Ion Battery. Adv. Energy Mater. 2017, 7, 1700715. [Google Scholar] [CrossRef] [Green Version]
  11. Zhang, L.; Wang, C.; Dou, Y.; Cheng, N.; Cui, D.; Du, Y.; Liu, P.; Al-Mamun, M.; Zhang, S.; Zhao, H. A Yolk–Shell Structured Silicon Anode with Superior Conductivity and High Tap Density for Full Lithium-Ion Batteries. Angew. Chem. Int. Ed. 2019, 58, 8824–8828. [Google Scholar] [CrossRef]
  12. Su, H.; Barragan, A.A.; Geng, L.; Long, D.; Ling, L.; Bozhilov, K.N.; Mangolini, L.; Guo, J. Colloidal Synthesis of Silicon–Carbon Composite Material for Lithium-Ion Batteries. Angew. Chem. Int. Ed. 2017, 56, 10780–10785. [Google Scholar] [CrossRef] [Green Version]
  13. Zhou, X.; Liu, Y.; Ren, Y.; Mu, T.; Yin, X.; Du, C.; Huo, H.; Cheng, X.; Zuo, P.; Yin, G. Engineering Molecular Polymerization for Template-Free SiOx/C Hollow Spheres as Ultrastable Anodes in Lithium-Ion Batteries. Adv. Funct. Mater. 2021, 31, 2101145. [Google Scholar] [CrossRef]
  14. Chae, S.; Xu, Y.; Yi, R.; Lim, H.-S.; Velickovic, D.; Li, X.; Li, Q.; Wang, C.; Zhang, J.-G. A Micrometer-Sized Silicon/Carbon Composite Anode Synthesized by Impregnation of Petroleum Pitch in Nanoporous Silicon. Adv. Mater. 2021, 33, 2103095. [Google Scholar] [CrossRef]
  15. Collins, G.A.; Kilian, S.; Geaney, H.; Ryan, K.M. A Nanowire Nest Structure Comprising Copper Silicide and Silicon Nanowires for Lithium-Ion Battery Anodes with High Areal Loading. Small 2021, 17, 2102333. [Google Scholar] [CrossRef] [PubMed]
  16. Lee, H.A.; Shin, M.; Kim, J.; Choi, J.W.; Lee, H. Designing Adaptive Binders for Microenvironment Settings of Silicon Anode Particles. Adv. Mater. 2021, 33, 2007460. [Google Scholar] [CrossRef] [PubMed]
  17. Zhang, G.; Yang, Y.; Chen, Y.; Huang, J.; Zhang, T.; Zeng, H.; Wang, C.; Liu, G.; Deng, Y. A Quadruple-Hydrogen-Bonded Supramolecular Binder for High-Performance Silicon Anodes in Lithium-Ion Batteries. Small 2018, 14, 1801189. [Google Scholar] [CrossRef] [PubMed]
  18. Kwon, T.-W.; Choi, J.W.; Coskun, A. Prospect for Supramolecular Chemistry in High-Energy-Density Rechargeable Batteries. Joule 2019, 3, 662–682. [Google Scholar] [CrossRef] [Green Version]
  19. Boniface, M.; Quazuguel, L.; Danet, J.; Guyomard, D.; Moreau, P.; Bayle-Guillemaud, P. Nanoscale Chemical Evolution of Silicon Negative Electrodes Characterized by Low-Loss STEM-EELS. Nano Lett. 2016, 16, 7381–7388. [Google Scholar] [CrossRef] [Green Version]
  20. Benning, S.; Chen, C.; Eichel, R.A.; Notten, P.H.L.; Hausen, F. Direct Observation of SEI Formation and Lithiation in Thin-Film Silicon Electrodes via in Situ Electrochemical Atomic Force Microscopy. ACS Appl. Energy Mater. 2019, 2, 6761–6767. [Google Scholar] [CrossRef]
  21. Guo, K.; Kumar, R.; Xiao, X.; Sheldon, B.W.; Gao, H. Failure Progression in the Solid Electrolyte Interphase (SEI) on Silicon Electrodes. Nano Energy 2020, 68, 104257. [Google Scholar] [CrossRef]
  22. Dupré, N.; Moreau, P.; de Vito, E.; Quazuguel, L.; Boniface, M.; Bordes, A.; Rudisch, C.; Bayle-Guillemaud, P.; Guyomard, D. Multiprobe Study of the Solid Electrolyte Interphase on Silicon-Based Electrodes in Full-Cell Configuration. Chem. Mater. 2016, 28, 2557–2572. [Google Scholar] [CrossRef] [PubMed] [Green Version]
  23. Bongiorno, C.; Mannino, G.; D’Alessio, U.; Monforte, F.; Condorelli, G.G.; Spinella, C.; La Magna, A.; Brutti, S. On the Redox Activity of the Solid Electrolyte Interphase in the Reduction/Oxidation of Silicon Nanoparticles in Secondary Lithium Batteries. Energy Technol. 2021, 10, 2100791. [Google Scholar] [CrossRef]
  24. Jerliu, B.; Hüger, E.; Dörrer, L.; Seidlhofer, B.K.; Steitz, R.; Oberst, V.; Geckle, U.; Bruns, M.; Schmidt, H. Volume Expansion during Lithiation of Amorphous Silicon Thin Film Electrodes Studied by In-Operando Neutron Reflectometry. J. Phys. Chem. C 2014, 118, 9395–9399. [Google Scholar] [CrossRef]
  25. Veryovkin, I.V.; Tripa, C.E.; Zinovev, A.V.; Baryshev, S.V.; Li, Y.; Abraham, D.P. TOF SIMS Characterization of SEI Layer on Battery Electrodes. Nucl. Instrum. Methods Phys. Res. Sect. B Beam Interact. Mater. At. 2014, 332, 368–372. [Google Scholar] [CrossRef]
  26. Browning, K.L.; Baggetto, L.; Unocic, R.R.; Dudney, N.J.; Veith, G.M. Gas Evolution from Cathode Materials: A Pathway to Solvent Decomposition Concomitant to SEI Formation. J. Power Sources 2013, 239, 341–346. [Google Scholar] [CrossRef]
  27. Lu, P.; Li, C.; Schneider, E.W.; Harris, S.J. Chemistry, Impedance, and Morphology Evolution in SEI Films during Formation in Lithium Ion Batteries. J. Phys. Chem. C 2013, 118, 896–903. [Google Scholar] [CrossRef]
  28. Verma, P.; Maire, P.; Novák, P. A Review of the Features and Analyses of the Solid Electrolyte Interphase in Li-Ion Batteries. Electrochim. Acta 2010, 55, 6332–6341. [Google Scholar] [CrossRef]
  29. Park, S.; Jeong, S.Y.; Lee, T.K.; Park, M.W.; Lim, H.Y.; Sung, J.; Cho, J.; Kwak, S.K.; Hong, S.Y.; Choi, N.-S. Replacing Conventional Battery Electrolyte Additives with Dioxolone Derivatives for High-Energy-Density Lithium-Ion Batteries. Nat. Commun. 2021, 12, 838. [Google Scholar] [CrossRef]
  30. Han, B.; Zhang, Y.; Liao, C.; Trask, S.E.; Li, X.; Uppuluri, R.; Vaughey, J.T.; Key, B.; Dogan, F. Probing the Reactivity of the Active Material of a Li-Ion Silicon Anode with Common Battery Solvents. ACS Appl. Mater. Interfaces 2021, 13, 28017–28026. [Google Scholar] [CrossRef]
  31. Arano, K.; Begic, S.; Chen, F.; Rakov, D.; Mazouzi, D.; Gautier, N.; Kerr, R.; Lestriez, B.; Le Bideau, J.; Howlett, P.C.; et al. Tuning the Formation and Structure of the Silicon Electrode/Ionic Liquid Electrolyte Interphase in Superconcentrated Ionic Liquids. ACS Appl. Mater. Interfaces 2021, 13, 28281–28294. [Google Scholar] [CrossRef] [PubMed]
  32. Wang, H.; Miao, M.; Li, H.; Cao, Y.; Yang, H.; Ai, X. In Situ-Formed Artificial Solid Electrolyte Interphase for Boosting the Cycle Stability of Si-Based Anodes for Li-Ion Batteries. ACS Appl. Mater. Interfaces 2021, 13, 22505–22513. [Google Scholar] [CrossRef] [PubMed]
  33. Roland, A.; Delarre, B.; Ledeuil, J.B.; Louvain, N.; Martinez, H.; Monconduit, L. Silicon-Based Electrodes Formulation in Buffered Solution for Enhanced Electrode-Electrolyte Interfaces. J. Power Sources 2021, 489, 229465. [Google Scholar] [CrossRef]
  34. Jaumann, T.; Balach, J.; Klose, M.; Oswald, S.; Eckert, J.; Giebeler, L. Role of 1,3-Dioxolane and LiNO3 Addition on the Long Term Stability of Nanostructured Silicon/Carbon Anodes for Rechargeable Lithium Batteries. J. Electrochem. Soc. 2016, 163, A557–A564. [Google Scholar] [CrossRef]
  35. Szczech, J.R.; Jin, S. Nanostructured Silicon for High Capacity Lithium Battery Anodes. Energy Environ. Sci. 2011, 4, 56–72. [Google Scholar] [CrossRef]
  36. Gao, H.; Xiao, L.; Plümel, I.; Xu, G.L.; Ren, Y.; Zuo, X.; Liu, Y.; Schulz, C.; Wiggers, H.; Amine, K.; et al. Parasitic Reactions in Nanosized Silicon Anodes for Lithium-Ion Batteries. Nano Lett. 2017, 17, 1512–1519. [Google Scholar] [CrossRef]
  37. Wang, J.; Xu, T.; Huang, X.; Li, H.; Ma, T. Recent Progress of Silicon Composites as Anode Materials for Secondary Batteries. RSC Adv. 2016, 6, 87778–87790. [Google Scholar] [CrossRef]
  38. Pan, K.; Zou, F.; Canova, M.; Zhu, Y.; Kim, J.H. Comprehensive Electrochemical Impedance Spectroscopy Study of Si-Based Anodes Using Distribution of Relaxation Times Analysis. J. Power Sources 2020, 479, 229083. [Google Scholar] [CrossRef]
  39. Ezzedine, M.; Zamfir, M.-R.; Jardali, F.; Leveau, L.; Caristan, E.; Ersen, O.; Cojocaru, C.-S.; Florea, I. Insight into the Formation and Stability of Solid Electrolyte Interphase for Nanostructured Silicon-Based Anode Electrodes Used in Li-Ion Batteries. ACS Appl. Mater. Interfaces 2021, 13, 24734–24746. [Google Scholar] [CrossRef]
  40. Nangir, M.; Massoudi, A.; Tayebifard, S.A. Investigation of the Lithium-Ion Depletion in the Silicon-Silicon Carbide Anode/Electrolyte Interface in Lithium-Ion Battery via Electrochemical Impedance Spectroscopy. J. Electroanal. Chem. 2020, 873, 114385. [Google Scholar] [CrossRef]
  41. Hasa, I.; Haregewoin, A.M.; Zhang, L.; Tsai, W.-Y.; Guo, J.; Veith, G.M.; Ross, P.N.; Kostecki, R. Electrochemical Reactivity and Passivation of Silicon Thin-Film Electrodes in Organic Carbonate Electrolytes. ACS Appl. Mater. Interfaces 2020, 12, 40879–40890. [Google Scholar] [CrossRef] [PubMed]
  42. Imtiaz, S.; Amiinu, I.S.; Storan, D.; Kapuria, N.; Geaney, H.; Kennedy, T.; Ryan, K.M. Dense Silicon Nanowire Networks Grown on a Stainless-Steel Fiber Cloth: A Flexible and Robust Anode for Lithium-Ion Batteries. Adv. Mater. 2021, 33, 2105917. [Google Scholar] [CrossRef]
  43. Flynn, G.; Stokes, K.; Ryan, K.M. Low Temperature Solution Synthesis of Silicon, Germanium and Si–Ge Axial Heterostructures in Nanorod and Nanowire Form. Chem. Commun. 2018, 54, 5728–5731. [Google Scholar] [CrossRef] [PubMed]
  44. Kennedy, T.; Brandon, M.; Laffir, F.; Ryan, K.M. Understanding the Influence of Electrolyte Additives on the Electrochemical Performance and Morphology Evolution of Silicon Nanowire Based Lithium-Ion Battery Anodes. J. Power Sources 2017, 359, 601–610. [Google Scholar] [CrossRef]
  45. Abràmoff, M.D.; Magalhães, P.J.; Ram, S.J. Image Processing with ImageJ. Biophotonics Int. 2004, 11, 36–41. [Google Scholar]
  46. Zhang, X.; Wang, D.; Qiu, X.; Ma, Y.; Kong, D.; Müllen, K.; Li, X.; Zhi, L. Stable High-Capacity and High-Rate Silicon-Based Lithium Battery Anodes upon Two-Dimensional Covalent Encapsulation. Nat. Commun. 2020, 11, 3826. [Google Scholar] [CrossRef]
  47. Fu, C.; Song, C.; Liu, L.; Zhao, W.; Xie, X. High Reversible Silicon/Graphene Nanocomposite Anode for Lithium-Ion Batteries. Int. J. Electrochem. Sci. 2016, 11, 154–164. [Google Scholar]
  48. Kim, G.-T.; Kennedy, T.; Brandon, M.; Geaney, H.; Ryan, K.M.; Passerini, S.; Appetecchi, G.B. Behavior of Germanium and Silicon Nanowire Anodes with Ionic Liquid Electrolytes. ACS Nano 2017, 11, 5933–5943. [Google Scholar] [CrossRef] [PubMed]
  49. Geaney, H.; Mullane, E.; Ryan, K.M. Solution phase synthesis of silicon and germanium nanowires. J. Mater. Chem. C 2013, 1, 4996–5007. [Google Scholar] [CrossRef]
  50. Smit, C.; van Swaaij, R.A.C.M.M.; Donker, H.; Petit, A.M.H.N.; Kessels, W.M.M.; van de Sanden, M.C.M. Determining the Material Structure of Microcrystalline Silicon from Raman Spectra. J. Appl. Phys. 2003, 94, 3582. [Google Scholar] [CrossRef] [Green Version]
  51. Li, B.; Yu, D.; Zhang, S. Raman Spectral Study of Silicon Nanowires. Phys. Rev. B 1999, 59, 1645. [Google Scholar] [CrossRef]
  52. Wang, R.; Zhou, G.; Liu, Y.; Pan, S.; Zhang, H.; Yu, D.; Zhang, Z. Raman Spectral Study of Silicon Nanowires: High-Order Scattering and Phonon Confinement Effects. Phys. Rev. B 2000, 61, 16827. [Google Scholar] [CrossRef] [Green Version]
  53. Merlen, A.; Buijnsters, J.G.; Pardanaud, C. Coatings A Guide to and Review of the Use of Multiwavelength Raman Spectroscopy for Characterizing Defective Aromatic Carbon Solids: From Graphene to Amorphous Carbons. Coatings 2017, 7, 153. [Google Scholar] [CrossRef]
  54. Chu, P.K.; Li, L. Characterization of Amorphous and Nanocrystalline Carbon Films. Mater. Chem. Phys. 2006, 96, 253–277. [Google Scholar] [CrossRef]
  55. Cabo-Fernandez, L.; Mueller, F.; Passerini, S.; Hardwick, L.J. In Situ Raman Spectroscopy of Carbon-Coated ZnFe2O4 Anode Material in Li-Ion Batteries—Investigation of SEI Growth. Chem. Commun. 2016, 52, 3970–3973. [Google Scholar] [CrossRef] [PubMed] [Green Version]
  56. Kukushkin, S.A.; Osipov, A.V. Separation of III-N/SiC Epitaxial Heterostructure from a Si Substrate and Their Transfer to Other Substrate Types. Semiconductors 2017, 51, 396–401. [Google Scholar] [CrossRef]
  57. Seidlhofer, B.K.; Jerliu, B.; Trapp, M.; Hüger, E.; Risse, S.; Cubitt, R.; Schmidt, H.; Steitz, R.; Ballauff, M. Lithiation of Crystalline Silicon As Analyzed by Operando Neutron Reflectivity. ACS Nano 2016, 10, 7458–7466. [Google Scholar] [CrossRef]
  58. Graf, M.; Berg, C.; Bernhard, R.; Haufe, S.; Pfeiffer, J.; Gasteiger, H.A. Effect and Progress of the Amorphization Process for Microscale Silicon Particles under Partial Lithiation as Active Material in Lithium-Ion Batteries. J. Electrochem. Soc. 2022, 169, 020536. [Google Scholar] [CrossRef]
  59. Obrovac, M.N.; Christensen, L. Structural Changes in Silicon Anodes during Lithium Insertion/Extraction. Electrochem. Solid-State Lett. 2004, 7, A93. [Google Scholar] [CrossRef]
  60. Tang, M.; Newman, J. Why is the Solid-Electrolyte-Interphase Selective? Through-Film Ferrocenium Reduction on Highly Oriented Pyrolytic Graphite. J. Electrochem. Soc. 2012, 159, A1922. [Google Scholar] [CrossRef]
  61. Besenhard, J.O.; Winter, M. Advances in Battery Technology: Rechargeable Magnesium Batteries and Novel Negative-Electrode Materials for Lithium Ion Batteries. ChemPhysChem 2002, 3, 155–159. [Google Scholar] [CrossRef]
  62. Attia, P.M.; Das, S.; Harris, S.; Bazant, M.Z.; Chueh, W.C. Electrochemical Kinetics of SEI Growth on Carbon Black: Part I. Experiments. J. Electrochem. Soc. 2019, 166, E97. [Google Scholar] [CrossRef] [Green Version]
  63. Borodin, O.; Ren, X.; Vatamanu, J.; von Wald Cresce, A.; Knap, J.; Xu, K. Modeling Insight into Battery Electrolyte Electrochemical Stability and Interfacial Structure. Acc. Chem. Res. 2017, 50, 2886–2894. [Google Scholar] [CrossRef]
  64. Huang, W.; Wang, J.; Braun, M.R.; Zhang, Z.; Li, Y.; Boyle, D.T.; McIntyre, P.C.; Cui, Y. Dynamic Structure and Chemistry of the Silicon Solid-Electrolyte Interphase Visualized by Cryogenic Electron Microscopy. Matter 2019, 1, 1232–1245. [Google Scholar] [CrossRef] [Green Version]
  65. Zhuo, Z.; Lu, P.; Delacourt, C.; Qiao, R.; Xu, K.; Pan, F.; Harris, S.J.; Yang, W. Breathing and oscillating growth of solid-electrolyte-interphase upon electrochemical cycling. Chem. Commun. 2018, 54, 814–817. [Google Scholar] [CrossRef] [PubMed] [Green Version]
  66. Liu, T.; Lin, L.; Bi, X.; Tian, L.; Liu, J.; Li, M.; Chen, Z.; Lu, J.; Amine, K.; Xu, K.; et al. In situ quantification of interphasial chemistry in Li-ion battery. Nat. Nanotech 2019, 14, 50–56. [Google Scholar] [CrossRef] [PubMed]
  67. Ahoulou, S.; Perret, E.; Nedelec, J.M. Functionalization and Characterization of Silicon Nanowires for Sensing Applications: A Review. Nanomaterials 2021, 11, 999. [Google Scholar] [CrossRef]
  68. Profatilova, I.A.; Stock, C.; Schmitz, A.; Passerini, S.; Winter, M. Enhanced Thermal Stability of a Lithiated Nano-Silicon Electrode by Fluoroethylene Carbonate and Vinylene Carbonate. J. Power Sources 2013, 222, 140–149. [Google Scholar] [CrossRef]
  69. Shi, F.; Ross, P.N.; Somorjai, G.A.; Komvopoulos, K. The Chemistry of Electrolyte Reduction on Silicon Electrodes Revealed by in Situ ATR-FTIR Spectroscopy. J. Phys. Chem. C 2017, 121, 14476–14483. [Google Scholar] [CrossRef] [Green Version]
  70. Kleinová, A.; Huran, J.; Sasinková, V.; Perný, M.; Šály, V.; Packa, J. FTIR Spectroscopy of Silicon Carbide Thin Films Prepared by PECVD Technology for Solar Cell Application. In Proceedings of the Reliability of Photovoltaic Cells, Modules, Components, and Systems VIII, San Diego, CA, USA, 9–13 August 2015; Volume 9563, pp. 166–173. [Google Scholar] [CrossRef]
  71. Key, B.; Bhattacharyya, R.; Morcrette, M.; Seznéc, V.; Tarascon, J.M.; Grey, C.P. Real-Time NMR Investigations of Structural Changes in Silicon Electrodes for Lithium-Ion Batteries. J. Am. Chem. Soc. 2009, 131, 9239–9249. [Google Scholar] [CrossRef]
Figure 1. Discharge–charge cycling performance of Si NW electrodes at 0.2 C using: (a) the BE electrolyte; (b) the FEC added electrolyte; (c) the VC added electrolyte. (d) Specific capacity, (e) cumulative irreversible capacities in the first 5 cycles and (f) coulombic efficiencies.
Batteries 09 00148 g001
Figure 2. Scanning Electron Microscopy medium magnification (5000 X) images of (a) pristine Si NW anode, (b) Si NW anode cycled with 1M LiPF6 electrolyte, (c) added with 3% of fluoroethylene carbonate (FEC) or (d) added with 3% of vinylene carbonate (VC) additive.
Batteries 09 00148 g002
Figure 3. Raman spectra of the Si NW electrodes, before and after 5 cycles in the 3electrolytes. Spectra in the region between 720 cm−1 and 2550 cm−1 have been magnified by a scaling factor of 10.
Batteries 09 00148 g003
Figure 4. Superimposition of the white-light visible microscopy images and of the Raman maps obtained from amorphous fraction (color palette: blue-green-yellow-red passing from low to high amorphous-to-crystalline ratio). As explained in the text, the amorphous fraction was derived from the ratio between the areas of amorphous and crystalline silicon peaks. Results are reported for the pristine materials and for electrodes collected after cycling using different formulation of the electrolyte. The <AF> values reported over the images are the estimated means of the amorphous fractions derived from all the measured spectra (see text for more details). GC stands for galvanostatic cycling.
Batteries 09 00148 g004
Figure 5. Examples of Raman spectra fit for spectra collected after five lithiation–de-lithiation cycles in (a) on pristine Si NW anode, (b) Si NW anode cycled with 1M LiPF6 electrolyte, (c) added with 3% of fluoroethylene carbonate (FEC) or (d) added 3% of vinylene carbonate (VC). The resulting Raman maps have been obtained from the ratio between the areas of amorphous silicon TO peak (green) and crystalline silicon TO peak (red).
Batteries 09 00148 g005
Figure 6. Comparison of the distribution of amorphous fraction (in steps of 0.1) of the Si NW samples, before (pristine) and after 5, 10 and 50 lithiation–de-lithiation cycles in the three different electrolytes (BE, FEC and VC).
Batteries 09 00148 g006
Figure 7. Comparison between ATR-FTIR spectra (top panel) and O-PTIR spectra (bottom panel) of the Si NW electrodes, before and after cycling in the three electrolytes. O-PTIR spectra are normalized at photothermal amplitude of Si–C stretching vibration (990 cm−1).
Batteries 09 00148 g007
Table 1. Mean values of the amorphous fraction (in %) for the four samples obtained from the analysis of the Raman maps shown in Figure 4.
Pristine Si NWs
49
Post mortem samplesAfter 5 cyclesAfter 10 cyclesAfter 50 cycles
BE578094
FEC-added electrolyte527189
VC-added electrolyte669094
Table 2. Decoupling of the various sources of capacity during the first 5 cycles for the three different electrolytes (% of the total cumulative capacities in cycles 1–5).
ElectrolyteLithiation Reactions (Reductions, Discharges)De-Lithiation Reactions (Oxidations, Charges)
Qa-Si,redQc-Si,redQSEI,redQa-Si,red,netQLi-trappingQSEI,ox
BE82%3%16%83%1%6%
FEC-added electrolyte67%1%32%68%0%24%
VC-added electrolyte73%4%22%78%0%14%
Table 3. Summary of the most relevant experimental features obtained from the multi-spectroscopy analysis on the Si NW electrodes collected after 5 galvanostatic cycles.
SampleAmorphizationCarbonate ContentLiPF6 Decomposition Residues Content
uncycledlowabsentabsent
post mortemBEmediumhighhigh
FEC-added electrolytelowmediummedium
VC-added electrolytehighmediumlow
Disclaimer/Publisher’s Note: The statements, opinions and data contained in all publications are solely those of the individual author(s) and contributor(s) and not of MDPI and/or the editor(s). MDPI and/or the editor(s) disclaim responsibility for any injury to people or property resulting from any ideas, methods, instructions or products referred to in the content.

