Article

Two-Step Solid State Synthesis of Medium Entropy LiNi0.5Mn1.5O4 Cathode with Enhanced Electrochemical Performance

Anhui Provincial Key Laboratory of Advanced Functional Materials and Devices, School of Materials Science and Engineering, Hefei University of Technology, Hefei 230009, China
*
Author to whom correspondence should be addressed.
Batteries 2023, 9(2), 91; https://doi.org/10.3390/batteries9020091
Submission received: 2 December 2022 / Revised: 26 January 2023 / Accepted: 26 January 2023 / Published: 29 January 2023
(This article belongs to the Section Battery Performance, Ageing, Reliability and Safety)

Abstract

:
Solid state reaction is widely used in the synthesis of electrode materials, due to its low cost and good scalability. However, the traditional solid-state reaction is not suitable for the synthesis of materials with multiple elements, such as high entropy or medium entropy materials, due to the poor homogeneity of raw material mixing. Here, we prepared multi-element doped LiNi0.5Mn1.5O4 (medium entropy) cathode material by two step solid state reaction. X-ray diffraction and Raman image show that the homogeneity of multi-element doped LiNi0.5Mn1.5O4 cathode has been greatly improved with this two-step method. As a result, the electrochemical performance is greatly improved, comparing to traditional solid-state reaction. First, the specific capacity at 0.1 C is increased from 126 mAh/g to 137 mAh/g. With a high current density of 10 C, the specific capacity is even increased from 64 mAh/g to 89 mAh/g with this two-step method. Second, the cycle stability is enhanced, with capacity retention of 86% after cycling at 1 C for 500 times (vs. 71% for the one-step method).

1. Introduction

With rapid development of electric vehicles and large-scale energy storage system, it is urgent to develop a new generation of lithium-ion batteries (LIBs) cathode materials with high energy density and power density. Spinel LiNi0.5Mn1.5O4 (LNMO) has high energy density due to its high operating voltage (4.7 V vs. Li/Li+) and theoretical specific capacity (147 mAh/g), as well as high-rate performance due to its three-dimensional (3D) channels for lithium-ion diffusion [1,2]. Therefore, LNMO is considered to be a good candidate for the next generation of commercial cathode materials and attracted much attention in the past decade [3,4].
However, LNMO cathode suffers from fast capacity decay, which originates from irreversible structure change, transition metal ions dissolution and surface side reactions to liquid electrolytes. It is reported that transition metal ions such as Ni2+ and Mn4+ migrate from 16d site to 16c site during cycling, leading to irreversible structure change from spinel to rock salt structure [5]. Meanwhile, Ni2+ and Mn2+ (the latter obtained by disproportionation of Mn3+) are easily to dissolve in liquid electrolytes [6]. Those changes will lead to capacity attenuation of LNMO cathode. In addition, liquid electrolytes continuously decompose on the surface of LNMO cathode [7], dissolved transition metal ions deposit on the surface of electrode materials [8], both cause the increase of interfacial resistance, large over potential and fast capacity decay. Heteroion doping is an efficient way to improve the electrochemical performance of LNMO, including Mg2+, Al3+, Fe3+, Cr3+, Zr4+, Ti4+ etc. [9,10,11]. On the one hand, heteroion doping can stabilize the disordered structure (Fd 3 ¯ m) of LNMO cathode [12], which can reduce the stress and crack growth during charging and discharging [13]. On the other hand, some cation doping, such as Mg2+, Al3+, Sb5+, etc. [14], can inhibit the migration of transition metal ions from 16d to 16c site, thus inhibiting the transition from spinel structure to rock salt structure.
At present, different synthesis methods have been applied to prepare doped LNMO, including solid state reaction [15], sol-gel [16], co-precipitation [17] and so on. Among them, solid state reaction has become the most promising method, due to its low cost and simple operation. In solid state reaction, different transition metal ions need to diffuse through the phase interface and the bulk phase of the product, which is always micrometers and takes long time to achieve uniform mixing between transition metal ions [18]. As a result, the solid phase reaction is not a homogeneous phase reaction, especially when a variety of transition metal ions participate in the reaction together, the diffusion resistance will be greater and the diffusion rate gets slow [19,20], which may lead to the inhomogeneous phase distribution of the synthesized multi-element doped (high entropy or medium entropy) LNMO in different regions. Therefore, the multi-element doped LNMO electrode materials prepared by direct solid-state synthesis often display weak electrochemical performance and the solid phase synthesis process needs to be further optimized.
In this work, we propose a two-step solid state reaction process to prepare multi-element doped electrode materials LiNi0.475Co0.025Cr0.025Al0.025Mn1.45O4−x (LNCCAMO). First, precursor Ni0.475Co0.025Cr0.025Al0.025Mn1.45O4−x (NCCAMO) was synthesized by traditional solid phase ball milling and high-temperature sintering. Then the precursor and lithium source were fully mixed and calcined again to finally produce a uniform multi-element doped spinel cathode material LNCCAMO. The medium-entropy cathode material prepared by this method with a variety of transition metals are found to have more homogeneous Fd 3 ¯ m disordered spinel structure distribution and improve electrochemical performance.

2. Experimental

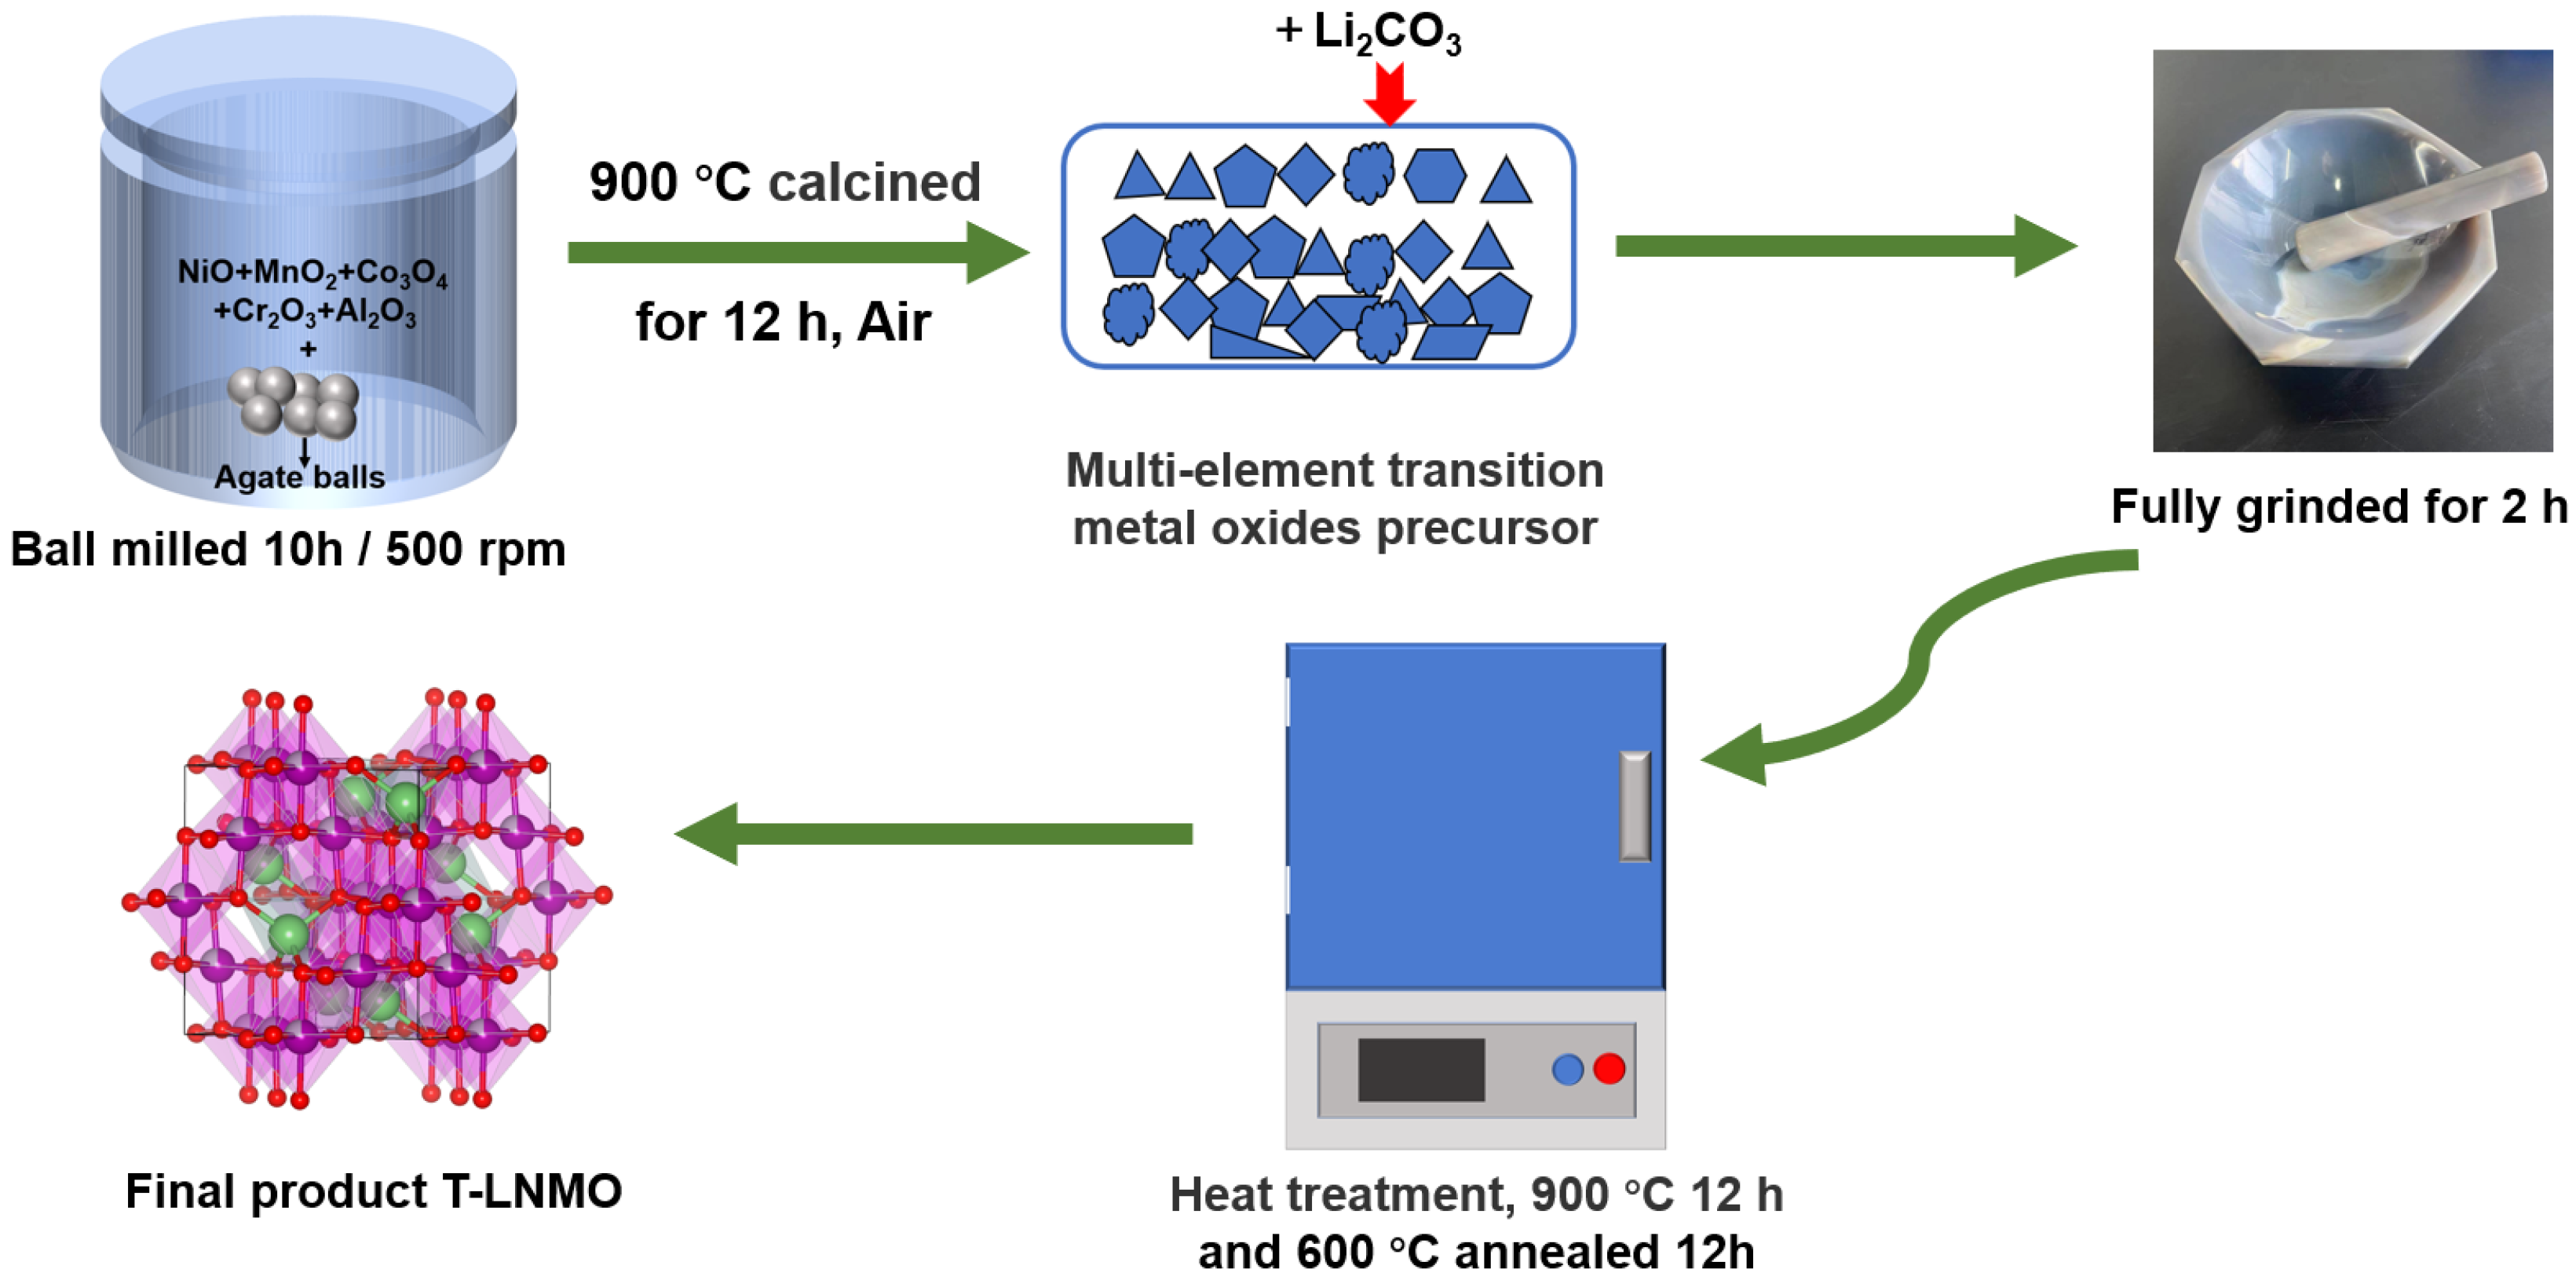
2.1. Material Synthesis

Multi-element doped cathode materials were prepared by one-step and two-step solid state reaction respectively. For two-step synthesis (T-LNMO), chemicals NiO (Aladdin, shanghai, China, 99.99%), MnO2 (Aladdin, 99.99%), Co3O4 (Aladdin, 99.99%), Cr2O3 (Aladdin, 99.99%), Al2O3 (Aladdin, 99.99%), anhydrous ethanol (Sinopharm, shanghai, China, purity ≥ 99.7%) were ball milled with a planetary ball milling machine (QM-3SP2) for 10 h at a speed of 500 r/min, the molar ratio of various oxides was in accordance with the molecular formula Ni0.475Co0.025Cr0.025Al0.025Mn1.45O4−x. The mixed slurry was then transferred into the oven at 100 °C and dried for 8 h, and the powder was presintered at 900 °C (air atmosphere) for 12 h and grinded fully to receive precursor Ni0.475Co0.025Cr0.025Al0.025Mn1.45O4−x. The x in Ni0.475Co0.025Cr0.025Al0.025Mn1.45O4−x was determined by the weight loss before and after high temperature sintering. Then Li2CO3 (5% excess, Sinopharm, 99.99%) and Ni0.475Co0.025Cr0.025Al0.025Mn1.45O4−x were well grinded and sintered again (500 °C presintered for 12 h, 900 °C sintered for 12 h and 600 °C annealed for 12 h, air atmosphere) to get two-step synthesis LiNi0.475Co0.025Cr0.025Al0.025Mn1.45O4−x (See Figure 1 for the preparation process). To get one-step synthesis (LNMO), chemicals Li2CO3 (5% excess), NiO, MnO2, Co3O4, Cr2O3, Al2O3 and anhydrous ethanol were directly ball-milled together, and dried in the same way as two-step synthesis. High temperature sintering step is also consistent with T-LNMO (500 °C presintered for 12 h, 900 °C sintered for 12 h and 600 °C annealed for 12 h, air atmosphere).

2.2. Characterization Methods

The crystal structure of the products was studied by X-ray diffraction (XRD) on a fixed target X-ray diffractometer. The Micro confocal laser Raman spectrometer (HORIBA JOBIN YVON) was used to explore the crystal structure differences of both samples and adopt Raman imaging to investigate the homogeneous degree of the crustal structure distribution. The morphology and element distribution of both samples were investigated by field-emission scanning electron microscopy (SEM) (Hitachi, Japan), energy-dispersive X-ray spectroscopy (EDS) (Bruker Quantax, Germany), and high-resolution trans- mission electron microscopy (TEM) (JEM-2100F, Japan). The surface chemical states of two samples were determined by X-ray photoelectron spectroscopy (XPS, Thermo, Waltham, MA, USA) with Al Kα radiation (1486.6 eV) as the X-ray source.

2.3. Cell Assemble and Test

The electrodes with one-step and two-step powder were prepared by spreading a slurry composed of 80% active materials, 10% poly (vinylidene difluoride) (PVDF) and 10% superconducting carbon onto an alumina foil and then dried at 70 °C in a vacuum for 24 h. The mass loadings of the electrodes on Al foil were kept at ~4 mg cm−2. 2032-type coin cells were made up of the as-prepared electrodes as the cathode, lithium metal as the anode, polypropylene as the separator, and the solution of 1mol/L LiPF6 in ethylene carbonate/diethyl carbonate (1/1 by weight) as the electrolyte in all the cells.
Electrochemical measurements of all cells were recorded by Neware battery test system. The cyclic voltammograms (CV) and electrochemical impedance spectrum (EIS) were tested using the electrochemical workstation (CHI660E).

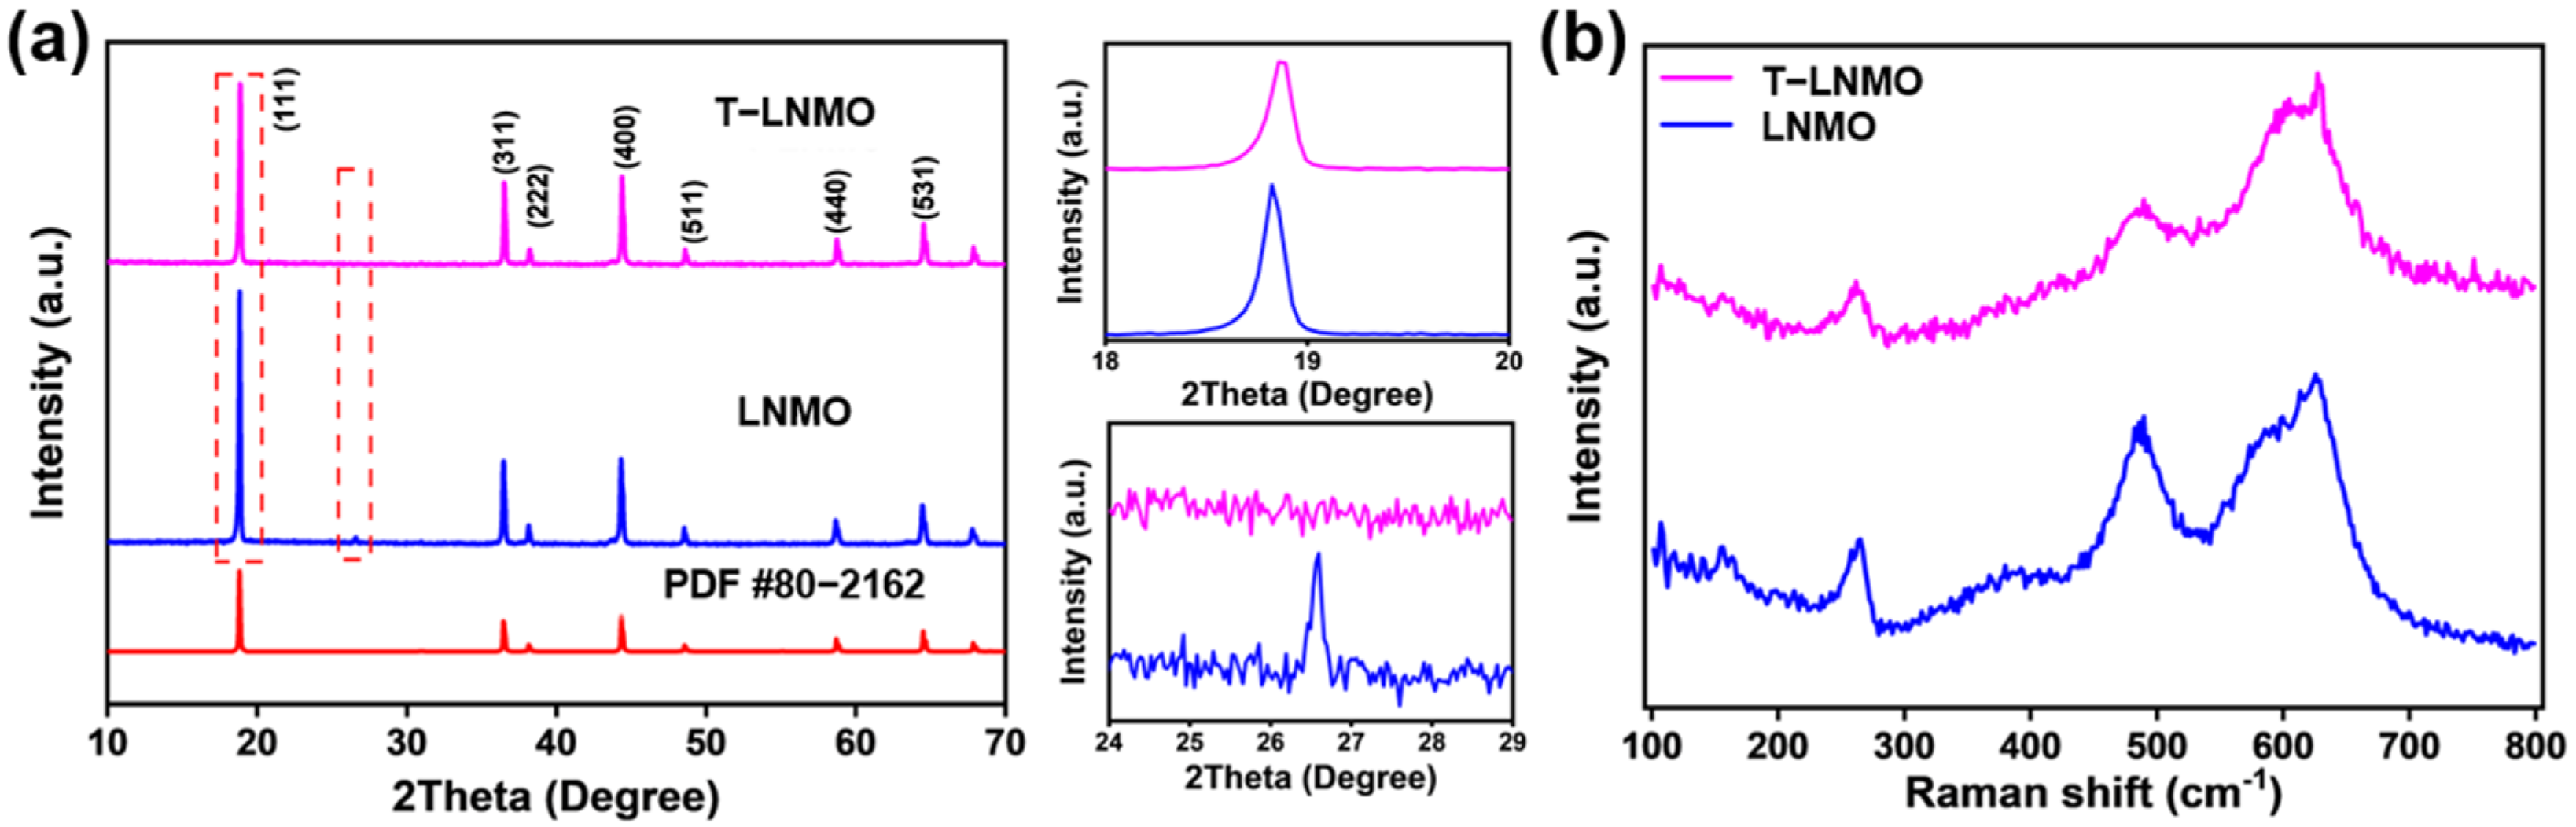
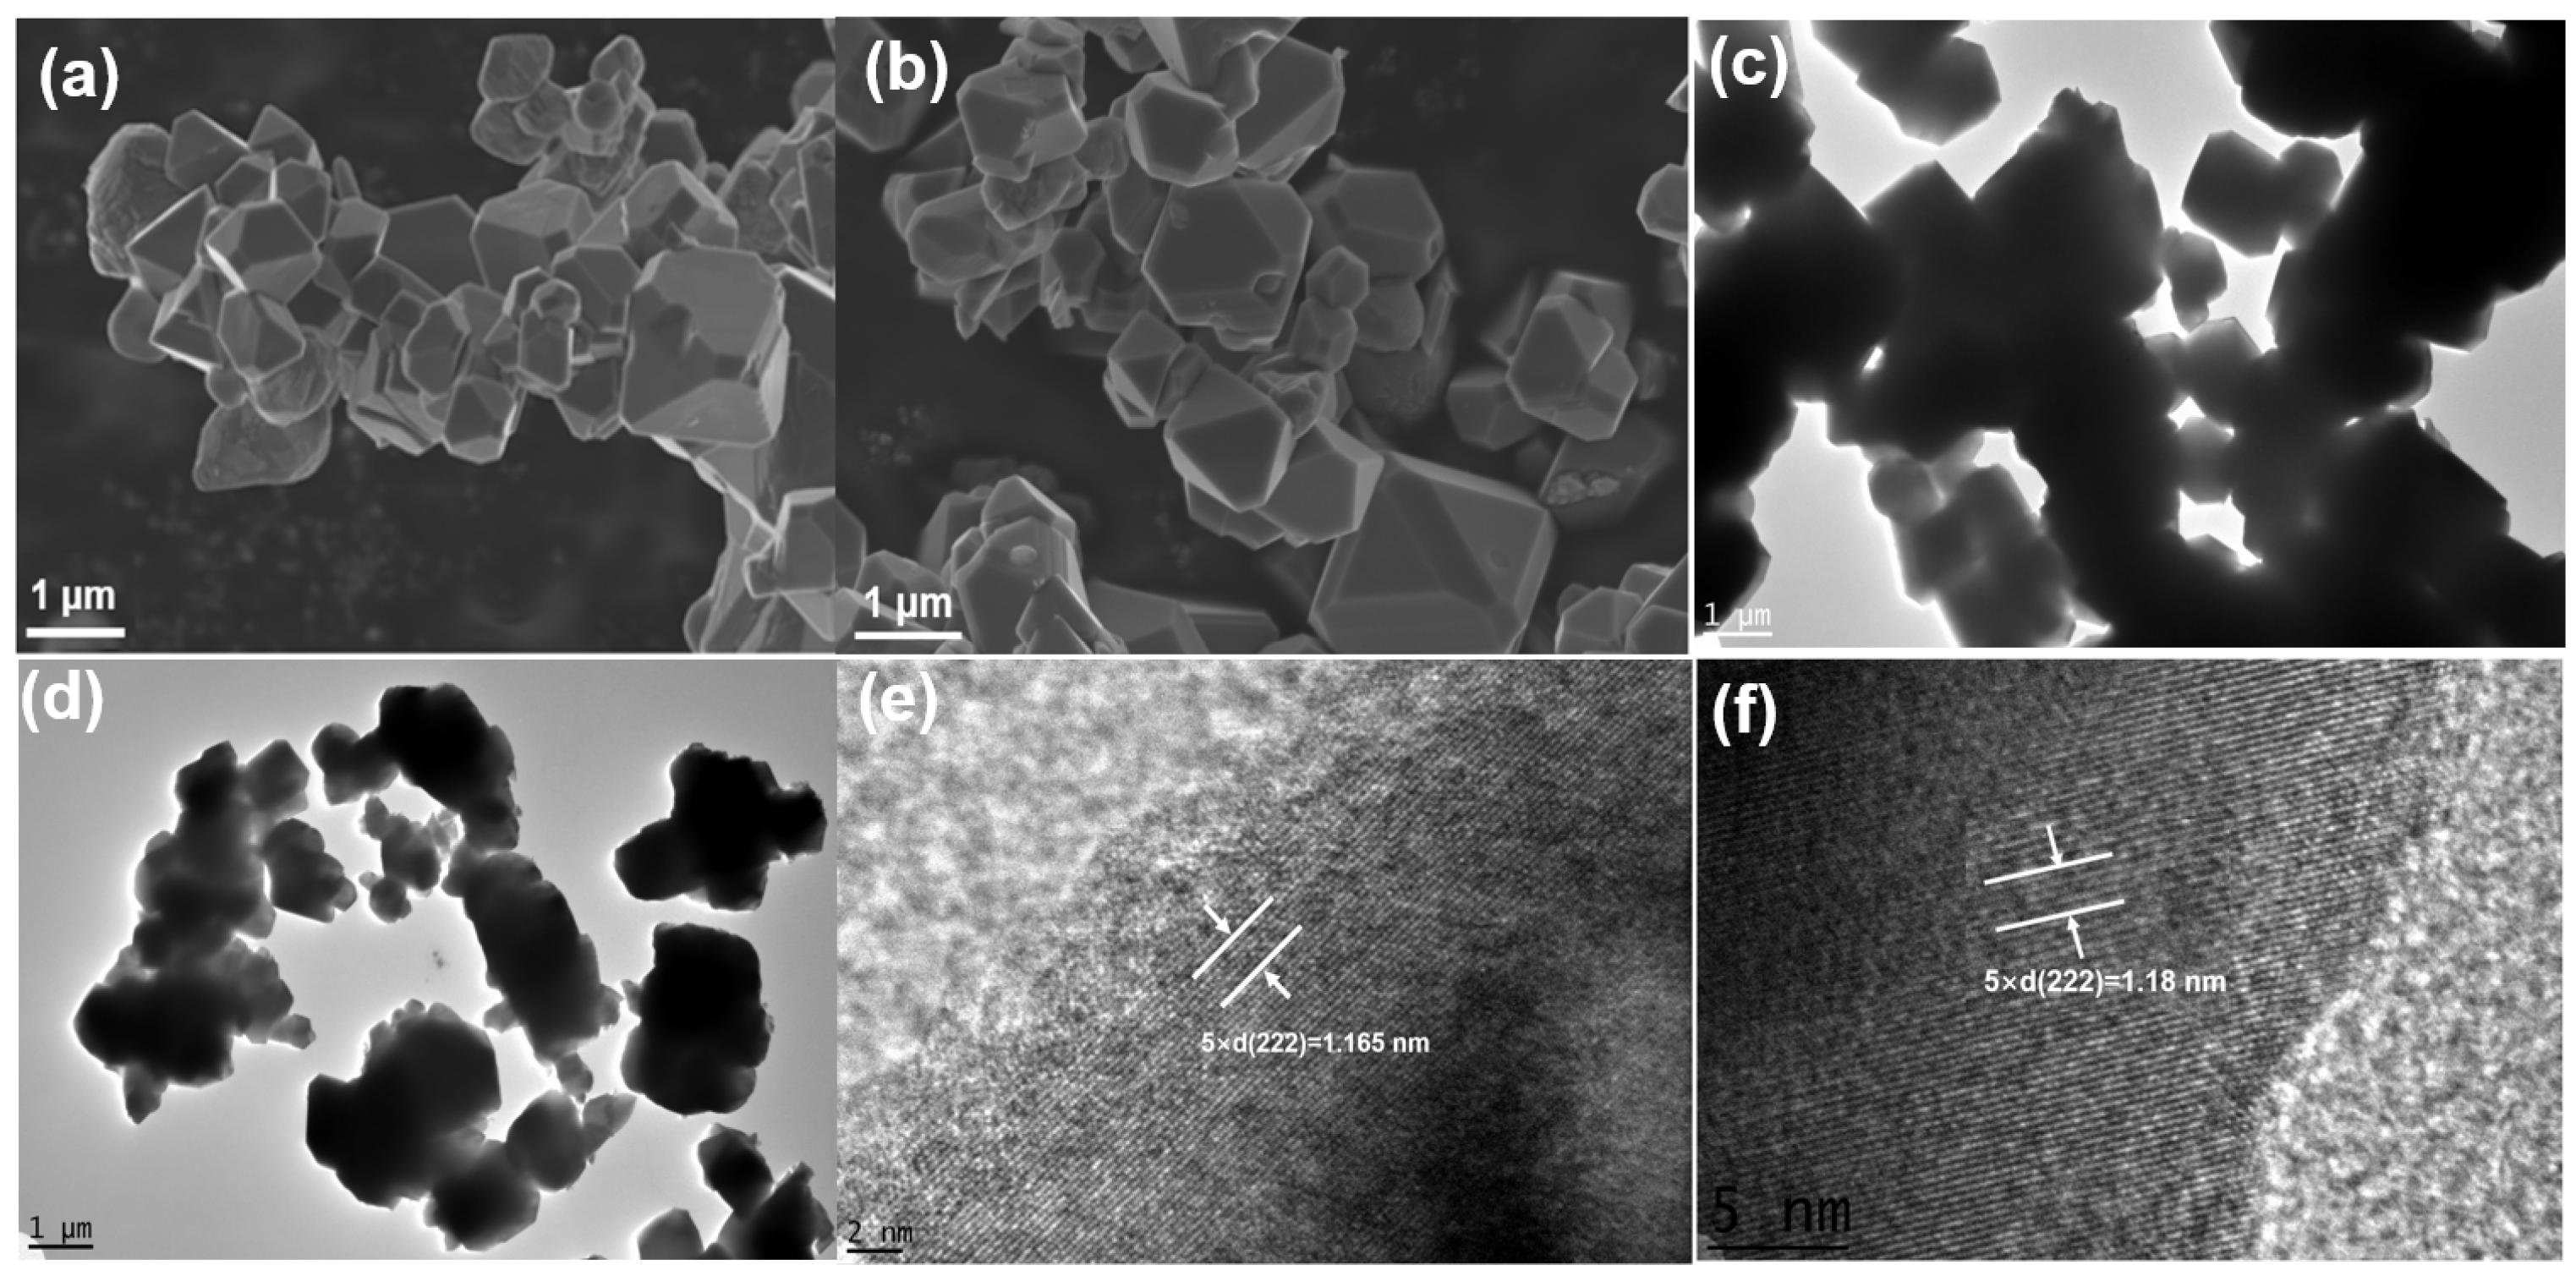
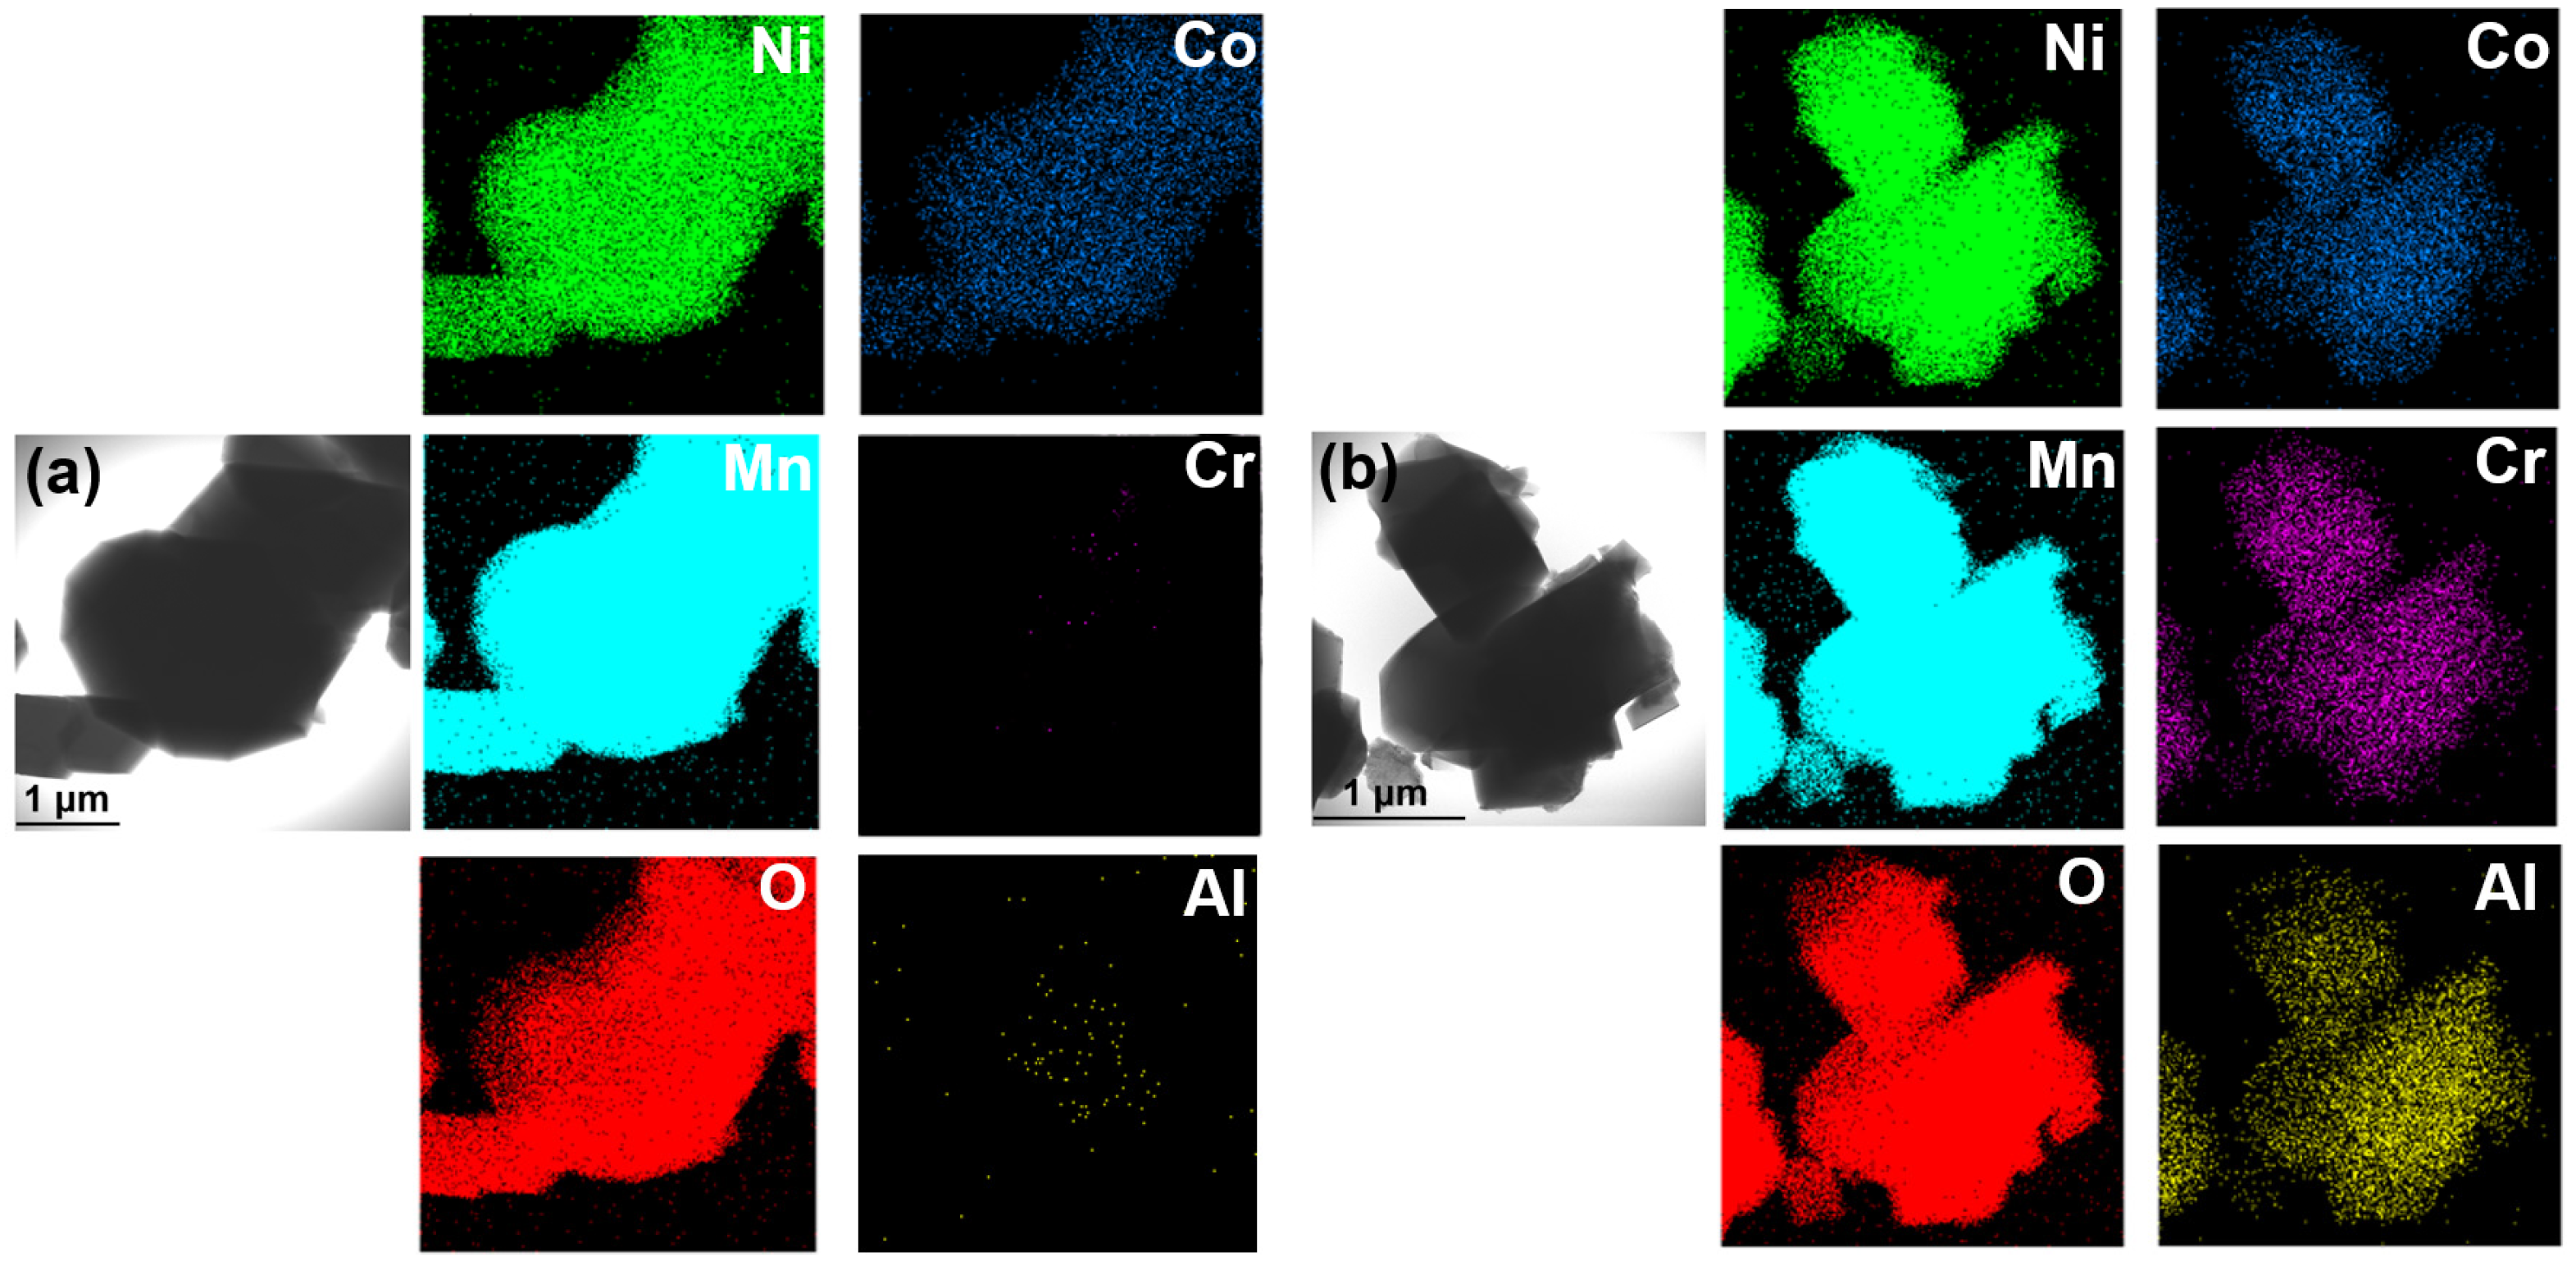
3. Results and Discussion

The X-ray diffraction patterns of LNMO and T-LNMO are presented in Figure 2a. It can be found that the diffraction peaks of the two samples are well consistent with that of LiNi0.5Mn1.5O4 with Fd 3 ¯ m structure through the equal proportion doping of Co, Cr and Al [21]. However, LNMO presents an impurity peak between 26° and 27°, which is attributed to MnO2 reduction product MnO2−x under high temperature reaction. This formation of impurity indicates the non-uniformity of one-step solid state reaction method. For solid state reactions, transition metal ions need to diffuse for a long distance to achieve product uniformity, due to the uniformity of mixing and particle size of raw materials, which takes long time sintering at high temperature. Here, only 10 h sintering at 900 °C is obviously insufficient to prepare homogeneous multi-element doped LNMO. However, longer sintering time at high temperature will lead to the volatilization of lithium and the growth of particles, which is unfavorable to the electrochemical performance. So, here the transition metal oxides are firstly mixed and annealed for another 10 h at 900 °C, giving a better mixing of transition metal ions. As shown in Figure S4, the multi-component precursor Ni0.475Co0.025Cr0.025Al0.025Mn1.45O4−x forms a pure spinel phase NiMn2O4 (PDF# 71-0852), in which all the transition metal ions mixed well to form homogenous final T-LNMO without impurities. Furthermore, the SEM and EDS (Figure S5) of Ni0.475Co0.025Cr0.025Al0.025Mn1.45O4−x precursor confirm the spinel structure and uniform distribution of various elements, which is consistent with the XRD results. As a result, the as-prepared T-LNMO shows better uniformity. On the other hand, the I111/I311 ratio of T-LNMO was 2.224, higher than that of LNMO (1.872). The preferential orientation of (111) crystal plane of T-LNMO provides a faster 3D channel for Li+ transmission [22]. In addition, the structure of the multi-component precursor Ni0.475Co0.025Cr0.025Al0.025Mn1.45O4−x. is consistent with the pure spinel phase NiMn2O4 (PDF# 71-0852) from the XRD pattern (Figure S4), which means the precursor and the final product T-LNMO have the same structure, resulting in higher phase uniformity of T-LNMO. Figure 2b shows the Raman spectra of the two samples. The peak around 497 cm−1 is assigned to the Ni-O stretching mode in the structure, and the peak around 631 cm−1 is assigned to the symmetric Mn-O stretching vibration of the MnO6 octahedra [23]. Raman spectra of both samples show more obvious evidence of Fd 3 ¯ m space groups. However, the Raman peak observed at 164 cm−1 in LNMO is stronger than that in T-LNMO, displaying stronger ordered spinel P4332 structure characteristics [24]. Meanwhile, the peak of T-LNMO around 497 cm−1 is also weaker than that of LNMO, this is due to the more disordered arrangement of nickel and manganese in T-LNMO. The results indicate that multi-element doping significantly increases the proportion of disordered Fd 3 ¯ m structure in LNMO, and the two-step synthesis of T-LNMO shows more obvious doping effect, which is closer to the Fd 3 ¯ m structure.
The SEM images of these two samples are shown in Figure 3a,b. The particle size of both samples is about 1–3 μm, with mostly typical octahedral shape for spinel cathode. The TEM images (Figure 3c,d) further confirm the particle size and morphology of these two samples. The lattice fringes of the two samples were observed using HR-TEM (Figure 3e,f), The calculated lattice fringe widths of LNMO and T-LNMO is 0.233nm and 0.236nm respectively (5 × d is shown in Figure 3e,f), which match the (222) crystal surface of LiNi0.5Mn1.5O4 [25]. To confirm the homogeneity of multi-element doping, Energy-dispersive spectroscopy (EDS) was carried out for the two samples (Figure 4). T-LNMO displays completely uniform elements distribution in all areas of particles, however, except for the uniform distribution of the main elements Ni, Mn and O in LNMO, only Co shows the homogeneity of the doped elements, while Cr and Al only detect weak signals, indicating that the dopants in LNMO do not participate in diffusion in various regions. In the same way, we also carried out SEM and EDS analysis on the multi-component precursor (Figure S5). The Ni0.475Co0.025Cr0.025Al0.025Mn1.45O4−x precursor shows a spinel morphology similar to the final product and a uniform distribution of various elements, which is consistent with the previous XRD analysis results.
Raman imaging was carried out to further explore the homogeneity of these two multi-elements doped samples. Raman imaging is a macro-scale technique to analysis phase and structure and it has been widely used in various research fields [26,27]. The optical image and Raman imaging selection region (the red square area) of both samples were shown in Figure S1. As the Raman spectroscopy shown in Figure 2b, we choose the peak at 497 cm−1 (Ni-O stretching peak) as a green map and the peak at 631 cm−1 (Mn-O stretching peak) as a blue map (Figure S2), then we record the ratio of the two peak areas as G/B. The change of the area ratio of the two peaks (G/B) of the Raman spectrum at each point in the region represents the change of the fine crystal structure and composition. Figure 5 shows the selection regions’ images of the two-dimensional planes of the two samples. For the green and blue maps, both samples’ peak areas changed in the selected regions (Figure 5a,b,d,e). This is expected because the relative density of the samples in each part is different, which would cause the change of peak intensity. Those area with strong signals generally have high density. However, the resonance effect of the molecular bonds at the same point is consistent, which means the fine structure of the sample is the same everywhere. So the ratio of G/B has more reference significance for identification of structral uniformity (Figure 5c,f). The ratio value of LNMO and T-LNMO is around 0.84 and 0.32 respectively, which is consistent with the Raman spectroscopy (Figure 2b). Obviously, the intensity of each point of T-LNMO changes less than that of LNMO (almost all displayed in blue), which means more uniform structure distribution of T-LNMO.
X-ray photoelectron spectroscopy (XPS) is used to investigate the surface structure and transition metal valence of LNMO and T-LNMO. The results show that both the main elements and the doped elements exist on the surface of the sample, indicating a similar composition on the surface (Table S1). In the Ni 2p region (Figure 6a), the main peaks of Ni 2p3/2 and Ni 2p1/2, which appear at 855.4 and 872.3 eV, respectively, are assigned to Ni2+ cations, indicating Ni in LNMO and T-LNMO are almost Ni2+ [28]. The XPS results of Mn 2p were fitted by peak separation (Figure 6b), the peaks at 642.2 and 643.5 eV are attributed to Mn3+, whereas those at 643.5 and 654.8 eV are attributed to Mn4+. The relative content of Mn3+ and Mn4+ was calculated by peak area, which is 35.8% and 64.2% in LNMO vs. 31.9% and 68.1% in T-LNMO. The difference of Mn 2p spectra in these two samples is not significantly, meaning a similar surface oxygen vacancy concentration in these two samples. XPS results of three doped elements (Co, Cr and Al) in these two samples are very close (Figure 6d,e), which proves that the valence state and existing form of these three dopants are very stable in the synthesis process, and have good compatibility with the spinel structure LiNi0.5Mn1.5O4.
Electrochemical performance of these two samples were evaluated in coin type cells using lithium metal as the reference anode. The voltage window for the test is from 3.5 V to 5 V vs. Li/Li+, with different current densities. For the cycle performance tests, cells with different cathode materials were activated at 0.1 C for the first 3 cycles and then cycles for 500 times at a rate of 1 C (Figure 7a,c,e). The specific discharge capacities of LNMO and T-LNMO at 0.1 C are 126 mAh/g and 137 mAh/g respectively. The higher capacity in T-LNMO is due to its better uniformity and faster ion diffusion (shown later in Figure 8). After cycling at 1 C for 500 times, T-LNMO presents better capacity retention than LNMO (86.3% vs. 71.2%) and undoped LiNi0.5Mn1.5O4 using similar two step synthesis [29,30]. The doping effect and better uniformity of T-LNMO enhances the structure stability during cycling, further improves the cycle performance. For each charge-discharge process, three plateaus at 4.0 V, 4.7 V and 4.8 V can be found for these two samples, which corresponds to redox reacition of Mn3+/Mn4+, Ni2+/Ni3+ and Ni3+/Ni4+ respectively [31]. Figure 7b,d,f show the rate capability and charge-discharge curves at different rates of these two samples. The discharge capacity of T-LNMO reaches 112 mAh/g and 89 mAh/g at 5 C and 10 C while it is only 87 mAh/g and 64 mAh/g in LNMO. The superior rate performance of T-LNMO is attributed to its faster Li+ ion diffusion [32]. The discharge platforms of both samples decrease with the increase of current rate (Figure 7d,f), because of higher electrode overpotential and larger internal Ohmic (IR) drop at high current densities [33]. Meanwhile, the over potential of LNMO is larger than that in T-LNMO, especially at 10 C, representing higher lithium-ion migration resistance.
Cyclic voltammetry (CV) tests were carried out in order to investigate the electrochemical behavior and lithium-ion migration kinetics of these two materials (Figure 8a,b). In the cyclic voltammetry curves, three redox-current peaks can be found, which is consistent to the charge-discharge curves in Figure 7. The peak at around 4.0 V corresponds to Mn3+/Mn4+ and that at 4.7 V and 4.8 V corresponds to Ni2+/Ni3+ and Ni3+/Ni4+ redox couple [34]. Cyclic voltammetry (CV) tests at different scan rates are also used to calculate the Li+ ion diffusion coefficients [35]. As the scan rate (v) increases, the peak current also increases and the over potential of each redox couple increases. The relationships between the cathodic and anodic peak currents and the square root of the scan rate are shown in Figure S3, and the Li ion diffusion coefficient (DLi) can be calculated using the Randles−Sevcik equation [36]:
Ip = 2.69 × 10⁵n3/2AC0DLi1/2v1/2
where Ip is the peak current, n is the number of charges for Li+ (n = 1), A is the surface area of the electrode material, C0 is the bulk concentration of Li+ in the electrode, and v is the scan rate. For C0, the unit cell volume is calculated by cell parameters based on XRD fitting [37]. In each LiNi0.5Mn1.5O4 unit cell, eight Li+ ions is included [38]. Combined with Avogadro constant (6.02 × 10²³ mol−1), the value of C0 can be obtained (0.0245 mol cm−3 in this case). Considering the difference between the values of oxidation peak and reduction peak and the double peaks between 4.6–4.8 V, we choose four oxidation and reduction peaks marked as C1, C2, D1 and D2 (shown in Figure 7a,b) and calculate the DLi respectively (Figure 8c). T-LNMO performs higher lithium ion diffusion coefficients than LNMO at each point, and both samples show the highest value at C2 point of charged state, which reaches 4.09 × 10⁻⁹ cm2 s−1 and 6.17 × 10⁻⁹ cm2 s−1 respectively. This result reflects the high rate capacity of T-LNMO discussed before, which means the faster lithium ion transport dynamics in T-LNMO due to the uniformly distribution of cations in Fd 3 ¯ m structure [39].
The surface stability is further investigated with electrochemical impedance spectroscopy (EIS) and the results are shown in Figure 9 [40]. The impedance after activation with 0.1 C and 100 cycles at 1 C rate are compared respectively (Figure 9a,b). The impedance after activation process is fitted with only one semicircle (Figure 9a), where Re represents the electrolyte impedance and Rct corresponds to the charge transfer impedance [41]. The Re is almost the same for both two samples, but the charge transfer resistance of T-LNMO (40.3 Ω, Table 1) is much lower than that of LNMO (77.7 Ω), indicating a fast Li+ ion transfer at the surface. After 100 cycles at 1 C, the CEI layer on the surface grows and a second semicircle appears in the EIS (Figure 9b). Thus, an extra resistance Rf, which represents to the impedance of CEI layer, is added as the equivalent circuit. The charge transfer impedance (Rct) slightly increased after 100 cycles, for both T-LNMO and LNMO (Table 1). The impedance of CEI layer in both two cells are almost the same, indicating similar surface stability without surface modification.
To investigate the reason for battery failure, we conducted post-mortem analysis of the electrodes. Figure 10 shows the XRD and SEM images of LNMO and T-LNMO electrodes after 200 cycles. Unlike T-LNMO, LNMO presents an obvious LixNi1−xO impurity at 43.7°. This might due to the site migration of Ni and Mn during the charging and discharging in LNMO, resulting in the transformation from spinel phase to rock salt phase (LixNi1−xO). The inhomogeneity of LNMO leads to incomplete inhibition of the migration of transition metal ions and formation of rock salt phase. It is worth noting that the MnO2−x impurity phase in LNMO disappears after cycling, confirming the large amount of dissolution of Mn during cycling. From the SEM image of LNMO (Figure 10b), cracks of the cathode particles can be observed, leading to more side reaction on the surface and faster capacity decay. With homogenous multiple elements doping (T-LNMO), crack formation can be restricted (Figure 10c), contributing to the better cycle performance.

4. Conclusions

In this study, multi-element (Co, Cr, Al) doped LiNi0.5Mn1.5O4 spinel cathode material with better uniformity is prepared via a two-step solid state reaction process. With an extra high temperature sintering process, transition metal oxides are well distributed to further prepare uniform Co, Cr, Al co-doped LNMO. The better uniformity of T-LNMO prepared by this two-step method is confirmed by EDS mapping and Raman imaging results. Electrochemical performance measurements indicate better battery performance in T-LNMO, including higher specific capacity, better cycle stability and rate performance. The discharge capacity of T-LNMO at 0.1 C rate reaches 137 mAh/g and retains 86% after 500 cycles at 1 C. At the same time, T-LNMO also shows better rate capability under high-rate currents, with 89 mAh/g capacity at 10 C rate. This study provides a simple but efficient way for the preparation of multi-element doped electrode materials, which helps the commercialization of medium entropy electrode materials.

Supplementary Materials

The following supporting information can be downloaded at: https://www.mdpi.com/article/10.3390/batteries9020091/s1, Figure S1: The optical image and Raman imaging selection region of (a) LNMO and (b) T-LNMO, Table S1: The atomic ratio by XPS analysis results of both samples, Figure S2: The green map area around 497 cm−1 and the blue map area around 631 cm−1 of both samples, Figure S3: The relationships between the cathodic and anodic peak currents and the square root of the scan rate of (a) LNMO and (b) T-LNMO, Figure S4: The XRD pattern of the multi-component precursor Ni0.475Co0.025Cr0.025Al0.025Mn1.45O4−x, Figure S5: SEM image and EDS analysis of the multi-component precursor Ni0.475Co0.025Cr0.025Al0.025Mn1.45O4−x, Figure S6: EDS analysis of (a) LNMO and (b) T-LNMO electrodes after 200 cycles at 1 C.

Author Contributions

Conceptualization, X.F.; methodology, W.W., S.Z. and X.Z.; validation, W.W., S.Z. and X.Z.; formal analysis, W.W.; resources, W.W.; writing—original draft preparation, W.W.; writing—review and editing, X.F. All authors have read and agreed to the published version of the manuscript.

Funding

This study was supported by the Major Science and Technology Projects in Anhui Province (202203a05020032) and the Fundamental Research Funds for the Central Universities (JZ2022HGTB0251).

Data Availability Statement

Not applicable.

Conflicts of Interest

The authors declare no conflict of interest.

References

  1. Xu, X.; Deng, S.; Wang, H.; Liu, J.; Yan, H. Research Progress in Improving the Cycling Stability of High-Voltage LiNi0.5Mn1.5O4 Cathode in Lithium-Ion Battery. Nanomicro Lett. 2017, 9, 22. [Google Scholar] [CrossRef] [PubMed] [Green Version]
  2. Wang, H.; Xie, X.; Wei, X.; Zhang, X.; Zhang, J.; Huang, Y.; Li, Q. A New Strategy to Stabilize Capacity and Insight into the Interface Behavior in Electrochemical Reaction of LiNi0.5Mn1.5O4/Graphite System for High-Voltage Lithium-Ion Batteries. ACS Appl. Mater. Interfaces 2017, 9, 33274–33287. [Google Scholar] [CrossRef] [PubMed]
  3. Zou, Z.; Xu, H.; Zhang, H.; Tang, Y.; Cui, G. Electrolyte Therapy for Improving the Performance of LiNi0.5Mn1.5O4 Cathodes Assembled Lithium-Ion Batteries. ACS Appl. Mater. Interfaces 2020, 12, 21368–21385. [Google Scholar] [CrossRef]
  4. Lee, H.J.; Liu, X.; Chart, Y.; Tang, P.; Bae, J.G.; Narayanan, S.; Lee, J.H.; Potter, R.J.; Sun, Y.; Pasta, M. LiNi0.5Mn1.5O4 Cathode Microstructure for All-Solid-State Batteries. Nano Lett. 2022, 22, 7477–7483. [Google Scholar] [CrossRef]
  5. Spence, S.L.; Hu, A.; Jiang, M.; Xu, Z.; Yang, Z.; Rahman, M.M.; Li, L.; Chu, Y.S.; Xiao, X.; Huang, X.; et al. Mapping Lattice Distortions in LiNi0.5Mn1.5O4 Cathode Materials. ACS Energy Lett. 2022, 7, 690–695. [Google Scholar] [CrossRef]
  6. Zhang, Q.; Mei, J.; Wang, X.; Tang, F.; Fan, W.; Lu, W. High performance spinel LiNi0.5Mn1.5O4 cathode material by lithium polyacrylate coating for lithium ion battery. Electrochim. Acta 2014, 143, 265–271. [Google Scholar] [CrossRef]
  7. Kocak, T.; Wu, L.; Ugur, A.; Shen, L.; De Giorgio, F.; Kunduraci, M.; Zhang, X. Effect of doping amount on capacity retention and electrolyte decomposition of LiNi0.5Mn1.5O4-based cathode at high temperature. J. Solid State Chem. 2022, 310, 123006. [Google Scholar] [CrossRef]
  8. Zhou, H.; Xiao, D.; Yin, C.; Yang, Z.; Xiao, K.; Li, J. Enhanced performance of the electrolytes based on sulfolane and lithium difluoro(oxalate)borate with enhanced interfacial stability for LiNi0.5Mn1.5O4 cathode. J. Electroanal. Chem. 2018, 808, 293–302. [Google Scholar] [CrossRef]
  9. Park, S.B.; Eom, W.S.; Cho, W.I.; Jang, H. Electrochemical properties of LiNi0.5Mn1.5O4 cathode after Cr doping. J. Power Sources 2006, 159, 679–684. [Google Scholar] [CrossRef]
  10. Liu, M.-H.; Huang, H.-T.; Lin, C.-M.; Chen, J.-M.; Liao, S.-C. Mg gradient-doped LiNi0.5Mn1.5O4 as the cathode material for Li-ion batteries. Electrochim. Acta 2014, 120, 133–139. [Google Scholar] [CrossRef]
  11. Shin, D.W.; Bridges, C.A.; Huq, A.; Paranthaman, M.P.; Manthiram, A. Role of Cation Ordering and Surface Segregation in High-Voltage Spinel LiMn1.5Ni0.5–xMxO4 (M = Cr, Fe, and Ga) Cathodes for Lithium-Ion Batteries. Chem. Mater. 2012, 24, 3720–3731. [Google Scholar] [CrossRef]
  12. Tian, T.; Lu, L.L.; Yin, Y.C.; Tan, Y.H.; Zhang, T.W.; Li, F.; Yao, H.B. Trace Doping of Multiple Elements Enables Stable Cycling of High Areal Capacity LiNi0.5Mn1.5O4 Cathode. Small 2022, 18, e2106898. [Google Scholar] [CrossRef] [PubMed]
  13. Chladil, L.; Kunický, D.; Kazda, T.; Vanýsek, P.; Čech, O.; Bača, P. In-situ XRD study of a Chromium doped LiNi0.5Mn1.5O4 cathode for Li-ion battery. J. Energy Stor. 2021, 41, 102907. [Google Scholar] [CrossRef]
  14. Liang, G.; Peterson, V.K.; Wu, Z.; Zhang, S.; Hao, J.; Lu, C.Z.; Chuang, C.H.; Lee, J.F.; Liu, J.; Leniec, G.; et al. Crystallographic-Site-Specific Structural Engineering Enables Extraordinary Electrochemical Performance of High-Voltage LiNi0.5Mn1.5O4 Spinel Cathodes for Lithium-Ion Batteries. Adv. Mater. 2021, 33, e2101413. [Google Scholar] [CrossRef]
  15. Feng, F.; Liang, C.; Fang, H.; Yang, B.; Ma, W.; Dai, Y. Chloride-promoted formation of octahedral LiNi0.5Mn1.5O4 crystal with greatly enhanced electrochemical performance. Ceram. Intern. 2016, 42, 9038–9045. [Google Scholar] [CrossRef]
  16. Yi, T.-F.; Li, Y.-M.; Li, X.-Y.; Pan, J.-J.; Zhang, Q.; Zhu, Y.-R. Enhanced electrochemical property of FePO4-coated LiNi0.5Mn1.5O4 as cathode materials for Li-ion battery. Sci. Bull. 2017, 62, 1004–1010. [Google Scholar] [CrossRef] [Green Version]
  17. Feng, J.; Huang, Z.; Guo, C.; Chernova, N.A.; Upreti, S.; Whittingham, M.S. An organic coprecipitation route to synthesize high voltage LiNi0.5Mn1.5O4. ACS Appl. Mater. Interfaces 2013, 5, 10227–10232. [Google Scholar] [CrossRef]
  18. Nakayama, M.; O, M.; Kajihara, M. Experimental Observation on Solid-State Reactive Diffusion between Sn–Ag Alloys and Ni. Mater. Tran. 2017, 58, 561–566. [Google Scholar] [CrossRef] [Green Version]
  19. Wang, Y.; Zhang, R.-Z.; Zhang, B.; Skurikhina, O.; Balaz, P.; Araullo-Peters, V.; Reece, M.J. The role of multi-elements and interlayer on the oxidation behaviour of (Hf-Ta-Zr-Nb)C high entropy ceramics. Corr. Sci. 2020, 176, 109019. [Google Scholar] [CrossRef]
  20. Beke, D.L.; Erdélyi, G. On the diffusion in high-entropy alloys. Mater. Lett. 2016, 164, 111–113. [Google Scholar] [CrossRef]
  21. Yang, J.; Han, X.; Zhang, X.; Cheng, F.; Chen, J. Spinel LiNi0.5Mn1.5O4 cathode for rechargeable lithiumion batteries: Nano vs micro, ordered phase (P4332) vs disordered phase (Fd 3 ¯ m). Nano Res. 2013, 6, 679–687. [Google Scholar] [CrossRef]
  22. Yin, C.; Zhou, H.; Yang, Z.; Li, J. Synthesis and Electrochemical Properties of LiNi0.5Mn1.5O4 for Li-Ion Batteries by the Metal-Organic Framework Method. ACS Appl. Mater. Interfaces 2018, 10, 13625–13634. [Google Scholar] [CrossRef]
  23. Song, J.; Shin, D.W.; Lu, Y.; Amos, C.D.; Manthiram, A.; Goodenough, J.B. Role of Oxygen Vacancies on the Performance of Li[Ni0.5–xMn1.5+x]O4 (x = 0, 0.05, and 0.08) Spinel Cathodes for Lithium-Ion Batteries. Chem. Mater. 2012, 24, 3101–3109. [Google Scholar] [CrossRef]
  24. Spence, S.L.; Xu, Z.; Sainio, S.; Nordlund, D.; Lin, F. Tuning the Morphology and Electronic Properties of Single-Crystal LiNi0.5Mn1.5O4-delta: Exploring the Influence of LiCl-KCl Molten Salt Flux Composition and Synthesis Temperature. Inorg. Chem. 2020, 59, 10591–10603. [Google Scholar] [CrossRef]
  25. Lee, S.; Kim, H.; Lee, J.-H.; Kim, B.-K.; Shin, H.; Kim, J.; Park, S. Nano-interface engineering in all-solid-state lithium metal batteries: Tailoring exposed crystal facets of epitaxially grown LiNi0.5Mn1.5O4 films. Nano Energy 2021, 79, 105480. [Google Scholar] [CrossRef]
  26. Xu, J.; Liu, J.; Zhang, X.; Ling, P.; Xu, K.; He, L.; Su, S.; Wang, Y.; Hu, S.; Xiang, J. Chemical imaging of coal in micro-scale with Raman mapping technology. Fuel 2020, 264, 116826. [Google Scholar] [CrossRef]
  27. Liu, Z.; Li, S.; Xia, X.; Zhu, Z.; Chen, L.; Chen, Z. Recent Advances in Multifunctional Graphitic Nanocapsules for Raman Detection, Imaging, and Therapy. Small Methods 2020, 4, 1900440. [Google Scholar] [CrossRef]
  28. Dauth, A.; Love, J.A. Synthesis and reactivity of 2-azametallacyclobutanes. Dalton Trans. 2012, 41, 7782–7791. [Google Scholar] [CrossRef]
  29. Li, J.; Zhang, Q.; Xiao, X.; Cheng, Y.T.; Liang, C.; Dudney, N.J. Unravelling the Impact of Reaction Paths on Mechanical Degradation of Intercalation Cathodes for Lithium-Ion Batteries. J. Am. Chem. Soc. 2015, 137, 13732–13735. [Google Scholar] [CrossRef]
  30. Feng, X.; Shen, C.; Fang, X.; Chen, C. Synthesis of LiNi0.5Mn1.5O4 by solid-state reaction with improved electrochemical performance. J. Alloys Comp. 2011, 509, 3623. [Google Scholar] [CrossRef]
  31. Chong, J.; Xun, S.; Song, X.; Liu, G.; Battaglia, V.S. Surface stabilized LiNi0.5Mn1.5O4 cathode materials with high-rate capability and long cycle life for lithium ion batteries. Nano Energy 2013, 2, 283–293. [Google Scholar] [CrossRef]
  32. Liu, G.; Kong, X.; Sun, H.; Wang, B.; Yi, Z.; Wang, Q. A facile template method to synthesize significantly improved LiNi0.5Mn1.5O4 using corn stalk as a bio-template. Electrochim. Acta 2014, 141, 141–148. [Google Scholar] [CrossRef]
  33. Zhang, X.; Cheng, F.; Zhang, K.; Liang, Y.; Yang, S.; Liang, J.; Chen, J. Facile polymer-assisted synthesis of LiNi0.5Mn1.5O4 with a hierarchical micro–nano structure and high rate capability. RSC Adv. 2012, 2, 5669. [Google Scholar] [CrossRef]
  34. Sun, H.; Hu, A.; Spence, S.; Kuai, C.; Hou, D.; Mu, L.; Liu, J.; Li, L.; Sun, C.; Sainio, S.; et al. Tailoring Disordered/Ordered Phases to Revisit the Degradation Mechanism of High-Voltage LiNi0.5Mn1.5O4 Spinel Cathode Materials. Adv. Funct. Mater. 2022, 32, 2112279. [Google Scholar] [CrossRef]
  35. Feng, X.; Zou, H.; Xiang, H.; Guo, X.; Zhou, T.; Wu, Y.; Xu, W.; Yan, P.; Wang, C.; Zhang, J.; et al. Ultrathin Li4Ti5O12 Nanosheets as Anode Materials for Lithium and Sodium Storage. ACS Appl. Mater. Interfaces 2016, 8, 16718. [Google Scholar] [CrossRef] [PubMed]
  36. Yao, L.; Liang, F.; Jin, J.; Chowdari, B.V.R.; Yang, J.; Wen, Z. Improved electrochemical property of Ni-rich LiNi0.6Co0.2Mn0.2O2 cathode via in-situ ZrO2 coating for high energy density lithium ion batteries. Chem. Engin. J. 2020, 389, 124403. [Google Scholar] [CrossRef]
  37. Yang, H.; Fu, C.; Sun, Y.; Wang, L.; Liu, T. Fe-doped LiMnPO4@C nanofibers with high Li-ion diffusion coefficient. Carbon 2020, 158, 102–109. [Google Scholar] [CrossRef]
  38. Li, F.; Ma, J.; Lin, J.; Zhang, X.; Yu, H.; Yang, G. Exploring the origin of electrochemical performance of Cr-doped LiNi0.5Mn1.5O4. Phys. Chem. Chem. Phys. 2020, 22, 3831–3838. [Google Scholar] [CrossRef]
  39. Gu, Y.-J.; Li, Y.; Chen, Y.-B.; Liu, H.-Q. Comparison of Li/Ni antisite defects in Fd-3m and P4332 nanostructured LiNi0.5Mn1.5O4 electrode for Li-ion batteries. Electrochim. Acta 2016, 213, 368–374. [Google Scholar] [CrossRef]
  40. Nazario-Naveda, R.; Rojas-Flores, S.; Juárez-Cortijo, L.; Gallozzo-Cardenas, M.; Díaz, F.N.; Angelats-Silva, L.; Benites, S.M. Effect of x on the Electrochemical Performance of Two-Layered Cathode Materials xLi2MnO3–(1−x)LiNi0.5Mn0.5O2. Batteries 2022, 8, 63. [Google Scholar] [CrossRef]
  41. Qiao, Y.Q.; Tu, J.P.; Wang, X.L.; Gu, C.D. The low and high temperature electrochemical performances of Li3V2(PO4)3/C cathode material for Li-ion batteries. J. Power Sources 2012, 199, 287–292. [Google Scholar] [CrossRef]
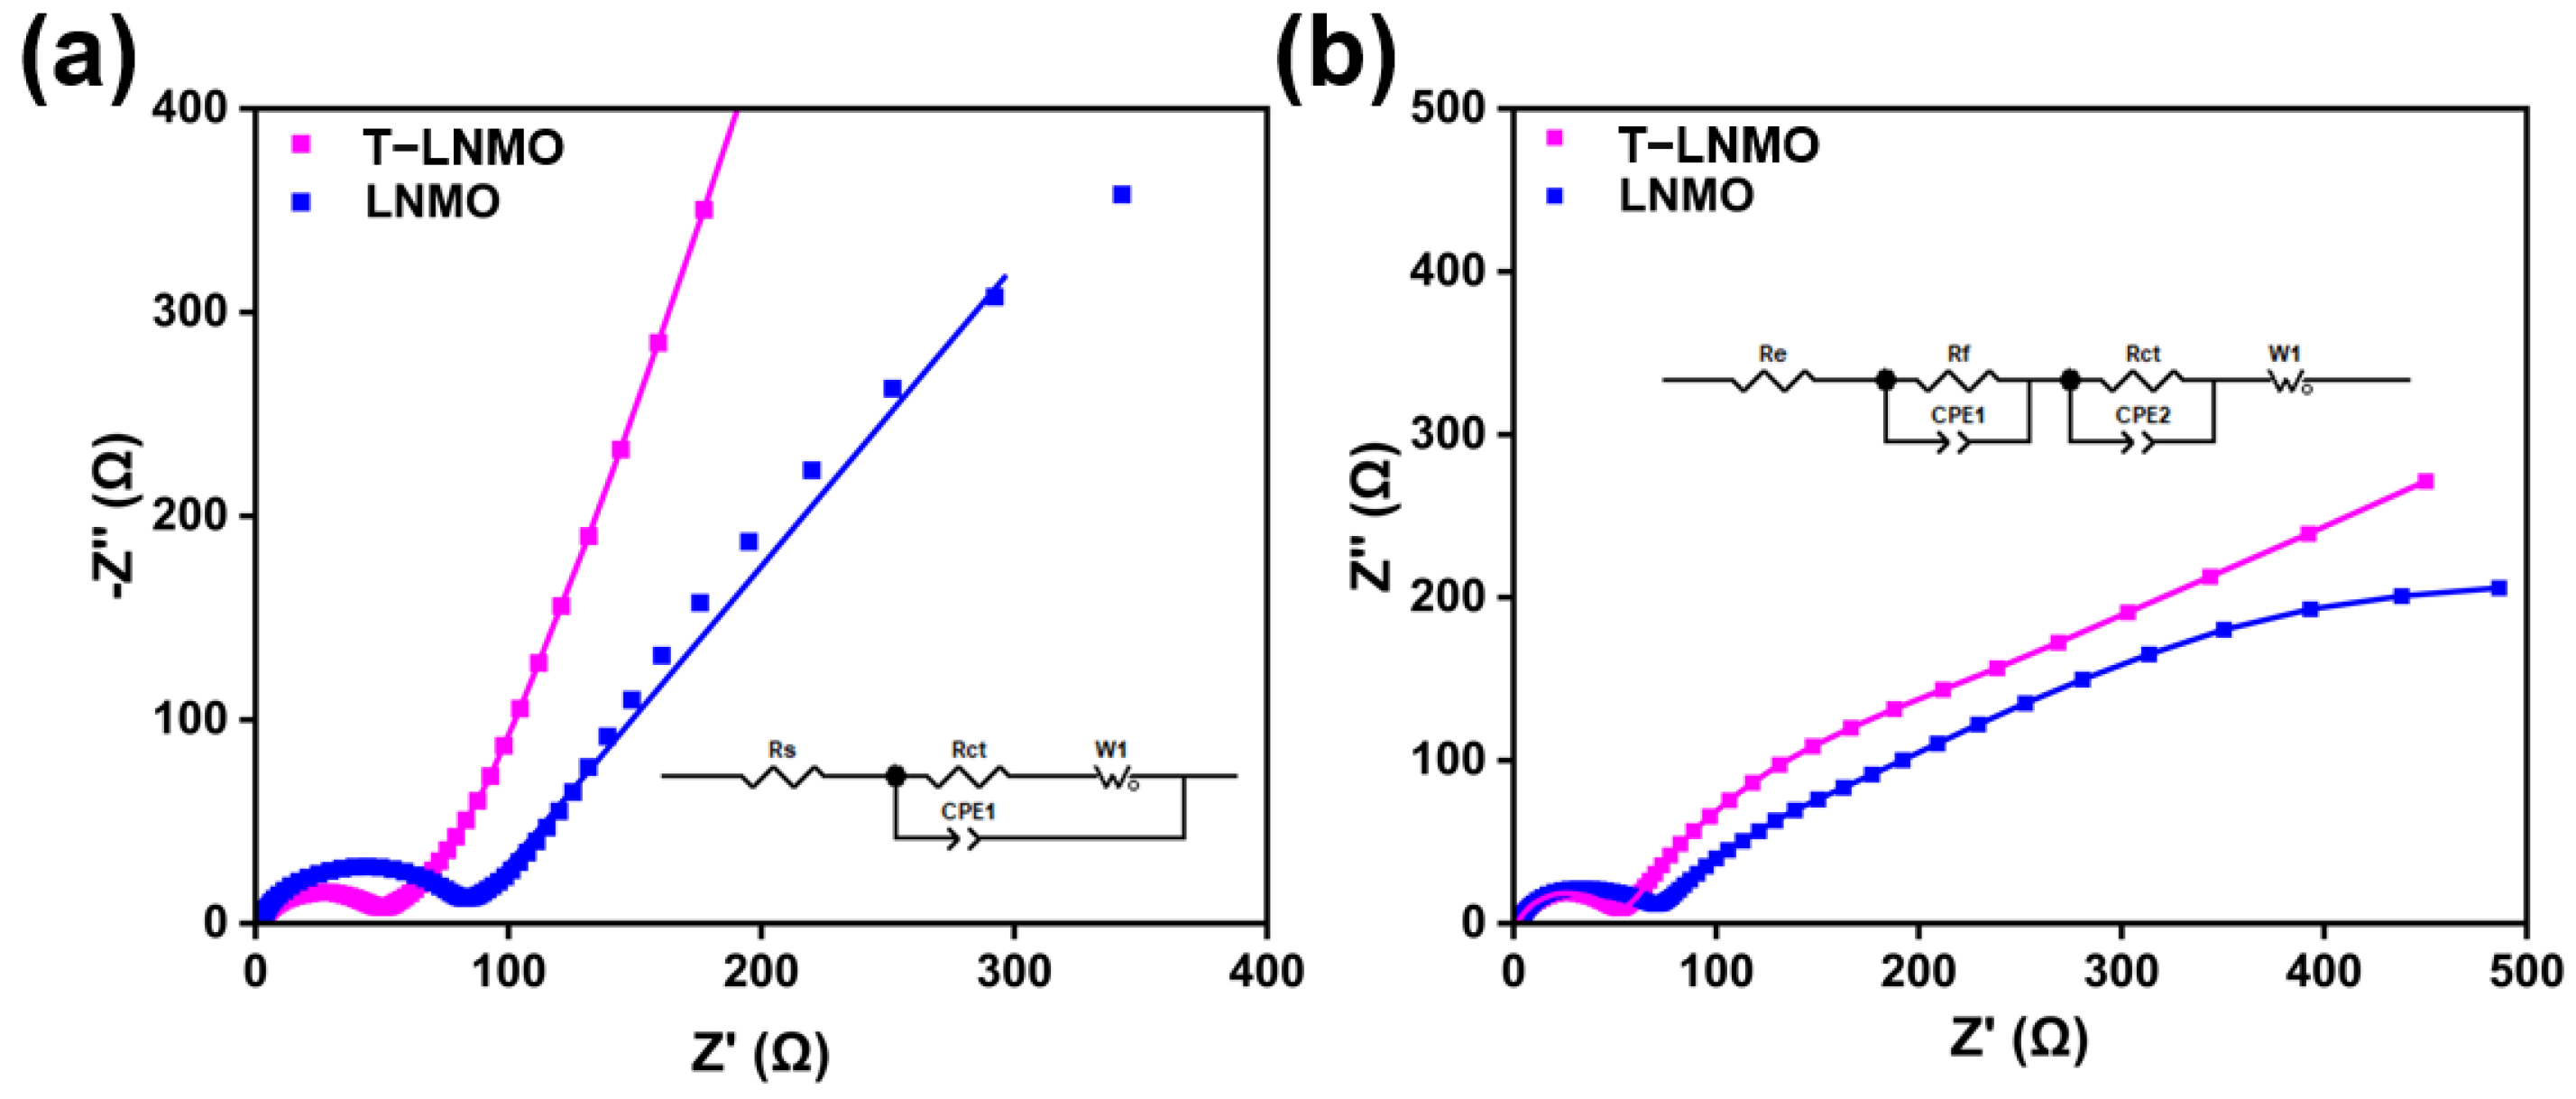
Figure 1. Schematic illustration of two-step solid state reaction process.
Batteries 09 00091 g001
Figure 2. (a) X-ray diffraction patterns and (b) Raman spectroscopy of two different samples.
Batteries 09 00091 g002
Figure 3. SEM images of (a) LNMO and (b) T-LNMO. TEM images of (c) LNMO and (d) T-LNMO. High-resolution TEM (HR-TEM) images of (e) LNMO and (f) T-LNMO.
Batteries 09 00091 g003
Figure 4. EDS maps of each element in (a) LNMO and (b) T-LNMO.
Batteries 09 00091 g004
Figure 5. Selection regions’ Raman images of the two-dimensional planes in both samples. The green area images of (a) LNMO and (d) T-LNMO. The blue area images of (b) LNMO and (e) T-LNMO. The G/B intensity images of (c) LNMO and (f) T-LNMO.
Batteries 09 00091 g005
Figure 6. XPS spectra of (a) Ni 2p, (b) Mn 2p, (c) O 1s, (d) Co 2p, (e) Cr 2p and (f) Al 2p of LNMO and T-LNMO.
Batteries 09 00091 g006
Figure 7. (a) Cycling performance at 1 C and corresponding coulombic efficiencies. Charge-discharge curves of (c) LNMO and (e) T-LNMO. (b) Rate capability and corresponding coulombic efficiencies. Charge-discharge curves at different rates of (d) LNMO and (f) T-LNMO.
Batteries 09 00091 g007
Figure 8. Cyclic voltammetry (CV) curves at different scan rates (0.05 mV–0.5 mV) of (a) LNMO and (b) T-LNMO. (c) Lithium diffusion coefficients (DLi) of the two samples for C1, C2, D1 and D2 peaks.
Batteries 09 00091 g008
Figure 9. The fitted Nyquist plots of both samples and their equivalent circuit. (a) EIS after activation at 0.1 C. (b) EIS after 100 cycles at 1 C.
Batteries 09 00091 g009
Figure 10. (a) The XRD patterns of LNMO and T-LNMO electrodes after 200 cycles at 1 C. The SEM images of (b) LNMO and (c) T-LNMO eletrodes after 200 cycles at 1 C.
Batteries 09 00091 g010
Table 1. Impedance parameters obtained after fitting the EIS after activation at 0.1 C for three cycles and 100 cycles at 1 C.
After 3 Cycles at 0.1 CAfter 100 Cycles at 1 C
SamplesRe (Ω)Rf (Ω)Rct (Ω)Re (Ω)Rf (Ω)Rct (Ω)
LNMO1.5-77.71.280.179.0
T-LNMO1.6-40.30.979.049.4
Disclaimer/Publisher’s Note: The statements, opinions and data contained in all publications are solely those of the individual author(s) and contributor(s) and not of MDPI and/or the editor(s). MDPI and/or the editor(s) disclaim responsibility for any injury to people or property resulting from any ideas, methods, instructions or products referred to in the content.

