Article

Deciphering Electrolyte Degradation in Sodium-Based Batteries: The Role of Conductive Salt Source, Additives, and Storage Condition

Institute for Applied Materials, Karlsruhe Institute of Technology, Hermann-von-Helmholtz-Platz 1, D-76344 Eggenstein-Leopoldshafen, Germany
*
Author to whom correspondence should be addressed.
Batteries 2023, 9(11), 530; https://doi.org/10.3390/batteries9110530
Submission received: 29 September 2023 / Revised: 20 October 2023 / Accepted: 23 October 2023 / Published: 25 October 2023

Abstract

:
This work investigates the stability of electrolyte systems used in sodium-ion-based batteries. The electrolytes consist of a 1:1 (v:v) mixture of ethylene carbonate (EC) and propylene carbonate (PC), a sodium-conducting salt (either NaPF6 or NaTFSI), and fluoroethylene carbonate (FEC), respectively, sodium difluoro(oxalato) borate (NaDFOB), as additives. Through systematic evaluation using gas chromatography coupled with mass spectrometry (GC-MS), we analyze the formation of degradation products under different conditions including variations in temperature, vial material, and the presence or absence of sodium metal. Our results reveal the significant influence of the conductive salt’s source on degradation. Furthermore, we observe that FEC’s stability is affected by the storage temperature, vial material, and presence of sodium metal, suggesting its active involvement in the degradation process. Additionally, our results highlight the role of NaDFOB as an additive in mitigating degradation. The study provides crucial insights into the complex network of degradation reactions occurring within the electrolyte, thus informing strategies for improved electrolyte systems in sodium-based batteries. Since the production, material selection and storage of electrolytes are often insufficiently described, we provide here an insight into the different behavior of electrolytes for Na-ion batteries.

1. Introduction

Sodium-based batteries (SIBs) have been gathering substantial attention in recent years as potential replacements for lithium-ion batteries, taking advantage of sodium’s abundance and low cost [1,2,3]. However, realizing the full potential of these batteries requires a profound understanding of all system components, particularly the electrolyte, which is central to high performance and cell aging [4,5,6]. These batteries typically employ carbonate-based solutions as electrolytes, chosen for their high ionic conductivity, stability, and compatibility with both, the anode and cathode materials [7,8,9].
However, the storage of these carbonate solutions has proven to be of particular challenge [10,11,12]. These electrolyte solutions can decompose over time, producing various degradation products that can compromise the performance and safety of the battery [13,14]. The decomposition process may accelerate depending on the storage conditions, such as temperature and exposure to light or air, leading to the formation of volatile degradation products [15,16,17].
Gas chromatography (GC) coupled with mass spectrometry (MS) has emerged as a suitable analytical method for evaluating these decomposition products [18]. The ability of GC-MS to separate and identify different compounds makes it ideal for characterizing the complex mixtures arising from electrolyte degradation. This provides critical insights into the decomposition process, facilitating the development of strategies for improving electrolyte stability [19,20,21].
The degradation of electrolytes is significantly influenced by temperature, with various studies examining the effects within specific thermal ranges. Observations indicate that within the moderate thermal confines of 30 °C to 60 °C, there is an observable acceleration in the decomposition of certain electrolyte constituents, especially LiPF6 [22]. N. Gauthier et al. demonstrated that LiPF6 salt decomposition at 60 °C induces the formation and deposition of (fluoro)phosphate species in higher proportions at the LTO surface [23]. As the thermal spectrum escalates beyond 60 °C, the effects become more severe. Empirical data suggest a severe degradation of electrolyte components as temperatures approach and exceed 80 °C [22,24,25]. Above 80 °C it is triggering the deterioration of the solid electrolyte interphase (SEI) layer [26]. This degradation enables an exothermic reaction involving the lithiated carbon and the electrolyte, commencing around 100 °C [27]. Further thermal increases cause the electrolyte to decompose above 110 °C, and above 135 °C, the integral separator begins to melt [28]. The maximum thermal degradation is observed at approximately 140 °C, where the electrolyte evaporates and its vapors, in the presence of oxygen, are highly combustible [27,29].
Fluoroethylene carbonate (FEC) and sodium difluoro(oxalato)borate (NaDFOB) play important roles as additives in sodium-ion battery electrolytes, enhancing the electrochemical performance and safety of these systems [30,31,32]. FEC is renowned for its capability to form a stable solid electrolyte interphase (SEI) on electrode surfaces, a crucial factor in extending the cycle life and efficiency of SIBs [33,34,35]. This SEI layer inhibits detrimental reactions between the electrode and electrolyte, thus promoting stable cycling and reducing capacity fading [36,37,38,39]. Additionally, FEC’s ability to stabilize electrode interfaces and decrease electrode–electrolyte reactivity enhances the overall durability and reliability of SIBs [40,41].
NaDFOB, on the other hand, stands out as a highly effective conducting salt for SIB electrolytes due to its exceptional ionic conductivity and electrochemical stability [42,43,44]. Its robust nature makes it a suitable choice for achieving stable electrolyte–electrode interfaces, even at high voltages. This property is critical for preserving the structural integrity of both electrodes and electrolytes, thereby enhancing the long-term performance and safety of SIBs [45,46]. NaDFOB’s unique molecular structure contributes to its remarkable compatibility with various electrode materials and supports efficient ion transport within the battery system, facilitating high-rate capability and prolonged cycle life [42,43,46,47].
Several decomposition products are known that form during the storage of carbonate solutions. Commonly, these include alcohols such as ethylene glycol and propylene glycol, formed from the reduction in the corresponding carbonate solvents [48,49]. Other degradation products such as ethers, esters, and various organic carbonates have also been reported [49,50,51,52,53].
The degradation of electrolytes in sodium-ion batteries (SIBs) has significant consequences, impacting the sustainability and longevity of these energy storage systems. One of the primary concerns is based on the instability of carbonate-based electrolytes within SIBs, leading to a problematic solid electrolyte interface (SEI) due to the reactivity of the electrolyte solution, which directly contributes to capacity fading [54,55] and the inevitable generation of hydrofluoric acid (HF) during battery cycling [56,57,58]. This issue is exacerbated by the presence of water, which may be introduced during manufacturing or generated within the battery, particularly during instances of overcharging [59,60]. Degradation products also have a pronounced impact on the cathode side, where dissolution of transition metals can occur, especially under high voltage and elevated temperature conditions (see also above) [61,62] as well as on cell cycling [63,64]. Moreover, the presence of these degradation products raises significant concerns regarding the recyclability and environmental sustainability of SIBs, as the extraction and treatment of these materials are energy-intensive and potentially environmentally hazardous [65,66].
In addition to the previously mentioned aspects, the cathode material, respectively, the state of charge (SOC) of the cathode material, has an important impact on the electrolyte degradation behavior of batteries. In sodium-ion batteries, cycling aging effects show both SOC-independent and SOC-dependent behaviors [67]. In addition, a changed SOC affects the electrochemical and thermal dynamics within the cell. At higher SOCs, irreversible heat generation increases, which can accelerate electrolyte degradation [68]. These findings underscore the importance of understanding and managing SOC to optimize battery performance, longevity, and safety.
The primary aim of our experiment (Scheme 1) is to investigate the effect of storage conditions and how the purity of sodium hexafluorophosphate (NaPF6) salts affects the formation of degradation products in carbonate-based electrolytes. Two different NaPF6 salts of varying purities are used to evaluate their impact on electrolyte stability and degradation. We hypothesize that the level of impurities in these salts is a significant factor in the rate and extent of electrolyte decomposition. Identifying any links between salt purity and electrolyte stability could offer new pathways to improve cell aging and the operational lifetime of alkali metal batteries.
Furthermore, we compare sodium bis(trifluoromethanesulfonyl)imide (NaTFSI) as an alternative conducting salt with NaPF6. NaTFSI has been proposed as a promising substitute for NaPF6 in some battery systems, owing to its exceptional thermal stability and compatibility with various electrode materials, despite its corrosive tendency [69]. By comparing the performance and degradation patterns of electrolytes based on NaTFSI and NaPF6, we aim to evaluate whether NaTFSI can offer any advantages in terms of electrolyte stability and battery performance.

2. Materials and Methods

2.1. Chemicals and Sample Preparation

The electrolytes were prepared using 1 M NaPF6, sourced from Alfa Aesar (99.5%, Ward Hill, MA, USA) and ChemFish Tokyo Co., Ltd. (99.9%, Tokyo, Japan) or 1 M NaTFSI (TCI Europe, 98%, Zwijndrecht, Belgium) dissolved in a 1:1 volume-to-volume (v:v) ratio of ethylene carbonate (EC) and propylene carbonate (PC), with or without the addition of 2 wt% FEC (Gotion, Fremont, CA, USA) or 2 wt% NaDFOB (ChemFish Tokyo Co., Ltd.) additives. The chemical and physico-electrochemical properties of the carbonates and salts are presented in Table 1 and Table 2, respectively. High purity sodium metal (Sigma-Aldrich, Taufkirchen, Germany, contains mineral oil, 99.9% trace metals basis) was manually cut into discs approximately half a centimeter in diameter and then submerged in the corresponding electrolytes. Each plastic vial was filled with 0.5 mL of the prepared electrolyte solution, whereas aluminum vials contained 1 mL.
It should be mentioned that the purity of the sodium metal, its precise dimensions, and the method used for cutting the metal impact the results. Therefore, care was taken to maintain consistency and accuracy during this process.
All electrolyte solutions were divided and stored in polyethylene (PE) and aluminum (Al) vials, then kept at varying temperatures (25 °C, 40 °C, 50 °C, 58 °C, and 65 °C) for a period extending up to 18 weeks. This range of temperatures was chosen to study the effect of heat on the stability and reactivity of the electrolytes. All vials were dried at under vacuum 80 °C before sample preparation. The electrolyte preparation was carried out inside a glovebox under an inert argon gas atmosphere to prevent any oxidation or moisture-induced reactions, as these could significantly influence the results of the experiment. Glass vials were not used in the study because the glass surface can easily react with HF, which is typically formed in PF6-containing electrolytes by traces of water over time or at higher temperatures.
For GC-MS measurements, aliquots of 15 µL of each electrolyte were extracted and diluted in 1.5 mL of dichloromethane (DCM) solvent inside of the glove box. This solvent was chosen due to its excellent miscibility with a variety of substances and its relatively low boiling point, facilitating subsequent analysis. Afterwards, centrifugation at a rate of 8000 rpm for 5 min was conducted to separate the salt layer in order to protect the capillary column of the GC. The speed and duration of the centrifugation were carefully optimized to ensure effective separation without causing degradation or alterations to the samples. After centrifugation, 1 mL of the supernatant solution from each sample was transferred into glass vials. These vials were then immediately sealed to prevent the loss or contamination of the sample and used for GC-MS analysis to identify degradable products. The entire process, from sample preparation to the final GC-MS analysis, was repeated twice to ensure the reliability and reproducibility of the data.
In Table 3, Table 4 and Table 5, a comprehensive overview of the electrolyte compositions is presented, encompassing the respective salt names, solvent names, types of additives used, as well as the specific conditions under which the electrolytes were stored, namely the temperature and type of vial used. In addition, the unique identifiers assigned to each sample are also specified in these tables for reference throughout the study. This detailed organization allows for a streamlined comparison and assessment of the electrolyte properties and their behavior under varying conditions.

2.2. Instrumentation

GC experiments were conducted using established procedures as detailed in literature reference [74]. Specifically, a Clarus 690 GC instrument from PerkinElmer Inc. (Waltham, MA, USA) was employed, which was equipped with an autosampler, a flame ionization detector (FID) and a mass detector (SQ 8T). Turbomass (version 6.1.2) and TotalChrom (version 6.3.4) were utilized for both, data acquisition and subsequent data analysis.
The setup during the measurements included the following parameters: the gases employed were He 6.0 (Air Liquide, Düsseldorf, Germany), H2 from a PG+160 hydrogen generator (Vici DBS, Schenkon, Switzerland), and Air (Air Liquide). The GC column utilized was an Optima 5MS with a length of 30 m, an interior diameter of 0.25 mm, and a film thickness of 0.5 µm. Injection parameters involved a split flow of 20 mL/min, an inlet temperature of 250 °C, an injection volume of 0.5 µL, an initial pressure of 175 kPa, and a pressure-controlled mode. The oven temperature was maintained at 40 °C. Oven and pressure parameters were set as follows: an initial temperature of 40 °C for 1.5 min, followed by heating at a rate of 20 °C/min up to a final temperature of 320 °C. The initial pressure was maintained at 175 kPa for 2 min, then increased at a rate of 7.8 kPa/min up to a final pressure of 300 kPa. For the MS setup, the filament voltage was set at 70 kV, with an ion source temperature of 200 °C and a transfer line temperature of 200 °C. For the FID setup, the flow rates were 450 mL/min for synthetic air, and 45 mL/min for hydrogen gas, with a detector temperature of 280 °C. Post-separation, the gas flow was divided using a SilFlow™ (Crownhill, UK) GC Capillary Column 3-port Splitter to allow signal detection in both the MS and the FID. The FID was utilized for quantification, while the MS was used for compound identification. Thus, the MS was operated in scan mode, scanning a range from 33 u to 350 u with an event time of 0.3 s and an interscan delay of 0.02 s. The FID signals were used to calculate peak areas.
All samples, including electrolytes and mixtures, were compared and corrected against pure dilution solvent as well as pure electrolyte solvent. Whenever possible, impurities in the electrolyte solvents were identified based on NIST searches (using electron ionization fragmentation match), and by measuring the pure substance separately. Chromatograms of pure solvents can be found at https://zenodo.org/, accessed on 28 September 2023 (see below).

3. Results and Discussion

In this study, the effect of storage conditions and conducting salt source is investigated in terms of the formation of volatile degradation products in liquid electrolytes. The choice of appropriate storage conditions and conducting salt sources is crucial for maintaining the stability and performance of liquid electrolytes, especially in energy storage systems such as batteries. In order to make a comparison, two NaPF6 salts were selected for the study, one with purity of 99.5% and the other with purity of 99.9%. In addition, NaTFSI was directly compared with the corresponding NaPF6 conducting salt. As indicated in the introduction, an increased degradation of PF6 occurs above about 60 °C. Although this has been shown so far, especially for LiPF6, such a degradation is also plausible for NaPF6. For this reason, the maximum test temperature was limited to 65 °C.

3.1. NaPF6 with 99.5% Purity

A purity of 98.5–99.5% is the purity typically available commercially, so this provides a basis for the study.

3.1.1. Degradation Product Formation

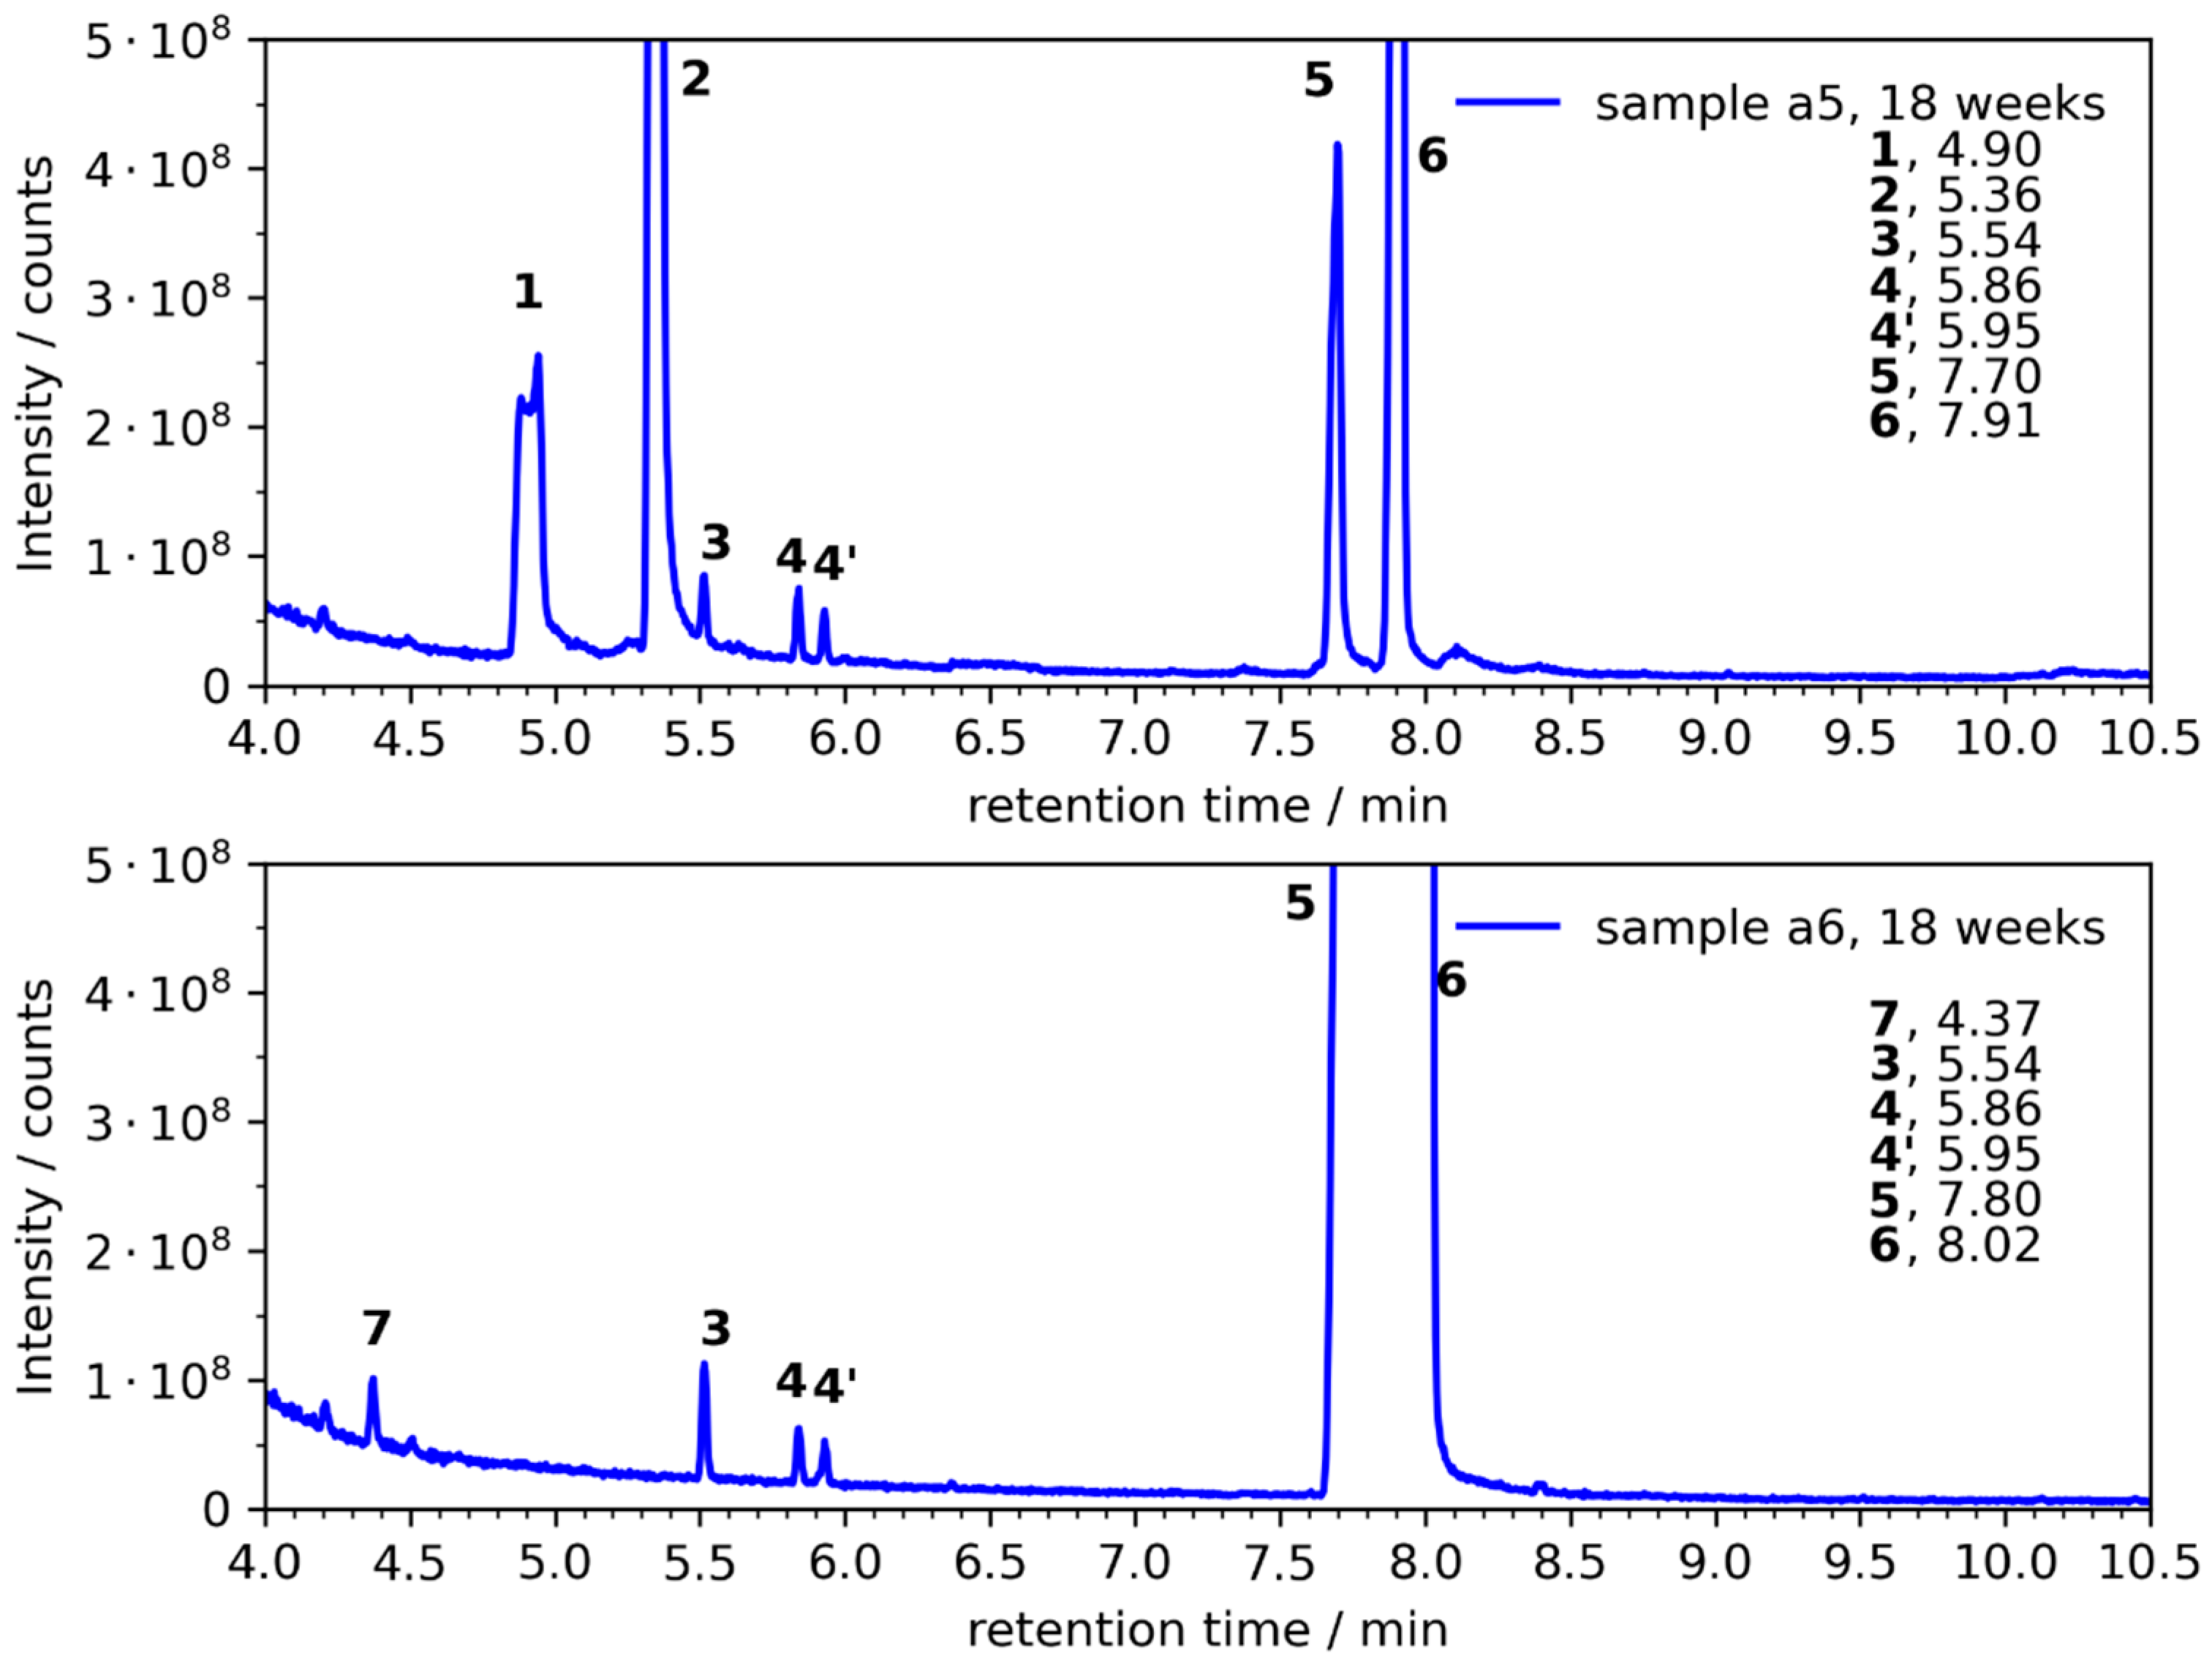
Initially, the storage of electrolytes without sodium was studied in polyethylene and aluminum vials. The chromatograms after a storage time of 18 weeks at T = 65 °C are depicted in Figure 1. Within the study, a number of components were found to be present in the electrolyte mixtures. The chemical structures of all compounds are depicted in Figure 2. In addition to the solvents and additives EC (5), PC (6) and FEC (10), decomposition products are in particular 1,2-ethanediol (ED, 1), 1,2-propanediol (PD, 2), 2-ethyl-1,3-dioxolane (3), 2-ethyl-4-methyl-1,3-dioxolane (4), amylene hydrate (7), 1.4-dioxane (8), ethanediol monoformate (9), diethylene glycol (11) and triethylene glycol (12). An overview of all compounds is presented in Table 6. Identification of these compounds was achieved by comparing both, retention time and specific mass fragmentation patterns with known reference standards, underscoring the multifaceted nature of the degradation process. The numbering was chosen according to the sequential position in the chromatograms. It was observed that some more very weak peaks were present in the chromatogram, indicating the formation of additional compounds. However, it was not possible to identify them confidently, so these peaks will not be discussed in this work.
The elution order, as a consequence of the respective volatilities and interactions with the GC column, commenced with amylene hydrate (2-methyl-2-butanol (7)), followed by 1,2-ethanediol (1), 1,2-propanediol (2), 2-ethyl-1,3-dioxolane (3), and finally 2-ethyl-4-methyl-1,3-dioxolane (4). This order is significant as it can provide insights into the physicochemical characteristics of these compounds, particularly their volatility and polarity, which are fundamental in their interaction with the column and thus their separation. (1) and (2) could be formed from the reduction in EC and PC, respectively.
Interestingly, the chromatogram showed that 2-ethyl-4-methyl-1,3-dioxolane (4) was characterized by two distinct peaks (4 and 4′). This result implies the presence of two separate species, possibly due to structural isomers or different conformations. It is critical to note this aspect as it highlights the complexity of the degradation process and suggests the existence of multiple pathways or mechanisms. 2-Methyl-2-butanol (7), for instance, suggests the occurrence of reduction reactions involving alkyl carbonate solvents.
It was observed that in aluminum vials no formation of the diols (1) and (2) took place (see also Table 7 and Table 8). In addition, both components (3) and (4/4′), which were also formed in lower concentration relative to EC and PC than in the plastic vials, only (7) was found. This was also confirmed at a storage temperature of T = 40 °C (Table 7 and Table 8).
Figure 3 compares the electrolyte after storage for 18 weeks with sodium metal at T = 40 °C and T = 65 °C. It was observed that in the case of T = 40 °C the diol formation is significantly lower (compound (1) and (2)) and the dioxolane adducts (3) and (4/4′) do not occur at all. Compared to the electrolytes without sodium, the formation of the diol components (1) and (2) is enhanced. This is indicative of Na-induced decomposition, whereas the formation of the dioxolane components (3) and (4/4′) is rather inhibited in the case when sodium is present.
Table 7 shows an overview about the degradation product formation identified in the analysis, specifying the particular electrolytes in which they were formed, along with the corresponding week of detection. This information sheds further light on the temporal and compositional complexity of the degradation process, illustrating the dynamic nature of the electrolyte system.
These findings offer a deeper understanding of the stability and degradation behavior of the electrolyte system, with the presence and identification of these degradation products signifying key information on the possible reactions or pathways taking place in the system. This can be further used to optimize and improve the stability and performance of sodium-based batteries in future studies. The time evolution of the diol and dioxolane formation can be seen clearly, which is considerably accelerated at higher temperature and already shows significant decomposition in the electrolyte after 3 weeks. The results are also important for half-cell experiments with sodium, which are carried out at higher temperatures, since they show that electrolyte degradation already occurs without cell potential in the presence of sodium metal.

3.1.2. Degradation Product Formation in the Presence of NaDFOB and FEC

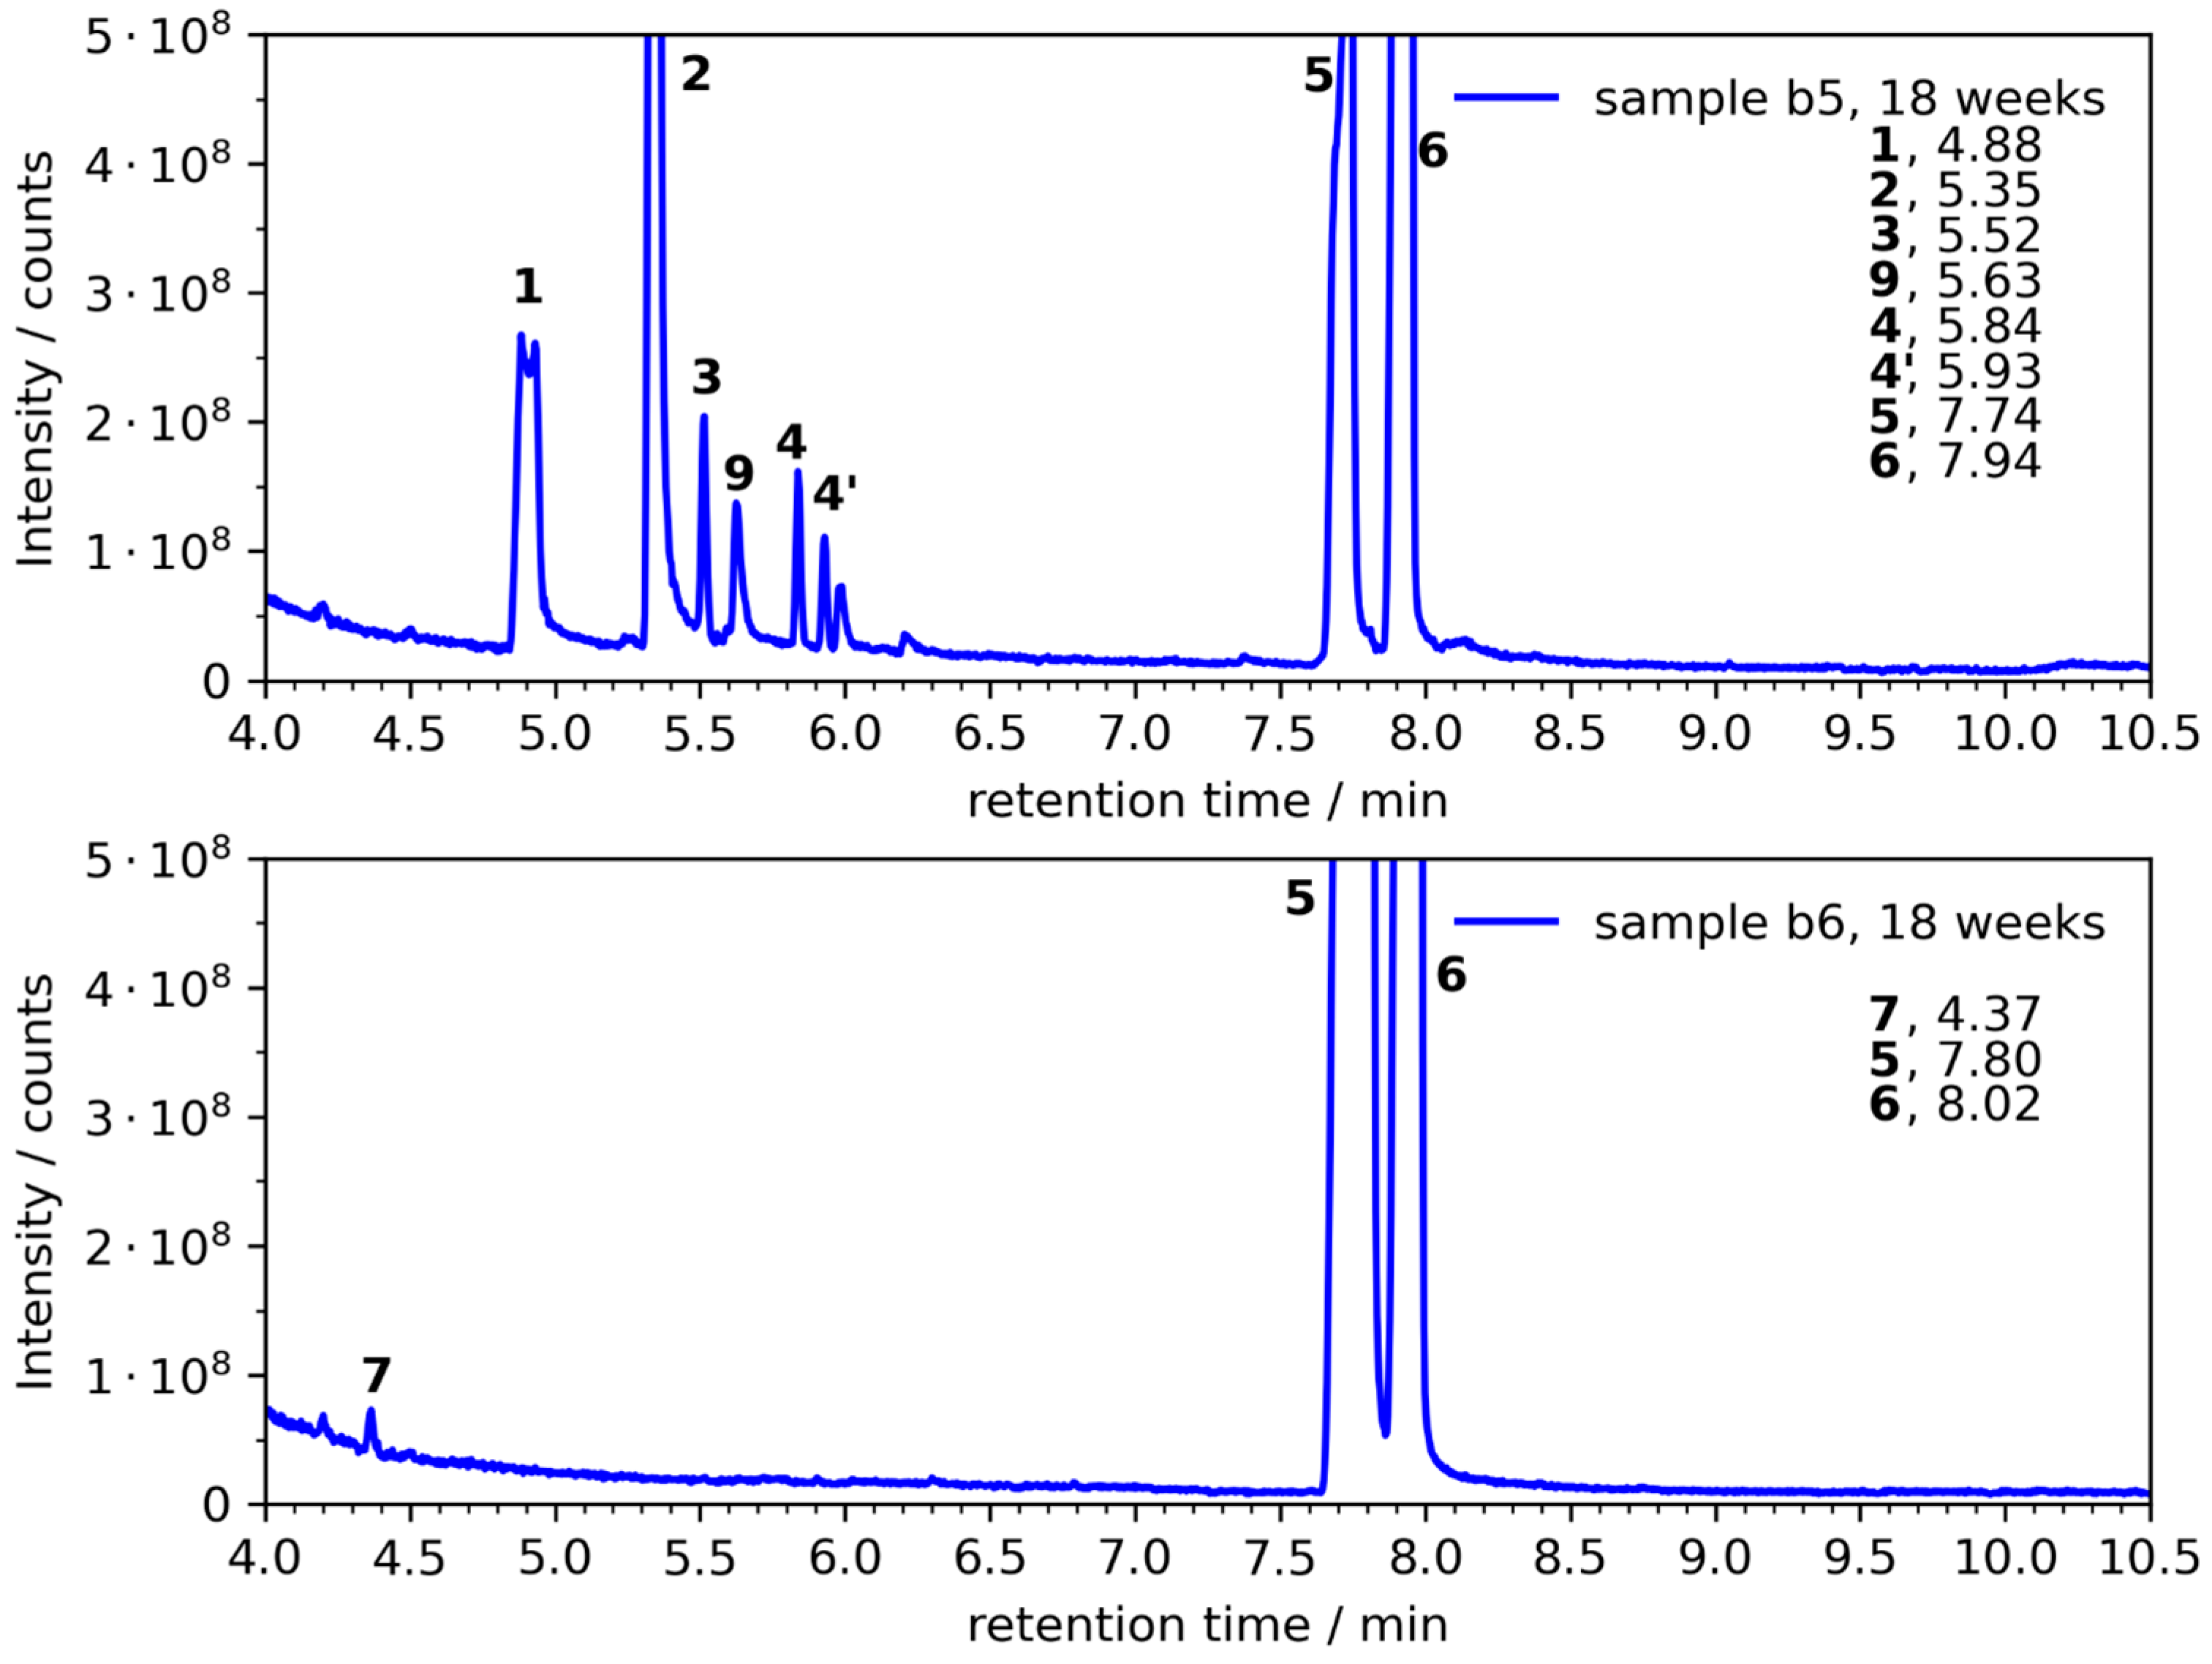
In the next step, the electrolytes were investigated with both additives, NaDFOB and FEC. These additives are suitable for cycling sodium half cells and were selected for this reason. An overview about all detected decomposition products as well as the additive FEC is presented in Table 8. Corresponding chromatograms are shown in Figure 4 for NaDFOB and in Figure 5 for the FEC additive. It is obvious that the storage in aluminum vials reduces the formation of diols as well as dioxolanes significantly (Figure 4 and Figure 5). Table 8 shows the time-dependent formation of degradation products. In the case of NaDFOB when stored in PE vials, the product (9) is detected, which is formed first at higher temperature (65 °C), but then at 40 °C when the reaction time is longer. The detection of (9) implies partial degradation of ethylene carbonate (EC), one of the primary components of the electrolyte.
The storage tests containing FEC as an additive show that FEC is consumed and no longer detectable when the electrolyte is brought into contact with sodium metal (c1, c4), even after 3 weeks at T = 40 °C. This means that FEC reacts readily with Na metal. This highlights the suitability as an additive because FEC forms a boundary phase which then enables cell cycling. However, this also means that FEC is continuously consumed and explains the well-known rapid deterioration that occurs in the case of cell tests as soon as FEC is no longer present, since the newly forming Na surface is then no longer protected. Surprisingly, it was also found that FEC decomposes over time, especially at higher temperatures when stored in PE vials, and is no longer detectable in the electrolyte (Figure 5, sample c5). In this case, storage in Al vials is strongly recommended.
Storage in Al vials is confirmed by the results shown in Table 7 and Table 8 where the resilience of electrolytes stored in aluminum vials is clearly visible. The reason for the superior characteristics of aluminum vials vs. PE or PP vials could not be clarified by the study. It is plausible that there is a difference in the sealing properties, especially at higher temperatures (even if the containers were stored again in sealed glass containers under argon), or that plastic components were released, which then accelerated the degradation reactions. In essence, the experiments show that PE vials should not be used for storage of the electrolytes.

3.1.3. Analysis of Diol Formation

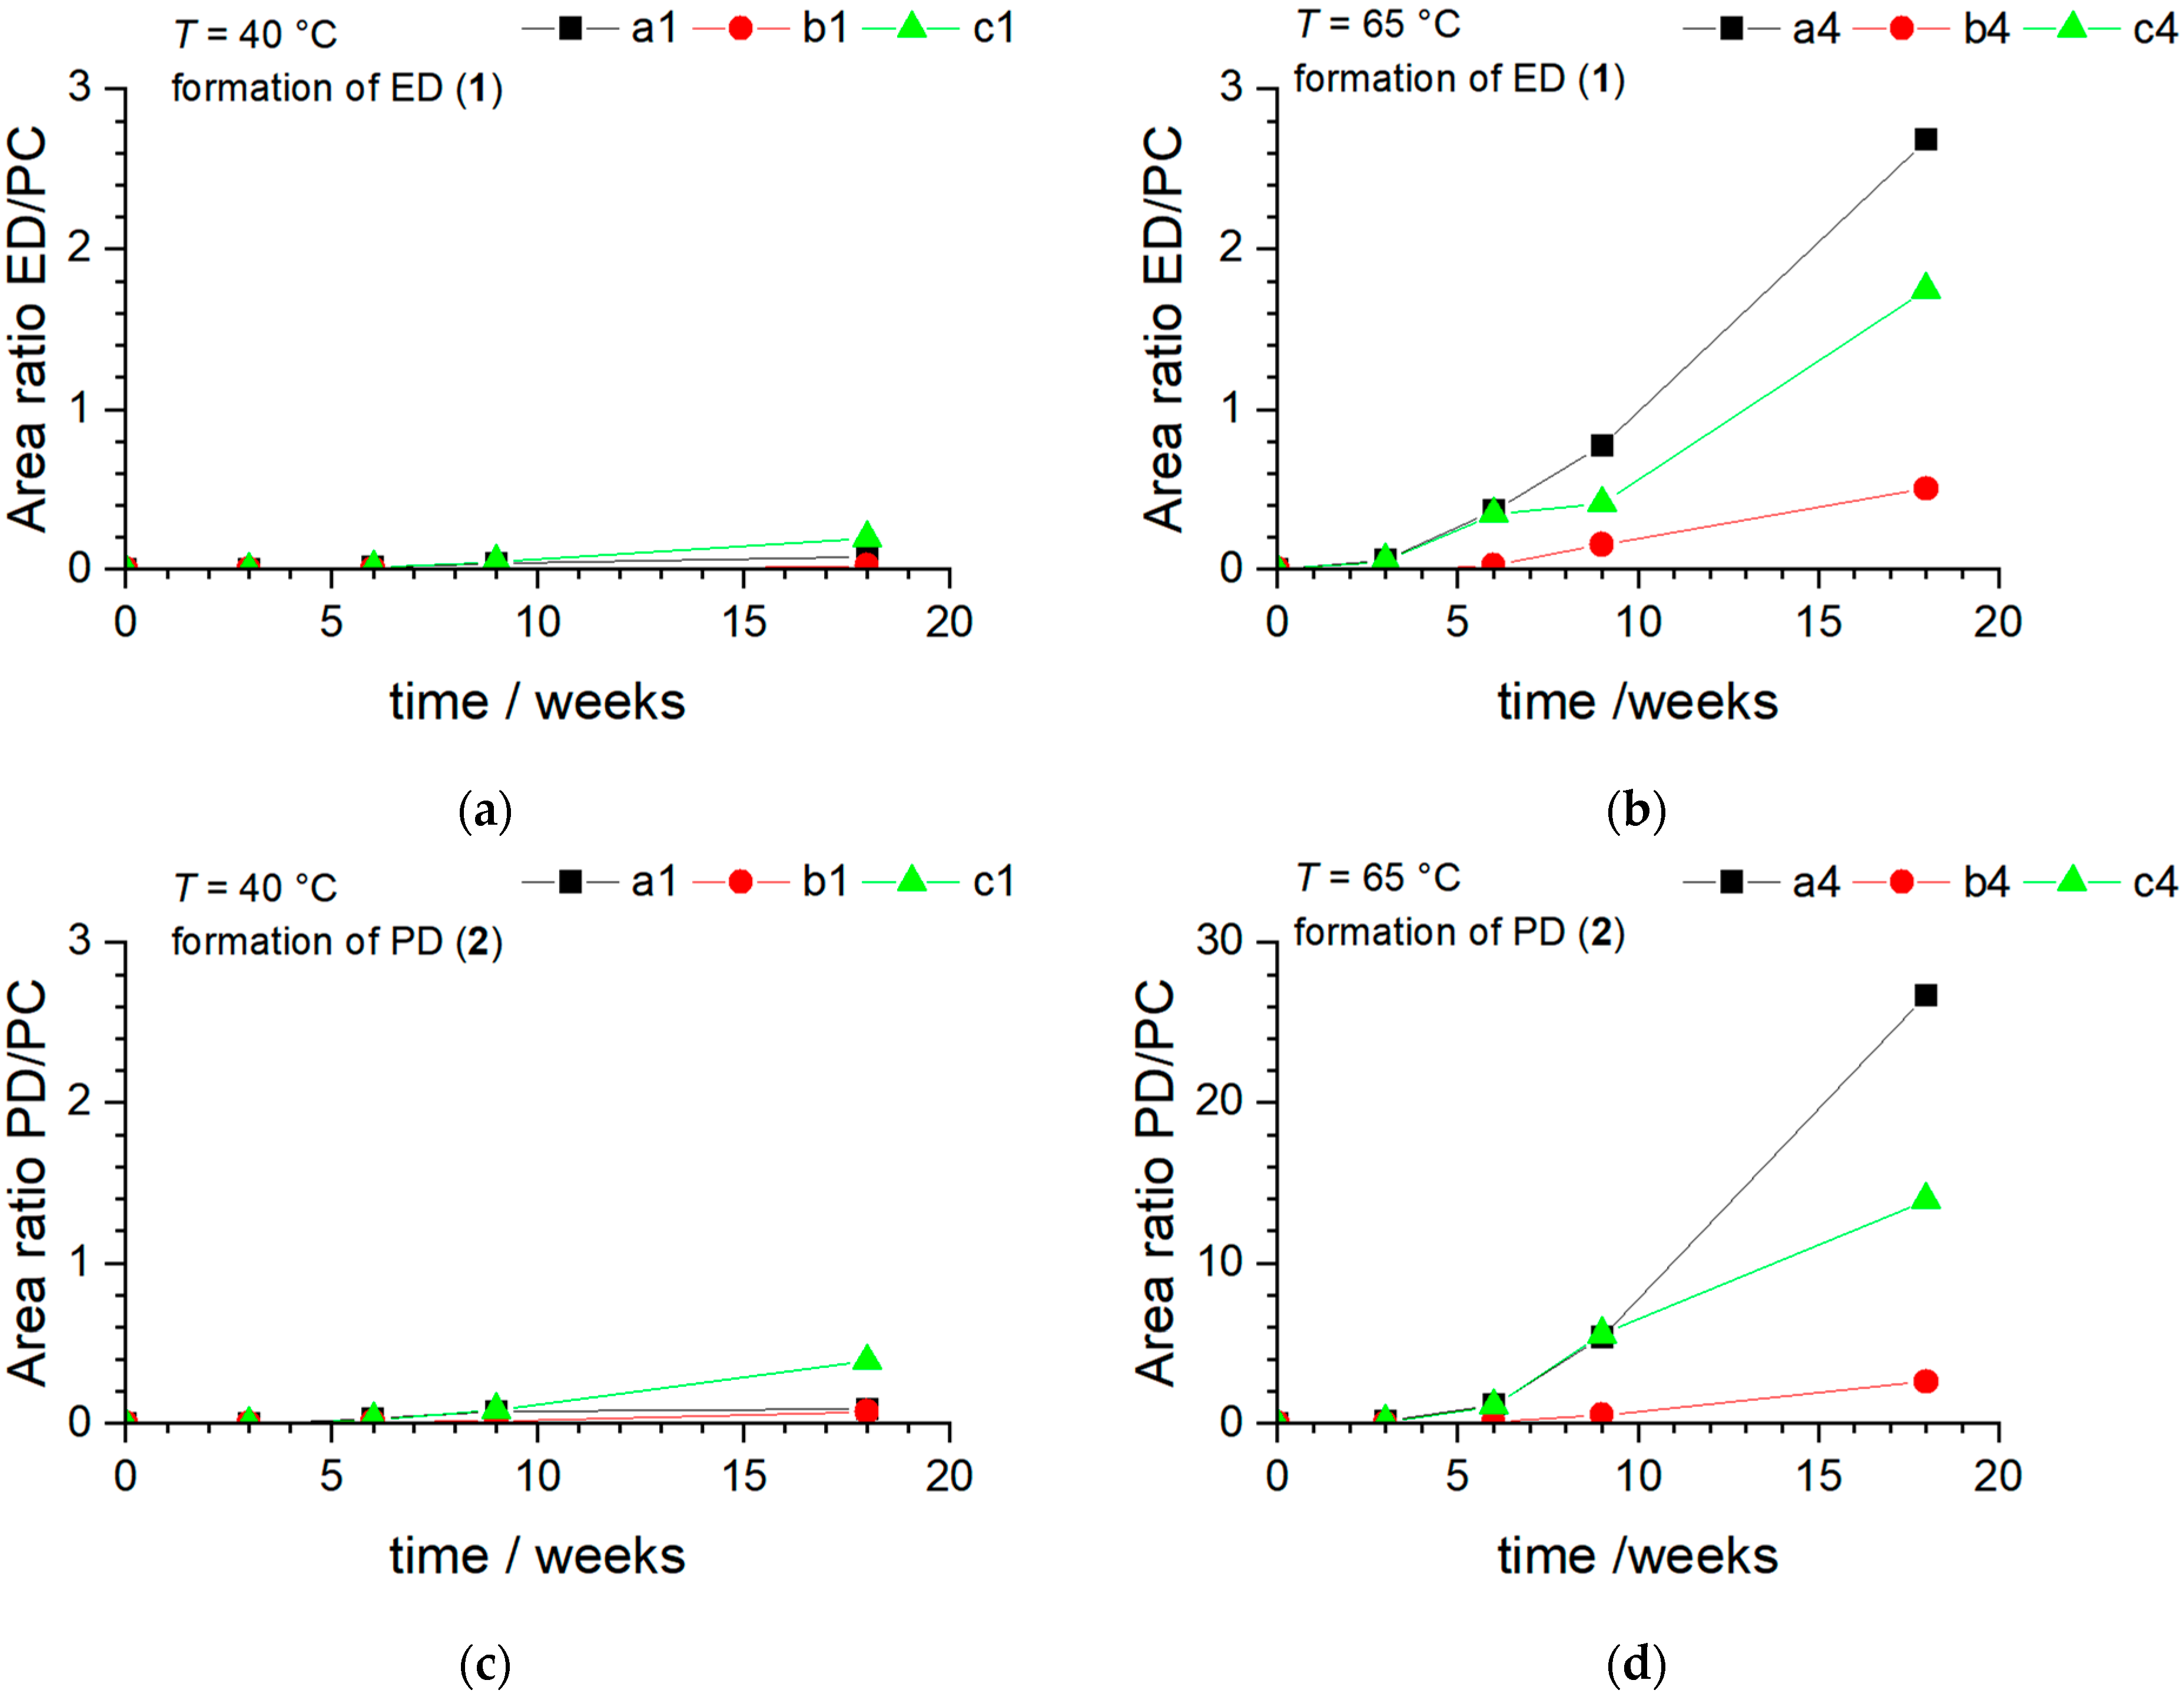
The GC-MS analysis, conducted on the samples stored in plastic vials to identify degradation products, showed that 1,2-ethanediol (1, ED) and 1,2-propanediol (2, PD) demonstrated higher relative intensities. Therefore, these both compounds were selected for further evaluation. To accomplish this, mass area ratios of both ED and PD relative to propylene carbonate (PC) were calculated. Figure 6 illustrates the formation of ED and PD in electrolytes, both with and without additives (NaDFOB and FEC) over time, specifically at temperatures of 40 °C and 65 °C. A clear observation from Figure 6 is that the formation of both diol degradation products is significantly higher at 65 °C than at 40 °C. This phenomenon is consistent with chemical reactions, where elevated temperatures increase reaction rates and, consequently, expedite the degradation of the electrolyte.
At 40 °C, both graphs in Figure 6 depicted a trend of increasing ED and PD formation over time with the FEC additive (c1). However, in the electrolyte a1 without any additive, PD formation began to plateau after nine weeks. At 65 °C, both products exhibited a similar trend in formation, but the electrolyte a4 without any additive demonstrated a more substantial increase in both, ED (1) and PD (2) over time. This significant increase could be due to an enhanced reaction rate at elevated temperatures, leading to faster degradation of the electrolyte.
Interestingly, the formation of ED in the presence of the FEC additive (c4) was less pronounced at the higher temperature, suggesting that the FEC additive may have a stabilizing effect at elevated temperatures (Figure 6). Meanwhile, for PD formation at 65 °C, the electrolyte c4 with the FEC additive exhibited an equal amount of PD after 9 weeks compared to the electrolyte a4 without any additives. However, after 18 weeks, the effect of the FEC additive became more pronounced, leading to a reduced amount of PD. This suggests that the FEC additive might exert its stabilizing effect over a longer time frame, demonstrating its potential in enhancing the long-term stability of electrolytes.
Remarkably, in both temperature conditions, the formation of ED and PD was minimal in the electrolytes b1 and b4 with the NaDFOB additive. This suggests that NaDFOB could be interacting with potential reactants or intermediates, mitigating the reaction pathways leading to ED and PD. In addition, the electrolytes b1 and b4 (Figure 6) containing the NaDFOB additive outperform the other electrolyte formulations across all conditions. With significantly lower levels of ED and PD formation, this additive shows strong potential as a stabilizing agent in the electrolyte system. The NaDFOB additive’s efficacy aligns with earlier observations, reinforcing the hypothesis that it might mitigate degradation reactions, thereby enhancing electrolyte stability [75].
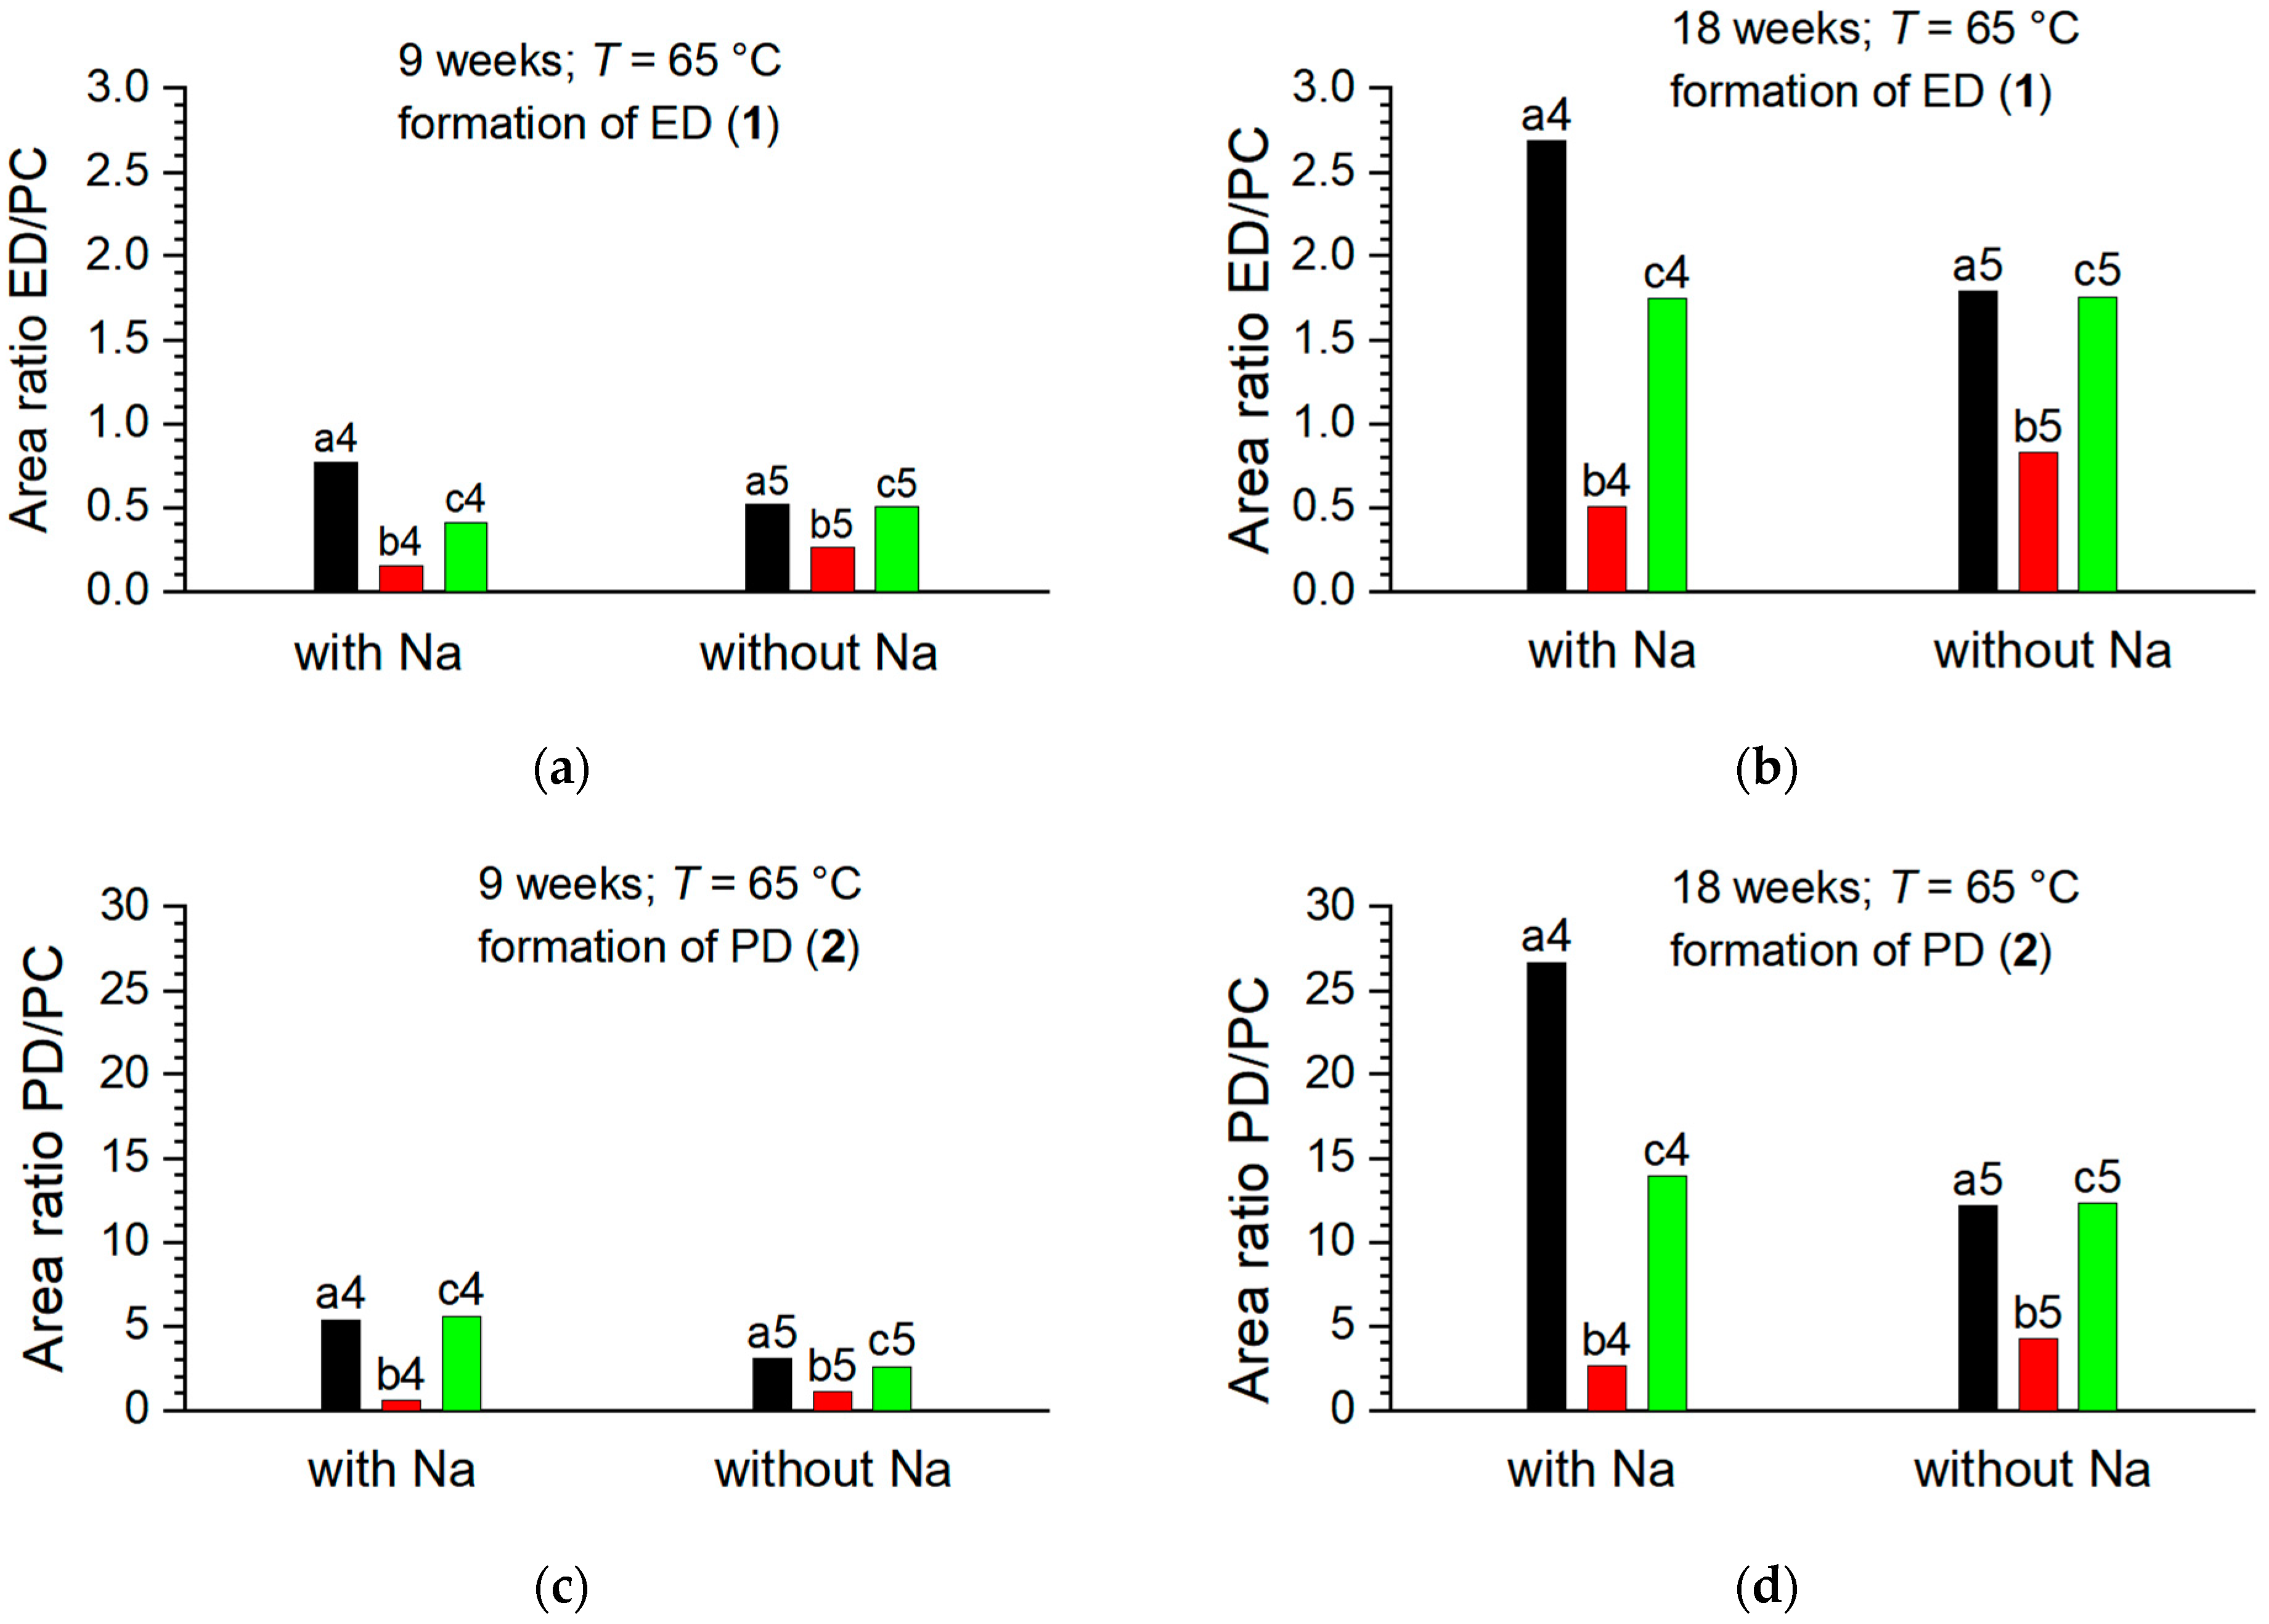
The impact of sodium metal immersed in the electrolytes was also evaluated more carefully. In Figure 7, a direct comparison with and without sodium metal is depicted for T = 65 °C. The electrolytes without additives showed tendentially slightly lower formation of ED and PD when Na metal was absent, suggesting that the presence of sodium metal may catalyze the electrolyte degradation process to some extent. However, such an effect cannot be observed in case of both additives. In case of FEC, the formation of (1) and (2) is almost identical with and without Na which further supports the readily surface reaction of FEC with Na metal. In this case the promotion of the Na metal regarding the diol formation is inhibited. It is quite interesting that in case of NaDFOB the formation of the diol derivatives is reduced. It is assumed that the NaDFOB additive directly influence the mechanism of the diol formation in the electrolyte. Nevertheless, NaDFOB is not able to fully inhibit the formation of diols. When subjected to a temperature of 40 °C (not shown here), the samples (a2, b2, and c2) that did not undergo immersion in Na metal exhibited negligible EO or PO formation after both, 9-week and 18-week intervals. This observation underscores the role of Na metal immersion in facilitating the EO and PO formation processes within the designated time frames.

3.2. NaPF6 with 99.9% Purity

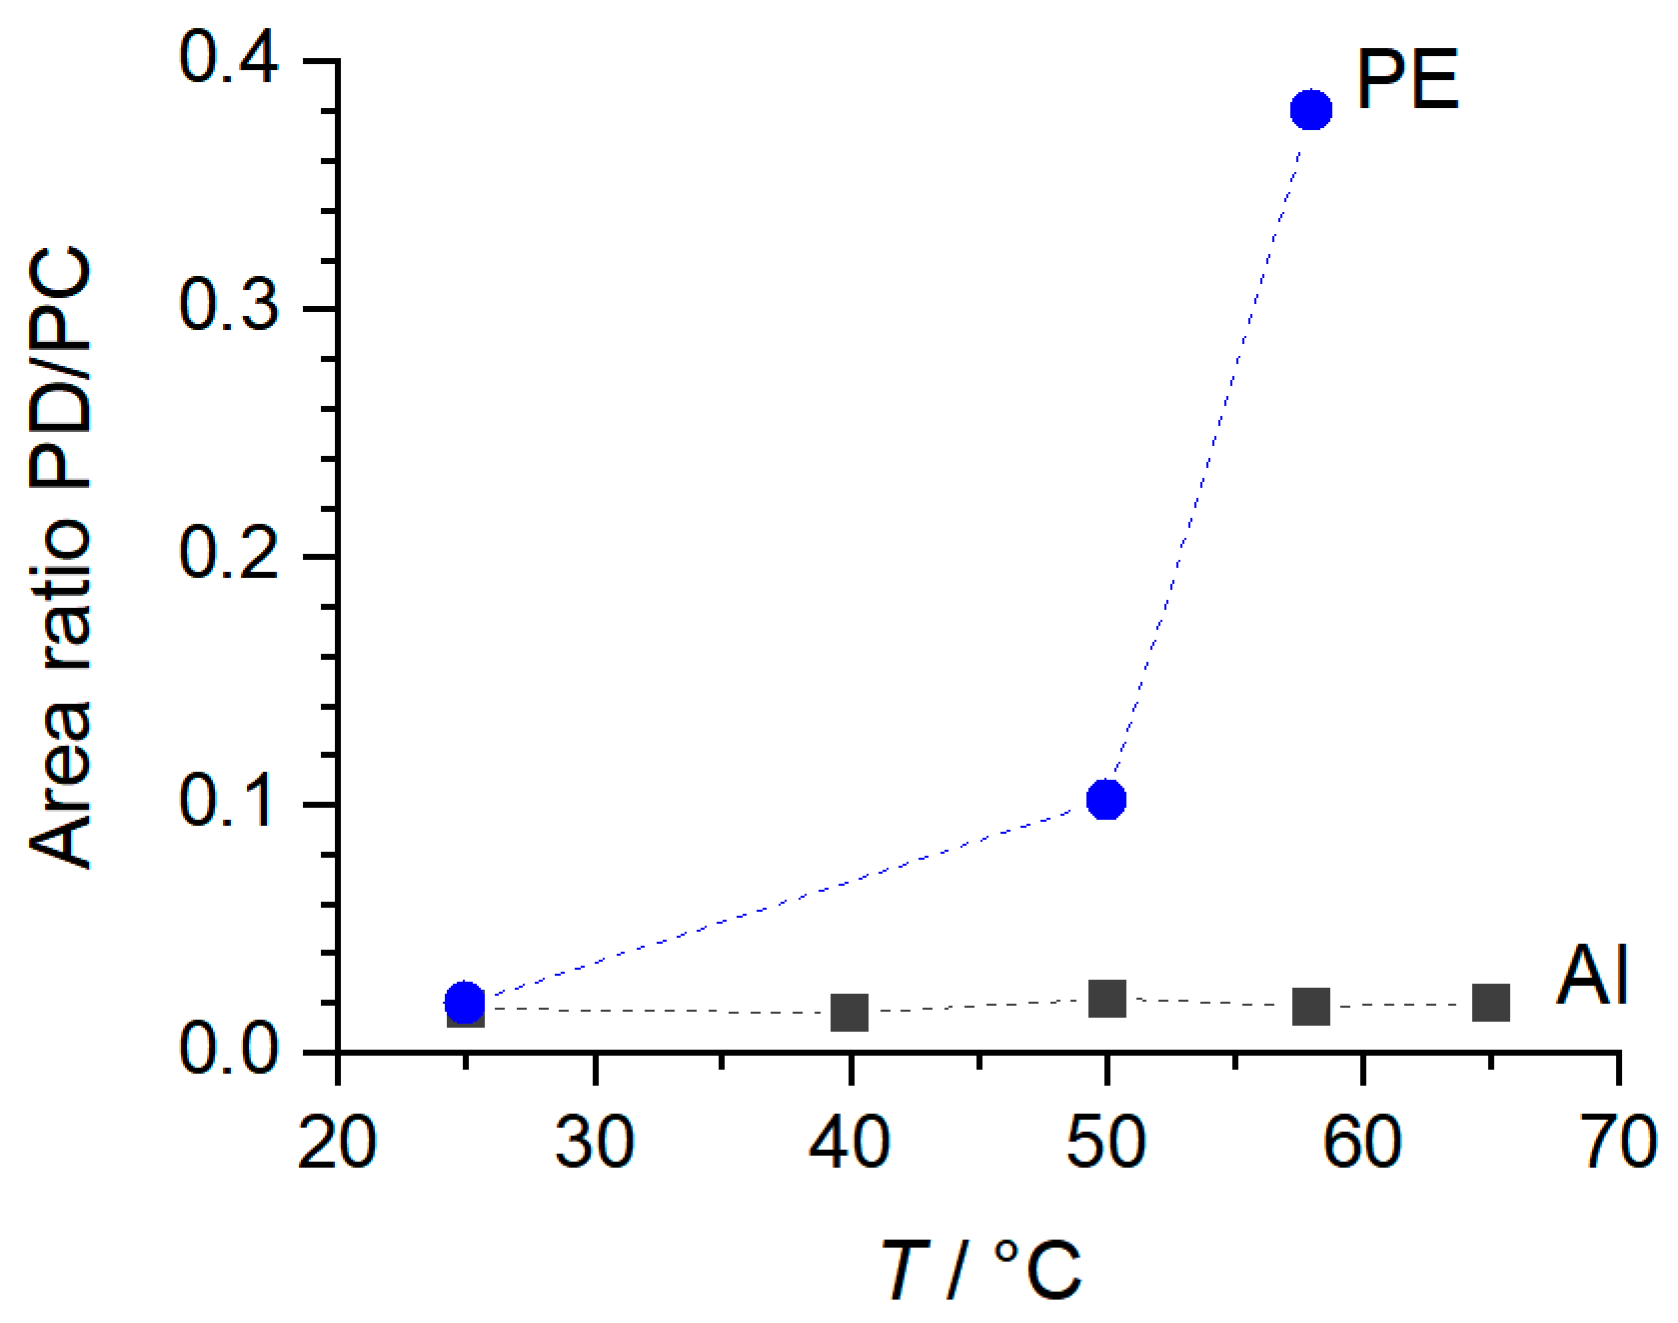
The electrolytes incorporating NaPF6 conductive salt with a purity of 99.9% demonstrated significantly different degradation behaviors compared to those using the less-pure salt (see above). Remarkably, the electrolytes with the high-pure salt showed considerably lower amounts of degradation product formation. Specifically, the degradation product PD (2) only started forming after an extended duration of 15 weeks, with the lone exception being sample a12, where PD (2) formation was observed after 9 weeks. In terms of ED (1) formation, it was detected only in the samples of a10 and a12, after a prolonged storage duration of 15 weeks. It is important to note that these samples were stored even at relatively higher temperatures of 50 and 58 °C, respectively. Figure 7 illustrates the influence of storage materials on the PD formation. It can be observed that in PE vials, the amount of PD increased with temperature significantly, highlighting the temperature dependence of the degradation process (Figure 8). In contrast, the PD formation in aluminum vials remained constant over the temperature range between 25 °C and 65 °C, suggesting an enhanced thermal stability offered by these vials.
The observations with NaPF6 source point to a notable influence of the source of the conductive salt on electrolyte stability. This difference could be attributed to variations in impurity profiles or minute differences in physical properties of the NaPF6 salt quality. The results underscore the importance of raw material quality in determining the performance and stability of the electrolytes. Moreover, the distinct behaviors of PE and aluminum vials further emphasize the role of storage material in electrolyte stability. Despite the same electrolyte composition, the material of the vial plays a significant role, potentially due to its thermal properties or its interaction with the electrolyte components.
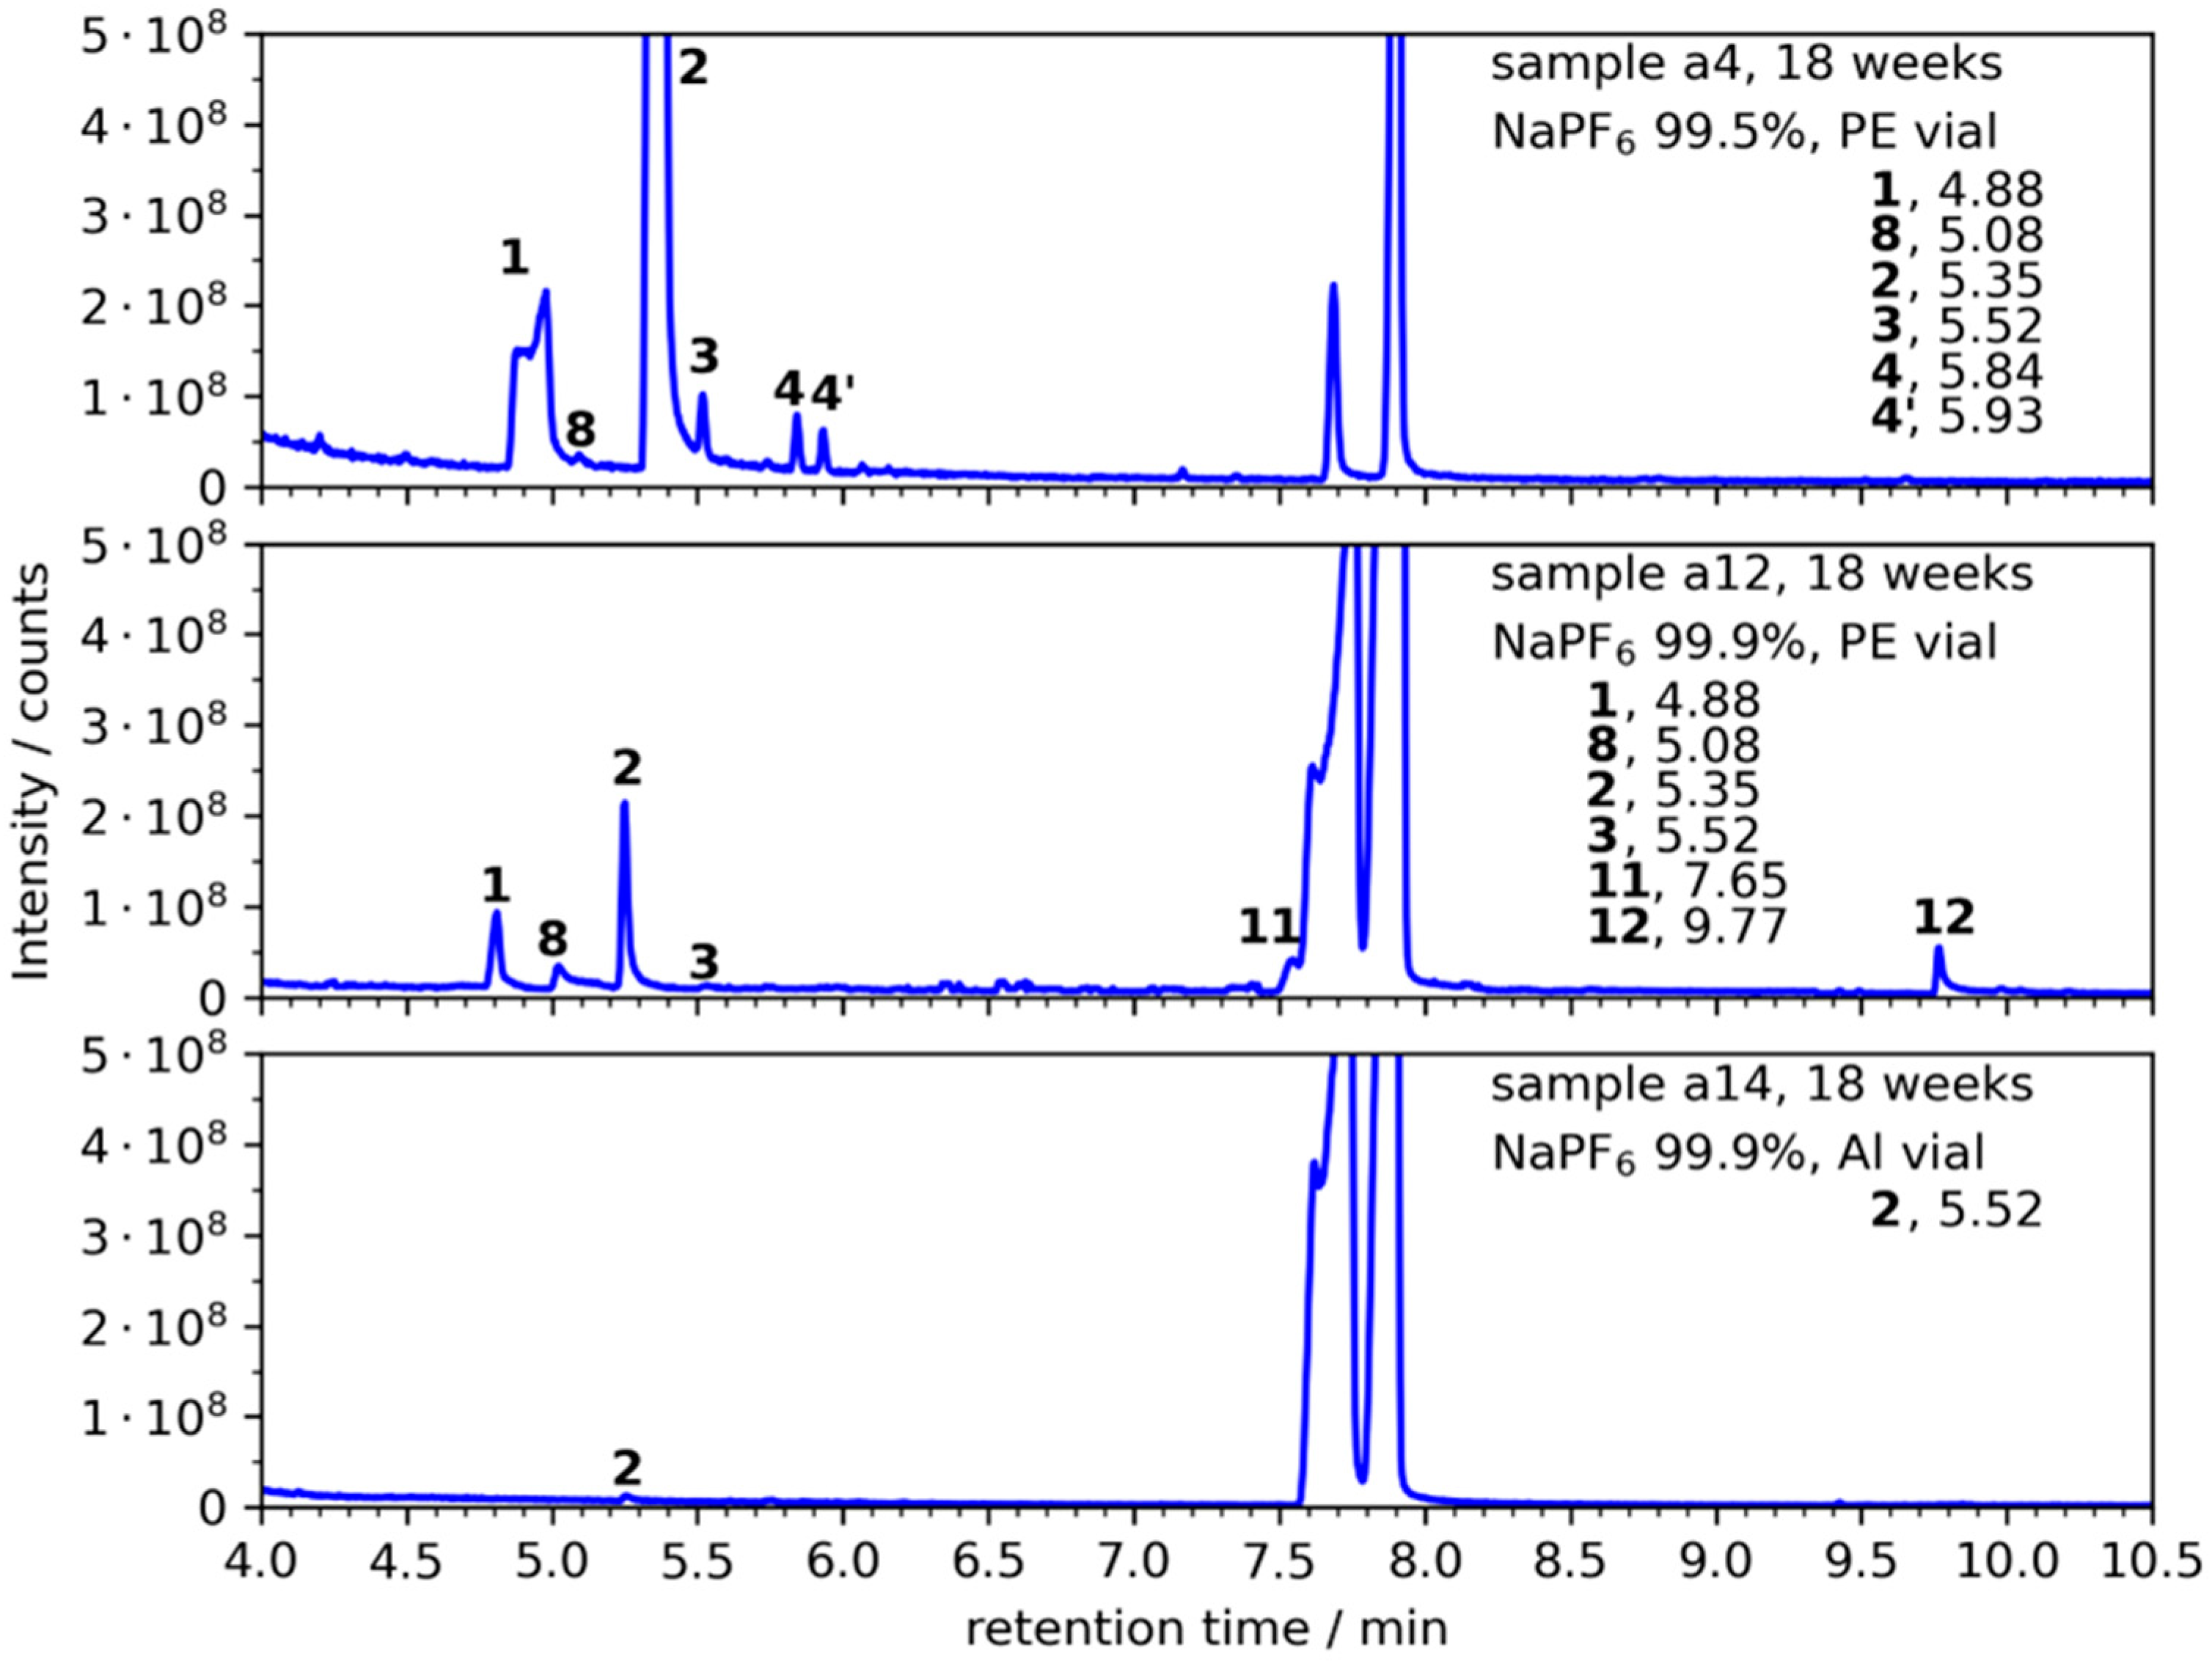
Figure 9 offers a comparative analysis of the degradation products formed in electrolytes of samples a4, a12, and a14, all stored at T = 65 °C. The reduced intensity of degradable components in sample a12, which uses NaPF6 with 99.9% purity, compared to sample a4 (NaPF6 purity of 99.5%), is a confirmation to the positive impact of higher purity on electrolyte stability. This observation reinforces the earlier discussion on the importance of raw material purity in determining the performance and stability of the electrolytes. The absence of component 4 (2-ethyl-4-methyl-1,3-dioxolane) in sample a12 is noteworthy. This could be attributed to the absence or reduced concentration of specific impurities in the higher purity NaPF6 that might catalyze or initiate the formation of this compound. The detection of diethylene glycol (11) and triethylene glycol (12) in sample a12 only after 18 weeks suggests a slow degradation process. These compounds might be formed through secondary reactions or the further breakdown of primary degradation products. Their delayed appearance underscores the enhanced stability offered by the higher purity NaPF6. The observation that only 1,2-propanediol (2) was formed in sample a14, stored in aluminum, further emphasizes the protective role of aluminum vials. The metal’s thermal properties and chemical inertness likely contribute to this observed stability.
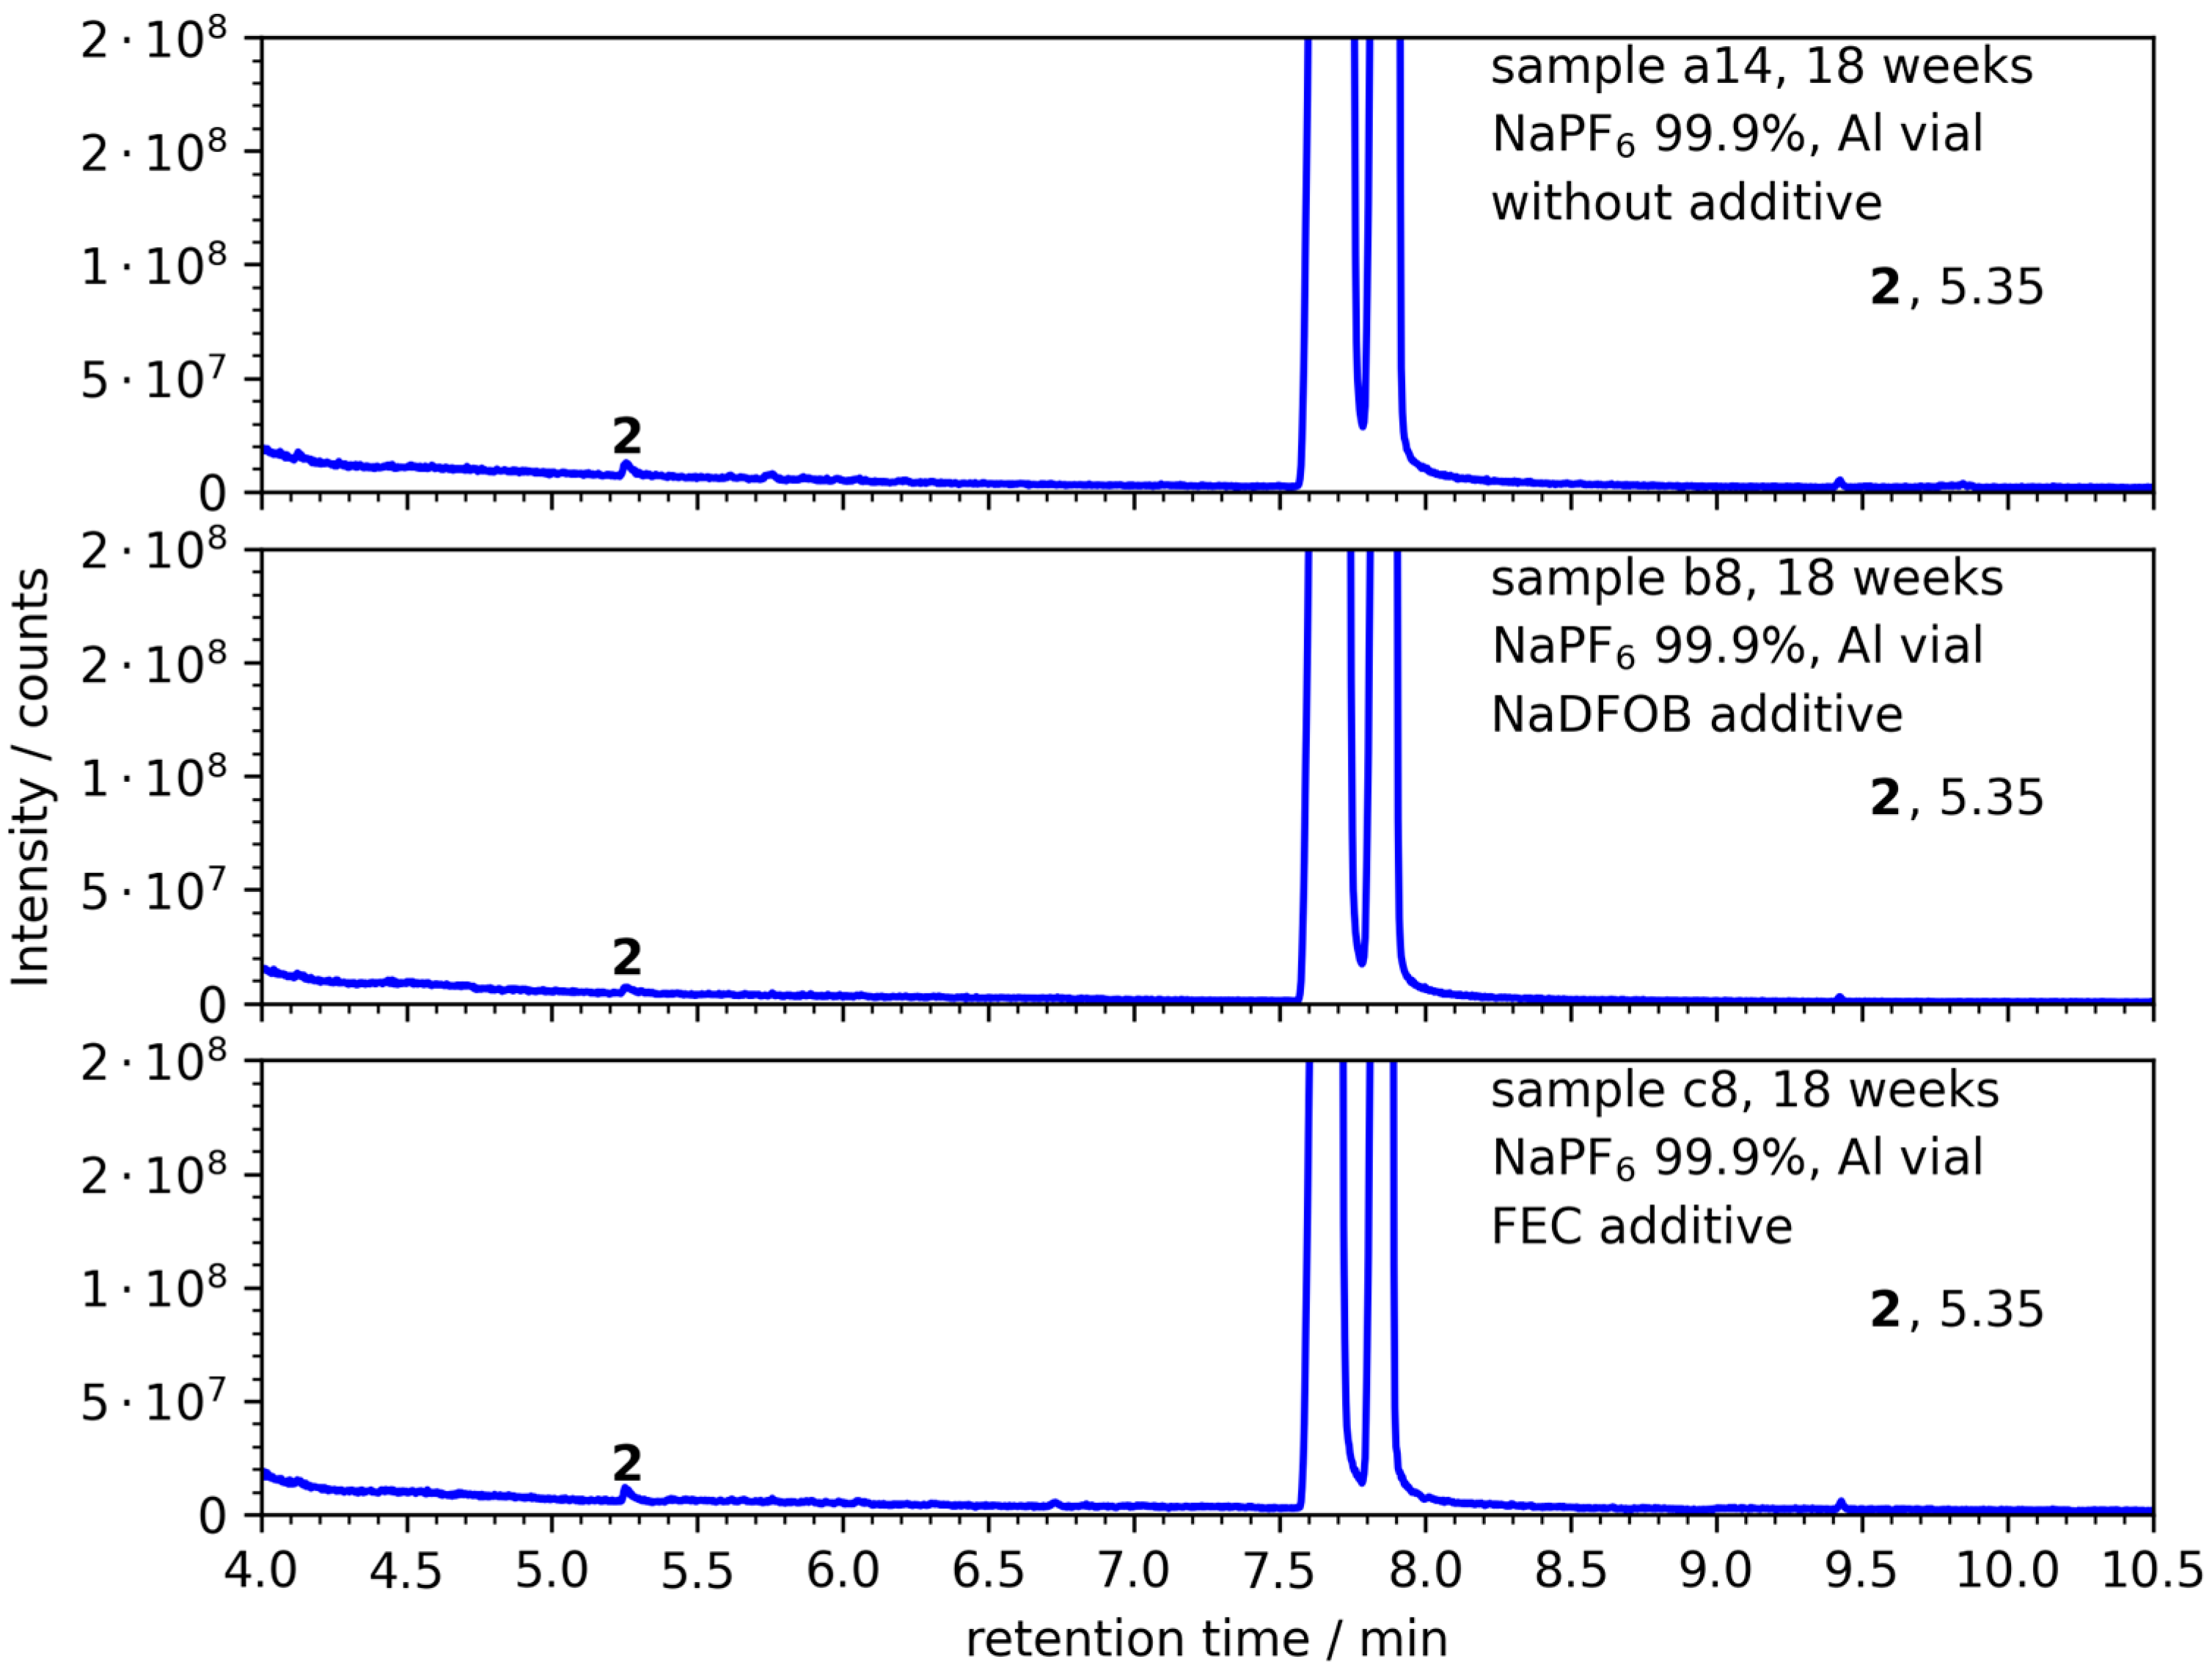
Figure 10 provides a detailed comparison of the degradation products formed in electrolytes of samples a14, b8, and c8, all stored at T = 65 °C in aluminum vials over sodium metal. These samples utilized the higher purity NaPF6, and the study aimed to understand the influence of different additives, namely NADFOB and FEC, on the degradation behavior of the electrolytes. A striking observation from the figure is the consistent formation of only 1,2-propanediol (2) across all three samples, irrespective of the presence or absence of additives. This consistency suggests that the formation of 1,2-propanediol is a dominant degradation pathway under these conditions and is not significantly influenced by the additives in question.
The use of aluminum vials, known for their thermal properties and chemical inertness, might also play a role in this consistent observation. The vials could be limiting the degradation pathways by offering a more stable environment, further narrowing down the degradation products to just 1,2-propanediol.
When the temperature is reduced to 40 °C (not shown here), a notable observation is the significantly reduced intensity of 1,2-propanediol (2). This suggests that the degradation process, leading to the formation of this compound, is notably subdued at this lower temperature. Another intriguing observation is the persistent presence of FEC in the electrolyte of sample c7. This contrasts with the behavior observed in sample c8 from Figure 10, where FEC, despite being used as an additive, had disappeared when the electrolyte was stored at 65 °C. This difference underscores the temperature-dependent reactivity of FEC. At the elevated temperature of 65 °C, FEC seems to undergo rapid degradation or consumption, leading to its absence in the electrolyte. However, at the milder temperature of 40 °C, FEC remains stable and does not degrade as quickly, allowing for its detection in the electrolyte even after the storage period.

3.3. NaTFSI with 99.9% Purity

The results obtained from the analysis of electrolytes using NaTFSI as the conductive salt illustrate a similar behavior to that observed with high-pure 99.9% NaPF6. Across most samples, the formation of PD is detected after a lengthy storage duration of 15 weeks, with the exceptions being samples d1, e1, f1, and f3. These samples were stored in PE vials, and notably, they had sodium metal immersed in them.
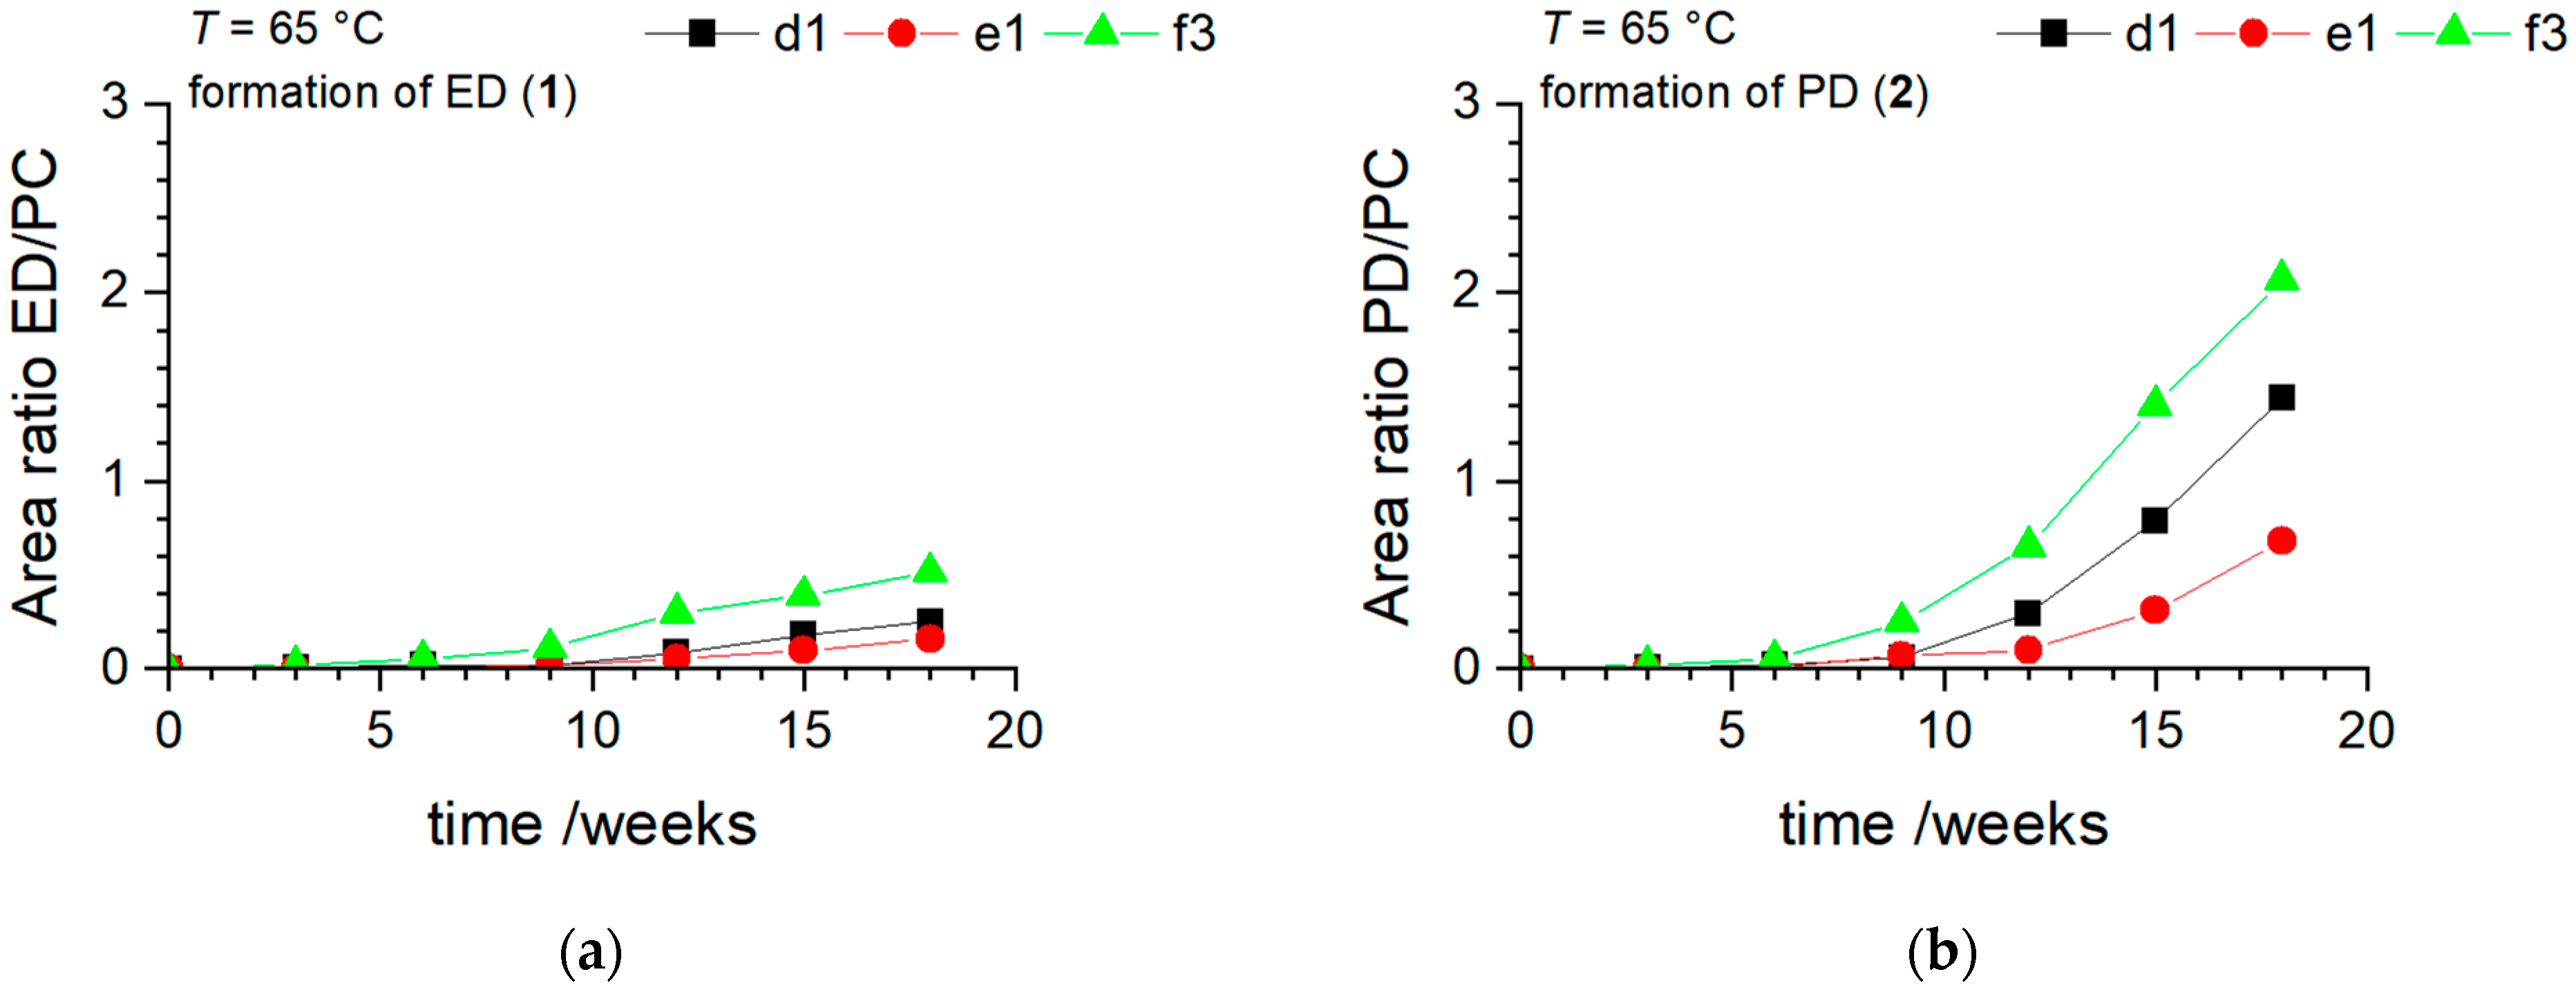
Figure 11 illustrates the formation of ED and PD over 18 weeks in PE vials with different additives, and the superior performance of the NaDFOB additive becomes evident. Both PD and ED formation were the least in electrolytes with this additive, suggesting that NaDFOB can effectively mitigate degradation processes in these electrolytes. The graphical representation (Figure 12) of the area ratio of ED/PC and PD/PC against time provides a comprehensive view of the degradation behavior of the electrolytes f1 and f3 over an 18-week period. Both these electrolytes were stored in PE vials and contained the FEC additive, but they were subjected to different temperature conditions: f1 at 40 °C and f3 at 65 °C.
From the Figure 12a, which plots the formation of ED against time, a clear trend emerges. The amount of ED in both electrolytes increases over time, but the rate of increase is markedly different between the two. The electrolyte f3, stored at the higher temperature of 65 °C, exhibits a significantly accelerated formation of ED compared to its counterpart, f1, stored at 40 °C. This observation aligns with the fundamental understanding of chemical kinetics, where reaction rates, and consequently degradation rates, are known to increase with temperature. The elevated temperature likely provides the necessary energy to overcome activation barriers more readily, leading to faster degradation.
The Figure 12b, focusing on PD formation, mirrors the trend observed for ED. The temporal increase in PD is evident for both electrolytes, but once again, the electrolyte f3 demonstrates a more pronounced increase. The significant difference in PD formation between both temperature conditions further underscores the temperature’s pivotal role in influencing the degradation behavior of these electrolytes.
The presence of the FEC additive in both electrolytes was expected to offer some level of stabilization. While the additive does play a role, as evidenced by the formation of degradation products over an extended period rather than immediately, its efficacy seems to be compromised at higher temperatures. The significantly higher formation of ED and PD in the f3 electrolyte suggests that while FEC might offer protection, its stabilizing effect is temperature-dependent and diminishes at elevated temperatures.
The degradation behavior of the electrolytes listed in Table 5 is consistent in terms of the formation of PD. The majority of these electrolytes began to show the presence of PD after an extended storage duration of 15 weeks. This consistent observation across multiple samples underscores the stability of these electrolytes, especially when considering the relatively long-time frame required for the onset of degradation. The low intensity of PD, even when it does form, further emphasizes the resilience of these electrolytes against degradation.
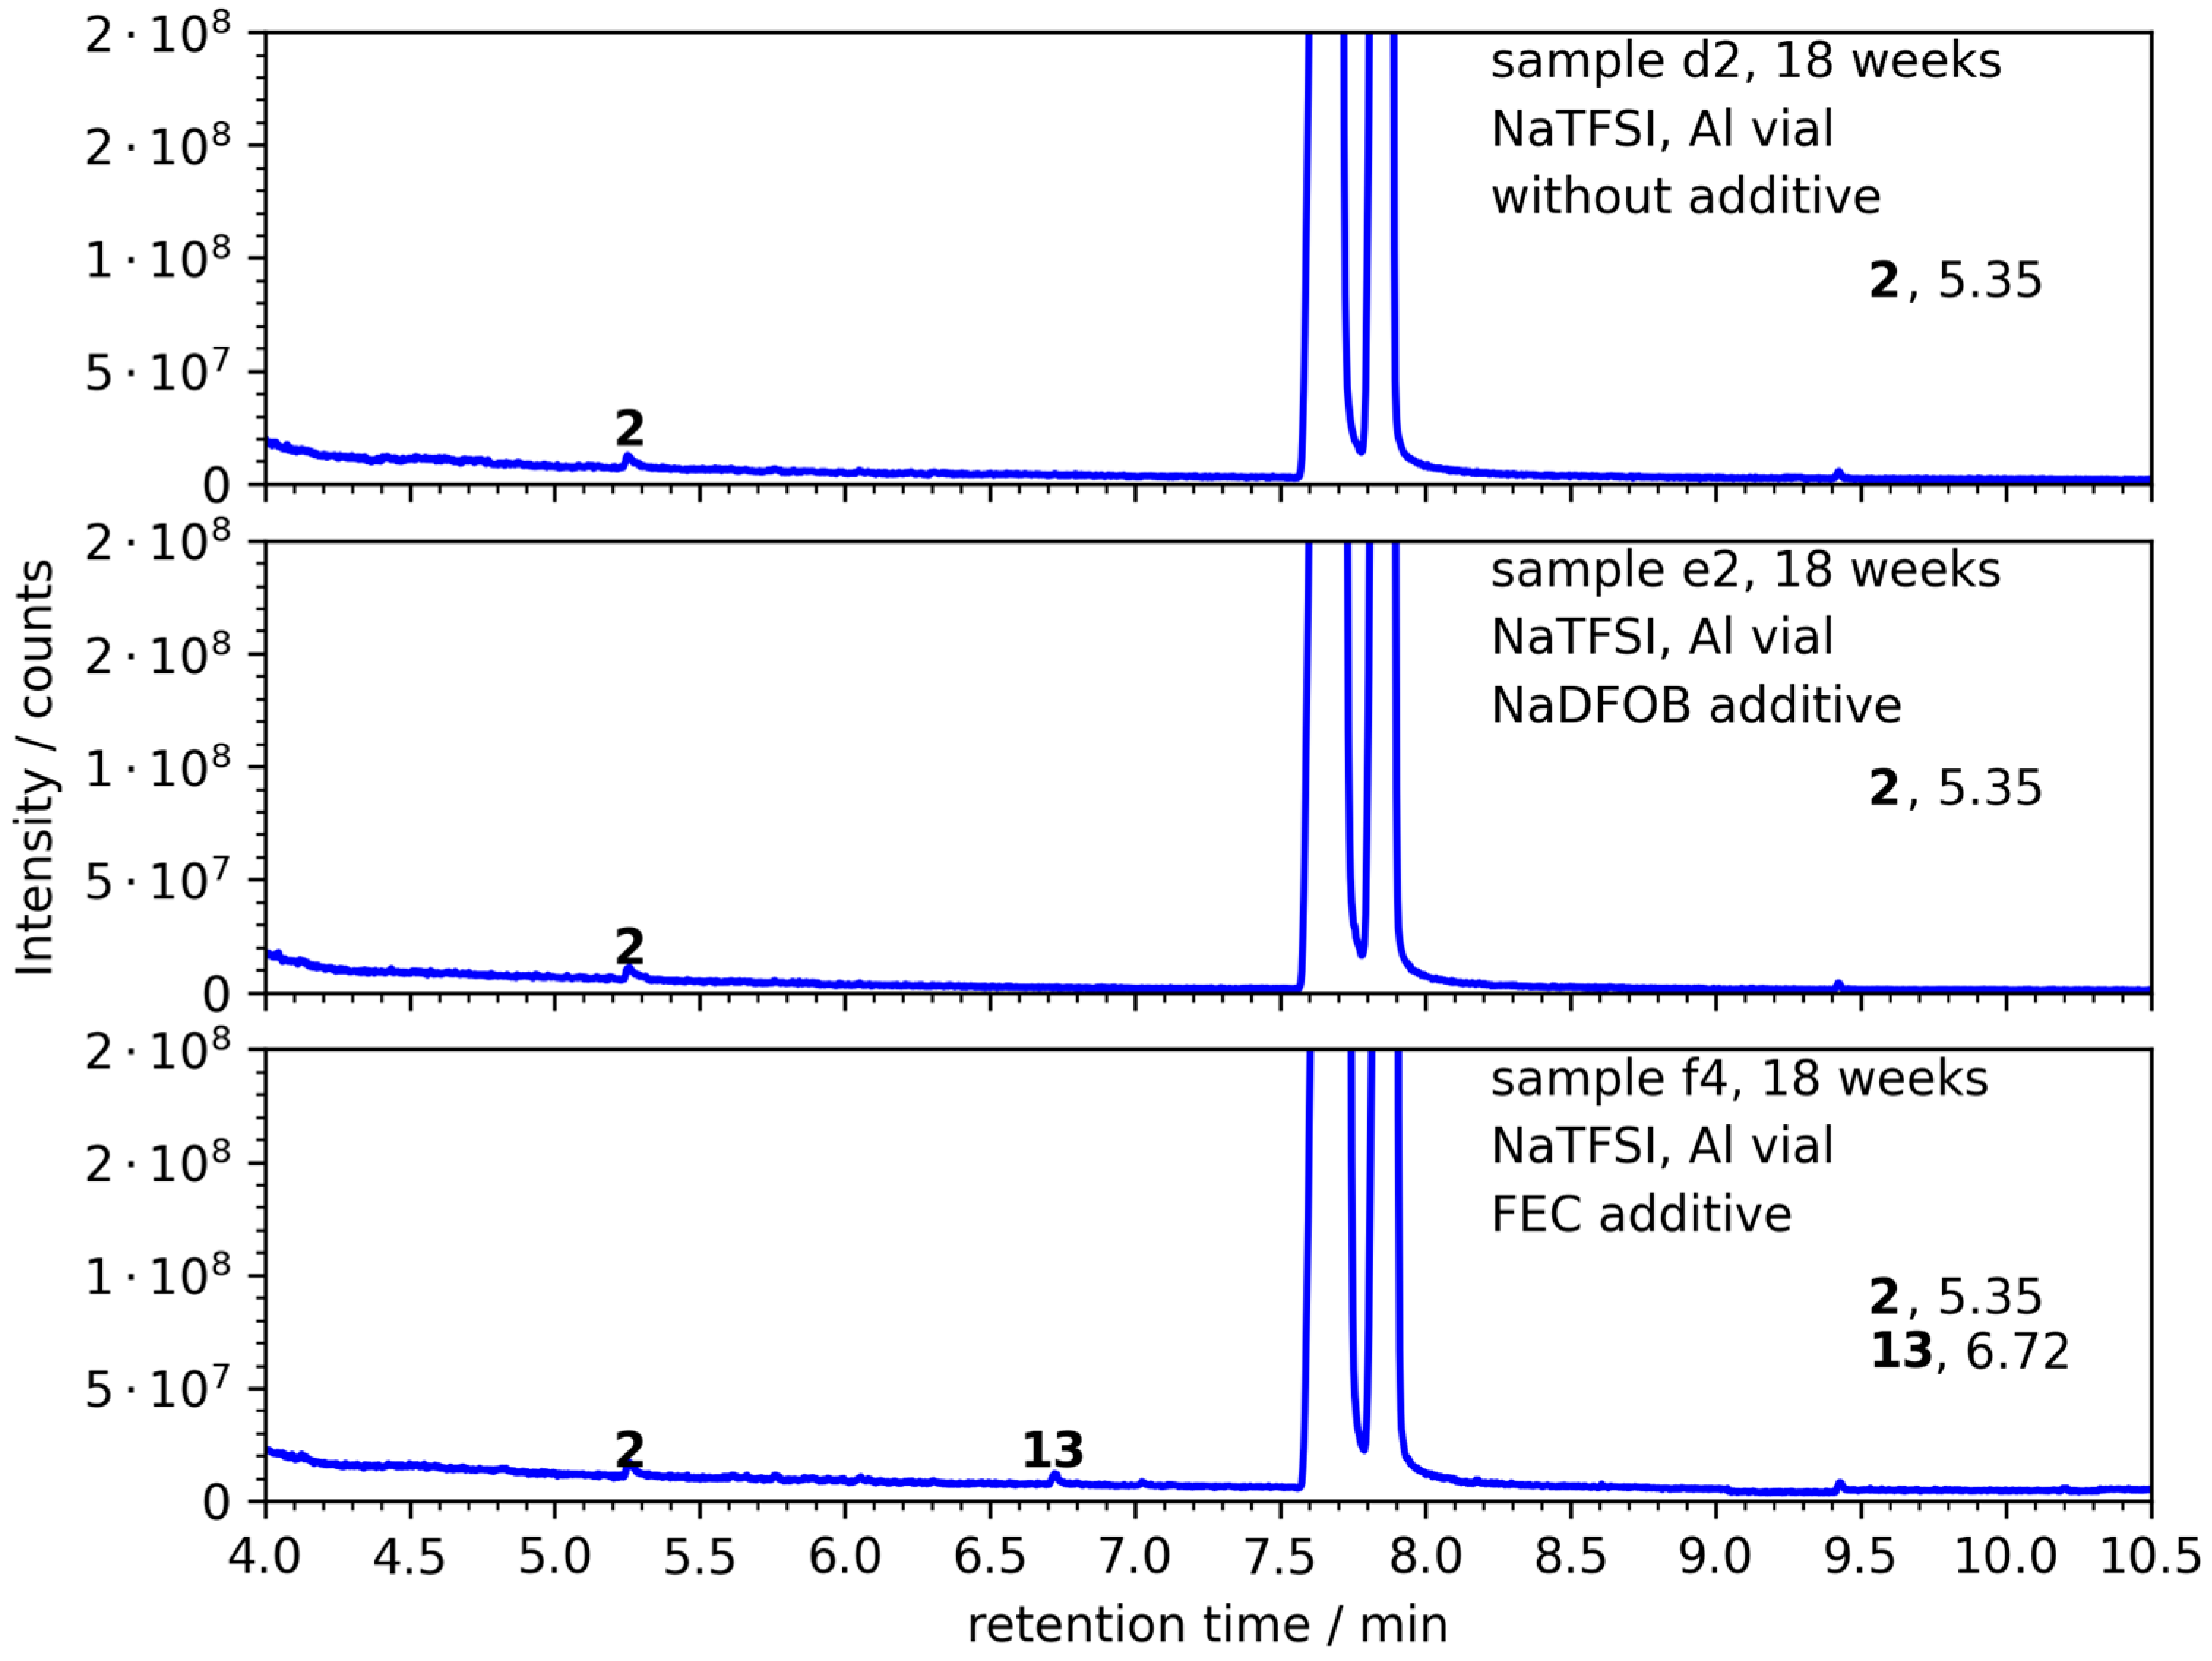
However, a unique observation was made with sample f4 (Figure 13). This sample, stored in an aluminum vial at 65 °C with the FEC additive, exhibited the formation of a new degradation product: 1,3-dioxolane-2-methanol. While the presence of this compound was detected, its intensity was notably low, suggesting that its formation is not a dominant degradation pathway under the given conditions.

3.4. FEC Reactivity and Color Changes

The influence of various conditions—storage temperature, type of vial material, presence or absence of sodium metal, and the conductive salt used—on the reactivity of FEC was carefully examined over a period of 18 weeks using GC-MS analysis.
For the samples containing NaPF6 as the conductive salt, the following trends are as follows (refer to Table 2 and Table 3 for detailed data):
  • In PE vials at 40 °C, FEC disappears after 3 weeks when sodium metal is present (c1) but remains stable over 18 weeks when sodium metal is absent (c2).
  • In aluminum vials at 40 °C, regardless of the presence (c7) or absence (c3) of sodium metal, FEC remains stable over the 18 weeks duration.
  • At 65 °C in PE vials, FEC disappears after 3 weeks when sodium metal is present (c4), and after 6 weeks when sodium metal is absent (c5).
  • In aluminum vials at 65 °C, FEC remains stable over 18 weeks when sodium metal is absent (c6), but it disappears after 12 weeks when sodium metal is present (c8).
For the samples containing NaTFSI as the conductive salt, similar patterns emerge (see also Table 4 for detailed data):
  • In PE vials at 40 °C, FEC disappears after 9 weeks when sodium metal is present (f1) but remains stable over 18 weeks when sodium metal is absent (f5).
  • In aluminum vials at 40 °C, regardless of the presence (f2) or absence (f6) of sodium metal, FEC remains stable over the 18 weeks duration.
  • At 65 °C in PE vials, FEC disappears after 3 weeks when sodium metal is present (f3), and after 12 weeks when sodium metal is absent (f4).
  • In aluminum vials at 65 °C, FEC remains stable over 18 weeks, irrespective of the presence (f8) or absence (f7) of sodium metal.
The color change in electrolytes over time offers additional evidence for FEC reactivity and possible degradation pathways in various conditions. The electrolyte sample c1, stored at 40 °C in a PE vial with NaPF6 as a conductive salt and sodium metal present, turns dark after 6 weeks, coinciding with the disappearance of sodium metal. This suggests a reaction involving FEC, sodium metal, and possibly the conductive salt under these conditions. This process seems to involve the reduction of FEC and possibly the formation of insoluble compounds causing the darkening. According to Dugas et al., CO2 was also found in our study when FEC in EC/PC is stored over Na [34]. Additionally, NaF was identified in our samples. Concludingly, a reductive decomposition of FEC leading to NaF as well as CO2, which also promotes the formation of the corresponding diols from EC and PC, respectively, can be deduced.
In contrast, samples c2, c5, c8, f1, and f4, which change color progressively from pale yellow to brown over weeks, might suggest slow degradation processes that produce colored compounds. The rusting of the sodium metal in samples c8, f1, and f4 could be attributed to the formation of insoluble sodium salts possibly due to reactions with FEC degradation products.
It is interesting to note that samples c3, c7, f2, f5, f6, f7, and f8 showed no color change throughout the 18 weeks. This suggests the stability of FEC in these conditions and aligns with our previous observations about FEC’s reactivity.
For the sample f3, the dark color and precipitation formed after 3 weeks might indicate the rapid degradation of FEC and the formation of insoluble compounds under these specific conditions (65 °C, PE vial, NaTFSI, sodium metal present).

4. Conclusions

This study presents a comprehensive investigation into the stability and degradation behavior of various electrolyte systems intended for use in sodium-based batteries. The electrolytes comprised a 1:1 (v:v) mixture of ethylene carbonate (EC) and propylene carbonate (PC), with sodium salts (either NaPF6 or NaTFSI) and FEC additive.
The findings support the hypothesis that the type of conductive salt, presence of sodium metal, choice of additive, and vial material all exert significant influences on the degradation pathways of the electrolyte. NaDFOB continues to demonstrate superior performance in minimizing the formation of degradation products, underpinning its role as a potential stabilizer in these systems. Moreover, the results strengthen the case for the use of aluminum as a preferred material for vials, as it appears to provide a protective effect even in the presence of sodium metal.
Significant variations were observed in the formation of degradation products based on the choice of the conductive salt. Notably, electrolytes utilizing very pure NaPF6 (99.9%) showed a markedly lower amount of degradation product formation compared to those using NaPF6 in pure quality (99.5%), underlining the influence of raw material quality on electrolyte stability.
Further, the choice of vial material for storage was found to play a crucial role in the degradation behavior, with aluminum vials demonstrating superior performance over PE vials. This observation points towards the potential thermal properties or surface interactions of aluminum impacting the stability of the electrolyte system.
The presence of sodium metal was found to accelerate degradation, particularly at higher temperatures, indicating its participation in degradation reactions. However, the NaDFOB additive exhibited a mitigating effect on this degradation, suggesting its potential utility in enhancing the stability of these electrolytes.
The trend in the reactivity of the FEC additive under various conditions observed in this study provides valuable insights into its role in the electrolyte system and the factors influencing its stability. The following effects can be summarized:
  • Temperature effects: In both sets of samples, FEC appears to degrade faster at higher temperatures. This behavior aligns with the general principle of chemical kinetics that reaction rates typically increase with temperature. This is usually explained by the Arrhenius equation, which states that a higher temperature increases the fraction of molecules possessing energy greater than the activation energy, leading to an increased rate of reaction. In the context of our study, higher temperatures could facilitate degradation reactions involving FEC, thereby causing its faster consumption.
  • Effects of sodium metal presence: The presence of sodium metal seems to accelerate the disappearance of FEC. This suggests that FEC reacts with sodium, possibly through a reductive decomposition mechanism. The resulting products could contribute to the formation of a stable SEI layer, which could help improve the overall stability of the electrolyte system.
  • Effects of vial material: FEC tends to last longer in aluminum vials than in PE vials, indicating that the material of the storage vial can impact the stability of the additive. The reason behind this observation could be the better thermal conductivity of aluminum compared to PE, which could help dissipate heat more efficiently, thereby reducing the rate of degradation reactions.
  • Effects of conductive salt: Although both types of salts studied (NaPF6 and NaTFSI) are sodium salts, differences in the reactivity of FEC were observed between them. This suggests that the anion part of the salt might play a role in the reactions involving FEC. Some reports in the literature suggest that T F S I is less reactive and more thermally stable than P F 6 , which could explain the observed behavior [76,77].

Author Contributions

Conceptualization, M.H. and A.H.; formal analysis, M.H. and A.H.; funding acquisition, A.H.; investigation, M.H.; methodology, M.H.; project administration, A.H.; resources, A.H.; supervision, A.H.; validation, M.H. and A.H.; visualization, M.H. and A.H.; writing—original draft preparation, M.H. and A.H.; writing—review and editing, M.H. and A.H. All authors have read and agreed to the published version of the manuscript.

Funding

This work contributes to the research performed at CELEST (Center for Electrochemical Energy Storage Ulm-Karlsruhe) and was funded by the German Research Foundation (DFG) under Project ID 390874152 (POLiS Cluster of Excellence). We acknowledge support by the KIT-Publication Fund of the Karlsruhe Institute of Technology.

Data Availability Statement

Raw data of the GC measurements are available at https://zenodo.org, accessed on 28 September 2023 (https://doi.org/10.5281/zenodo.8388636).

Conflicts of Interest

The authors declare no conflict of interest.

References

  1. Yabuuchi, N.; Kubota, K.; Dahbi, M.; Komaba, S. Research development on sodium-ion batteries. Chem. Rev. 2014, 114, 11636–11682. [Google Scholar] [CrossRef] [PubMed]
  2. Kim, H.; Hong, J.; Park, K.Y.; Kim, H.; Kim, S.W.; Kang, K. Aqueous rechargeable Li and Na ion batteries. Chem. Rev. 2014, 114, 11788–11827. [Google Scholar] [CrossRef] [PubMed]
  3. Wang, Y.; Song, S.; Xu, C.; Hu, N.; Molenda, J.; Lu, L. Development of solid-state electrolytes for sodium-ion battery—A short review. Nano Mater. Sci. 2019, 1, 91–100. [Google Scholar] [CrossRef]
  4. Slater, M.D.; Kim, D.; Lee, E.; Johnson, C.S. Sodium-Ion Batteries. Adv. Funct. Mater. 2013, 23, 947–958. [Google Scholar] [CrossRef]
  5. Bin, D.; Wang, F.; Tamirat, A.G.; Suo, L.M.; Wang, Y.G.; Wang, C.S.; Xia, Y.Y. Progress in Aqueous Rechargeable Sodium-Ion Batteries. Adv. Energy Mater. 2018, 8, 1703008–1703038. [Google Scholar] [CrossRef]
  6. Gupta, P.; Pushpakanth, S.; Haider, M.A.; Basu, S. Understanding the Design of Cathode Materials for Na-Ion Batteries. ACS Omega 2022, 7, 5605–5614. [Google Scholar] [CrossRef]
  7. Hirsh, H.S.; Li, Y.X.; Tan, D.H.S.; Zhang, M.H.; Zhao, E.Y.; Meng, Y.S. Sodium-Ion Batteries Paving the Way for Grid Energy Storage. Adv. Energy Mater. 2020, 10, 2001274–2001281. [Google Scholar] [CrossRef]
  8. Tian, Z.; Zou, Y.; Liu, G.; Wang, Y.; Yin, J.; Ming, J.; Alshareef, H.N. Electrolyte Solvation Structure Design for Sodium Ion Batteries. Adv. Sci. 2022, 9, e2201207. [Google Scholar] [CrossRef]
  9. Liu, Z.; Lu, Z.; Guo, S.; Yang, Q.H.; Zhou, H. Toward High Performance Anodes for Sodium-Ion Batteries: From Hard Carbons to Anode-Free Systems. ACS Cent. Sci. 2023, 9, 1076–1087. [Google Scholar] [CrossRef]
  10. Rafie, A.; Kim, J.W.; Sarode, K.K.; Kalra, V. A review on the use of carbonate-based electrolytes in Li-S batteries: A comprehensive approach enabling solid-solid direct conversion reaction. Energy Stor. Mater. 2022, 50, 197–224. [Google Scholar] [CrossRef]
  11. Wang, J.; Xu, Z.; Zhang, Q.; Song, X.; Lu, X.; Zhang, Z.; Onyianta, A.J.; Wang, M.; Titirici, M.M.; Eichhorn, S.J. Stable Sodium-Metal Batteries in Carbonate Electrolytes Achieved by Bifunctional, Sustainable Separators with Tailored Alignment. Adv. Mater. 2022, 34, e2206367. [Google Scholar] [CrossRef]
  12. Qin, M.; Zeng, Z.; Cheng, S.; Xie, J. Challenges and strategies of formulating low-temperature electrolytes in lithium-ion batteries. Interdiscip. Mater. 2023, 2, 308–336. [Google Scholar] [CrossRef]
  13. Barnes, P.; Smith, K.; Parrish, R.; Jones, C.; Skinner, P.; Storch, E.; White, Q.; Deng, C.J.; Karsann, D.; Lau, M.L.; et al. A non-aqueous sodium hexafluorophosphate-based electrolyte degradation study: Formation and mitigation of hydrofluoric acid. J. Power Sources 2020, 447, 227363–227370. [Google Scholar] [CrossRef]
  14. Mosallanejad, B.; Malek, S.S.; Ershadi, M.; Daryakenari, A.A.; Cao, Q.; Ajdari, F.B.; Ramakrishna, S. Cycling degradation and safety issues in sodium-ion batteries: Promises of electrolyte additives. J. Electroanal. Chem. 2021, 895, 115505–115522. [Google Scholar] [CrossRef]
  15. Eom, J.Y.; Jung, I.H.; Lee, J.H. Effects of vinylene carbonate on high temperature storage of high voltage Li-ion batteries. J. Power Sources 2011, 196, 9810–9814. [Google Scholar] [CrossRef]
  16. Genieser, R.; Loveridge, M.; Bhagat, R. Practical high temperature (80 °C) storage study of industrially manufactured Li-ion batteries with varying electrolytes. J. Power Sources 2018, 386, 85–95. [Google Scholar] [CrossRef]
  17. Hu, D.; Zhang, Q.; Tian, J.; Chen, L.; Li, N.; Su, Y.; Bao, L.; Lu, Y.; Cao, D.; Yan, K.; et al. High-Temperature Storage Deterioration Mechanism of Cylindrical 21700-Type Batteries Using Ni-Rich Cathodes under Different SOCs. ACS Appl. Mater. Interfaces 2021, 13, 6286–6297. [Google Scholar] [CrossRef] [PubMed]
  18. Kraft, V.; Weber, W.; Grutzke, M.; Winter, M.; Nowak, S. Study of decomposition products by gas chromatography-mass spectrometry and ion chromatography-electrospray ionization-mass spectrometry in thermally decomposed lithium hexafluorophosphate-based lithium ion battery electrolytes. RSC Adv. 2015, 5, 80150–80157. [Google Scholar] [CrossRef]
  19. Gachot, G.; Ribiere, P.; Mathiron, D.; Grugeon, S.; Armand, M.; Leriche, J.B.; Pilard, S.; Laruelle, S. Gas chromatography/mass spectrometry as a suitable tool for the Li-ion battery electrolyte degradation mechanisms study. Anal. Chem. 2011, 83, 478–485. [Google Scholar] [CrossRef]
  20. Horsthemke, F.; Friesen, A.; Monnighoff, X.; Stenzel, Y.P.; Grutzke, M.; Andersson, J.T.; Winter, M.; Nowak, S. Fast screening method to characterize lithium ion battery electrolytes by means of solid phase microextraction-gas chromatography-mass spectrometry. RSC Adv. 2017, 7, 46989–46998. [Google Scholar] [CrossRef]
  21. Peschel, C.; Horsthemke, F.; Leissing, M.; Wiemers-Meyer, S.; Henschel, J.; Winter, M.; Nowak, S. Analysis of Carbonate Decomposition During Solid Electrolyte Interphase Formation in Isotope-Labeled Lithium Ion Battery Electrolytes: Extending the Knowledge about Electrolyte Soluble Species. Batter. Supercaps 2020, 3, 1183–1192. [Google Scholar] [CrossRef]
  22. Campion, C.L.; Li, W.; Lucht, B.L. Thermal Decomposition of LiPF6-Based Electrolytes for Lithium-Ion Batteries. J. Electrochem. Soc. 2005, 152, A2327–A2334. [Google Scholar] [CrossRef]
  23. Gauthier, N.; Courrèges, C.; Demeaux, J.; Tessier, C.; Martinez, H. Impact of the cycling temperature on electrode/electrolyte interfaces within Li4Ti5O12 vs LiMn2O4 cells. J. Power Sources 2020, 448, 227573–227583. [Google Scholar] [CrossRef]
  24. Ravdel, B.; Abraham, K.M.; Gitzendanner, R.; DiCarlo, J.; Lucht, B.; Campion, C. Thermal stability of lithium-ion battery electrolytes. J. Power Sources 2003, 119–121, 805–810. [Google Scholar] [CrossRef]
  25. Lee, H.H.; Wan, C.C.; Wang, Y.Y. Thermal Stability of the Solid Electrolyte Interface on Carbon Electrodes of Lithium Batteries. J. Electrochem. Soc. 2004, 151, A542–A547. [Google Scholar] [CrossRef]
  26. Wang, Q.; Jiang, B.; Li, B.; Yan, Y. A critical review of thermal management models and solutions of lithium-ion batteries for the development of pure electric vehicles. Renew. Sust. Energ. Rev. 2016, 64, 106–128. [Google Scholar] [CrossRef]
  27. Bandhauer, T.M.; Garimella, S.; Fuller, T.F. A Critical Review of Thermal Issues in Lithium-Ion Batteries. J. Electrochem. Soc. 2011, 158, R1–R25. [Google Scholar] [CrossRef]
  28. Ma, S.; Jiang, M.; Tao, P.; Song, C.; Wu, J.; Wang, J.; Deng, T.; Shang, W. Temperature effect and thermal impact in lithium-ion batteries: A review. Prog. Nat. Sci. 2018, 28, 653–666. [Google Scholar] [CrossRef]
  29. Hofmann, A.; Uhlmann, N.; Ziebert, C.; Wiegand, O.; Schmidt, A.; Hanemann, T. Preventing Li-ion cell explosion during thermal runaway with reduced pressure. Appl. Therm. Eng. 2017, 124, 539–544. [Google Scholar] [CrossRef]
  30. Chen, J.; Huang, Z.; Wang, C.; Porter, S.; Wang, B.; Lie, W.; Liu, H.K. Sodium-difluoro(oxalato)borate (NaDFOB): A new electrolyte salt for Na-ion batteries. Chem. Commun. 2015, 51, 9809–9812. [Google Scholar] [CrossRef]
  31. Purushotham, U.; Takenaka, N.; Nagaoka, M. Additive effect of fluoroethylene and difluoroethylene carbonates for the solid electrolyte interphase film formation in sodium-ion batteries: A quantum chemical study. RSC Adv. 2016, 6, 65232–65242. [Google Scholar] [CrossRef]
  32. Zheng, X.; Huang, L.; Ye, X.; Zhang, J.; Min, F.; Luo, W.; Huang, Y. Critical effects of electrolyte recipes for Li and Na metal batteries. Chem 2021, 7, 2312–2346. [Google Scholar] [CrossRef]
  33. Dahbi, M.; Nakano, T.; Yabuuchi, N.; Fujimura, S.; Chihara, K.; Kubota, K.; Son, J.-Y.; Cui, Y.-T.; Oji, H.; Komaba, S. Effect of Hexafluorophosphate and Fluoroethylene Carbonate on Electrochemical Performance and the Surface Layer of Hard Carbon for Sodium-Ion Batteries. ChemElectroChem 2016, 3, 1856–1867. [Google Scholar] [CrossRef]
  34. Dugas, R.; Ponrouch, A.; Gachot, G.; David, R.; Palacin, M.R.; Tarascon, J.M. Na Reactivity toward Carbonate-Based Electrolytes: The Effect of FEC as Additive. J. Electrochem. Soc. 2016, 163, A2333–A2339. [Google Scholar] [CrossRef]
  35. Cheng, Z.; Mao, Y.; Dong, Q.; Jin, F.; Shen, Y.; Chen, L. Fluoroethylene Carbonate as an Additive for Sodium-Ion Batteries: Effect on the Sodium Cathode. Acta Phys. Chim. Sin. 2019, 35, 868–875. [Google Scholar] [CrossRef]
  36. Lu, H.; Wu, L.; Xiao, L.; Ai, X.; Yang, H.; Cao, Y. Investigation of the Effect of Fluoroethylene Carbonate Additive on Electrochemical Performance of Sb-Based Anode for Sodium-Ion Batteries. Electrochim. Acta 2016, 190, 402–408. [Google Scholar] [CrossRef]
  37. Eshetu, G.G.; Martinez-Ibañez, M.; Sánchez-Diez, E.; Gracia, I.; Li, C.; Rodriguez-Martinez, L.M.; Rojo, T.; Zhang, H.; Armand, M. Electrolyte Additives for Room-Temperature, Sodium-Based, Rechargeable Batteries. Chem. Asian J. 2018, 13, 2770–2780. [Google Scholar] [CrossRef]
  38. Bouibes, A.; Takenaka, N.; Kubota, K.; Komaba, S.; Nagaoka, M. Development of advanced electrolytes in Na-ion batteries: Application of the Red Moon method for molecular structure design of the SEI layer. RSC Adv. 2021, 12, 971–984. [Google Scholar] [CrossRef]
  39. Hou, X.; Li, T.; Qiu, Y.; Jiang, M.; Zheng, Q.; Li, X. Weak coulomb interaction between anions and Na+ during solvation enabling desirable solid electrolyte interphase and superior kinetics for HC-based sodium ion batteries. Chem. Eng. J. 2023, 453, 139932. [Google Scholar] [CrossRef]
  40. Shin, H.; Park, J.; Sastry, A.M.; Lu, W. Effects of Fluoroethylene Carbonate (FEC) on Anode and Cathode Interfaces at Elevated Temperatures. J. Electrochem. Soc. 2015, 162, A1683–A1692. [Google Scholar] [CrossRef]
  41. Eshetu, G.G.; Elia, G.A.; Armand, M.; Forsyth, M.; Komaba, S.; Rojo, T.; Passerini, S. Electrolytes and Interphases in Sodium-Based Rechargeable Batteries: Recent Advances and Perspectives. Adv. Energy Mater. 2020, 10, 2000093–2000133. [Google Scholar] [CrossRef]
  42. Gao, L.; Chen, J.; Liu, Y.; Yamauchi, Y.; Huang, Z.; Kong, X. Revealing the chemistry of an anode-passivating electrolyte salt for high rate and stable sodium metal batteries. J. Mater. Chem. A 2018, 6, 12012–12017. [Google Scholar] [CrossRef]
  43. Gao, L.; Chen, J.; Chen, Q.; Kong, X. The chemical evolution of solid electrolyte interface in sodium metal batteries. Sci. Adv. 2022, 8, eabm4606. [Google Scholar] [CrossRef] [PubMed]
  44. Xie, M.; Wu, F.; Huang, Y. Sodium-Ion Batteries: Advanced Technology and Applications; De Gruyter: Berlin, Germany, 2022. [Google Scholar]
  45. Chen, X.; Shen, X.; Hou, T.-Z.; Zhang, R.; Peng, H.-J.; Zhang, Q. Ion-Solvent Chemistry-Inspired Cation-Additive Strategy to Stabilize Electrolytes for Sodium-Metal Batteries. Chem 2020, 6, 2242–2256. [Google Scholar] [CrossRef]
  46. Sun, Z.; Fu, W.; Liu, M.Z.; Lu, P.; Zhao, E.; Magasinski, A.; Liu, M.; Luo, S.; McDaniel, J.; Yushin, G. A nanoconfined iron(iii) fluoride cathode in a NaDFOB electrolyte: Towards high-performance sodium-ion batteries. J. Mater. Chem. A 2020, 8, 4091–4098. [Google Scholar] [CrossRef]
  47. Law, H.M.; Yu, J.; Kwok, S.C.T.; Zhou, G.; Robson, M.J.; Wu, J.; Ciucci, F. A hybrid dual-salt polymer electrolyte for sodium metal batteries with stable room temperature cycling performance. Energy Stor. Mater. 2022, 46, 182–191. [Google Scholar] [CrossRef]
  48. Metzger, M.; Strehle, B.; Solchenbach, S.; Gasteiger, H.A. Hydrolysis of Ethylene Carbonate with Water and Hydroxide under Battery Operating Conditions. J. Electrochem. Soc. 2016, 163, A1219–A1225. [Google Scholar] [CrossRef]
  49. Caracciolo, L.; Madec, L.; Gachot, G.; Martinez, H. Impact of the Salt Anion on K Metal Reactivity in EC/DEC Studied Using GC and XPS Analysis. ACS Appl. Mater. Interfaces 2021, 13, 57505–57513. [Google Scholar] [CrossRef]
  50. Laruelle, S.; Pilard, S.; Guenot, P.; Grugeon, S.; Tarascon, J.M. Identification of Li-based electrolyte degradation products through DEI and ESI high-resolution mass spectrometry. J. Electrochem. Soc. 2004, 151, A1202–A1209. [Google Scholar] [CrossRef]
  51. Grützke, M.; Weber, W.; Winter, M.; Nowak, S. Structure determination of organic aging products in lithium-ion battery electrolytes with gas chromatography chemical ionization mass spectrometry (GC-CI-MS). RSC Adv. 2016, 6, 57253–57260. [Google Scholar] [CrossRef]
  52. Stenzel, Y.P.; Horsthemke, F.; Winter, M.; Nowak, S. Chromatographic Techniques in the Research Area of Lithium Ion Batteries: Current State-of-the-Art. Separations 2019, 6, 26. [Google Scholar] [CrossRef]
  53. Fang, C.; Tran, T.N.; Zhao, Y.Z.; Liu, G. Electrolyte decomposition and solid electrolyte interphase revealed by mass spectrometry. Electrochim Acta 2021, 399, 139362–139371. [Google Scholar] [CrossRef]
  54. Mogensen, R.; Brandell, D.; Younesi, R. Solubility of the Solid Electrolyte Interphase (SEI) in Sodium Ion Batteries. ACS Energy Lett. 2016, 1, 1173–1178. [Google Scholar] [CrossRef]
  55. Ma, L.A.; Naylor, A.J.; Nyholm, L.; Younesi, R. Strategies for Mitigating Dissolution of Solid Electrolyte Interphases in Sodium-Ion Batteries. Angew. Chem. Int. Ed. 2021, 60, 4855–4863. [Google Scholar] [CrossRef]
  56. Single, F.; Horstmann, B.; Latz, A. Dynamics and morphology of solid electrolyte interphase (SEI). Phys. Chem. Chem. Phys. 2016, 18, 17810–17814. [Google Scholar] [CrossRef] [PubMed]
  57. Nayak, P.K.; Yang, L.; Brehm, W.; Adelhelm, P. From Lithium-Ion to Sodium-Ion Batteries: Advantages, Challenges, and Surprises. Angew. Chem. Int. Ed. 2018, 57, 102–120. [Google Scholar] [CrossRef]
  58. Xu, G.-L.; Amine, R.; Abouimrane, A.; Che, H.; Dahbi, M.; Ma, Z.-F.; Saadoune, I.; Alami, J.; Mattis, W.L.; Pan, F.; et al. Challenges in Developing Electrodes, Electrolytes, and Diagnostics Tools to Understand and Advance Sodium-Ion Batteries. Adv. Energy Mater. 2018, 8, 1702403–1702465. [Google Scholar] [CrossRef]
  59. Zhang, S.S. A review on electrolyte additives for lithium-ion batteries. J. Power Sources 2006, 162, 1379–1394. [Google Scholar] [CrossRef]
  60. Chang, Z.; Qiao, Y.; Deng, H.; Yang, H.; He, P.; Zhou, H. A stable high-voltage lithium-ion battery realized by an in-built water scavenger. Energy Environ. Sci. 2020, 13, 1197–1204. [Google Scholar] [CrossRef]
  61. Cho, I.H.; Kim, S.-S.; Shin, S.C.; Choi, N.-S. Effect of SEI on Capacity Losses of Spinel Lithium Manganese Oxide/Graphite Batteries Stored at 60 °C. Electrochem. Solid-State Lett. 2010, 13, A168–A172. [Google Scholar] [CrossRef]
  62. Sinha, N.N.; Burns, J.C.; Dahn, J.R. Storage Studies on Li/Graphite Cells and the Impact of So-Called SEI-Forming Electrolyte Additives. J. Electrochem. Soc. 2013, 160, A709–A714. [Google Scholar] [CrossRef]
  63. Müller, C.; Wang, Z.; Hofmann, A.; Stüble, P.; Liu-Théato, X.; Klemens, J.; Smith, A. Influences on Reliable Capacity Measurements of Hard Carbon in Highly Loaded Electrodes. Batter. Supercaps 2023, e202300322. [Google Scholar] [CrossRef]
  64. Hofmann, A.; Müller, F.; Schöner, S.; Jeschull, F. Revealing the Formation of Dialkyl Dioxahexane Dioate Products from Ethylene Carbonate based Electrolytes on Lithium and Potassium Surfaces. Batter. Supercaps 2023, e202300325. [Google Scholar] [CrossRef]
  65. Mrozik, W.; Rajaeifar, M.A.; Heidrich, O.; Christensen, P. Environmental impacts, pollution sources and pathways of spent lithium-ion batteries. Energy Environ. Sci. 2021, 14, 6099–6121. [Google Scholar] [CrossRef]
  66. Zhao, Y.; Kang, Y.; Wozny, J.; Lu, J.; Du, H.; Li, C.; Li, T.; Kang, F.; Tavajohi, N.; Li, B. Recycling of sodium-ion batteries. Nat. Rev. Mater. 2023, 8, 623–634. [Google Scholar] [CrossRef]
  67. Pfeiffer, L.F.; Li, Y.; Mundszinger, M.; Geisler, J.; Pfeifer, C.; Mikhailova, D.; Omar, A.; Baran, V.; Biskupek, J.; Kaiser, U.; et al. Origin of Aging of a P2-NaxMn3/4Ni1/4O2 Cathode Active Material for Sodium-Ion Batteries. Chem. Mater. 2023, 35, 8065–8080. [Google Scholar] [CrossRef]
  68. Zhang, W.; Zhang, Y.; Zhou, J.; Li, X.; Zhou, W.; Zhang, D.; Mao, J.; Dai, K. Optimizing Electrochemical Performance in Sodium-Ion Batteries using O3-type Na0.90Cu0.22Fe0.30Mn0.48O2 and Hard Carbon. J. Electrochem. Soc. 2023, 170, 70518–70533. [Google Scholar] [CrossRef]
  69. Xia, X.; Lamanna, W.M.; Dahn, J.R. The Reactivity of Charged Electrode Materials with Sodium Bis(trifluoromethanesulfonyl)imide (NaTFSI) Based-Electrolyte at Elevated Temperatures. J. Electrochem. Soc. 2013, 160, A607–A609. [Google Scholar] [CrossRef]
  70. Ding, M.S.; Xu, K.; Jow, T.R. Liquid-Solid Phase Diagrams of Binary Carbonates for Lithium Batteries. J. Electrochem. Soc. 2000, 147, 1688–1694. [Google Scholar] [CrossRef]
  71. Nanbu, N.; Suzuki, K.; Yagi, N.; Sugahara, M.; Takehara, M.; Ue, M.; Sasaki, Y. Use of Fluoroethylene Carbonate as Solvent for Electric Double-Layer Capacitors. Electrochemistry 2007, 75, 607–610. [Google Scholar] [CrossRef]
  72. Xu, K. Electrolytes, Interfaces and Interphases: Fundamentals and Applications in Batteries; Royal Society of Chemistry: London, UK, 2023. [Google Scholar]
  73. Ponrouch, A.; Marchante, E.; Courty, M.; Tarascon, J.-M.; Palacín, M.R. In search of an optimized electrolyte for Na-ion batteries. Energy Environ. Sci. 2012, 5, 8572–8583. [Google Scholar] [CrossRef]
  74. Hofmann, A.; Wang, Z.; Bautista, S.P.; Weil, M.; Müller, F.; Löwe, R.; Schneider, L.; Mohsin, I.U.; Hanemann, T. Comprehensive characterization of propylene carbonate based liquid electrolyte mixtures for sodium-ion cells. Electrochim. Acta 2022, 403, 139670–139687. [Google Scholar] [CrossRef]
  75. Zhang, D.; Zhu, Q.; Wang, Y.; Zhao, C.L.; Liu, S.B.; Xu, S.D. Electrochemical Performance of Sodium Difluoro(oxalato)borate as the Additive of Non-Aqueous Electrolytes for Sodium-Ion Batteries. J. Electrochem. 2017, 23, 473–479. [Google Scholar]
  76. Eshetu, G.G.; Grugeon, S.; Kim, H.; Jeong, S.; Wu, L.; Gachot, G.; Laruelle, S.; Armand, M.; Passerini, S. Comprehensive Insights into the Reactivity of Electrolytes Based on Sodium Ions. ChemSusChem 2016, 9, 462–471. [Google Scholar] [CrossRef]
  77. Sun, Y.; Shi, P.; Xiang, H.; Liang, X.; Yu, Y. High-Safety Nonaqueous Electrolytes and Interphases for Sodium-Ion Batteries. Small 2019, 15, 1805479–1805494. [Google Scholar] [CrossRef]
Scheme 1. Experimental design overview.
Batteries 09 00530 sch001
Figure 1. Chromatographic separation of degradation products (EC/PC + 1 M NaPF6; a5: plastic vial, a6: aluminum vial; T = 65 °C; without sodium): 1,2-ethanediol (ED, 1), 1,2-propanediol (PD, 2), 2-ethyl-1,3-dioxolane (3), 2-ethyl-4-methyl-1,3-dioxolane (4 and 4′), ethylene carbonate (EC, 5), propylene carbonate (PC, 6), 2-methyl-2-butanol (7). Due to the higher concentration of sample a6, the EC and PC peak exhibit higher signal intensity.
Batteries 09 00530 g001
Figure 2. Chemical structures of compounds discussed in the manuscript.
Batteries 09 00530 g002
Figure 3. Chromatographic separation of degradation products (EC/PC + 1 M NaPF6 + Na metal; a1: plastic vial, T = 40 °C, a4: plastic vial; T = 65 °C): 1,2-ethanediol (ED, 1), 1,2-propanediol (PD, 2), 2-ethyl-1,3-dioxolane (3), 2-ethyl-4-methyl-1,3-dioxolane (4 and 4′), ethylene carbonate (EC, 5), propylene carbonate (PC, 6), 1,4-dioxane (8). Due to the higher concentration of sample a1, the EC and PC peak exhibit higher signal intensity.
Batteries 09 00530 g003
Figure 4. Chromatographic separation of degradation products (EC/PC + 1 M NaPF6 + NaDFOB; b5: plastic vial, b6: aluminum vial; T = 65 °C): 1,2-ethanediol (ED, 1), 1,2-propanediol (PD, 2), 2-ethyl-1,3-dioxolane (3), 2-ethyl-4-methyl-1,3-dioxolane (4 and 4′), ethylene carbonate (EC, 5), propylene carbonate (PC, 6), 2-methyl-2-butanol (7) and ethandiol monoformate (9).
Batteries 09 00530 g004
Figure 5. Chromatographic separation of degradation products (EC/PC + 1 M NaPF6 + FEC; c5: plastic vial, c6: aluminum vial; T = 65 °C): 1,2-ethanediol (ED, 1), 1,2-propanediol (PD, 2), 2-ethyl-1,3-dioxolane (3), 2-ethyl-4-methyl-1,3-dioxolane (4 and 4′), ethylene carbonate (EC, 5), propylene carbonate (PC, 6), 2-methyl-2-butanol (7) and FEC (10).
Batteries 09 00530 g005
Figure 6. Time-dependent formation of ED (1) and PD (2) at T = 40 °C (a,b) and T = 65 °C (c,d). All samples were consistently stored in PE vials and contain sodium metal. Please note that the scale in (d) is ten times higher than in (c) for a better visualization.
Batteries 09 00530 g006
Figure 7. Comparison of electrolytes with and without sodium metal after 9 weeks and 18 weeks of storage. (a,b): 1,2-ethanediol, (c,d): 1,2-propanediol. Sample “a” denote electrolytes without additives, “b” denotes NaDFOB as additive, and “c” denotes FEC as additive.
Batteries 09 00530 g007
Figure 8. Comparison of temperature dependence and thermal stability of PD formation in PE and aluminum vials for sodium metal immersed electrolytes after 18 weeks of storage. The smaller measurement interval in the case of Al vials is based on the fact that it should be checked whether no PD/PC increase can actually be observed.
Batteries 09 00530 g008
Figure 9. Chromatographic separation of degradation products from electrolyte EC/PC + 1 M NaPF6 at T = 65 °C.
Batteries 09 00530 g009
Figure 10. Chromatographic separation of degradation products from electrolyte EC/PC + 1 M NaPF6 at T = 65 °C with selected additives in Al vials stored over sodium metal.
Batteries 09 00530 g010
Figure 11. Time-Dependent Formation of ED (a) and PD (b) at 65 °C with additive-free electrolyte (d1), with NaDFOB additive (e1) and with FEC in the electrolyte (f3). All samples contain sodium metal and are stored in PE vials.
Batteries 09 00530 g011
Figure 12. Comparative Analysis of ED (a) and PD (b) Formation in Electrolytes f1 and f3 over 18 Weeks at Different Temperatures.
Batteries 09 00530 g012
Figure 13. Chromatographic separation of degradation products from electrolyte EC/PC + 1 M NaTFSI at T = 65 °C with selected additives in Al vials stored over sodium metal.
Batteries 09 00530 g013
Table 1. Chemical and physico-electrochemical properties of the carbonates used in this study. Mw is the molar weight, ρ the density, ε the dielectric constant at 1 kHz, Tb the boiling point and η the viscosity.
SolventMw
[g·mol−1]
ρ at 25 °C [g·cm−3]Tb [°C]ε at 40 °Cη at 40 °C [mPa·s] Refs.
EC88.061.321 a24889.781.93[70]
PC102.091.205 b24266.14 b2.53 c[70]
FEC106.051.45421278.44.10[71,72]
a at 39 °C. b at 20 °C. c at 25 °C.
Table 2. Chemical and physico-electrochemical properties of the salts used in this study. Mw is the molar weight, Tm is the melting point and σ is the conductivity.
SaltStructure
of Anion
Mw
[g·mol−1]
Tm [°C]σ in 1 M PC
Solution [mS·cm−1]
Anodic Stability/V vs. Na+/Na0Refs.
NaPF6Batteries 09 00530 i001167.95dec. 3007.985 a[41,73]
NaTFSIBatteries 09 00530 i002303.132576.203.4/5 a,b[41,73]
NaDFOBBatteries 09 00530 i003159.82-4.275.51 c[30,41]
a Sodium metal cube slice as counter and reference electrodes, and an aluminum plunger as the working electrode. b limited to 3.4 V by Al dissolution, but up to 5 V with 5% NaPF6. c stainless steel as the working electrode and Na as the counter and reference electrodes.
Table 3. Summary of electrolyte compositions and conditions (NaPF6 from Alfa Aesar).
SolventEC/PC
SaltNaPF6; 99.5%
Additive-NaDFOBFEC
T [°C]406540654065
VialPEPEAlPEPEAlPEPEAlPEPEAlPEPEAlPEPEAl
Na+--+--+--+--+--+--
name/codea1a2a3a4a5a6b1b2b3b4b5b6c1c2c3c4c5c6
Table 4. Summary of electrolyte compositions and conditions (NaPF6 from ChemFish Tokyo Co., Ltd.).
SolventEC/PC
SaltNaPF6; 99.9%
Additive-NaDFOBFEC
T [°C]254050586540654065
VialPEAlAlPEAlPEAlAlAlAlAlAl
Na++++++++++++
name/codea7a8a9a10a11a12a13a14b7b8c7c8
Table 5. Summary of electrolyte compositions and conditions (NaTFSI from TCI Europe).
SolventEC/PC
SaltNaTFSI
Additive-NaDFOBFEC
T [°C]65654065
VialPEAlPEAlPEAlPEAlPEAlPEAl
Na++++++--++--
name/coded1d2e1e2f1f2f5f6f3f4f7f8
Table 6. Overview of electrolyte components and degradation products.
CompoundCASRet. Time a [min]RI bRI c
NIST
Mass Frag.
m/z
Confirmed d
11,2-ethanediol107-21-14.90692702 ± 1043, 33, 42, 62, 61yes
21,2-propanediol57-55-65.35739740 ± 1845, 43, 61, 75, 76yes
32-ethyl-1,3-dioxolane2568-96-95.54753780 ± 773, 45, 57, 72, 101yes
42-ethyl-4-methyl-1,3-dioxolane4359-46-05.86, 5.95790, 799NA87, 59, 41, 57, 72, 115yes
5EC96-49-17.70978NA43, 88, 44, 58, 42yes
6PC108-32-77.911000NA57, 43, 87, 58, 42yes
7amylene hydrate75-85-44.37637615 ± 1659, 73, 55, 43, 41yes
81,4-dioxane123-91-95.08710675 ± 1988, 58, 57, 87, 89yes
9ethanediol monoformate628-35-35.63764NA60, 44, 43, 45, 61yes
10FEC1144335-02-86.55859NA62, 44, 58, 106, 73yes
11diethylene glycol111-46-67.6597898045, 75, 76, 43, 44yes
12triethylene glycol112-27-69.771256125545, 89, 58, 75, 43yes
131,3-dioxolane-2-methanol5694-68-86.7288388173, 45, 43, 44, 74yes
a retention time at peak maximum; b RI values are provided based on n-alkanes; RI values are determined at peak onset; c experimental, semi-standard non-polar and estimated non-polar retention index (n-alkane scale) were used; d confirmed by the retention time of the pure compound.
Table 7. Identification and formation of degradation products in electrolytes without additives. Values in brackets account for very low signal intensities (e.g., seen by mass extraction only).
SampleWeeks
36918
a1---(1), (2)1, 21, 2, (8)
a2------73, 4/4′, 7
a3------(7)7
a41, 21, 2, (3), (4/4′)1, 2, (3), (4/4′)1, 2, 3, 4/4′, (8)
a53, 4/4′1, 2, 3, 4/4′1, 2, 3, 4/4′1, 2, 3, 4/4′, (8)
a6---(4/4′), (7)(3), (4/4′), 73, 4/4′, 7
Table 8. Identification and formation timeline of degradation products in electrolytes including additives. Values in brackets account for very low signal intensities (e.g., seen by mass extraction only).
SampleWeeks
36918
b1------(1), (2)1, 2
b2(7)(7)7, (9)1, 2, 3, 4/4′, 7, 9
b3---(7)(7)7
b4---(1), 2, (3), (4/4′), 91, 2, 3, 4/4′, 91, 2, 3, 4/4′, 9
b5(3)1, 2, 3, 4/4′, 91, 2, 3, 4/4′, 91, 2, 3, 4/4′, 9
b6------77
c1---(1), (2)1, 21, 2
c210107, 103, 4/4′, 7, 10
c31010(7), 107, 10
c41, 21, 21, 2, 3, 4/4′1, 2, 3, 4/4′
c5101, 2, 3, 4/4′, (10)1, 2, 3, 4/4′1, 2, 3, 4/4′
c610107, 103, (4/4′), 7, 10
Disclaimer/Publisher’s Note: The statements, opinions and data contained in all publications are solely those of the individual author(s) and contributor(s) and not of MDPI and/or the editor(s). MDPI and/or the editor(s) disclaim responsibility for any injury to people or property resulting from any ideas, methods, instructions or products referred to in the content.