Article

Influence of the Crusher Settings and a Thermal Pre-Treatment on the Properties of the Fine Fraction (Black Mass) from Mechanical Lithium-Ion Battery Recycling

by
Christian Wilke
1,*,
Denis Manuel Werner
1,2,
Alexandra Kaas
1 and
Urs Alexander Peuker
1,*
1
Institute of Mechanical Process Engineering and Mineral Processing, TU Bergakademie Freiberg, 09599 Freiberg, Germany
2
LIBREC AG, 4562 Biberist, Switzerland
*
Authors to whom correspondence should be addressed.
Batteries 2023, 9(10), 514; https://doi.org/10.3390/batteries9100514
Submission received: 13 September 2023 / Revised: 13 October 2023 / Accepted: 17 October 2023 / Published: 19 October 2023
(This article belongs to the Section Battery Processing, Manufacturing and Recycling)

Abstract

:
With the increasing number of electric vehicles (EVs) rises the need to recycle their used lithium-ion batteries (LIBs). During the mechanical process of the recycling of the LIB cells, a fine fraction, the so-called black mass, is created. This black mass consists mostly of the coatings originating from the cells’ electrodes and residues from the electrolyte, together with a low amount of Al and Cu from the crushed current collector foils. The amount of black mass as well as its composition is influenced by the chosen grid size at the crusher discharge. To reduce solvent emissions during the recycling process, a thermal pre-treatment can be added before crushing, which also influences the black mass and its properties due to changes in the adhesion between electrode foils and coating. This study investigates the influence of the crusher settings as well as the pre-treatment temperatures to find an optimum between the recovery of the coating and conductive salt, while limiting the amount of Al and Cu in the black mass.

Graphical Abstract

1. Introduction

Lithium-ion batteries (LIBs) have become more important with the ongoing change from internal combustion engine vehicles (ICEVs) to electric vehicles (EVs). In 2019, the global demand for LIB cells for electromobility was 126 GWh and the VDMA estimates that it could reach 1 TWh in 2025 [1]. With the rising demand for LIBs, the demand for the raw materials for cell production increases as well as the number of used batteries that can be recycled to recover their valuable content. Neef et al. [2] expect, for Europe, the amount of LIBs and their components for recycling to increase to 230,000 t by 2030 and 1,500,000 t by 2040. The European legislation is currently discussing new recycling rates. The current proposal demands recycling efficiencies of 70% for a whole battery by 2030 and material recovery rates of 80% for Li and 95% for Co, Cu and Ni in 2031 [3].
A LIB cell is a complex composite of different metals, metal compounds, graphite, binders, plastics and a liquid electrolyte. It consists of two electrodes that are separated by a porous polymeric membrane, the separator foil. The two electrodes are the negative (anode) and the positive electrodes (cathode). The negative electrode is made of a copper foil serving as the current collector coated with graphite, whereas the positive electrode is made of an aluminium current collector foil coated with a metal oxide, e.g., LiCoO2 (LCO), LiNi0.8Co0.15Al0.05O2 (NCA), LiNi1/3Mn1/3Co1/3O2 (NMC) or metal phosphate, e.g., LiFePO4 (LFP) [4]. Both coatings contain additives, like carbon black, to improve the conductivity and a binder to fix the active material on the current collector foil. For the negative electrode, either polyvinylidene fluoride (PVDF) or a mixture of carboxymethyl cellulose (CMC) and styrene–butadiene rubber (SBR) and for the positive electrode PVDF is used as the binder [5]. The layers of electrode and separator are either stacked or wound up to round or flat jelly rolls and contained in a casing made of steel or aluminium [6]. The space in between the jelly roll is filled with a liquid electrolyte consisting of a mixture of organic solvents, like dimethyl carbonate (DMC) or ethylene carbonate (EC), and a conductive salt most likely lithium hexafluorophosphate (LiPF6) [5].
To recover the valuable materials from this complex composite, one way of recycling is mechanical processing in combination with a hydrometallurgical treatment. In this case, the battery cells are first overdischarged below the cut-off voltage to enable the safe handling of the cells [7]. Afterwards, they are crushed to open up the cell casings and to liberate the electrode coating from the current collector foils [8]. In a subsequent drying step, the solvents from the electrolyte are evaporated [9], before the material is commonly screened to recover a fine fraction, the so-called black mass [10]. The coarse fraction is further treated, e.g., by two-step air classification, to recover the separator foil and other plastic foils in a light fraction, the heavy casing fraction and, as a middle product, the metal foils from the electrodes [8].
The black mass is a mixture of the coating materials together with some impurities. These result from the impacts during crushing and can be Cu and Al from the current collector foils or Al and Fe from the casing or the crusher [11,12]. The graphite from the negative electrode coating can be recovered by froth flotation [13,14,15]. The remaining fraction is treated hydrometallurgically to recover the contained metals from the positive electrode, i.e., Li, Ni, Mn and Co. Hydrometallurgical treatment includes leaching, solvent extraction, ion exchange, crystallization and precipitation [12].

2. Black Mass Properties and Their Relevance

The cut size at which the black mass is sieved from the crushed LIB cells varies in different studies, ranging from 200 [11,16] to 500 [10], 1000 [17,18], 2000 [19] and 3000 µm [20]. The cut size influences the yield in black mass as does the cell type, the crusher type and the applied grid size of the crusher. Wang et al. [21] crushed cells of the type 18650 and achieved a black mass output of 19.5% if sieved at 500 µm and 30.3% if sieved at 1000 µm. Two different prismatic EV cells were crushed with six different grid sizes (6–30 mm) by Wuschke [8]. Sieving at 1000 µm recovered 20.7–37.5% black mass for one cell type and 28.4–37.9% for the other cell type. The author concluded that the smaller the grid size of the crusher, the higher the black mass output. Wuschke [8] also crushed negative and positive electrodes separately with the same grid sizes and showed that 40–68% of the negative electrode and 6–25% of the positive electrode end up in the size fraction below 1000 µm. They explained the difference of the breaking behaviour between negative and positive electrodes by the different adhesive tensile strength of the coating. A similar behaviour of negative and positive electrodes was observed by Lyon et al. [10]. They investigated the degree of decoating, i.e., the ratio of the amount of coating in the black mass to the amount of coating on the foils before crushing, in relation to the crusher grid size (12–40 mm). The decoating of the negative electrode was in the range of 59–82% and for the positive electrode of 38–72%. The smaller the crusher grid size, the higher the amount of positive electrode coating in the black mass, whereas the proportion of impurities (Al and Cu) was 1.2% similar for all grid sizes.

2.1. Black Mass Composition

Several studies have analysed the metal content and its distribution in the black mass or the total crushing product. Most investigations were conducted with cells from other applications than EVs, such as mobile phones [22,23], or a black mass from an industrial recycling plant with undefined feed was used [17,18,19]. Not every study analysed all metals and they applied different methods for analysing the metal content, e.g., inductively coupled plasma—optical emission spectroscopy (ICP-OES) [17,18,20] or mass spectroscopy (ICP-MS) [22], X-ray fluorescence spectroscopy (XRF) [17,21,23], flame atomic adsorption spectroscopy (FAAS) [18] and automated mineralogy [14].
An overview of the content in various black masses with different sizes or sieved into different size fractions can be found in Table 1. In most cases, the content of metals from the positive electrode coating is higher, which leads to a smaller size fraction [17,18,23]. Contrarily, Vanderbruggen et al. [14] measured the highest content of lithium metal oxides (around 60%) in the fraction of 500–1000 µm and the lowest content (around 40%) in the fine fraction of < 63 µm. For different studies, the accumulated content of Ni, Mn and Co ranged between 28 [19] and 45% [17] for different black mass sizes (from 0–200 to 0–2000 µm). The Li content in different black masses has been reported to be around 3–4% [18,19,20] and that of P to be around 0.4–0.7% [23]. Vanderbruggen et al. [14] reported an overall graphite content of around 50%, whereby the smaller the size fraction, the higher the graphite content [14].
The contents of Al and Cu are higher in the larger size fractions [17,18,23]. The overall Al content varies between less than 1% [17,18,20] and 2.8% [19]; however, in the larger size fractions above 400 µm, it can reach up to 30% [23]. The Cu values are usually higher than the Al values [18,19,20]. The Fe content is generally less than 1%, as it comes only from the wear of the processing machine materials, if no cells with LFP positive electrode chemistry or steel casing are processed [17,18,19,20,23]. Krüger et al. [11] and Widijatmoko et al. [22] showed that the impurity content of Al, Cu and Fe in the black mass is higher for used cells than for new cells.

2.2. Particle Size Distribution and Flotation

According to Schubert [24], the optimum particle size for flotation lies in the range of 40–150 µm. For instance, Zhan et al. [16] used 210 µm, Salces et al. [15] 90 µm and Vanderbruggen et al. [14] 63 µm as the maximum particle size for their black mass flotation experiments. Therefore, the finer the black mass after crushing becomes, the smaller the need to regrind it to a suitable size for flotation. Yu et al. [25] investigated the grinding of the black mass prior to flotation and found out that it improved the flotation as more binder was removed from the surface of the positive electrode active material, improving its hydrophilicity. Also, by black mass grinding, Zhan et al. [16] could improve the product purity at a constant recovery rate of the positive electrode active material.
Vanderbruggen et al. [14] measured the particle size distribution of a <1000 µm black mass from cells of the type 18650 crushed with a 10 mm grid size. The majority (62%) was in the size fraction of 125–500 µm and only 25% were with <125 µm directly suitable for flotation. An industrial black mass (0–1000 µm) was sieved by Ruismaeki et al. [17]. In this case, 30% were below 100 µm and 30% were larger than 400 µm. The size fractions of 100–200 µm and 200–400 µm were about 20% each.

2.3. Influence of Metal Impurities on the Hydrometallurgical Treatment

There are different studies available on how the impurities of Al, Cu and Fe in the black mass affect the hydrometallurgical treatment. Chernyaev et al. [26] stated that Al can increase the acid consumption during leaching and it can form gel-like hydroxides, so that it co-precipitates together with the Co. On the other hand, it can also work as a reductant and, therefore, improve Co leaching and replace hydrogen peroxide (H2O2) [26]. Several authors reported that dissolved Al can be easily removed downstream, e.g., by pH control [27], by ion exchange [28] or by alkaline leaching without any major losses of Co [29]. Porvali et al. [18] found out that, with neutralization using sodium hydroxide, it is possible to remove 80% of the Al together with the Fe and Cu, but with losses of 10% of Ni and 2% of Co and Li.
Fe can be removed by changing the pH with sodium hydroxide [27,29] or by ion exchange [28]. What seems to cause the most problems is Cu. Or et al. [30] stated that Cu2+ ions can co-precipitate with Co, Ni and Mn and that a selective precipitation is only possible if the Cu concentration is low. According to Peng et al. [31], multistage solvent extraction is necessary to remove Cu impurities. Chen et al. [29] were able to remove 98.5% of the Cu by sodium hydroxide precipitation without any major Co losses. Peng et al. [19] applied selective leaching to the Li and Co without Cu leaching.

2.4. Effects of Metal Impurities in the Cell Resynthesis

Impurities in the positive electrode active material can have an influence on the production, product quality, cell performance and cell safety [32,33]. Therefore, there are impurity limits for the positive electrode material itself and their precursors. According to Nasser et al. [33], the typical limits for commercial precursors are 5–12 ppm for Al, 1–10 ppm for Cu and 5–10 ppm for Fe and, for the NMC positive electrode material, 20–50 ppm for Cu and 50–100 ppm for Fe. However, there is no special specification yet for recycled materials.
Impurities resulting from material resynthesis or direct positive electrode recycling can have a positive or negative effect on the cell; small amounts of impurities can even improve the electrochemical performance [30]. Al is already used in commercial LIBs to improve capacity retention, thermal stability and rate performance [30]. Zhang et al. [34] investigated different amounts of Al in an NMC622 positive electrode material and showed that cells with 0.2% Al in the positive electrode material had the highest rate capacities and a good cycling stability. High amounts of Al (5%) caused a poor cycling and rate capacity. Krüger et al. [11] found out that the Al forms hydroxides that influenced the secondary particle shape and increased the surface area, which reduced the specific capacity and caused a lower C-rate performance.
Sa et al. [27] tested cells with up to 5% Cu in the positive electrode coating, which improved the cycle stability, but reduced the specific rate performance. The improved cycling stability was also shown by Zhang et al. [35] together with an improved Li-ion transfer and an increased charge/discharge capacity, but only for low amounts of Cu up to 0.34%. A total of 1.22% of Cu had negative effects and the performance was lower than for the Cu-free positive electrode material. If, however, Cu is added in metallic instead of ionic form, e.g., by direct positive electrode recycling, it can cause short circuits. Fe can also improve the cycling stability as well as the rate performance and the discharge capacity if it makes up 0.25% or less of the positive electrode material. Tests with 1% Fe showed a lower performance and a reduced thermal stability [36].
As the impurities have an effect on the processing of the black mass as well as on the cell performance and safety, it is important to keep them in the black mass creation as low as possible. Also, to achieve the required recycling rates of 95% [3], it is of advantage to keep the Cu content in the black mass as low as possible, so that it can be recovered together with the Cu foils from the coarse fraction. Therefore, this work investigates in detail the influence of the crusher grid size on the black mass properties as well as the influence of the pre-treatment temperature. The crusher grid size has been investigated in several works [8,10], but they mostly focused on the coarse part of the crushing product and the amount of black mass created, but not on the properties of the black mass in detail. A thermal pre-treatment is important to reduce the risk origination from the evaporating solvents [9], but it can also influence the cell properties and the behaviour during crushing. Wuschke [8] showed that the adhesive strength of the coatings rises with the pre-treatment temperature, and how it affects the properties of the black mass is yet to be analysed.

3. Materials, Methods and Calculations

The data behind the figures and additional data can be found in the Supplementary Materials [37].

3.1. Materials

The cell type, from which the black masses were created, was a prismatic cell from Samsung SDI (Yongin-si, Republic of Korea) with a mass of around 2 kg and a capacity of 94 Ah. The cells originated from a used EV. The negative electrode had a graphite coating with an aluminium oxide layer on top. The binders used were CMC and SBR. On the positive electrode, an NMC111 was coated with PVDF. The total negative electrode coating made up 17.9% of the cell mass and the total positive electrode coating 34%. The Cu foil of the negative electrode accounted for 7.2% of the cell mass. As conductive salt, LiPF6 was applied with a 2.6% share. More detailed information about the cell can be found in Werner et al. [9].

3.2. Methods

The LIBs were processed according to the process scheme of the TU Bergakademie Freiberg [8]. The process steps for the comparison of the different crusher grid sizes can be seen in Figure 1a, and the steps for the comparison of the influence of the pre-treatment temperature in Figure 1b. A more detailed description can also be found in Werner et al. [9]. All experiments were repeated three times, and the error bars in the diagrams show the minimum and maximum values of the experiments.
All cells were overdischarged below 0% SoC (state of charge) to ensure safe crushing. The cells for the different grid sizes were overdischarged with a positive thermal coefficient resistance, whereas the cells with different thermal pre-treatment were discharged into pole reversal, as described by Kaas et al. [38]. For the comparison of the crusher grid size, the cells were directly placed in the pre-crusher without further pre-treatment. Pre-crushing was conducted with a rotary ripper and a rotary shear (TU Bergakademie Freiberg; Freiberg, Germany), followed by the final crushing with a fast rotating, single-shaft rotary shear (Universal Granulator UG300, Andritz MeWa GmbH; Gechingen, Germany). At the final crusher, four different grid sizes were applied, 10, 20, 30 and 40 mm. After crushing, the material was dried for 120 h at room temperature or at 80 °C in an oven (t6420, Heraeus GmbH; Hanau, Germany). The dry material was then sieved and the black mass recovered at 500 and 1000 µm using an EML 450 sieve machine (Haver & Boecker OHG; Oelde, Germany).
For the comparison of the pre-treatment temperatures, the burst membrane of the cells was opened and the cells were dried for 120 h at room temperature or in an oven (t6420, Heraeus GmbH; Hanau, Germany and UF110, Memmert GmbH + Co. KG; Schwabach, Germany) at 80 and 120 °C. Afterwards, they were as crushed well by a rotary ripper, rotary shear and granulator with a 30 mm grid size and dried again at 80 °C. From the dried material, two black masses were sieved, in the ranges of 0–500 and a 500–1000 µm.
For the particle size distribution analysis of the black mass, the 0–500 µm was sieved at 315 µm and the 500–1000 µm at 630 and 800 µm with an AS200 control (Retsch GmbH; Haan, Germany) to determine the particle size distribution. The fraction of < 315 µm was afterwards analysed by laser diffraction with HELOS (Sympatec GmbH; Clausthal-Zellerfeld, Germany) with 3 bar pressure and the R5 lens. Of the samples crushed with different grid sizes and dried at 80 °C, only the grid sizes of 20 and 40 mm were analysed exemplarily.
The contents of Al, Co, Cu, Fe, Li, Mn, Ni and P (threefold determination) were analysed of the fractions of 0–315 µm, 315–500 µm and 500–1000 µm by ICP-OES (iCAP 6300, Thermo Fisher Scientific Inc.; Waltham, MA, USA) after digestion with invers aqua regia in a Mars6 microwave digestion system (CEM Corporation; Matthews, NC, USA). Due to the intense sample preparation required and the availability of the ICP measurement device, only the samples crushed with different grid sizes and dried at 22 °C and the thermal pre-treated samples were analysed by ICP-OES. Some samples were also analysed by a scanning electron microscope (SEM, FEI Quanta 600 F, Thermo Fisher Scientific Inc.; Waltham, MA, USA) equipped with a field emission source (FEG) and an SSD-EDS X-ray spectrometer (Bruker Quantax X-Flash 5030 EDS-Detectors; Bruker Corporation; Billerica, MA, USA).
Two LIB coating raw materials were also analysed by laser diffraction with the same settings as the black mass samples. As the original raw materials for the investigated cells were unknown, two standard materials were bought, a natural graphite from ProGraphite (Spherical Graphite 17 micron 99.95% C, ProGraphite GmbH; Untergriesbach, Germany) and an NMC622 from BASF (HEDTM NCM-622 ET011; BASF SE; Ludwigshafen, Germany).

3.3. Calculations

The yield of the black mass (YBM) gained by the processing of the LIB was calculated using Equation (1). It relates the mass of the created fraction of <1000 µm (mBM) to the original cell mass (mCell).
  Y B M = m B M m C e l l
The materials that are aimed to end up in the black mass are the coatings of the two electrodes together with the conductive salt. To evaluate the different process settings, the recovery of the coatings together with the conductive salt (RC+S) was calculated using Equation (2). The mass of the coating and the conductive salt, which is defined as the black mass without the impurities Al, Cu and Fe taken into account in the equation by their concentration in the black mass (cBM,Al, cBM,Cu and cBM,Fe, respectively), was related to the mass of the coating and the conductive salt in the original cell. The latter was calculated from the concentrations of the two coatings (cCell,C) and the conductive salt (cCell,CS) presented in Section 3.1, which amounted to 54.5% of the cell. Simplifying, it was assumed that the impurities all have a metallic and no oxidic form.
R C + S = m B M · 100 c B M , A l c B M , C u c B M , F e   m c e l l · c C e l l ,     C + c c e l l ,   C S  
For the metal recovery, only the recovery of Cu was calculated as for the other metals the original share in the cell is not fully known. Equation (3) states the calculation of the recovery of Cu (RCu) in the black mass. The mass of Cu in the black mass was placed in relation to the mass of Cu in the cell, whereby the mass of Cu in the black mass is the product of the mass of the black mass (mBM) with the Cu concentration (cBM,Cu) and the mass of Cu in the cell is the product of the mass of the cell (mCell) and the concentration of Cu in the cell (cCell,Cu) of 7.2%, as presented in Section 3.1.
R C u = m B M · c B M , C u   m c e l l · c C e l l , C u
The NMC content was defined as the sum of the elements Ni, Mn and Co together with O2, which was added mathematically in the stoichiometric ratio 1:1. Li was not taken into account as this was measured separately. For the conductive salt, the PF6 content was calculated based on the measured P content. As for the NMC, Li was not taken into account, but stated separately together with the Li from the NMC, as it could not be clearly assigned to one of the two, NMC and LiPF6. The fraction that could not be analysed by ICP-OES and is therefore undetermined was labelled as the “other” fraction. It contains mostly graphite, but also the binders, the additives and comminuted plastics.

4. Results

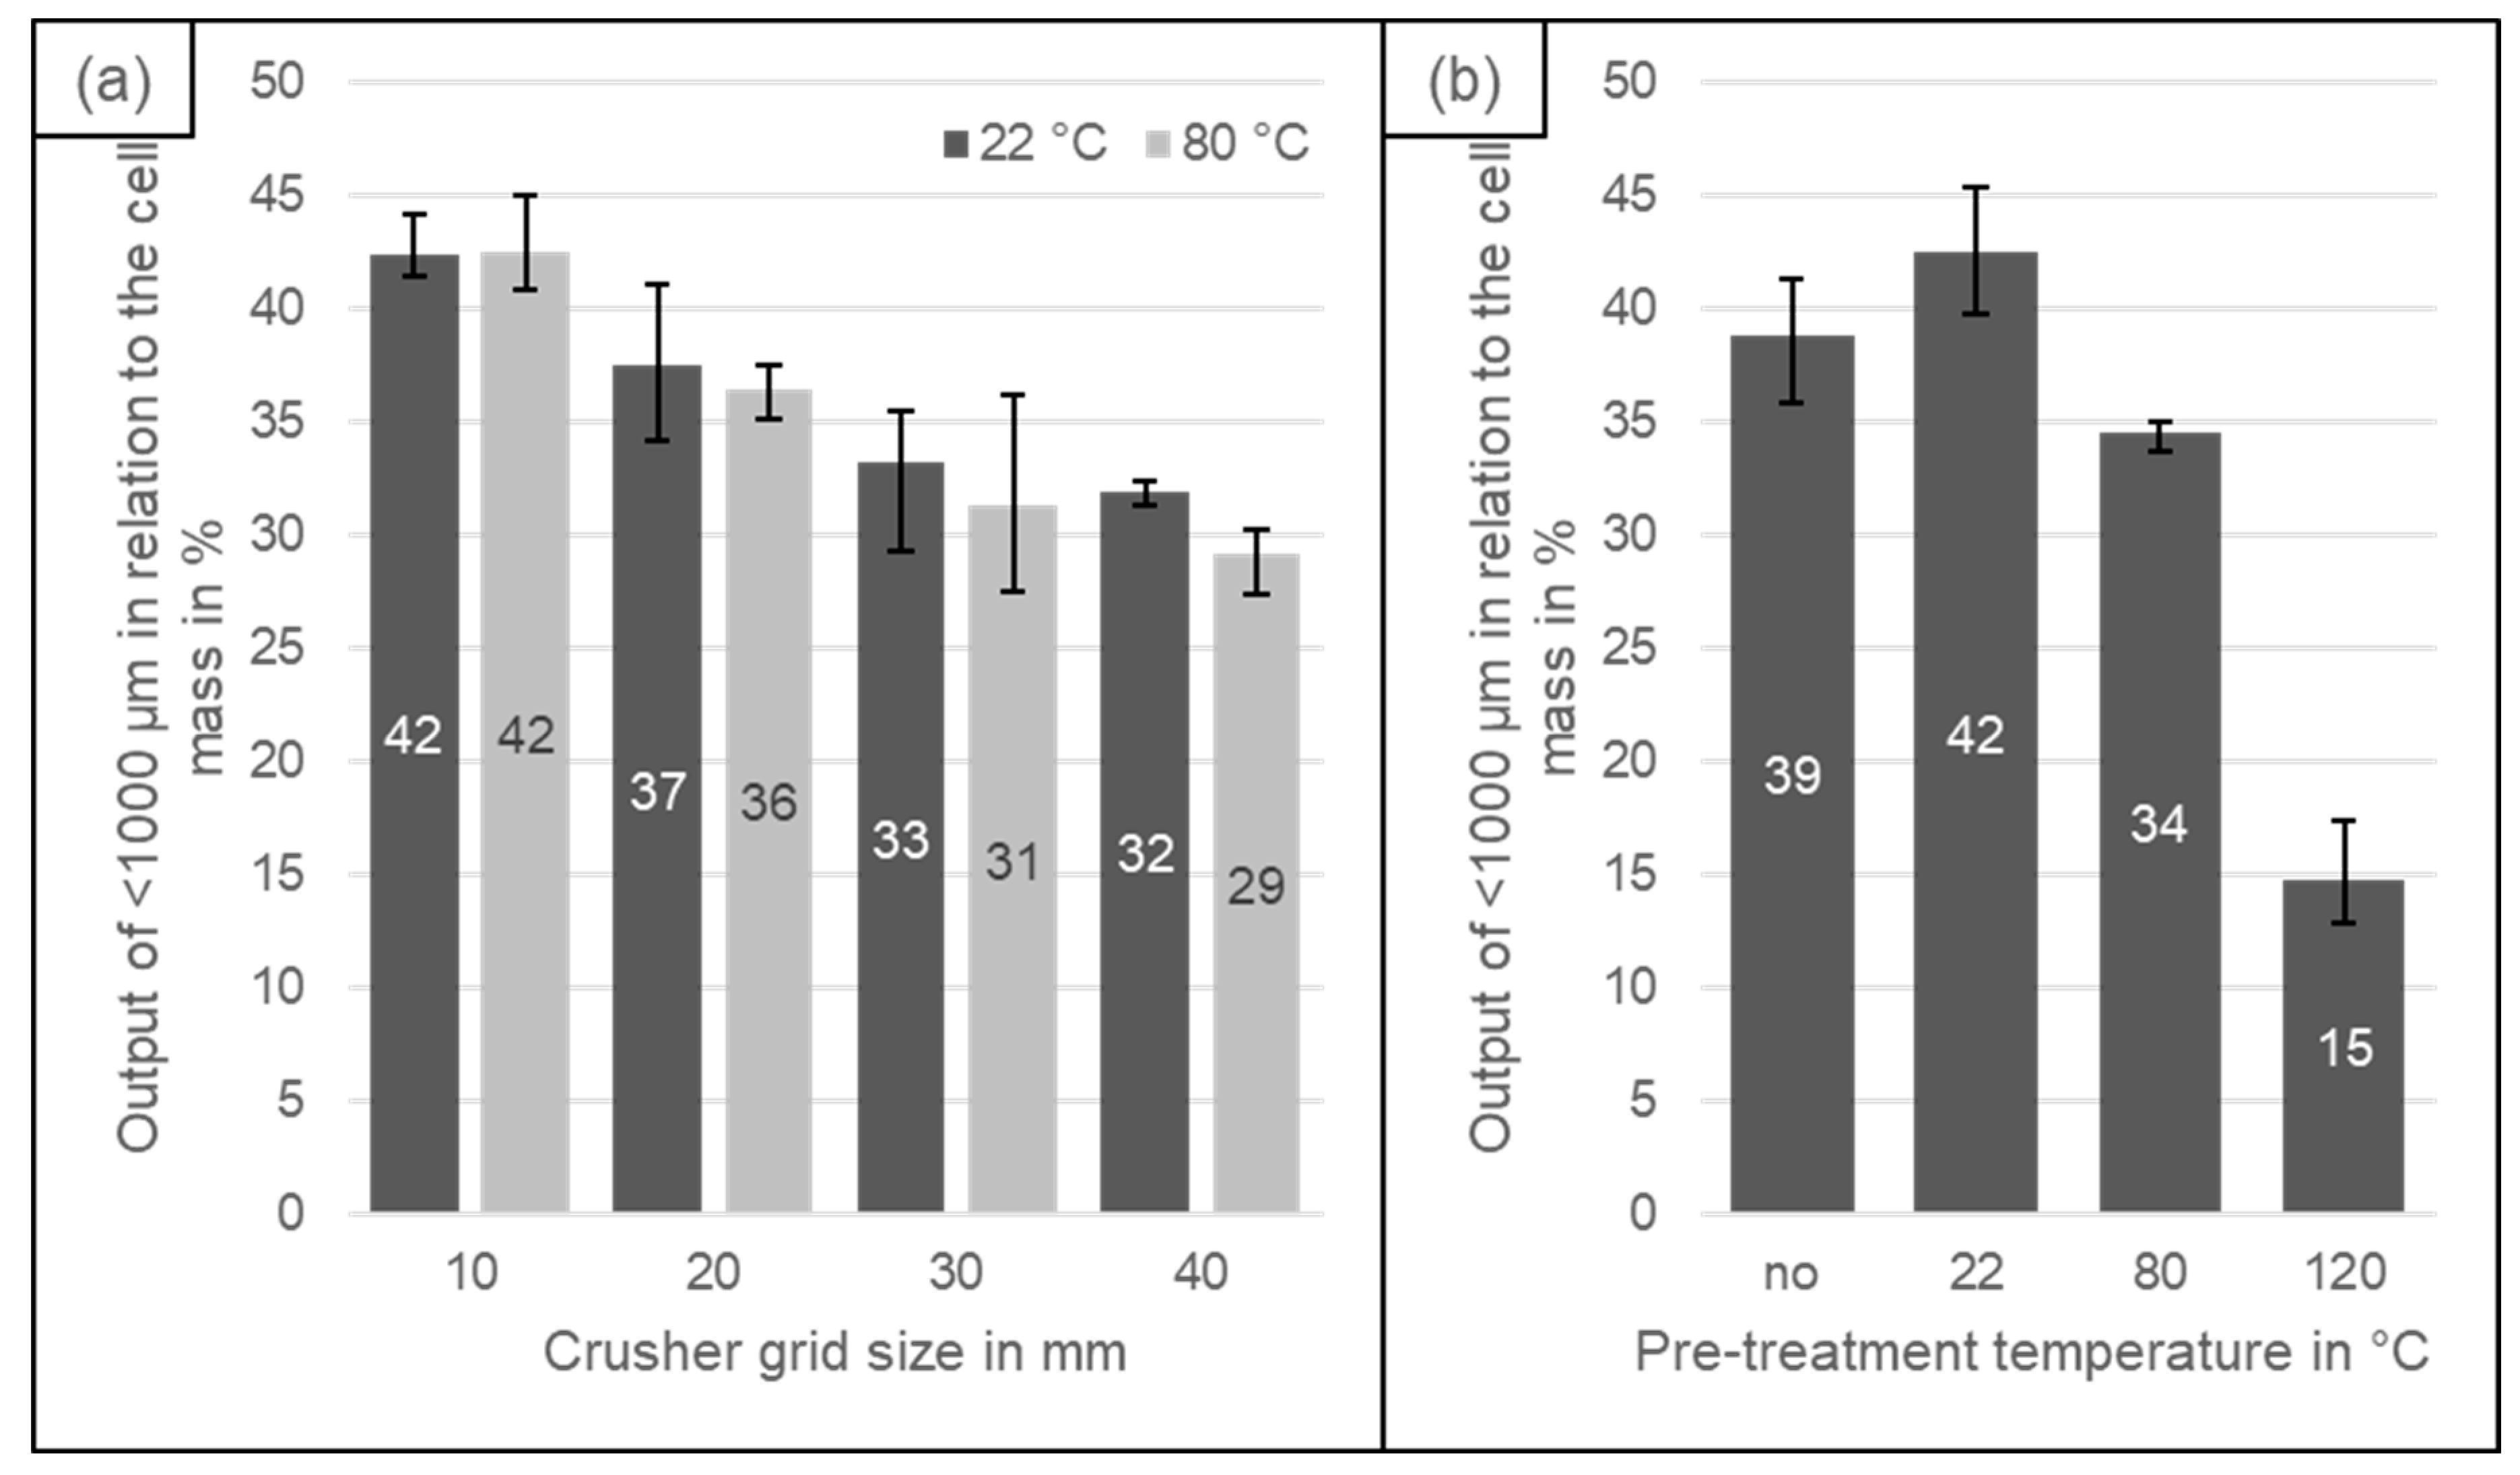
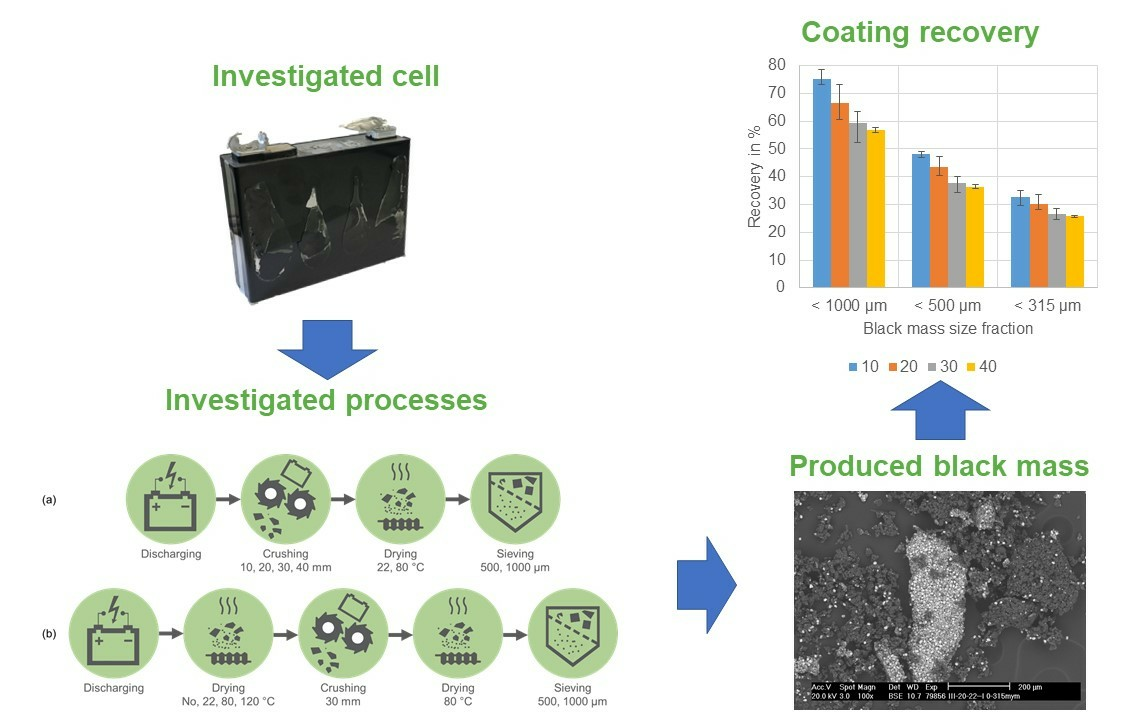
4.1. Black Mass Yield

The yield of the black mass (<1000 µm) decreased with the increase in the crusher grid size. The highest yield (42%) of black mass was obtained with the 10 mm grid and the lowest (29–32%) with the 40 mm grid, as can be seen in Figure 2a. This corresponds to the findings of Wuschke [8] and Lyon [10]. The drying temperature after crushing had no influence on the black mass output; the values for 22 and 80 °C were similar (Figure 2a). The temperature of 80 °C is too low to decompose the binder [14] and, as there is no further stress applied, a weakening or strengthening of the binding does not have an effect on the black mass yield. Differently, the pre-treatment temperature had an influence on the yield (Figure 2b). Compared to no thermal pre-treatment, the drying at 22 °C caused a small increase in the black mass, which is still within the limits of the error bars. A reason for this could be a loss in strength or a lower adhesion of the coating to the electrode foils due to missing moisture. With the increase in the pre-treatment temperature, the amount of black mass decreased. For 120 °C, only a third of the amount was created compared to 22 °C. The reason for this is the increase in the tensile adhesive strength of the electrode foils, as reported by Wuschke [8]. This increase in strength leads to a lower decoating of the electrode foils. Differently to the findings of Kaas et al. [38], the different discharge method had an influence on the yield of black mass. The cells that were overdischarged only by the resistance and crushed with 30 mm grid showed a 31–32% black mass output. From the pre-treatment temperature comparison, the cell with no thermal pre-treatment was processed with the same settings, but overdischarged into pole reversal. This increased the black mass output to 39%. In comparison to Kaas et al., the same cell type and the same process was applied. The difference is that the overdischarge into pole reversal in this study for the thermal pre-treated cells was conducted with complete modules and not with single cells. The higher voltage could have led to a stronger effect on the coating adhesion and, therefore, the black mass yield.

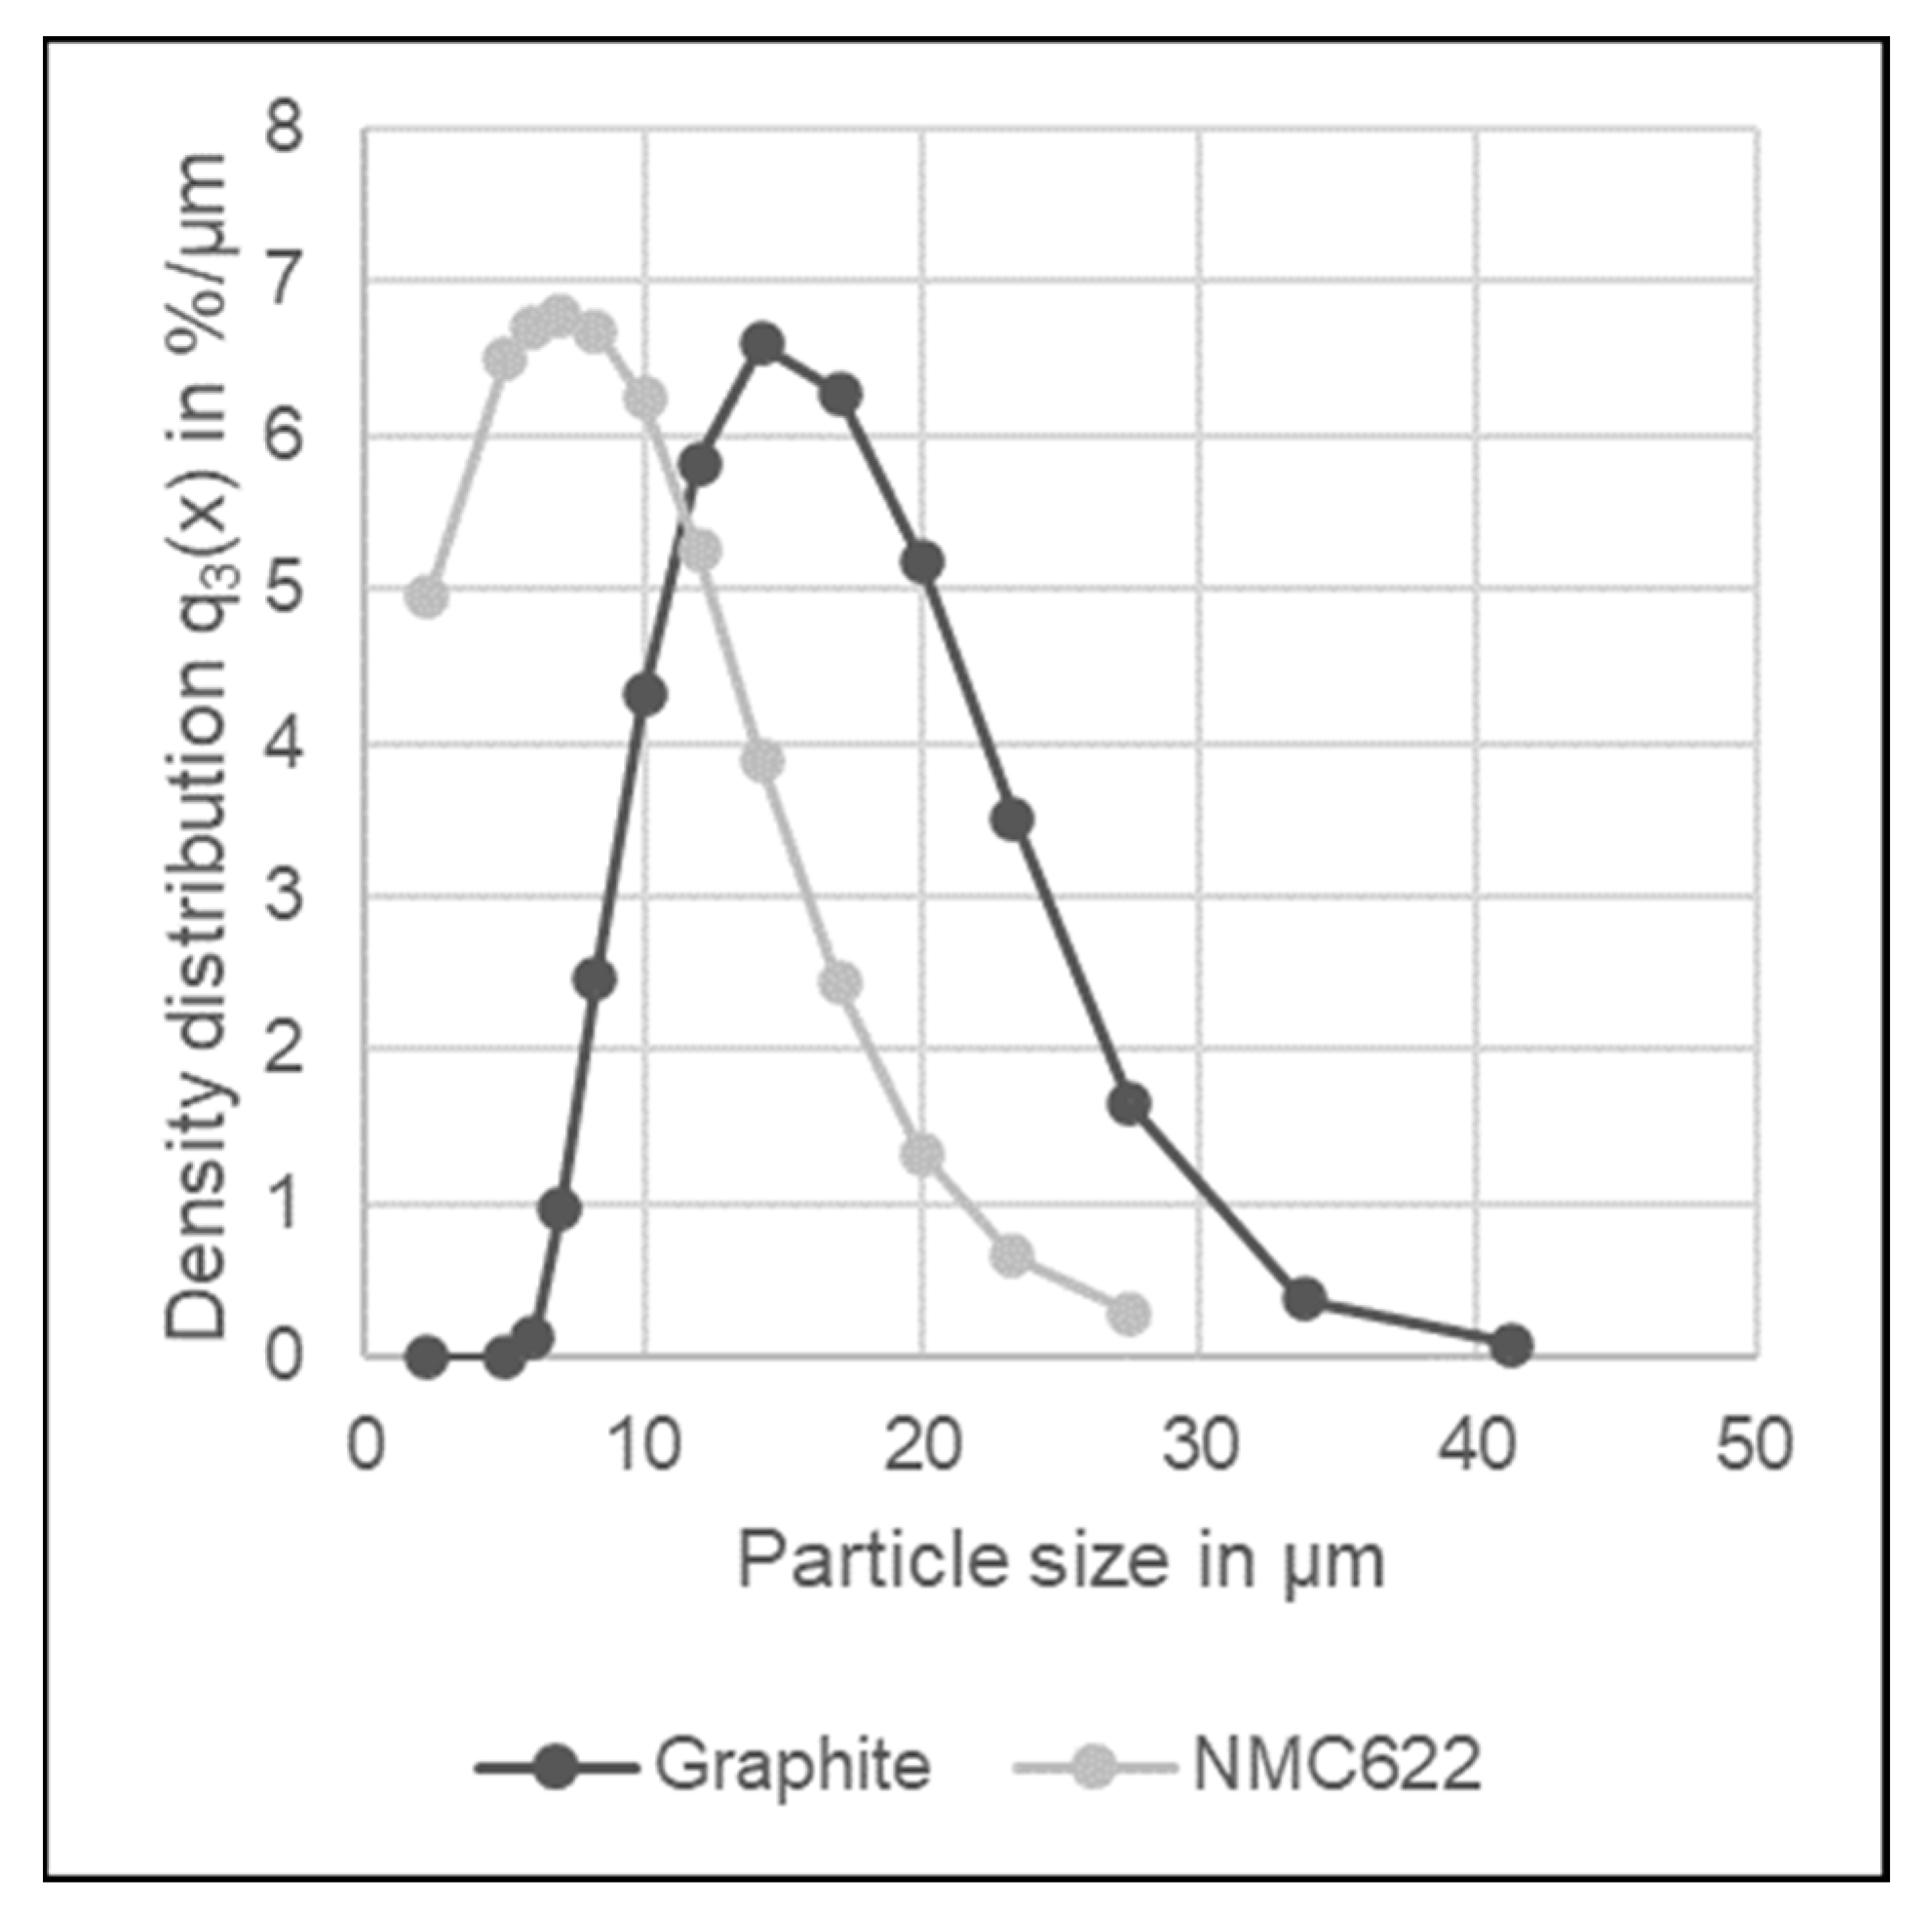
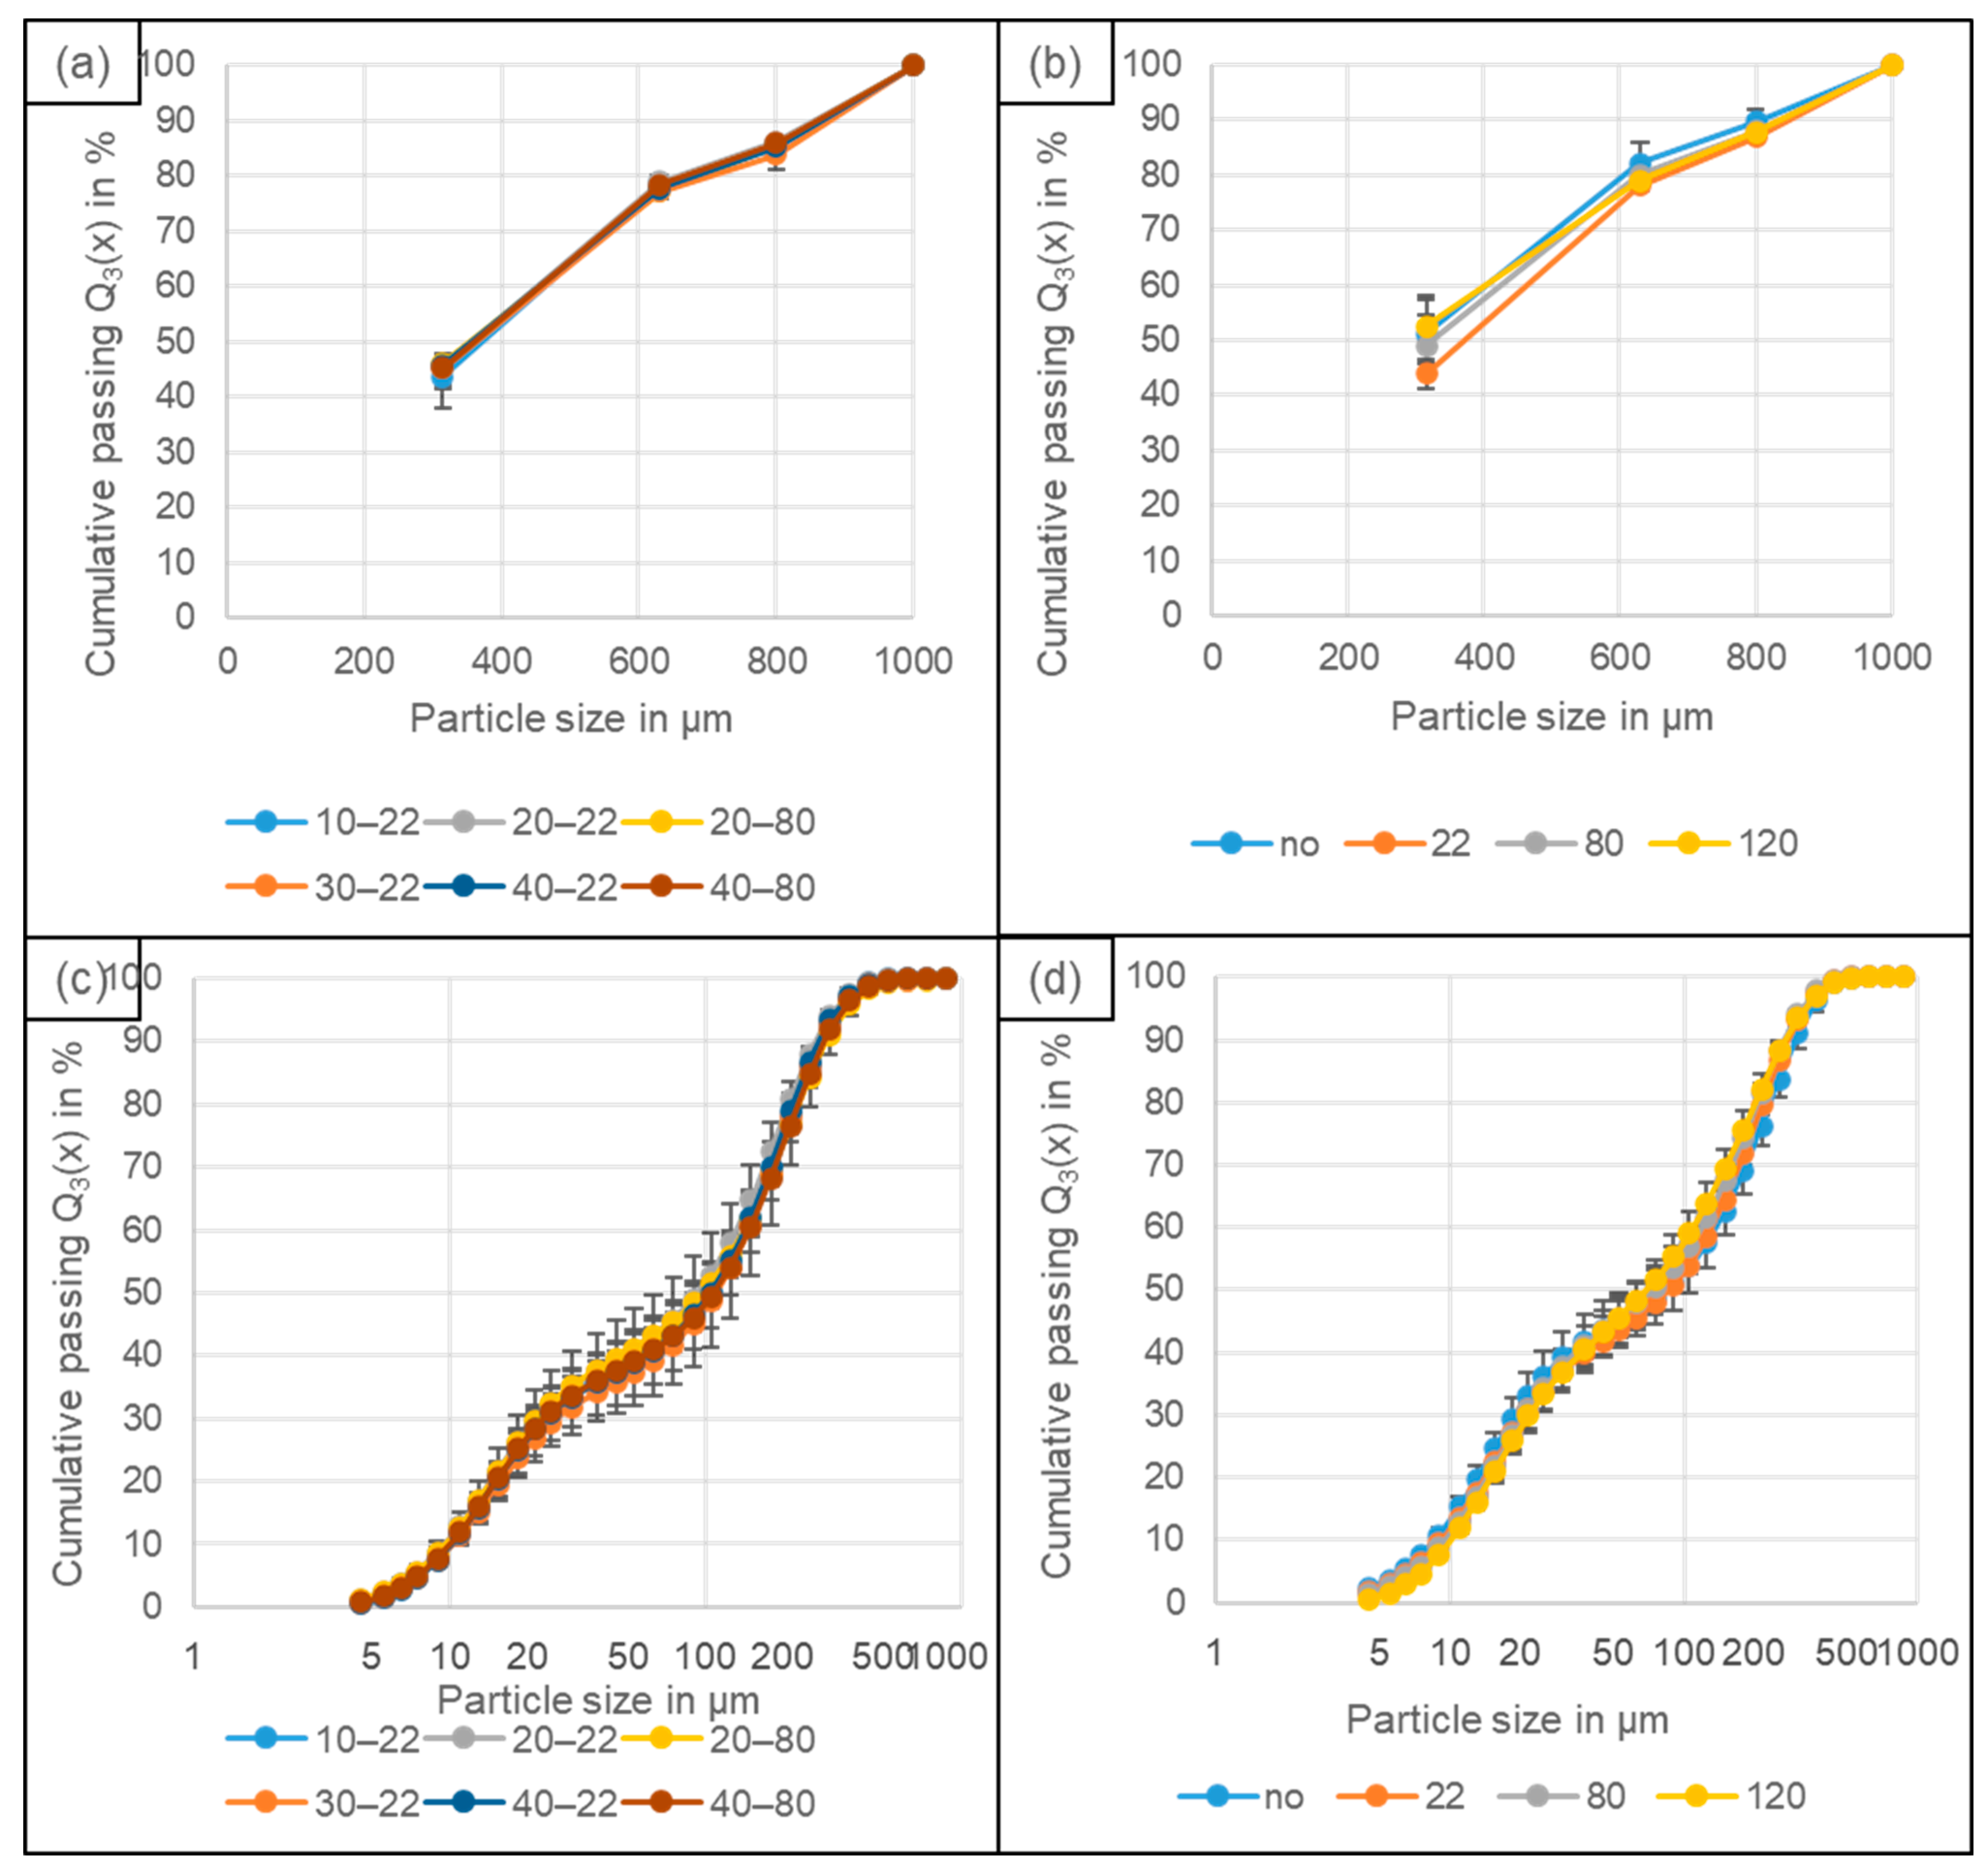
4.2. Particle Size Distribution

The particle size distribution (PSD) of the black mass was not influenced neither by the grid size (Figure 3a) nor by the drying temperature (Figure 3b). Only the PSD of the black mass of the cells that were thermally pre-treated at 22 °C was a little bit coarser, and the reason for this is unknown. The difference is still in the precision of measurement. The mass share of particles <315 µm is 44%, whereas for the other thermally pre-treated black masses, it lies in the range of 49–53%. Again, there is a difference caused by the discharge methods. The cells overdischarged by a resistance had a lower proportion of particles <315 µm (44–46%) compared to the cells overdischarged into pole reversal (49–53%), except the cells pre-treated with 22 °C (44%). The x50,3 for the sieve analysis of the different grid sizes lie in the range of 355–370 µm. For the experiments focusing on different pre-treatment temperatures, the x50,3 could not be determined for all experiments as the amount of <315 µm was above 50% for some black masses.
The results for the laser diffraction analysis of the <315 µm also show no difference of the PSD between the different grid sizes (Figure 3c) and drying temperatures (Figure 3d). In this case, the PSD of the cells pre-treated with 22 °C were similar to the others. The x50,3 values lie in the range of 93–110 µm for the cells crushed with different grid sizes and in the range of 70–86 µm for the cells with different thermal pre-treatments.
If the PSD is plotted as the density distribution (see Supplementary Material [37]), it shows two modes, one at 10 µm and one at 150 µm. The mode at 10 µm corresponds to the PSD of the analysed raw materials. The analysis of graphite showed a mode of 14 µm and, for NMC622, a mode of 7 µm, as it can be seen in Figure 4. This fits with the literature values, e.g., Wurm et al. [39] stated the typical particle size for graphite was 20 µm and Rothermel et al. [40] measured a 10–30 µm particle size. For NMC111, Sa et al. [27] stated the particle size to be 10–15 µm and Vanderbruggen et al. [13] reported a x90 of 15.9 µm.
The second and smaller mode at 150 µm could be related to the electrode thickness. Wuschke [8] measured the electrode thickness of the predecessor of the cell type used for this study. The positive electrode had a thickness of around 130 µm and the negative electrode of around 140 µm. The scanning electron microscope with energy dispersive X-ray spectroscopy (SEM-EDX) analysis of black mass samples with and without thermal pre-treatment by Vanderbruggen et al. [14] showed that there can still be Al foil pieces with coating on both sides that were not fully liberated. However, those were far more frequent in the pyrolyzed than in the non-pre-treated black mass.
In the area between the two modes (10–150 µm) are the coating materials that are still bound together by the binder or partially coated foils. The gradation for 120 °C is a little bit coarser in this area, indicating the stronger binding due thermal pre-treatment leading to larger agglomerates.

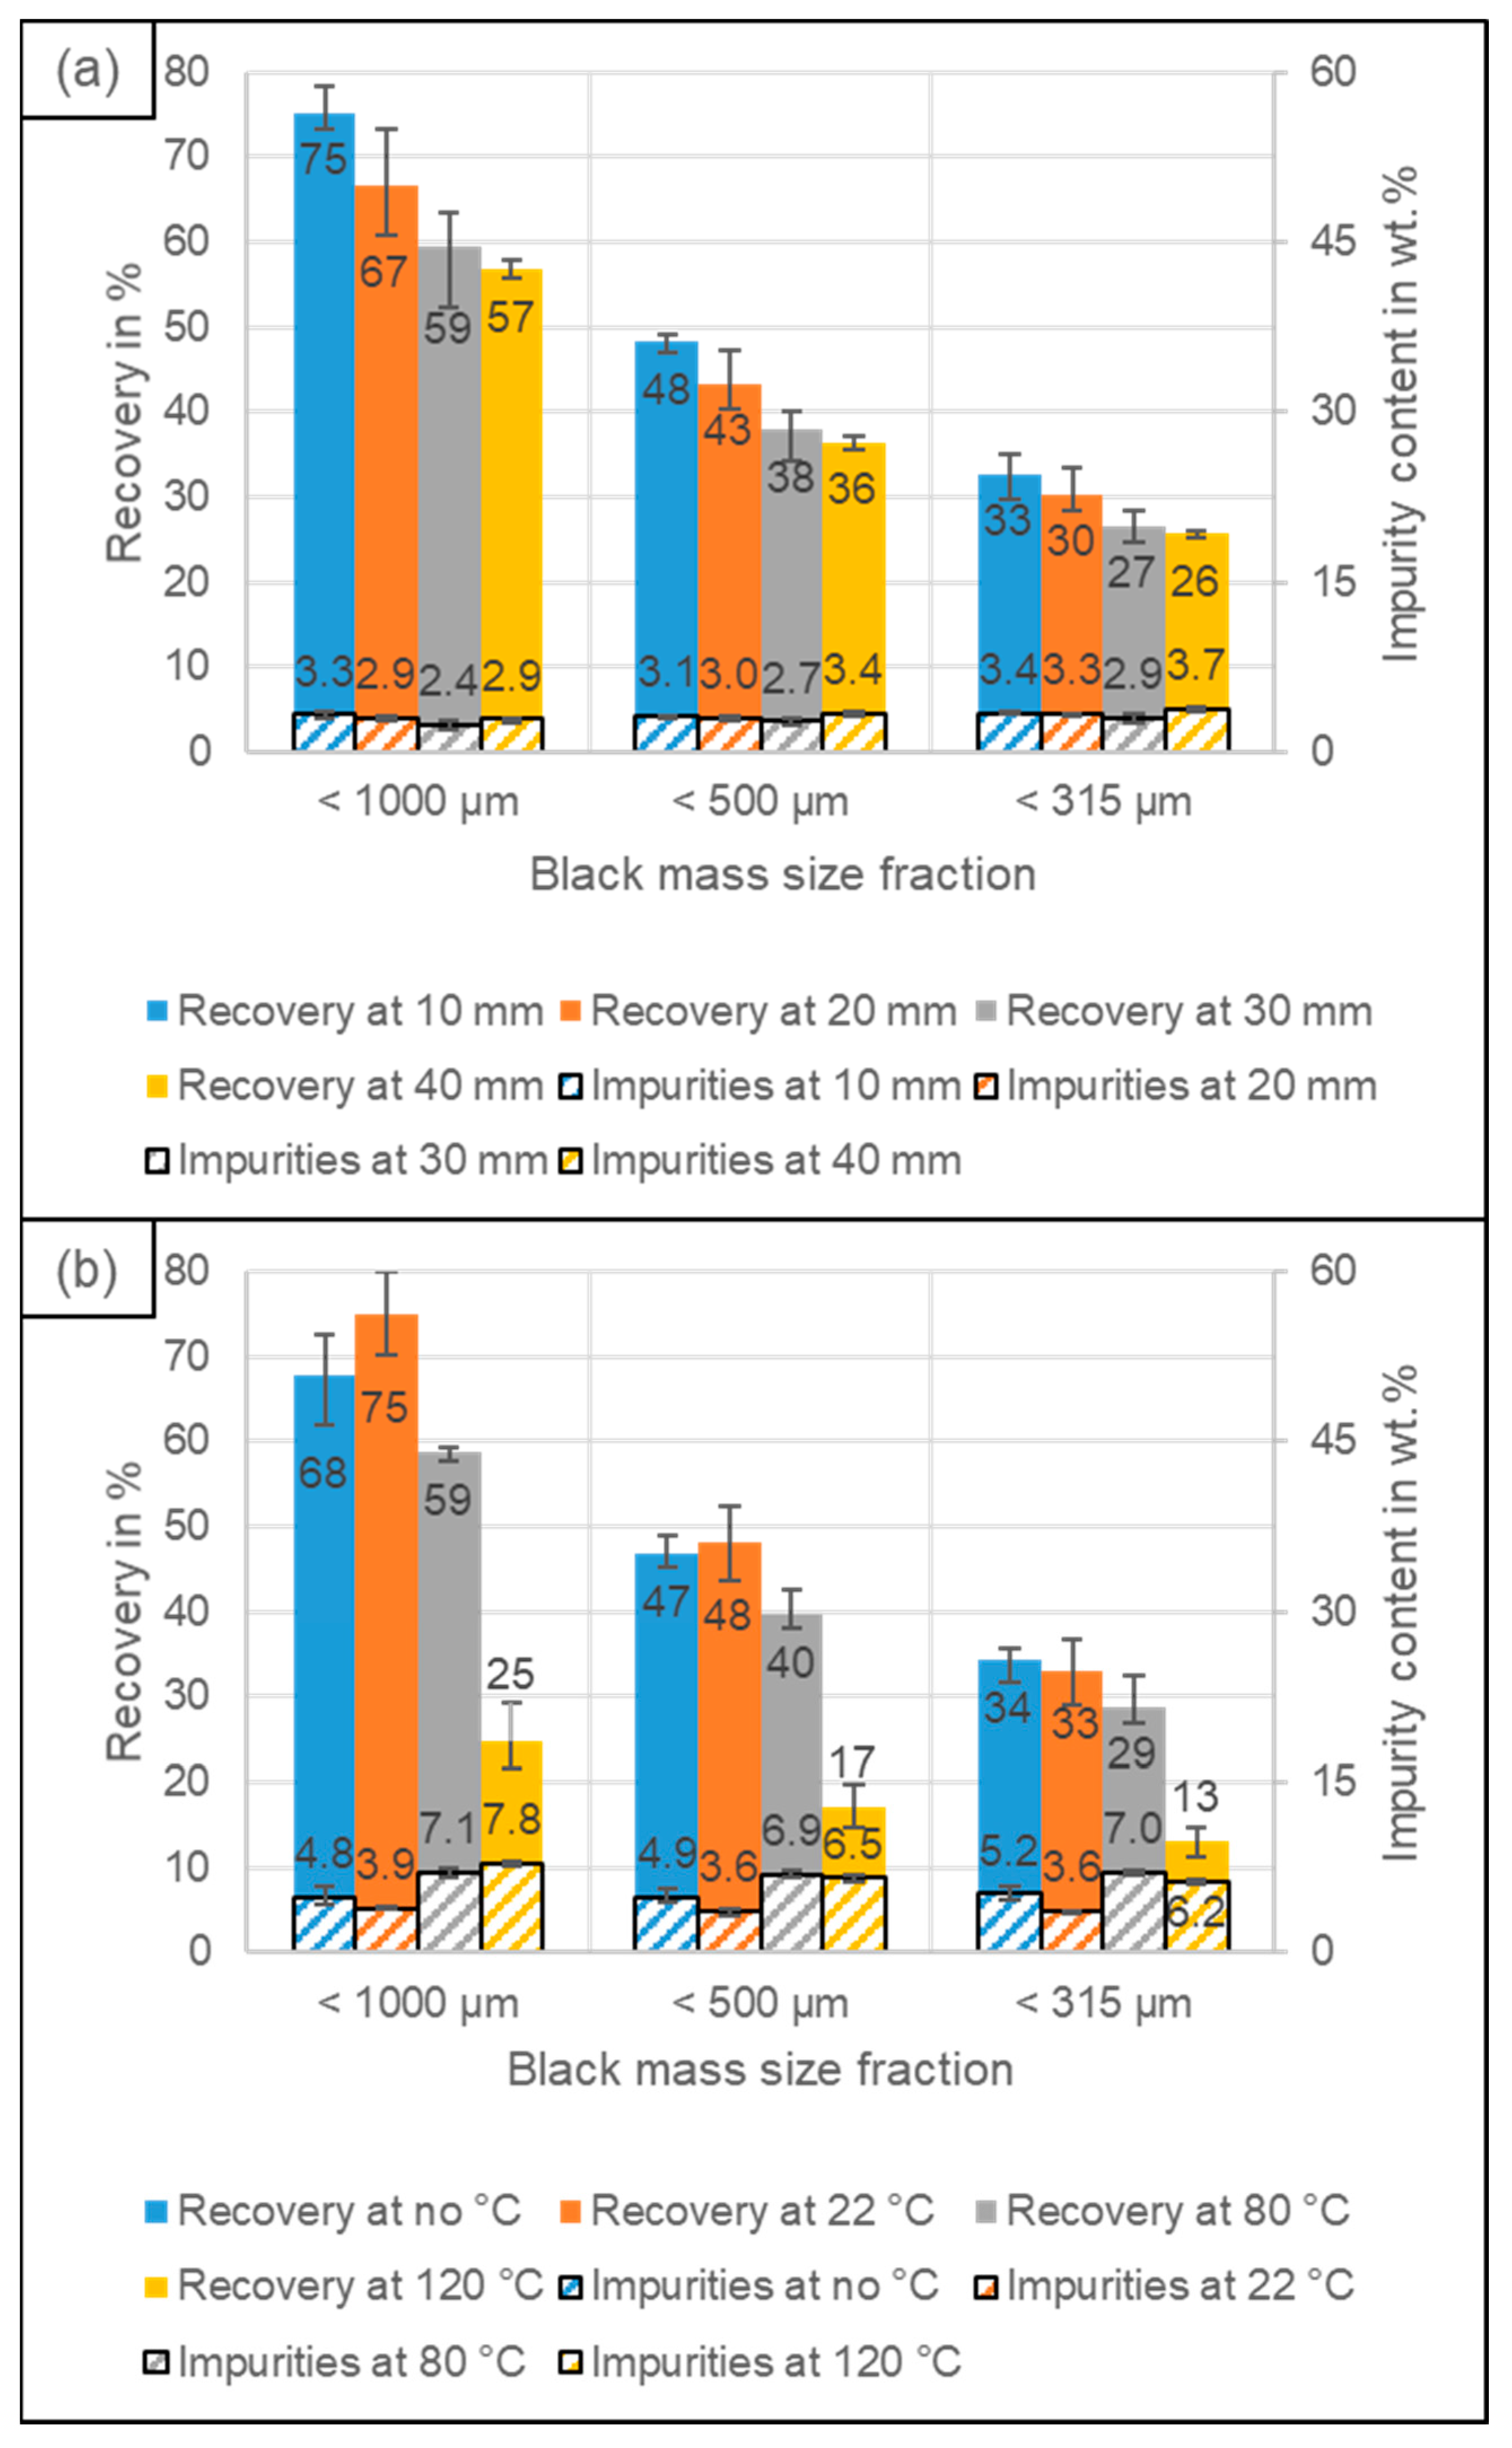
4.3. Recovery of Coating and Conductive Salt vs. Al, Cu and Fe Impurities

The recovery of the coating and conductive salt increases with the decrease in the grid size (Figure 5a), e.g., for the 0–1000 µm black mass, the recovery increases from 57% for the 40 mm grid to 75% for the 10 mm grid. At the same time, the content of impurities, defined as the sum of Al, Cu and Fe, in the black mass is a relative constant with values in the range of 2.4–3.3%. Regarding the black mass, it is therefore advisable to operate with the smallest grid size. If comparing the different cut sizes of the sieving step, the recovery decreases with the decrease in the cut size, e.g., for the 10 mm grid size, it decreases from 75% for a 0–1000 µm to 48% for a 0–500 µm and 33% for a 0–315 µm black mass. Again, the impurity content is relatively stable, with values in the range of 2.4–3.7%. Therefore, the largest cut size should be used to optimize the recovery.
For the different pre-treatment temperatures, the highest recovery can be achieved at 22 °C, while also having the lowest impurity content, as it can be seen in Figure 5b. In comparison to no thermal pre-treatment, the recovery at 22 °C increases due to the higher black mass output, which seems to be caused by an increased decoating and not by a weakening of the foils, which explains the decreased impurity content. With the increase in the pre-treatment temperatures, the recovery decreases due to the poorer decoating. For 120 °C, the recovery is only a third of the recovery at 22 °C. The impurity content, on the other hand, is twice as high for a high temperature. The mass of the impurities in the black mass decreases; however, due to the lower amount of coating materials in the black mass, the proportional share of the impurities in the black mass increases. The increase in impurities is, therefore, not caused by a higher comminution of the electrode foils. For the black mass cut size, the trend is similar as for the different grid sizes; the recovery decreases with the decrease in the cut size, whereas the impurity content stays more or less the same.

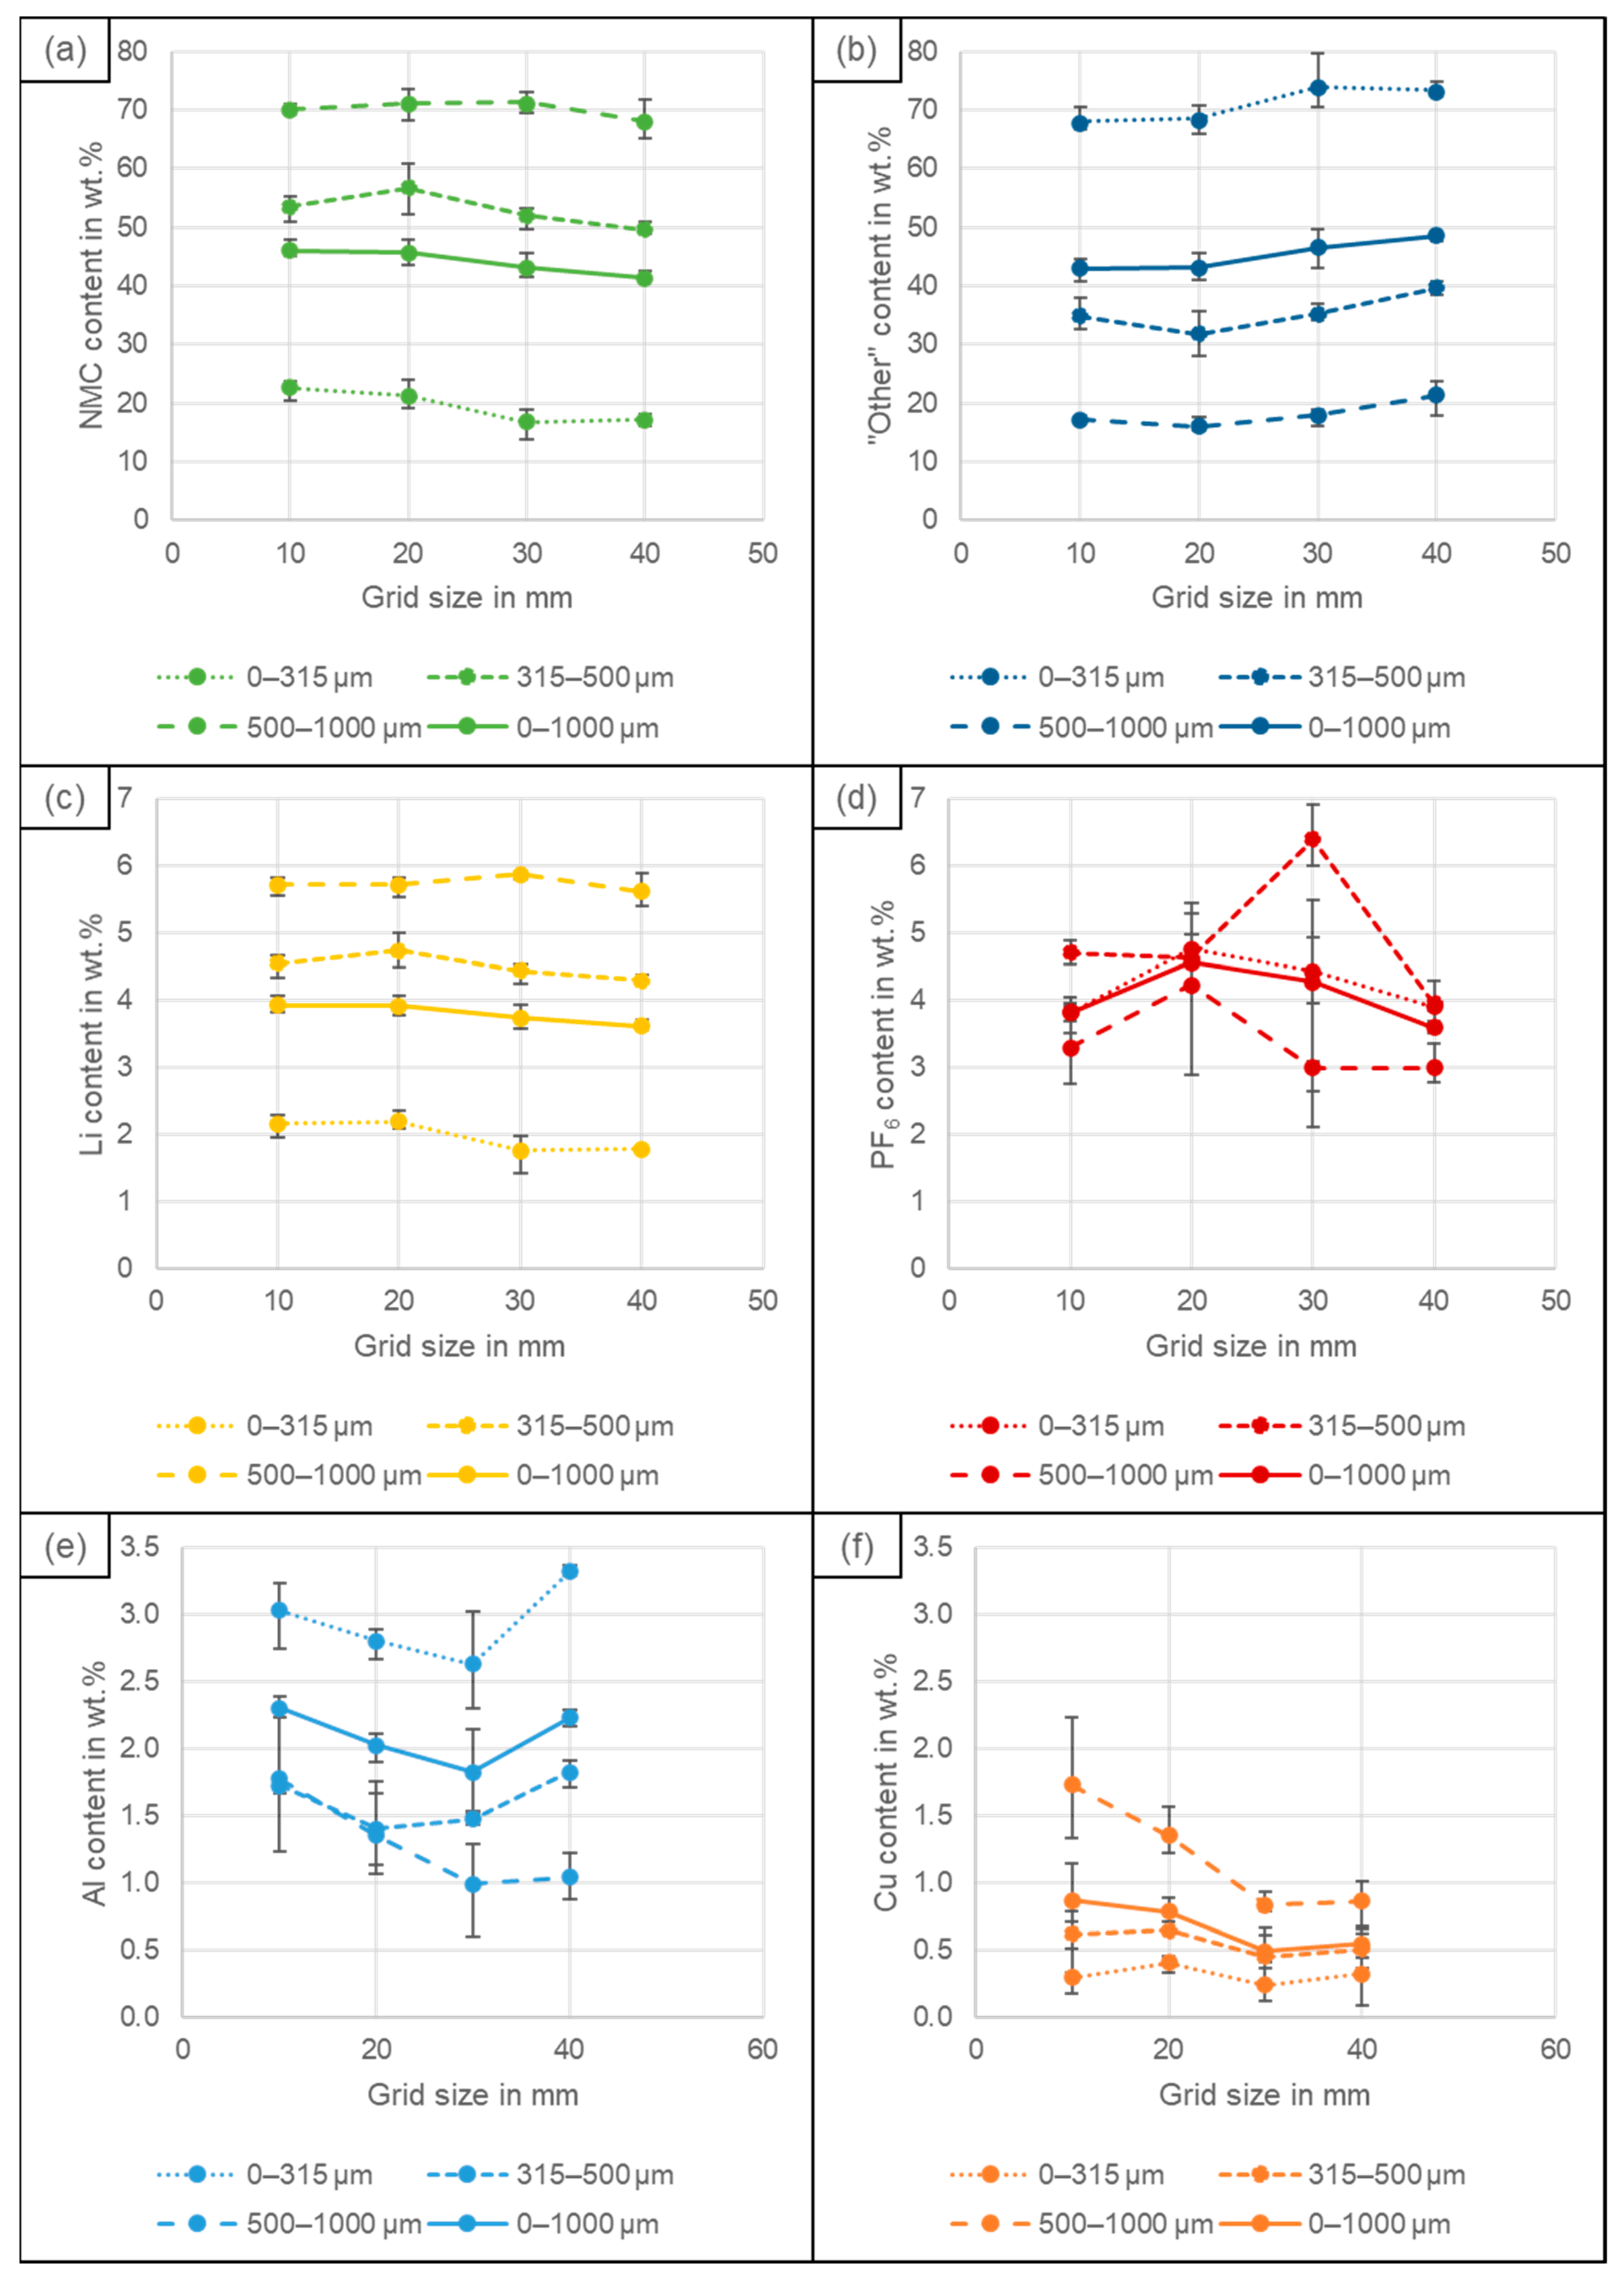
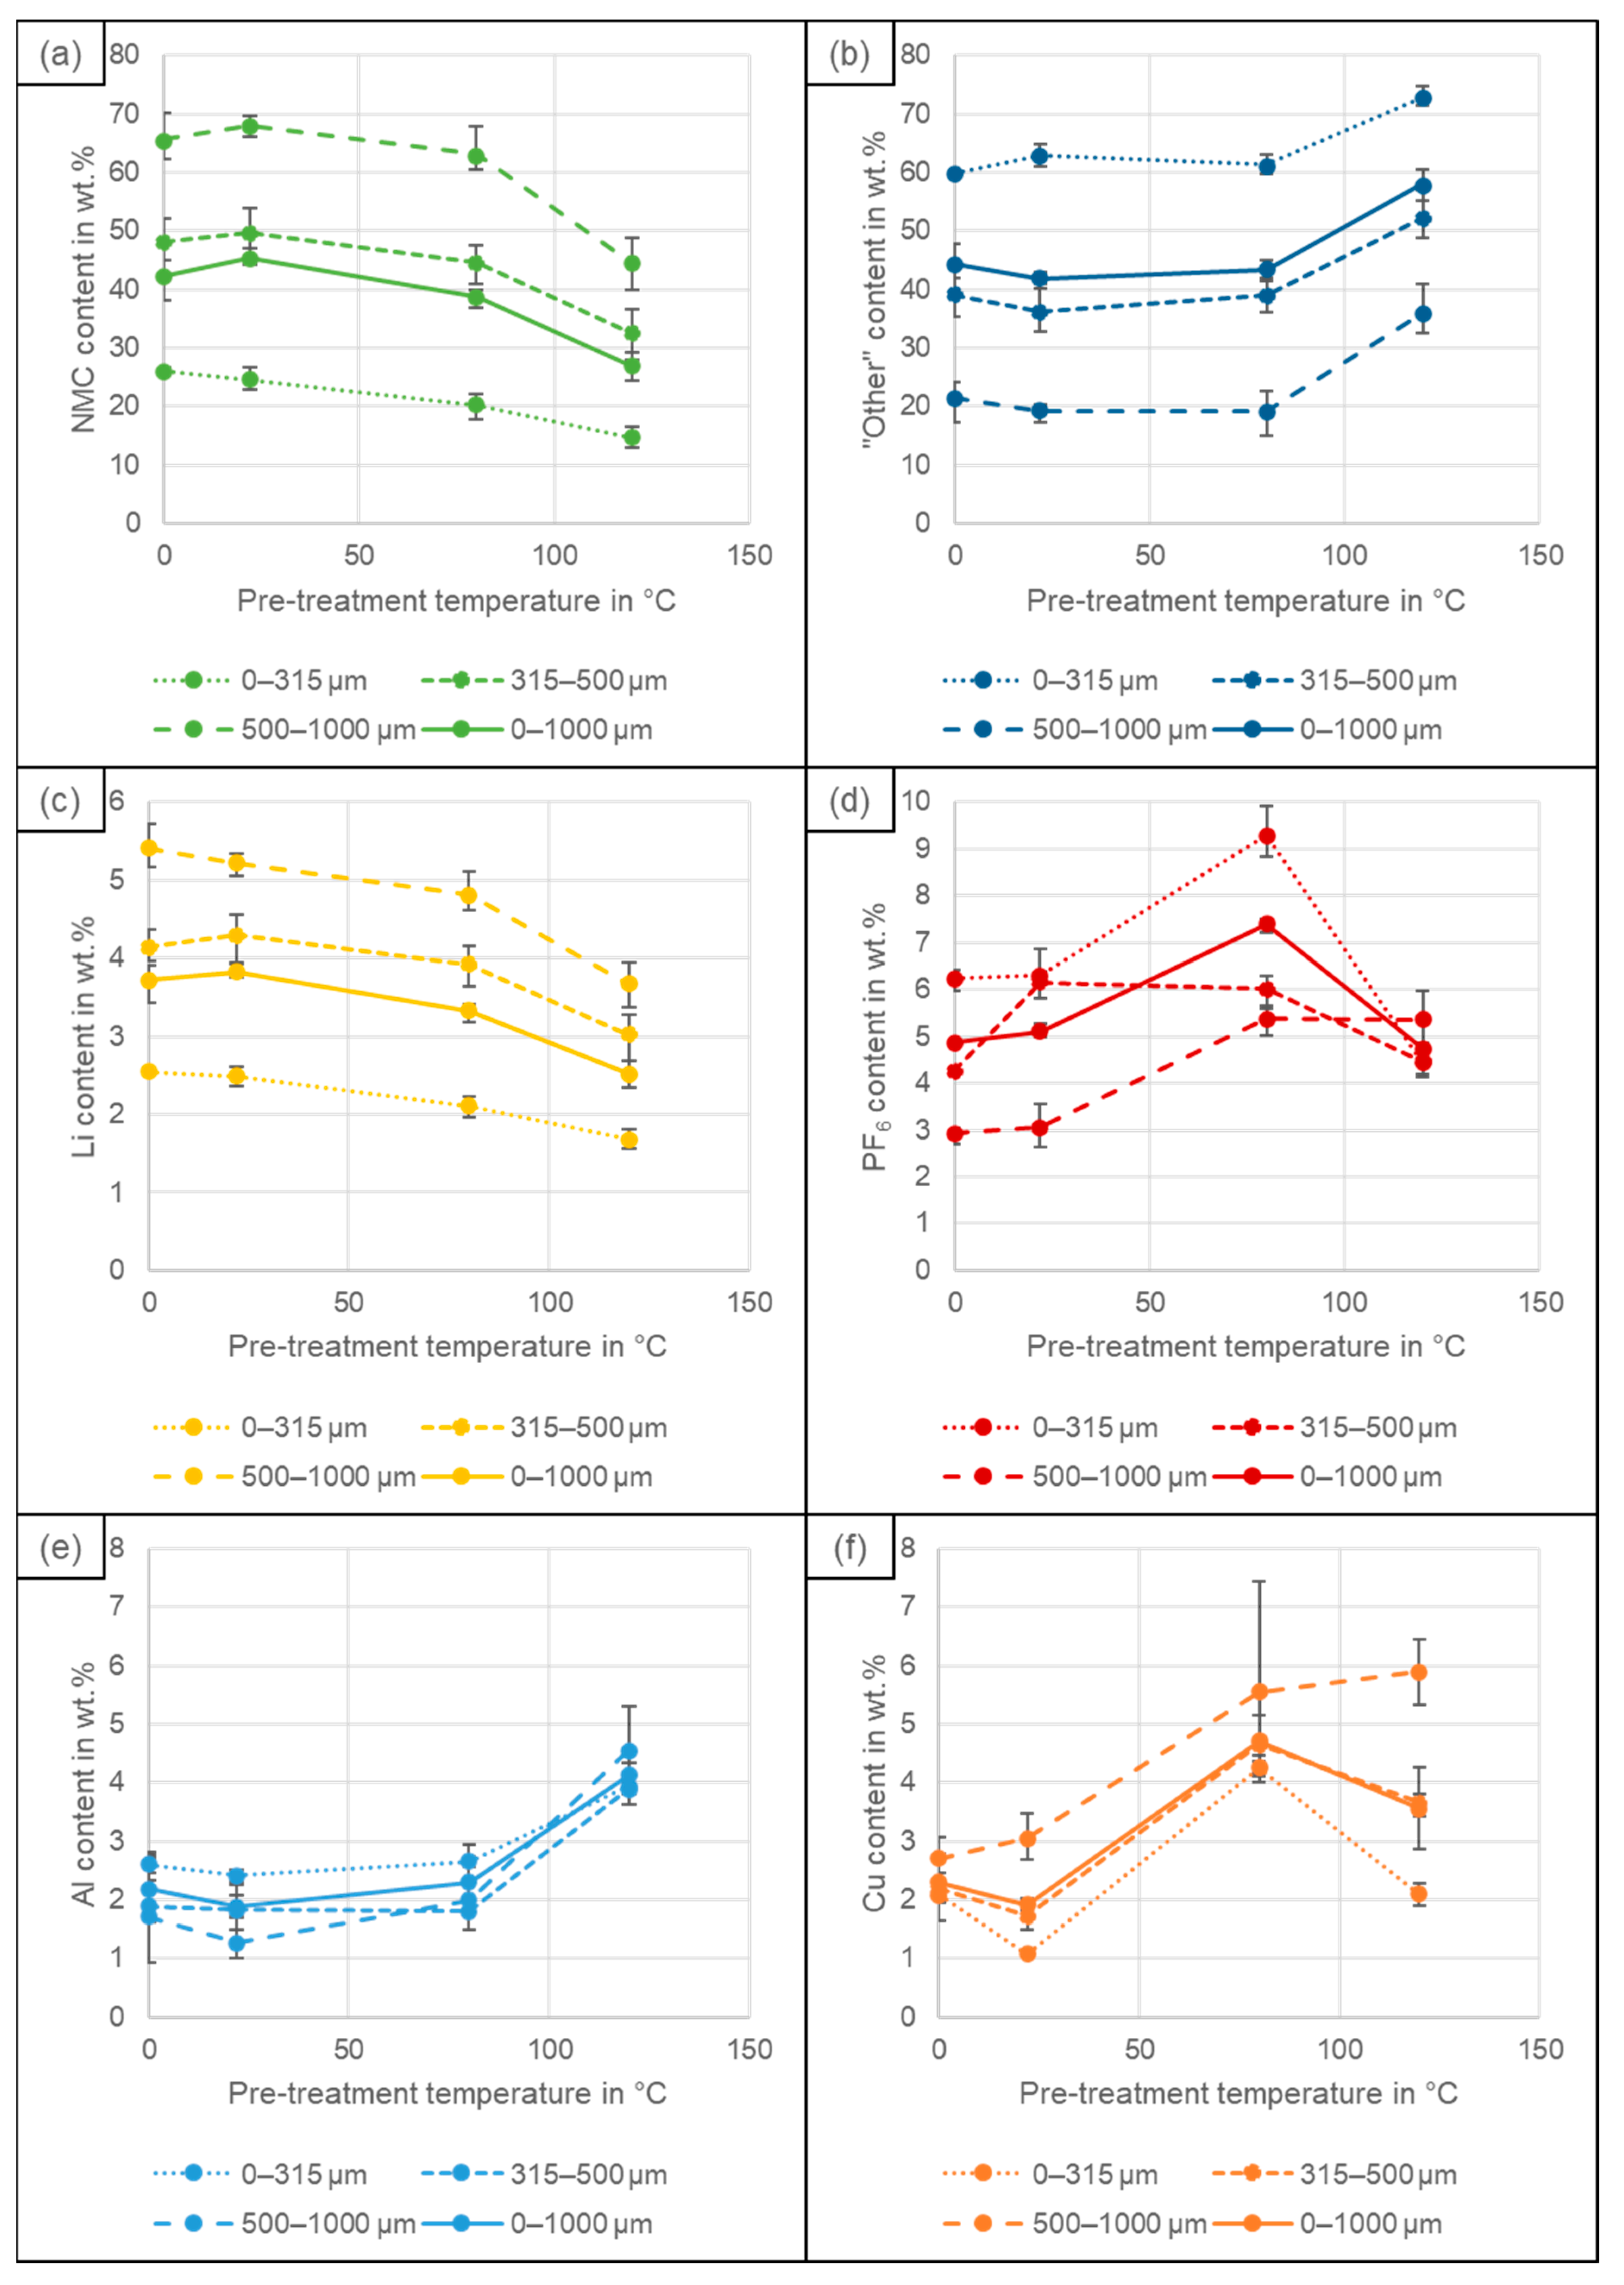
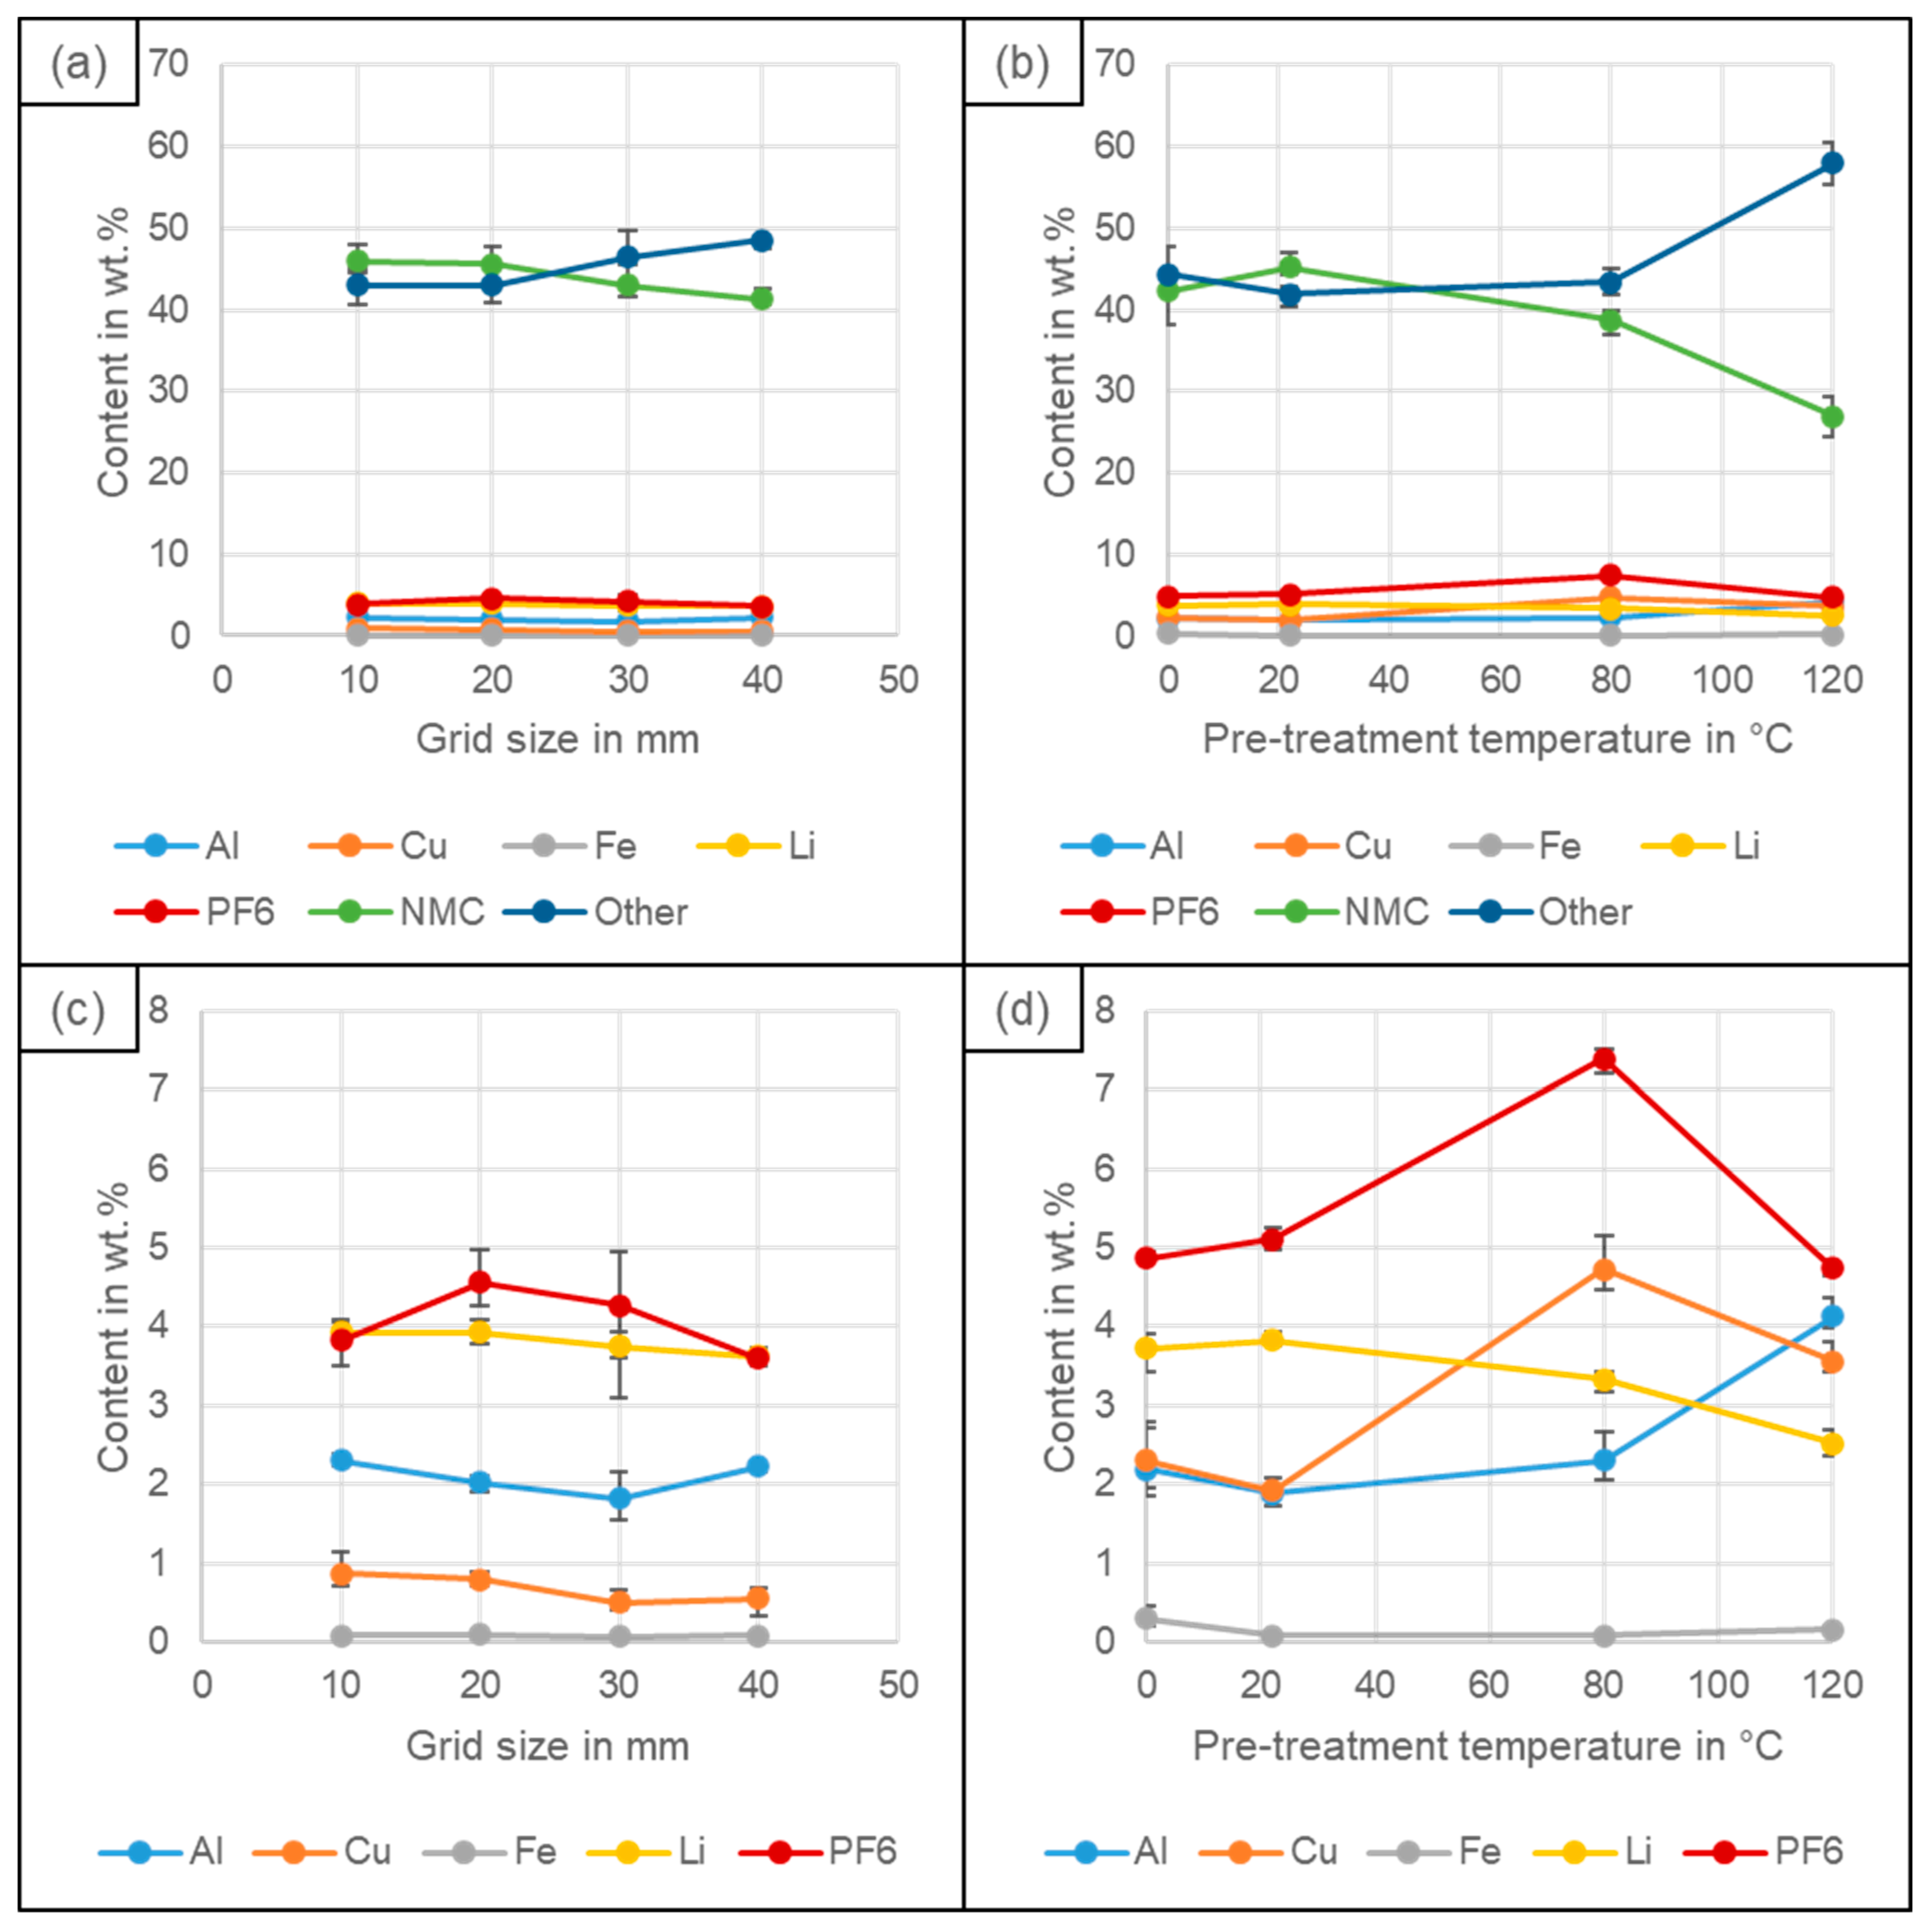
4.4. Elemental Composition

The NMC content, calculated from the measured content of Ni, Mn and Co and by the stochiometric addition of O2, decreases with the increase in the grid size, whereas the content of the undetermined fraction (labelled as “other”), consisting of graphite, binder, comminuted plastics and additives like carbon black, increases, as it can be seen in Figure 6a. This corresponds to the findings of Lyon et al. [10], who also observed an increase in positive electrode decoating for smaller grid sizes. The explanation for this is the higher adhesive tensile strength of the positive electrode coating in comparison to that of the negative electrode coating [8]. The negative electrode, whose graphite coating makes up most of the “other” fraction, becomes, due to the lower strength, decoated quite considerably using the 40 mm grid. Therefore, with the decrease in the grid size, more positive electrode coating than negative electrode coating becomes additionally transferred to the black mass. For the different pre-treatment temperatures (Figure 6b), the NMC content decreases with the increase in the temperature, which can again be explained by the adhesive tensile strength. Wuschke [8] observed an increase in strength for both the positive electrode and negative electrode. However, for the negative electrode, the strength did not increase beyond a temperature of 90 °C, which explains why the NMC and the “other” components differ considerably at 120 °C. The increase for the “other” fraction is, therefore, not caused by a better decoating of the negative electrode, but rather by a lower decoating of the positive electrode. There is a small increase in the NMC and decrease in the “other” fraction between no thermal pre-treatment and drying at 22 °C, indicating that there might be a small increase in decoating for the positive electrode by the pre-treatment.
The behaviour of the Li content is similar to that of the NMC content, as most of the Li in the cell is related to the metal oxide and only a low amount to the conductive salt. This is also caused by the discharge of the cells, because the Li-ions become transferred to the positive electrode during discharge. The PF6 content, calculated from the measured P content, shows a slight peak for the crusher grid sizes of 20 and 30 mm, as it can be seen in Figure 6c. The reason for this is unknown. However, as the variation between experiments with the same settings is also quite high, as it can be seen from the error bars, it might just be caused by a variation in the distribution of the conductive salt inside the cell. For the different thermal pre-treatments (Figure 6d), there is a peak at 80 °C that cannot be explained as well. For 120 °C, the values are similar to those for 22 °C and no thermal pre-treatment, which indicates that no LiPF6 became decomposed by the high temperature and no P was lost as POF3 or PF5 in the gas phase [41]. However, a decomposition cannot be completely excluded, if it is similar for all temperatures, as it would not be visible from the graph. In conclusion, there are no discernible influences of the crusher grid sizes and the pre-treatment temperatures on the PF6 content and, therefore, on the conductive salt content in the black mass.
The content of Al and Cu impurities is influenced by the crusher grid size and the thermal pre-treatment. The concentration of both metals decreases slightly with the increase in the grid size apart for the grid size of 40 mm, which shows an increase in Al content, so that in sum, the impurity content is relatively stable, as described in Section 4.3. For the different thermal pre-treatment conditions, the content of Cu increases already at 80 °C, whereas the Al content increases only for 120 °C. The increase is most likely caused by a decrease in the total amount of black mass and not because of a higher comminution of the foils, as already described in Section 4.3. The black mass of the experiments with different pre-treatment temperatures shows a Cu content of more than twice as high as the black mass from the experiments using different grid sizes. The reason for this comes from an additional effect, which is the discharge method. Overdischarging into pole reversal causes the plating of Cu on the coating of the positive electrode and, therefore, Cu ends up in the black mass [38]. It is expected that the influence of the grid size and the pre-treatment temperature on the cells is the same for both discharge types, and it is therefore not absolutely necessary to investigate the different grid sizes with pole reversed cells. The recovery of Cu in the black mass ranges from 5.1% for a grid size of 10 mm to 2.4% at a grid size of 40 mm. For the black mass of the cells overdischarged into pole reversal, the values lie in the range of 7.2–22.6%. To achieve the recovery rate of 95% required by the EU legislation [3], it will therefore be necessary for the 10 mm grid size and for the pole reversed cells to reclaim the Cu hydrometallurgically from the black mass. However, a hydrometallurgical removal of Cu can lead to a removal of Co and Ni as well, which then would be lost [30]. Therefore, larger grid sizes should be applied to keep the Cu content as low as possible. The Fe content stays relative constant, but its value is low as there is only a low amount of Fe in the Al casing [8] and, in addition, Fe originates only from the processing machines. The ratio between the impurities and the NMC content is, for all settings, rather high compared to the required impurity limits for positive electrode materials and precursors (Section 2.4). It will therefore be necessary to remove them from the black mass in further processes, regardless of which settings are applied.
To evaluate and to define the cut size in the sieving of the black mass, Figure 7 and Figure 8 show the content in relation to the particle size fraction of the black mass. Table 2 shows the mass share of the size fractions in the black mass to be able to better evaluate the values of Figure 7 and Figure 8. For the different grid sizes, the distribution is quite similar, as it could already be seen in Figure 3a. For the different pre-treatment temperatures, the black mass of the cell dried at 22 °C shows a higher content of the coarse fractions (315–500 µm and 500–1000 µm) and a lower content of the fine fraction (0–315 µm), whereas the sample dried at 120 °C has the lowest 315–500 µm content. The size fraction of 0–315 µm has the highest share (43.6–52.5%) and, therefore, the highest influence on the composition of the total black mass (0–1000 µm). From Figure 7a and Figure 8a, it can be seen that the NMC content is the highest in the coarse fraction of 500–1000 µm and becomes lower with the decrease in the particle size. The “other” fraction, and therefore the graphite, behave contrarily (Figure 7b and Figure 8b). In this case, the highest content is in the smallest fraction of 0–315 µm. The reason is the different binder; the binding is much stronger for the positive electrode coating compared to the negative electrode coating [8] and, therefore, coarser particles are produced from the positive electrode. In relation to the grid sizes and the drying temperatures, all size fractions behave similarly. The lithium content in the different particle size fractions (Figure 7c and Figure 8c) correlates again to the NMC. The conductive salt content, indicated by PF6, is similar for the different size fractions for the experiments with the different grid sizes, as it can be seen in Figure 7d. The peak at 20 and 30 mm in the total black mass is not visible in the individual size fractions; there is rather a peak for the fraction of 315–500 µm for the 30 mm grid size, whereas for the 20 mm grid size, all size classes accumulated at the peak in the total black mass. For the different thermal pre-treatments (Figure 8d), there is a more apparent deviation: the content is higher in the smallest size fraction than in the coarsest fraction. The peak that was visible for the total black mass at 80 °C was caused by the finest size fraction, and the reason why the conductive salt accumulated here is unknown.
To a certain extent, Al and Cu behave contrarily to each other. The highest content of Al can be found in the fine fraction of 0–315 µm (Figure 7e), whereas for Cu, the highest content is in the coarse fraction (Figure 7f). The Al content in the fine fraction is partially caused by the Al2O3 coating of the graphite of the negative electrode, which ends up in the black mass together with the decoated graphite. The Al2O3 coating on the graphite in the black mass was visualized by SEM-EDX, as shown in Figure 9. The Cu content, on the other hand, is only caused by the crushed Cu foil from the negative electrode, from which small pieces end up mostly in the coarse fraction of 500–1000 µm. The overall Al content was more than twice as high as the Cu content, whereas the content in the coarse fraction, caused by crushed foils, was similar for both metals. In the literature, the Cu content is usually higher than the Al content, e.g., [18,20], as the cells investigated most likely do not have an Al2O3 coating on the negative electrode layer. However, cells with Al2O3-coated negative electrode are commercially available [42] and can therefore end up in the recycling process together with cells with no Al2O3 coating. Based on the assumption of a 2.5% share of Al in the negative electrode coating and the simplified assumption that all “other” content is made of negative electrode coating, the Al from the Al2O3 makes up around 50% of the Al content in the black mass. However, it should be investigated further how the relation of Al to Cu and the distribution of the Al content over the particle size is different for cells without an Al2O3 coating.
The Al content in the individual size fractions follows the trend of the Al content in the total black mass over the different grid sizes, whereas the Cu content in the size fractions of 0–315 µm and 315–500 µm is relatively similar between the different grid sizes and only the content in the coarse fraction decreases with the increase in grid size. A smaller grid size does therefore not cause a further comminution of the fine Cu pieces, but only generates an increase in the number of Cu foil pieces entering to the black mass.
For the different thermal pre-treatments, the Al content (Figure 8e) in the coarser fraction increases a bit more with the increase in the temperature, so that, for 120 °C, the Al content in the coarse fraction is higher than that in the fine fraction. Due to the poorer decoating of the negative electrode, less Al2O3 ends up in the black mass and therefore in the fine fraction. The Cu content (Figure 8f) shows a decrease at 120 °C for the fractions of 0–315 µm and 315–500 µm, whereas the content in the fraction of 500–1000 µm increases. The higher content of Al and Cu in the coarse fraction could be caused by the stronger binding of the coating due to the increased adhesive tensile strength, leading either to a lower comminution of the foil pieces or to a larger size of the foil coating compound.

5. Conclusions

The crusher grid size does not affect the particle size distribution of the black mass. However, it does change the amount of black mass created and the recovery of the coating and the conductive salt in the black mass, while the overall content of impurities (Al, Cu and Fe) remains similar. Only the relation between Al and Cu is changed with the increase in the share of Al and with the increase in the grid size. Therefore, from the black mass point of view, it is recommended to use the finest grid size to achieve the highest recovery of 75% with an impurity content of 3.3%, even though it has a slightly higher Cu content, which is more difficult to remove hydrometallurgically than Al. To achieve the required limits for impurities in positive electrode materials and precursors, both Al and Cu need to be removed from the black mass in further processes.
A high pre-treatment temperature has a negative effect on the amount of black mass created, the recovery of the coating and the conductive salt as well as on the impurity content. To achieve a high recovery and to limit the amount of impurities, a thermal treatment should either be conducted at low temperatures or after comminution.
A smaller cut size, i.e., 315 or 500 µm, instead of 1000 µm, does not provide an advantage, as it does not decrease the impurity content, but rather the coating recovery. For this particular cell, the Al content is mostly in the fine fraction, as in this case, in addition to the crushed foil pieces, it derives from the Al2O3 coating of the negative electrode. For the other cells that do not have an Al2O3 coating and where the Al impurities are caused mostly by the positive electrode current collector foil, a smaller cut size might be feasible. This needs to be investigated further with a different cell type that does not have an Al2O3 coating of the negative electrode.
The recovery of Co and Ni could not be calculated, as their share in the positive electrode coating is unknown. However, as with optimum settings, only 75% of the overall coating could be recovered and the decoating of the positive electrode is poorer than that of the negative electrode, it can be concluded that the EU requirement of 95% element-specific recovery rate cannot be achieved and that it is therefore necessary to process the fraction of >1000 µm further to liberate the remaining coating. The Cu content in the black mass for the grid sizes of 20–40 mm is sufficiently low, so that the 95% Cu recovery requirement could be achieved by recycling only the Cu from the fraction of >1000 µm if this can be performed without major losses. For the 10 mm grid, already 5.1% of Cu ends up in the black mass; therefore, Cu needs to be reclaimed hydrometallurgically or a smaller black cut size needs to be chosen. Cu recovery is furthermore influenced by the discharging process, since pole reversal leads to a higher Cu content in the black mass.

Author Contributions

C.W. and D.M.W. developed the idea and the content of the report. C.W., D.M.W. and A.K. conducted the experiments. C.W. analysed the resulting data and results, and wrote the article. U.A.P. and A.K. revised the article and improved both the presentation of the results and the structure of the sections. Everything was conducted the supervision of U.A.P. All authors have read and agreed to the published version of the manuscript.

Funding

This research was funded by the Federal Ministry for Education and Research (BMBF), as well as the Projektträger Jülich (PTJ), with the projects DIGISORT (Digitalisation of mechanical sorting processes in mechanical battery recycling) 03XP0337 and LOWVOLMON (Monitoring of low-volatile electrolytes in the mechanical recycling process chain) 03XP0354 within the competence cluster for battery recycling (greenBatt) and with the project InnoRec (Innovative recycling processes for new lithium cell generations) 03XP0246C of the ProZell cluster.

Data Availability Statement

The data presented in this study are openly available in OpARA at https://doi.org/10.25532/OPARA-228 (accessed on 12 September 2023) [37].

Acknowledgments

The authors would like to thank BMW AG for providing the batteries, the Institute of Chemical Technology for providing the Mars6, the project DiRectION from the greenBatt cluster for the scheme of Figure 1 and Anna Vanderbruggen of the Helmholtz Institute Freiberg for the SEM-EDX image in Figure 9. The authors would also like to thank Annett Kästner for conducting the particle size distribution analysis and Yvonne Volkmar for conducting the ICP-OES analysis as well as the technical and scientific staff of the Institute of Mechanical Process Engineering and Mineral Processing.

Conflicts of Interest

The authors declare no conflict of interest.

References

  1. Michaelis, S.; Rahimzei, E.; Kampker, A.; Heimer, H.; Offermanns, C.; Locke, M.; Löbberding, H.; Wennemar, S.; Thielmann, A.; Hettesheimer, T.; et al. Roadmap Batterie-Produktionsmittel 2030; VDMA: Frankfurt am Main, Germany, 2020. [Google Scholar]
  2. Neef, C.; Schmaltz, T.; Thielmann, A. Recycling von Lithium-Ionen Batterien: Chancen und Herausforderungen für den Maschinen- und Anlagenbau; Fraunhofer-Institut für System- und Innovationsforschung ISI: Karlsruhe, Germany, 2021. [Google Scholar]
  3. Council of the European Union. Proposal for a Regulation of the European Parliament and of the Council Concerning Batteries and Waste Batteries, Repealing Directive 2006/66/EC and Amending Regulation (EU) No 2019/1020—Letter to the Chair of the European Parliament Committee on the Environment; Public Health and Food Safety (ENVI): Brussels, Belgium, 2023. [Google Scholar]
  4. Graf, C. Cathode materials for lithium-ion batteries. In Lithium-Ion Batteries: Basics and Applications; Korthauer, R., Ed.; Springer: Berlin/Heidelberg, Germany, 2018; pp. 29–41. [Google Scholar]
  5. Doose, S.; Mayer, J.K.; Michalowski, P.; Kwade, A. Challenges in Ecofriendly Battery Recycling and Closed Material Cycles: A Perspective on Future Lithium Battery Generations. Metals 2021, 11, 291. [Google Scholar] [CrossRef]
  6. Woehrle, T. Lithium-ion cell. In Lithium-Ion Batteries: Basics and Applications; Korthauer, R., Ed.; Springer: Berlin/Heidelberg, Germany, 2018; pp. 101–112. [Google Scholar]
  7. Hauck, D.; Kurrat, M. Overdischarging Lithium-Ion Batteries. In Recycling of Lithium-Ion Batteries: The LithoRec Way; Kwade, A., Diekmann, J., Eds.; Springer: Berlin/Heidelberg, Germany, 2018; pp. 53–81. [Google Scholar]
  8. Wuschke, L. Mechanische Aufbereitung von Lithium-Ionen-Batteriezellen; TU Bergakademie Freiberg: Freiberg, Germany, 2018. [Google Scholar]
  9. Werner, D.M.; Mütze, T.; Peuker, U.A. Influence of Pretreatment Strategy on the Crushing of Spent Lithium-Ion Batteries. Metals 2022, 12, 1839. [Google Scholar] [CrossRef]
  10. Lyon, T.; Mütze, T.; Peuker, U.A. Decoating of Electrode Foils from EOL Lithium-Ion Batteries by Electrohydraulic Fragmentation. Metals 2022, 12, 209. [Google Scholar] [CrossRef]
  11. Krüger, S.; Hanisch, C.; Kwade, A.; Winter, M.; Nowak, S. Effect of Impurities Caused by a Recycling Process on the Electrochemical Performance of Li[Ni0.33Co0.33Mn0.33]O2. J. Electroanal. Chem. 2014, 726, 91–96. [Google Scholar] [CrossRef]
  12. Windisch-Kern, S.; Gerold, E.; Nigl, T.; Jandric, A.; Altendorfer, M.; Rutrecht, B.; Scherhaufer, S.; Raupenstrauch, H.; Pomberger, R.; Antrekowitsch, H.; et al. Recycling chains for lithium-ion batteries: A critical examination of current challenges, opportunities and process dependencies. Waste Manag. 2022, 138, 125–139. [Google Scholar] [CrossRef]
  13. Vanderbruggen, A.; Sygusch, J.; Rudolph, M.; Serna-Guerrero, R. A contribution to understanding the flotation behavior of lithium metal oxides and spheroidized graphite for lithium-ion battery recycling. Colloids Surf. A Physicochem. Eng. Asp. 2021, 626, 127111. [Google Scholar] [CrossRef]
  14. Vanderbruggen, A.; Hayagan, N.; Bachmann, K.; Ferreira, A.; Werner, D.; Horn, D.; Peuker, U.A.; Serna-Guerrero, R.; Rudolph, M. Lithium-Ion Battery Recycling─Influence of Recycling Processes on Component Liberation and Flotation Separation Efficiency. ACS ES&T Eng. 2022, 2, 2130–2141. [Google Scholar] [CrossRef]
  15. Salces, A.M.; Bremerstein, I.; Rudolph, M.; Vanderbruggen, A. Joint recovery of graphite and lithium metal oxides from spent lithium-ion batteries using froth flotation and investigation on process water re-use. Miner. Eng. 2022, 184, 107670. [Google Scholar] [CrossRef]
  16. Zhan, R.; Oldenburg, Z.; Pan, L. Recovery of active cathode materials from lithium-ion batteries using froth flotation. Sustain. Mater. Technol. 2018, 17, e00062. [Google Scholar] [CrossRef]
  17. Ruismäki, R.; Rinne, T.; Dancak, A.; Taskinen, P.; Serna-Guerrero, R.; Jokilaakso, A. Integrating Flotation and Pyrometallurgy for Recovering Graphite and Valuable Metals from Battery Scrap. Metals 2020, 10, 680. [Google Scholar] [CrossRef]
  18. Porvali, A.; Aaltonen, M.; Ojanen, S.; Velazquez-Martinez, O.; Eronen, E.; Liu, F.; Wilson, B.P.; Serna-Guerrero, R.; Lundström, M. Mechanical and hydrometallurgical processes in HCl media for the recycling of valuable metals from Li-ion battery waste. Resour. Conserv. Recycl. 2019, 142, 257–266. [Google Scholar] [CrossRef]
  19. Peng, C.; Hamuyuni, J.; Wilson, B.P.; Lundström, M. Selective reductive leaching of cobalt and lithium from industrially crushed waste Li-ion batteries in sulfuric acid system. Waste Manag. 2018, 76, 582–590. [Google Scholar] [CrossRef]
  20. Vassura, I.; Morselli, L.; Bernadi, E.; Passarini, F. Chemical characterisation of spent rechargeable batteries. Waste Manag. 2009, 29, 2332–2335. [Google Scholar] [CrossRef] [PubMed]
  21. Wang, X.; Gaustad, G.; Babbitt, C.W. Targeting high value metals in lithium-ion battery recycling via shredding and size-based separation. Waste Manag. 2016, 51, 204–213. [Google Scholar] [CrossRef] [PubMed]
  22. Widijatmoko, S.D.; Fu, G.; Wang, Z.; Hall, P. Selective liberation in dry milled spent lithium-ion batteries. Sustain. Mater. Technol. 2019, 23, e00134. [Google Scholar] [CrossRef]
  23. Zhang, T.; He, Y.; Wang, F.; Ge, L.; Zhu, X.; Li, H. Chemical and process mineralogical characterizations of spent lithium-ion batteries: An approach by multi-analytical techniques. Waste Manag. 2014, 34, 1051–1058. [Google Scholar] [CrossRef]
  24. Schubert, H. Aufbereitung Fester Stoffe Band II: Sortierprozesse; Deutscher Verlag für Grundstoffindustrie: Stuttgart, Germany, 1996; Volume 4. [Google Scholar]
  25. Yu, J.; He, Y.; Ge, Z.; Li, H.; Xie, W.; Wang, S. A promising physical method for recovery of LiCoO2 and graphite from spent lithium-ion batteries: Grinding flotation. Sep. Purif. Technol. 2018, 190, 45–52. [Google Scholar] [CrossRef]
  26. Chernyaev, A.; Partinen, J.; Klemettinen, L.; Wilson, B.P.; Jokilaakso, A.; Lundström, M. The efficiency of scrap Cu and Al current collector materials as reductants in LIB waste leaching. Hydrometallurgy 2021, 203, 105608. [Google Scholar] [CrossRef]
  27. Sa, Q.; Heelan, J.A.; Lu, Y.; Apelian, D.; Wang, Y. Copper Impurity Effects on LiNi1/3Mn1/3Co1/3O2 Cathode Material. ACS Appl. Mater. Interfaces 2015, 7, 20585–20590. [Google Scholar] [CrossRef]
  28. Virolainen, S.; Wesselborg, T.; Kaukinen, A.; Sainio, T. Removal of iron, aluminium, manganese and copper from leach solutions of lithium-ion battery waste using ion exchange. Hydrometallurgy 2021, 202, 105602. [Google Scholar] [CrossRef]
  29. Chen, L.; Tang, X.; Zhang, Y.; Li, L.; Zeng, Z.; Zhang, Y. Process for the recovery of cobalt oxalate from spent lithium-ion batteries. Hydrometallurgy 2011, 108, 80–86. [Google Scholar] [CrossRef]
  30. Or, T.; Gourley, S.W.D.; Kaliyappan, K.; Yu, A.; Chen, Z. Recycling of mixed cathode lithium-ion batteries for electric vehicles: Current status and future outlook. Carbon Energy 2020, 2, 6–43. [Google Scholar] [CrossRef]
  31. Peng, C.; Lahtinen, K.; Medina, E.; Kauranen, P.; Karppinen, M.; Kallio, T.; Wilson, B.P.; Lundström, M. Role of impurity copper in Li-ion battery recycling to LiCoO2 cathode materials. J. Power Sources 2020, 450, 227630. [Google Scholar] [CrossRef]
  32. Ardia, P.; Stallone, S.; Cericola, D. A quantification method for Fe based particle contaminants in high purity materials for lithium-ion batteries. Talanta 2021, 224, 121827. [Google Scholar] [CrossRef]
  33. Nasser, O.A.; Petranikova, M. Review of Achieved Purities after Li-ion Batteries Hydrometallurgical Treatment and Impurities Effects on the Cathode Performance. Batteries 2021, 7, 60. [Google Scholar] [CrossRef]
  34. Zhang, R.; Zheng, Y.; Yao, Z.; Vanaphuti, P.; Ma, X.; Bong, S.; Chen, M.; Liu, Y.; Cheng, F.; Yang, Z.; et al. Systematic Study of Al Impurity for NCM622 Cathode Materials. ACS Sustain. Chem. Eng. 2020, 8, 9875–9884. [Google Scholar] [CrossRef]
  35. Zhang, R.; Meng, Z.; Ma, X.; Chen, M.; Chen, B.; Zheng, Y.; Yao, Z.; Vanaphuti, P.; Bong, S.; Yang, Z.; et al. Understanding fundamental effects of Cu impurity in different forms for recovered LiNi0.6Co0.2Mn0.2O2 cathode materials. Nano Energy 2020, 78, 105214. [Google Scholar] [CrossRef]
  36. Park, S.; Kim, D.; Ku, H.; Jo, M.; Kim, S.; Song, J.; Yu, J.; Kwon, K. The effect of Fe as an impurity element for sustainable resynthesis of Li[Ni1/3Co1/3Mn1/3]O2 cathode material from spent lithium-ion batteries. Electrochim. Acta 2018, 296, 814–822. [Google Scholar] [CrossRef]
  37. Wilke, C.; Kaas, A.; Werner, D.; Peuker, U.A. Supplementary information to the publication “Influence of the crusher settings and a thermal pre-treatment on the properties of the fine fraction (black mass) from mechanical Lithium-Ion Battery recycling”. OpARA 2023. [Google Scholar] [CrossRef]
  38. Kaas, A.; Wilke, C.; Vanderbruggen, A.; Peuker, U.A. Influence of different discharge levels on the mechanical recycling efficiency of lithium-ion batteries. Waste Manag. 2023, 172, 1–10. [Google Scholar] [CrossRef]
  39. Wurm, C.; Öttinger, O.; Wittkämper, S.; Zauter, R.; Vuorilehto, K. Anode materials for lithium-ion batteries. In Lithium-Ion Batteries: Basics and Applications; Korthauer, R., Ed.; Springer: Berlin/Heidelberg, Germany, 2018; pp. 43–58. [Google Scholar]
  40. Rothermel, S.; Evertz, M.; Kasnatscheew, J.; Qi, X.; Grützke, M.; Winter, M.; Nowak, S. Graphite Recycling from Spent Lithium-Ion Batteries. ChemSusChem 2016, 9, 3473–3484. [Google Scholar] [CrossRef] [PubMed]
  41. Campion, C.L.; Li, W.; Lucht, B.L. Thermal Decomposition of LiPF6-Based Electrolytes for Lithium-Ion Batteries. J. Electrochem. Soc. 2005, 152, A2327–A2334. [Google Scholar] [CrossRef]
  42. Friesen, A.; Hildebrand, S.; Horsthemke, F.; Börner, M.; Klöpsch, R.; Niehoff, P.; Schappacher, F.M.; Winter, M. Al2O3 coating on anode surface in lithium ion batteries: Impact on low temperature cycling and safety behavior. J. Power Sources 2017, 363, 70–77. [Google Scholar] [CrossRef]
Figure 1. Process scheme with (a) different crusher grid sizes and (b) different pre-treatment temperatures.
Batteries 09 00514 g001
Figure 2. Yield of the black mass (<1000 µm) in relation to the original cell mass based on (a) different grid sizes (10–40 mm) and drying temperatures after crushing (22/80 °C) and (b) different pre-treatment temperatures (none–120 °C). The data points at no °C represent the non-thermal-pre-treated cells. The results are the average values of three experiments; the error bars show the minimum and maximum values.
Batteries 09 00514 g002
Figure 3. Particle size distributions obtained by sieve analysis for (a) different grid sizes (10–40 mm) and drying temperatures after crushing (22/80 °C) and (b) different pre-treatment temperatures (none–120 °C); obtained by laser diffraction for (c) different grid sizes (10–40 mm) and drying temperatures after crushing (22/80 °C) and (d) different pre-treatment temperatures (none–120 °C). The data points at no °C represent the non-thermal-pre-treated cells. The results are the average values of three experiments, and the error bars show the minimum and maximum values.
Batteries 09 00514 g003
Figure 4. Laser diffraction analysis of the LIB electrode coating raw materials before electrode production.
Batteries 09 00514 g004
Figure 5. Recovery of the coating and conductive salt vs. Al, Cu and Fe impurities for (a) different grid sizes (10–40 mm) and (b) different pre-treatment temperatures (none–120 °C). The data points at no °C represent the non-thermal-pre-treated cells. The results are the average values of three experiments, and the error bars show the minimum and maximum values.
Batteries 09 00514 g005
Figure 6. Composition of the black masses of 0–1000 µm for (a) different grid sizes (10–40 mm) and (b) different pre-treatment temperatures (none–120 °C). (c) displays a close-up of the bottom 8% of (a,d) of the bottom 8% of (b). The data points at 0 °C represent the non-pre-treated cells. The results are the average values of three experiments, and the error bars show the minimum and maximum values.
Batteries 09 00514 g006
Figure 7. Content in the black mass particle size fractions depending on crusher grid size for (a) NMC, (b) “other”, (c) Li, (d) PF6, (e) Al and (f) Cu. The results are the average values of three experiments, and the error bars show the minimum and maximum values. The datasets of 0–1000 µm correspond to the sets plotted in Figure 6.
Batteries 09 00514 g007
Figure 8. Content in the black mass particle size fractions depending on pre-treatment temperature for (a) NMC, (b) “other”, (c) Li, (d) PF6, (e) Al and (f) Cu. The data points at 0 °C represent the non-pre-treated cells. The results are the average values of three experiments, and the error bars show the minimum and maximum values. The datasets of 0–1000 µm correspond to the sets plotted in Figure 6.
Batteries 09 00514 g008
Figure 9. SEM-EDX image of a graphite particle with Al2O3 coating.
Batteries 09 00514 g009
Table 1. Overview of the black mass compositions from the literature for different size fractions. Values indicated by “≈” or by “<” were taken from figures; exact values were taken from tables or the text. The positive electrode coating for 1−6 is defined as the sum of the metals Ni, Mn and Co, whereby not all black masses contained Ni and Mn. The authors of 7 [14] calculated a lithium metal oxide, including Li and O2. 1 [17], 2 [18], 3 [19], 4 [20], 5 [22], 6 [23], 7 [14].
Black Mass Size (Fraction) in µm
0–38/
0–63
0–200/
0–250
0–10000–2000200–400/
250–500
400–1250/
500–1000
1000–2000/
1000–3000
ConstituentContent in %
Positive electrode coating36.5 5
≈40 7
31.4–34.3 6
≈38 2
≈40–45 1
34.1 2
37.9 4
≈48 7
28.1 3≈40 1
≈40 2
6.0 6
4.3 6
≈35 1
≈30 2
≈60 7
4.2 6
33.5 4
Li ≈4 23.2 4
3.6 2
3.7 3≈4 2≈4 22.7 4
P 0.5–0.7 6 0.5 60.4 60.4 6
Graphite≈60 7 ≈50 7 ≈35 7
Al1.6 5<1 1
<1 2
2–2.4 6
0.5 4
2.2 2
2.8 3≈2 1
≈2 2
10.8 6
≈7 2
≈11 1
22.3 6
2.6 4
29.8 6
Cu0.8 5<1 1
<1 2
0.6–1.4 6
1.9 4
3.0 2
6.2 3≈2 1
≈3 2
50.2 6
≈9 1
≈11 2
48.3 6
12 4
30.6 6
Fe 0.1 6
<1 1
<1 2
0.6 4
0.7 2
0.7 30.3 6
<1 1
<1 2
0.3 6
<1 1
≈1 2
0.1 4
0.3 6
Table 2. Mass share of the size fractions in the black mass based on different grid sizes (top) and pre-treatment temperatures (bottom). The results are the average values of three experiments.
Black Mass Size Fraction in µm
0–315315–500500–1000
Mass Share in %
Grid size in mm1043.620.535.9
2045.619.634.9
3045.218.836.0
4045.718.835.5
Pre-treatment temperature in °Cno51.218.230.7
2244.020.136.0
8049.118.132.8
12052.515.532.0
Disclaimer/Publisher’s Note: The statements, opinions and data contained in all publications are solely those of the individual author(s) and contributor(s) and not of MDPI and/or the editor(s). MDPI and/or the editor(s) disclaim responsibility for any injury to people or property resulting from any ideas, methods, instructions or products referred to in the content.

