Abstract
The heat dissipation capability of the battery thermal management system (BTMS) is a prerequisite for the safe and normal work of the battery. Currently, many researchers have designed and studied the structure of BTMS to better control the battery temperature in a specific range and to obtain better temperature uniformity. This allows the battery to work safely and efficiently while extending its life. As a result, BTMS has been a hot topic of research. This work investigates the impact of pin-fins on the heat dissipation capability of the BTMS using the computational fluid dynamics (CFD) approach, designs several BTMS schemes with different pin-fin structures, simulates all schemes for fluid-structure interaction, and examines the impact of different distribution, number, and shape of pin-fins on heat dissipation capability and pressure drop. Analyzing the effect of cooling plates with different pin-fins on the thermal capability of the BTMS can provide a basis for the structural design of this BTMS with pin-fin cooling plates. The findings demonstrate that the distribution and quantity of pin-fin shapes might affect heat dissipation. The square-section pin-fins offer better heat dissipation than other pin-fin shapes. As the pin-fins number increases, the maximum battery temperature decreases, but the pressure drop increases. It has been observed that uniform pin-fin distribution has a superior heat dissipation effect than other pin-fin distribution schemes. In summary, the cooling plate with a uniform distribution of 3 × 6 square section pin-fins has better heat dissipation capability and less power consumption, with a maximum battery temperature of 306.19 K, an average temperature of 304.20 K, a temperature difference of 5.18 K, and a pressure drop of 99.29 Pa.
1. Introduction
Electric vehicles (EVs) have the advantages of being more eco-friendly, comfortable, and efficient compared with fuel vehicles. As a result, they have received a lot of attention from consumers [1]. The power battery is the core part of the EVs and is the energy supply unit. Lithium-ion batteries (LIBs) are currently a popular choice for EV power units due to their high voltage, high energy density, long life, green and clean nature, low self-discharge, fast charging, and wide working temperature range [2]. However, the LIBs produce a lot of heat as they are being charged and discharged. If the heat is not released into the environment promptly, the batteries could fail and experience thermal runaway, which would gravely compromise safety [3]. The safety of LIBs has become an important issue for further practical large-scale applications [4]. The battery thermal management system (BTMS) helps to limit the harmful impact of temperature on the battery pack. It increases user safety, extends battery life, and ensures stable battery pack temperatures [5]. Currently, BTMS can be mainly divided into air cooling, liquid cooling, and phase change material (PCM) cooling [6,7,8,9,10]. Air cooling offers the advantages of simple construction, low cost, and no leakage. However, the low thermal capacity of air and its low thermal conductivity result in a poor average temperature effect between cells and susceptibility to external air temperature. Furthermore, air cooling requires a large amount of air, making the system larger in volume [11]. PCM has low thermal conductivity and is prone to thermal saturation [12,13]. Liquid cooling offers higher specific heat capacity, faster mass flow, and better temperature uniformity compared with air cooling. Liquid cooling is also not as complex and expensive as PCM [14]. As a result, liquid cooling is currently used extensively in EVs [15,16,17].
The liquid cooling BTMS is currently being extensively studied by researchers due to its advantages of desirable cooling. Such as, Yamanaka et al. [18] proposed a framework for modeling an equivalent circuit containing a liquid cooling system for simulating a multi-physics field scenario for a LIB pack. The battery heat generation and heat transfer are reproduced by simulating the LIB pack liquid cooling experiments. The results show that this model has a major advantage in terms of computational cost. Xu et al. [19] studied the effect of the type, discharge rate, inlet temperature, and flow rate of the proposed F2-type liquid cooling system and investigated the effect of the arrangement of the cooling plate on the temperature consistency, maximum temperature, cooling efficiency factor and overall heat transfer capability of the cooling system. The study shows that the cooling system outperforms other liquid cooling systems in terms of cooling efficiency and overall heat transfer capability. The best arrangement of cooling plates is the M model arrangement. Wang et al. [16] investigated the effect of the cooling method and coolant flow rate on heat dissipation capability. The results showed that by meeting a certain range of flow rates, an increase in coolant flow rate could reduce the maximum battery temperature and improve temperature uniformity. In addition, parallel cooling gives better temperature uniformity than that obtained with serial cooling. Akbarzadeh et al. [20] conducted a comparative study of the heat dissipation capability and power consumption of a liquid-cooling BTMS and an air-cooling BTMS for a battery module. The effects of cooling medium flow and temperature on the temperature of the battery module were analyzed. The results show that the liquid cooling BTMS has a lower temperature and better temperature uniformity for a given power consumption. Jang et al. [15] investigated the heat dissipation capability of three types of BTMS: liquid cooling, A-type heat pipe liquid cooling, and B-type heat pipe liquid cooling. The effects of temperature, liquid mass flow rate, and discharge rate on the heat dissipation capability were analyzed. The results show that B-type heat pipe liquid cooling BTMS has better heat dissipation capability. Most of the above research on liquid cooling BTMS has been on cooling performance, which is closely related to the liquid and the cooling plate.
The cooling plate is one of the important parts of the liquid cooling BTMS, and it has a great influence on the heat dissipation capability of the liquid cooling BTMS. Therefore, it is important to study the cooling plate of the liquid cooling BTMS to improve the heat dissipation capability. Currently, BTMS based on a channel or microchannel cooling plate is the most widely used, which can significantly reduce the battery temperature while ensuring good temperature uniformity and safety [21]. The serpentine microchannel cooling plate is a typical microchannel structured cooling plate with a simple structure and superior heat dissipation capability [22,23]. Mahmoud et al. [24] combined the addition of grooves in the side walls of the serpentine channel and the arrangement of pin fins in the center of the channel to improve the hydrodynamic characteristics of the serpentine microchannel. The results show that the serpentine microchannel radiator has a Nussle number of approximately 33.85 and a pressure drop of approximately 14,190 Pa. Tian et al. [25] verified and analyzed their proposed geometric modeling method for radiators with conjugate heat transfer characteristics using two serpentine cooling plates as examples. The results show that the corresponding control coefficients are adjusted to optimize the design and thus reliably obtain cooling plates with high performance. Ibrahim et al. [26] studied an indirect liquid cooling system with a lightweight serpentine wave channel structure for cylindrical LIB modules. Parameters such as the maximum temperature difference and the maximum temperature of the LIB pack under this liquid cooling system were also analyzed. The results show that the cooling system can maintain the normal temperature of the LIB module under most operating conditions. Sheng et al. [27] designed a serpentine channel liquid cooling plate with two inlets and two outlets. The influence of the channel width, flow rate, and flow direction of this cooling plate on the temperature distribution of the battery under different working conditions was analyzed. The results show that the factors that have a greater influence on the power consumption ratio and temperature distribution of the cooling plate are the position of the inlet and outlet and the flow direction. The cooling plate channel width has a greater influence on the power consumption ratio and battery temperature distribution but a weaker effect on the maximum battery temperature rise. The serpentine cooling plate has a simple structure and superior heat dissipation capability. However, owing to its structural characteristics, it increases the pressure loss of the liquid system and causes a large pressure drop.
The pressure drop of the parallel microchannel cooling plate is smaller than that of the serpentine microchannel cooling plate. It can better balance the heat dissipation capability and power consumption [28]. Monika et al. [29] proposed a parallel rectangular microchannel cooling plate. Then a numerical model with variable channel width, number of channels, ambient temperature, and liquid flow rate was analyzed according to thermodynamics. The analysis led to a solution with a more balanced pressure drop and heat transfer. Shang et al. [30] used a parallel microchannel structure for cooling plates with different contact surfaces. The effects of cooling plate width, inlet temperature, and inlet flow rate on the heat dissipation capability were then revealed through numerical analysis. Jin et al. [31] designed a structure with a diagonal cut through the straight fins of a common straight channel to improve the heat dissipation capability of a parallel straight channel cooling plate. Experiments have shown that the heat transfer coefficient of the small diagonal channel is higher than that of the small straight channel and has better heat dissipation capability.
To reduce time and cost, computational fluid dynamics (CFD) is widely used in BTMS simulation. For example, Li et al. [32] first established a three-dimensional electro-thermal model, then analyzed the heat dissipation and temperature distribution of the battery module, and finally validated the CFD simulation results of the aggregate battery model by considering the ambient temperature. The results of the study provide a feasible solution for optimizing the heat dissipation capability of the battery. Zhang et al. [33] simulated the airflow distribution and temperature of their proposed T-BTMS based on CFD methods. The results showed that a solution with a higher heat dissipation capability of the BTMS was obtained, and the temperature difference and maximum temperature of the BTMS were reduced compared with the original model. From the above studies, it is clear that CFD simulation is a reliable method for rapid BTMS design studies.
To design a BTMS that meets the requirements, it is necessary to understand the heat generation process of the battery. As a result, some scholars have investigated the heat generation of batteries. For example, A novel calorimeter was designed by Hu et al. [34] to measure the total heat generation rate and the two-dimensional heat production rate distribution of batteries. The analysis was also carried out for a pouch battery. The results are that at higher charge and discharge rates, the local heat generation inconsistency increases, and the most heat is generated in the center of the battery, in addition to the fact that cell aging also increases heat generation and inconsistency. In addition, Du et al. [35] developed a novel in-situ meter for visualizing the heat generation distribution in a two-dimensional cross-section inside the battery. It allows the internal two-dimensional temperature field distribution to be observed without damaging the battery. The results indicate that this study can be useful in revealing the internal heat generation mechanism of the battery. The study of the distribution of battery heat generation under charge and discharge can guide the design of BTMS structures. To address the unevenness of battery heat generation, designing the BTMS to enhance the temperature uniformity of the battery can improve the efficiency and lifetime of the battery.
At present, cooling plates with better thermal performance, lighter mass, and lower power consumption are still the goals of researchers. When the battery generates a lot of heat, a large amount of coolant is needed to help dissipate the heat. Otherwise, overheating of the battery may cause potential safety hazards. The serpentine microchannels and parallel microchannels of the cooling plate construction can hardly meet the requirements of passing large quantities of coolant under conditions of limited pump power. To address this problem, Zhao et al. [36] designed a cooling plate with uneven pin-fins to reduce weight, pressure drop, temperature difference, and maximum temperature. This cooling plate structure has more space inside the cavity, allowing more coolant to pass through. They investigated the effect of the size of the circular pin-fins on the heat dissipation capability. However, structural factors such as the shape, number, and distribution of the pin-fins also influence the heat dissipation capability and power consumption of the cooling plate. These cooling plates with pin-fins have certain advantages in terms of heat dissipation capability due to their structural characteristics, but the parameters of their structure may have an impact on the heat dissipation capability. Therefore, to obtain better heat dissipation capability and lower power consumption, it is necessary to analyze the different pin-fin structures of these cooling plates to obtain information on the influence of structural factors such as shape, number, and distribution on heat dissipation capability and power consumption. Based on the comparison results obtained, it is then possible to better optimize the design of the cooling plate structure and obtain better performance. Therefore, in this work, a three-dimensional model is established for different pin-fin numbers, shapes, and distribution schemes of the cooling plate. A comparative analysis of the heat dissipation capability and power consumption of this BTMS is carried out based on the three-dimensional model using CFD simulations. The influence of these three structural factors on the heat dissipation capability and power consumption of the BTMS is obtained.
2. Problem Statement
For LIBs to work safely and properly, LIBs need to be kept within a certain temperature range. Otherwise, the efficiency, life, and safety of the battery will be reduced. The BTMS is designed to keep the battery temperature within a proper temperature range. LIBs generate heat when in use, increasing battery temperature. If heat is not dissipated promptly, the performance and life of the battery will be reduced, and in severe cases, thermal runaway may even cause safety hazards. Therefore, the heat dissipation of LIBs is particularly important. In this work, we analyze the effect of the number, shape, and distribution of the pin-fins on the heat dissipation capability of a liquid cooling plate with pin-fins based on a LIB. This work provides a reference for the structural design of liquid cooling plates with pin-fins.
2.1. Geometric Model
The battery type used in this work to study the dissipation scheme is a TLP80A5E6-50AH rechargeable LIB (The cathode material of the battery is lithium nickel-cobalt-manganate material, and the anode material is graphite). Figure 1 shows its appearance, and its basic parameters are shown in Table 1. In the first step, the basic 3D model of the BTMS is constructed. To ensure better heat dissipation from the battery, the cooling plates and LIBs are staggered. As the thermal of a rectangular battery is studied, the cell in the model is a cube based on the actual size of the cell. To simplify the calculation, the model is established by a staggered arrangement of four cooling plates and three LIBs. Figure 2 shows the geometric model of the water-cooling BTMS.
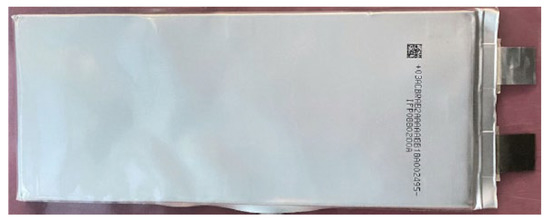
Figure 1.
The picture of TLP80A5E6-50AH LIB.

Table 1.
LIB’s basic parameters.

Figure 2.
The water-cooling BTMS geometric structure.
Figure 3 shows the overall dimension of the cooling plate, which matches the dimension of the cell to be used. The width and length of the cooling plate are the same as those of the objective cell; the height is 4 mm. The inlet and outlet of the cooling plate are arranged diagonally, with a width of 40 mm and a height of 0.75 mm. The channel is arranged symmetrically along the middle surface of the cooling plate, and the wall thickness of the channel is 10 mm. The pin-fins are arranged in the channel, and their height is 0.75 mm [36]. Changes in the shape, number, and distribution of the pin-fins affect fluid velocity and distribution and, therefore, pressure drop and temperature. This work aims to analyze the influence of these three factors on the temperature and pressure drop of the pin-fins to provide a better scheme.
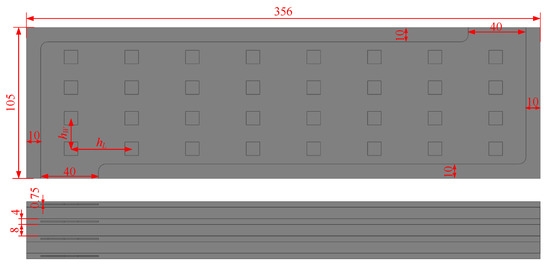
Figure 3.
Cooling plate geometric structure.
2.2. Thermal Model
The charging and discharging process of LIB generates a lot of heat. Calculating the heat generation of LIB is the first step of thermal management. Currently, the Bernardi model is mainly used for the heat production model of LIB charging and discharging [37], and the calculation is as follows:
where qc is the heat production rate of the cell core, I is the discharge current, V is the cell volume, T is the ambient temperature, R is the battery’s internal resistance (1 mΩ), and ∂U/∂T is the entropy coefficient.
The battery cell’s 3D heat transfer model is built based on three assumptions, as shown in Equation (2). The assumptions are as follows: (1) The constituent material media of the cell is homogeneous, and the thermophysical parameters remain stable, independent of temperature. (2) There is no convection heat transfer and radiation heat transfer inside the cell (3) The current density inside the cell is uniform, and the heat generation rate is not different.
where c is the cell’s specific heat capacity, ρ is the single cell’s density, t is the time, T is the battery’s working temperature, λx, λy, λz is the battery’s thermal conductivity in the x, y, z directions, and q is the battery’s heat generation rate per unit volume.
To calculate the heat transfer model, thermal physical parameters ρ, c, λ, and heat generation rate q need to be obtained. The density of the cell can be obtained by calculating the compaction density, which can be expressed as:
where Vn is the volume of each constituent material of the battery and ρn is the density of each constituent material of the battery. The specific heat capacity is the mass-weighted average of the specific heat capacity of various materials that make up the cell:
where mc is the mass of the cell, mn is each material’s mass in the cell and cn is each material’s specific heat capacity in the cell. The cell’s thermal conductivity is obtained by using the equivalent resistance calculation method. The battery’s thermal conductivity along the x, y, and z directions is calculated as follows:
where lx, ly and lz are the thickness of the cell in x, y, and z directions, f, n, and s represent the anode, cathode, and separator of the cell, respectively. The heat generation rate of the battery is difficult to solve in Equation (2), and an accurate heat generation rate is the key to battery temperature field simulation. Currently, most scholars mainly adopt theoretical calculation Equation (1) to calculate the heat generation rate of batteries. The values of thermophysical parameters are shown in Table 2.

Table 2.
Thermophysical parameters of TLP80A5E6-50AH.
Taking the entropy coefficient as 0.0005, the heat generation rate is 23,045 W/m3 under the working condition of a 5C discharge rate. In this work, we use water as the cooling medium, and the cooling plate material is aluminum. At the same time, through the above analysis and calculation, the material parameters of the entire BTMS are listed in Table 3.

Table 3.
Thermophysical properties of the cell, water, and cooling plate materials.
2.3. Research Methodology
Figure 4 shows the research flowchart used in this work. Figure 4 consists mainly of model construction, numerical analysis, CFD simulations, and comparative analysis of the results. Section 1 is the introduction of the research status and the significance of this study. Section 2 is the parameters of the model and a brief introduction to the general structure of the work. In Section 3, the thermal model, grid independence test, and boundary conditions are established on the basis of the CFD method. Section 4 is the comparative analysis of the effect of different factors on the heat dissipation capability and power consumption of pin-fins. Section 5 is the summary of the work in this work and the prospect of future research directions.
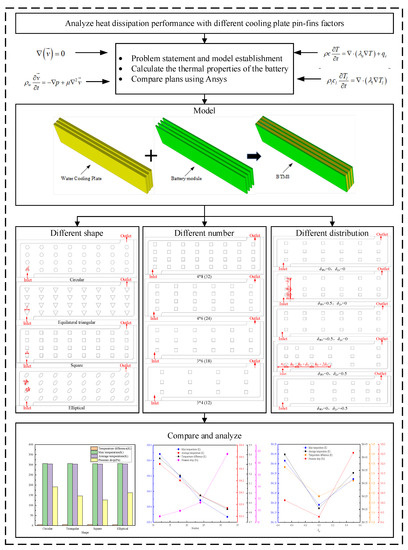
Figure 4.
The research flowchart.
3. Numerical Model
3.1. CFD Method
In this study, the coolant is water. We make the assumption that the fluid is incompressible and that the cooling plate is isotropic and homogeneous. When this assumption is satisfied, the flow process of the fluid satisfies the equations of conservation of energy, conservation of momentum, and conservation of mass [37,38,39]. The battery energy conservation equation is expressed as follows:
where c is the battery’s specific heat capacity, ρ is the battery’s density, T is the ambient temperature, λa is the thermal conductivity, and qc is the heat generation rate of the cell core.
The cooling plate energy conservation equation is:
where cl is the cooling plate’s specific heat capacity, ρl is the cooling plate’s density, λl is the cooling plate’s thermal conductivity, and Tl is the cooling plate’s temperature.
The water energy conservation equation is:
where cw is water’s specific heat capacity, ρw is water’s density, Tw is water’s temperature, v is water’s velocity, and λw is water’s thermal conductivity.
The continuity equation is as follows:
The water momentum equation is:
where μ is water’s dynamic viscosity, and p is water’s static pressure.
3.2. Boundary Conditions
The starting temperature of the liquid, environment, battery, and cooling plate are all set to 298.15 K. The thermal swap between the battery and cooling plate and between cooling plate and coolant is completed by temperature coupling surface. There is a thermal transfer between the cell and the cooling plate as well as between the air. Set the convective transfer rate of the convective heat transfer boundary condition of the contact surface to a constant value of 5 W/(m2·K). The boundary condition for the inlet is a mass flow inlet with a mass flow rate of 0.008 kg/s. The outlet boundary condition is set to pressure outlet. The battery is the heat source. Based on the set boundary conditions, the simulation is carried out using the Fluent module of ANSYS.
3.3. Grid Independence Test
The model was analyzed thermally using the Fluent module of ANSYS, and the grid division will affect the calculation results. Generally, too much grid division will make the calculation very complex, increase the calculation time and reduce the calculation efficiency, and too little grid division will lead to the decline of the calculation accuracy, and the results are not accurate enough. In addition, when the number of grids exceeds a certain value, the results obtained from the calculation will tend to stabilize when the accuracy of the calculation is high. Therefore, to balance the calculation accuracy and cost, it is necessary to carry out a grid independence test and take an appropriate number of grids for calculation.
Taking the grid numbers 192,350, 270,111, 459,729, 528,492, 653,709, 804,919, 943,608, and 1,017,107 for the grid independence test. The grid meshed in the MESH module and the grid quality were both better than 0.75. The calculated temperature difference and maximum temperature are shown in Figure 5. The changes in temperature difference and maximum temperature after the number of grids is 653,709 are small and nearly stable, and the changes in the number of grids have a small impact on the temperature. Therefore, to satisfy the calculation accuracy and efficiency at the same time, select the grid number 653,709 division scheme in this work, as shown in Figure 6.
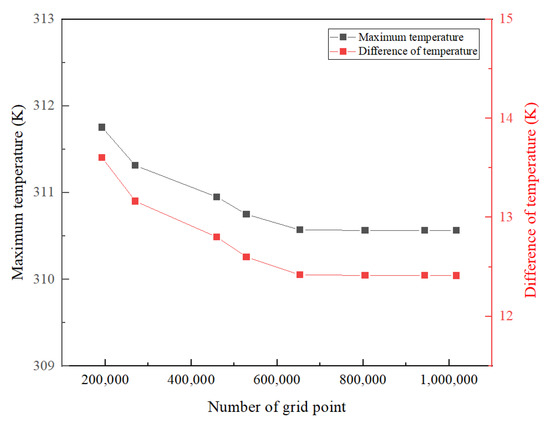
Figure 5.
Grid independence test.

Figure 6.
Grid display.
4. Comparative Analysis of BTMS with Different Pin-Fins Schemes
Based on the above modeling and calculation, this section analyzed the effect of the number, shape, and distribution of the cooling plate’s pin-fins on the thermal performance and power consumption of the battery. During the analysis of the three effect factors, the cooling plate’s size does not change, but only the pin-fins’ size in the cooling plate.
4.1. Influence of Pin-Fins Shape
To more conveniently describe the changes in the geometric size and position of the pin-fins, the normalized diameter and normalized increment are introduced here [36]. Due to the restriction of the channel space inside the cooling plate, the size of the pin-fins section cannot be infinitely increased. The maximum size of the pin-fins section is determined as follows:
where eWmax is the maximum dimension of the pin-fins section along the cooling plate width, eLmax is the maximum dimension of the pin-fins cross-section along the length of the cooling plate, L is the size of the thoroughfare in the length orientation, W is the size of the thoroughfare in the width orientation, m is the number of pin-fins in each row along the width, and n is the number of pin-fins in each row along the length.
The normalized diameter is used to represent the relative dimensions of pin-fins as follows:
where eW is the actual dimension of the pin-fin cross-section along the cooling plate width and eL is the actual dimension of the pin-fin cross-section along the length of the cooling plate. eWr = 1 or eLr = 1 means that the internal is filled by pin-fins in the corresponding direction, and the liquid cannot pass through. eWr = 0 or eLr = 0 means the pin-fins are removed.
When the distance between pin-fins is distributed in an arithmetic sequence, the maximum distance increment can be obtained as follows:
where δLmax and δWmax are the maximum distance increment along the length direction and width direction, respectively. Their positive and negative signs indicate the change in direction. In the length direction, the distance between the first pin-fin and the inner wall is equal to the distance between the last pin-fin and the inner wall is xL. In the width direction, the distance between the first pin-fin and the inner wall is equal to the distance between the last pin-fin and the inner wall is xW.
To represent the magnitude of the change in pin-fin distance, Equation (16) is the normalized distance increment defined, where δL and δW are the reality distance change of pin-fin. So, δLr = 0 and δWr = 0 mean that all pin-fins are equally spaced. δLr = 1 and δWr = 1 indicate that the degree of change reaches the maximum possible value.
According to the basic model established in Section 2, four schemes are designed for the pin-fins with circular, equilateral triangular, square, and elliptical section shapes. To reduce the effect of other factors except for the shape, only the shape of the pin-fins is changed in this section, and the volume, number, and other parameters of the pin-fins are the same. The circular section is taken as the baseline. To have a moderate cross-section size, eWr (eLr) = 0.5 is taken, so the diameter of the circular section is 10.63 mm. The size parameters of other shaped cross sections are determined according to the circular section area shown in Table 4. The pin-fins of the four schemes are arranged 8 × 6 equally spaced. Figure 7 displays the four schemes for the cooling plate.

Table 4.
Size parameters of different shapes.
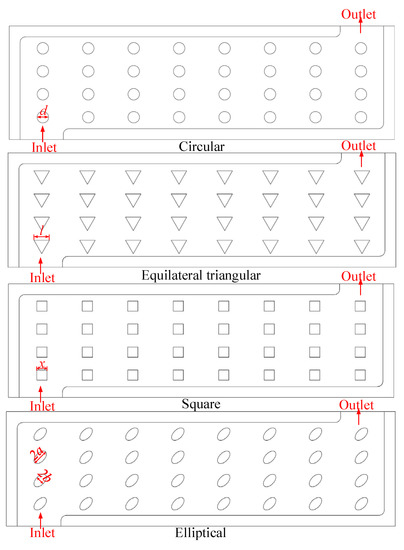
Figure 7.
Four pin-fin shapes.
The battery’s heat dissipation results with four various pin-fin shapes are displayed in Figure 8. In the figure, the cooling plates’ largest local temperature of the four shapes of pin-fins all appear in the lower right corner, circled in red, where the cooling capability is the worst. Because more liquid is concentrated in the middle along with the flow direction, and the line between this spot and the entrance is perpendicular to the velocity orientation of the entrance liquid. Therefore, this area has the worst cooling capability. Furthermore, the contours show that the cooling plate with circular section pin-fins has more high-temperature areas on the battery than the cooling plate with elliptical section pin-fins. The battery’s temperature cooled by the cooling plate with triangular section pin-fins is smaller than that cooled by the cooling plate with elliptical section pin-fins. The battery’s temperature cooled by the cooling plate with square section pin-fins is the lowest of the four schemes. The batteries’ temperature in all four schemes decreases uniformly with the direction of liquid flow. The cooling plate’s temperature is lower than the battery temperature, and the cooling plate’s temperature changes more quickly and over a wider range. In the figure, the temperature difference between the battery under the square section pin-fin scheme and the triangular section pin-fin scheme is a little large. However, the battery’s temperature under the square section pin-fin scheme varies evenly and has better temperature consistency, while the temperature of the battery surface under the triangular section pin-fin scheme varies faster at the entrance and exit and slower in the middle, it has poorer temperature uniformity.
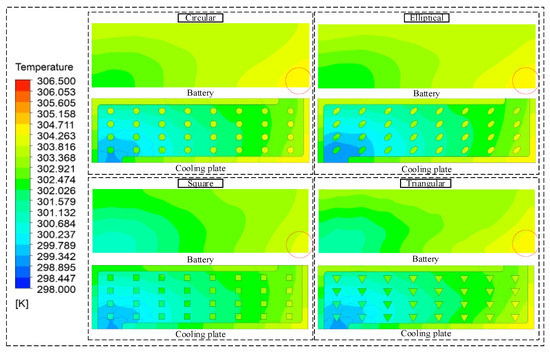
Figure 8.
Temperature contour of battery and cooling plate with four shapes pin-fins.
The battery’s temperature difference, average temperature, maximum temperature, and coolant pressure drop are shown in Table 5. The results are that the battery maximum temperature for the triangular section pin-fin scheme is the highest at 306.13 K. The maximum temperature for the square section pin-fin scheme is the lowest at 305.67 K, and it is 0.47 K smaller than that of the triangular section pin-fin scheme. The small difference in battery maximum temperatures between the elliptical section pin-fin and the circular section pin-fin schemes, which are 306.03 K and 306.06 K, respectively, is because of their similar shapes. The battery average temperature under the elliptical section pin-fin scheme and the circular section pin-fin scheme is larger than other schemes. In these two cases, the maximum temperature is 304.04 K and 304.06 K, respectively. The battery average temperature for the square section pin-fin scheme is the lowest at 303.74 K. The greater pressure drop on the coolant from the circular and elliptical section fins means that greater power consumption is required. The larger pressure drops on the coolant of 191.19 Pa and 162.02 Pa for the circular section pin-fins and elliptical section pin-fins, respectively, mean that greater power consumption is required. The square section pin-fins scheme has the smallest pressure drop on the coolant of 127.01 Pa, which effectively reduces the power consumption of the liquid pumped by the cooling plate. Both the elliptical section pin-fin scheme and the circular section pin-fin scheme have a smaller battery temperature difference. Although the temperature difference of the square section pin-fin scheme is larger, it has the smallest maximum temperature, average temperature, and pressure drop. In addition, the contour illustrates that the temperature of the square section pin-fin scheme varies uniformly and has a better temperature uniformity. Therefore, in a comprehensive comparison, the square section pin-fin cooling plate has the lowest power consumption and the best heat dissipation capability. For a more visual comparison, the effect of various section pin-fin shapes on heat dissipation is shown in Figure 9.

Table 5.
Effect of various pin-fin shapes.
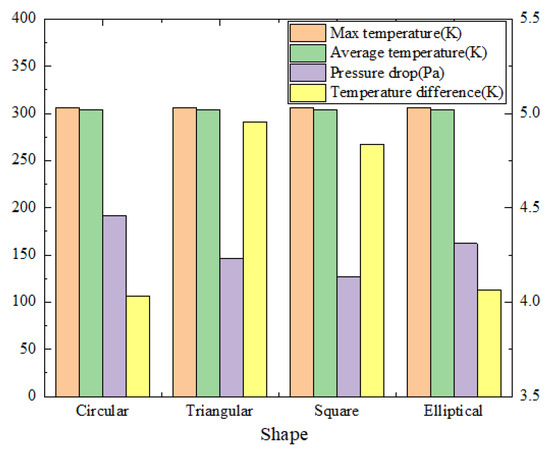
Figure 9.
Influence of different pin-fins shapes.
4.2. Influence of the Number of Pin-Fins
In this part, based on the square section pin-fin scheme, the effect of different pin-fins number on thermal performance is analyzed. To exclude the influence of other factors besides the number, the pin-fin size is set as the size of the square section pin-fin in Section 4.1 and is uniformly arranged along the length direction and width direction. Here, the arrangement schemes with 4 × 8, 4 × 6, 3 × 6, and 3 × 4 pin-fins are analyzed. Figure 10 shows the cooling plate.
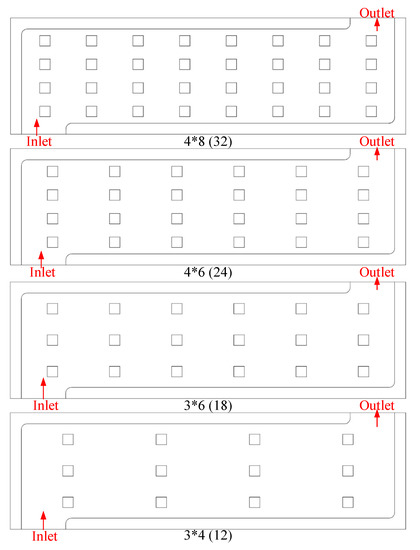
Figure 10.
The cooling plate has a different number of pin-fins.
Figure 11 shows the battery’s heat dissipation results with different pin-fin numbers in the cooling plate. The overall temperature tends to decrease as the number of pin-fins increases, with the 3 × 4 pin-fins scheme having the highest temperature and the 4 × 8 pin-fins scheme having the lowest. The temperature in all four schemes varies uniformly along the liquid flow direction, and the maximum temperature occurs at the lower right corner of the cooling plate. It shows that the number of pin-fins has some influence on the heat dissipation capability of the cooling plate.
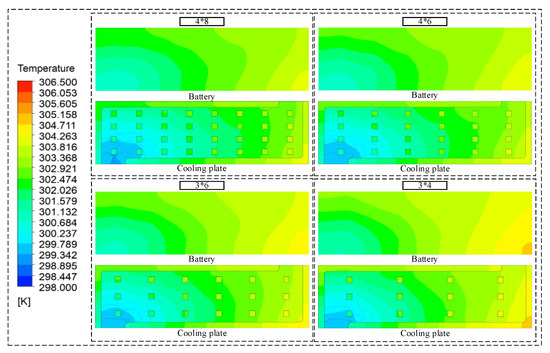
Figure 11.
Temperature contour of battery and cooling plate with four numbers.
To more accurately analyze the influence trend of the cooling plate pin-fin’s number on the thermal capability, the calculated pressure drop, average temperature, and maximum temperature are listed in Table 6. To observe the trend more clearly, the variation trend of heat dissipation performance with the pin-fin’s number is shown in Figure 12.

Table 6.
Effect of various pin-fin numbers.
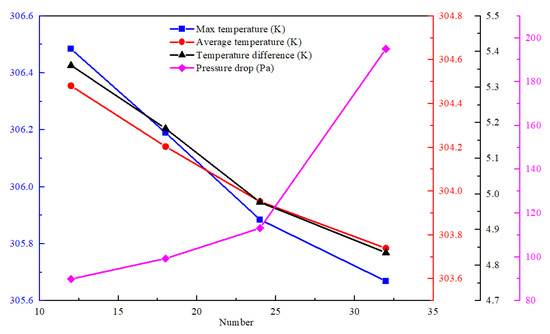
Figure 12.
Influence of different pin-fin numbers.
The results show that as the number of pin-fins on the cooling plate increases, the battery’s temperature difference, average temperature, and maximum temperature all show a decreasing trend. The battery temperature difference, average temperature, and maximum temperature for the 3 × 4 pin-fins scheme are 306.48 K, 304.48 K, and 5.36 K, respectively, which are the largest of all the schemes. The battery maximum temperature for the 4 × 8 pin-fins scheme is 305.66 K, which is 0.82 K smaller than the battery maximum temperature for the 3 × 4 pin-fins scheme. The battery average temperature for the 4 × 8 pin-fins scheme is 305.66 K, which is 0.74 K lower than the battery average temperature for the 3 × 4 pin-fins scheme. The battery temperature difference in the 4 × 8 pin-fins scheme is 4.84 K, which is 0.53 K smaller than the battery temperature difference in the 3 × 4 pin-fins scheme. However, the pressure drop for the 4 × 8 pin-fins scheme is the highest at 127.01 Pa and the smallest at 89.91 Pa for the 3 × 4 pin-fins scheme. The pressure drop for the 4 × 8 pin-fins scheme is 37.10 Pa higher than that of the 3 × 4 pin-fins scheme. Pressure drop and temperature follow opposite trends with the number of pin-fins, so that lower temperatures and pressure drops cannot be met simultaneously; obtaining lower temperatures must be at the expense of pressure drop, and a balance between these two parameters is needed to obtain a better overall performance.
4.3. Influence of Pin-Fins Distribution
In this part, based on the 3 × 6 square section pin-fin scheme, the effect of various pin-fin distributions on heat dissipation performance and power consumption is analyzed. To exclude the influence of other factors, the number, cross-section shape, and size of pin-fins are set according to the 3 × 6 scheme in Section 4.2, and only the distance between pin-fins is changed. To make it easier to set the position distribution of the pin-fins, the distance between them is distributed in an arithmetic sequence along the length and width directions. Therefore, the following five schemes are set: δLr = 0.5 and δWr = 0, δLr = −0.5 and δWr = 0, δLr = 0 and δWr = 0.5, δLr = 0 and δWr = −0.5, δLr = 0 and δWr = 0. To correspond to the model in the previous section, xL = 28 and xW = 14.17 for all schemes, as shown in Figure 13.
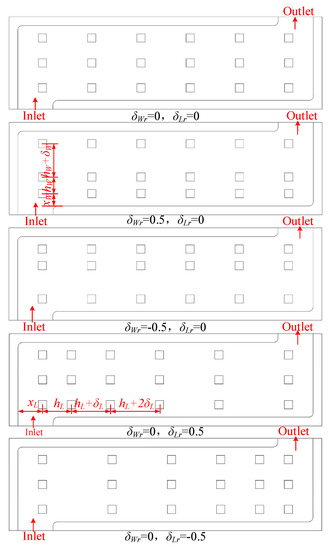
Figure 13.
Cooling plate with different distributions of pin-fins.
The heat dissipation results for the battery and cooling plate with different pin-fin distributions are shown in Figure 14. The results are that the pin-fin distribution has little effect on the temperature of the battery surface and the cooling plate. The five schemes in Figure 14 can achieve great temperature uniformity. The high-temperature region under the scheme with uniform pin-fin distribution is slightly smaller than under the other pin-fin distribution schemes. The high-temperature region in the lower right corner under the δLr = −0.5, δWr = 0 scheme is slightly larger than the high-temperature region in the lower right corner under the δLr = 0.5, δWr = 0 scheme because the pin-fins at the lower right corner under the δLr = −0.5, δWr = 0 scheme are denser and disrupt the coolant flow.
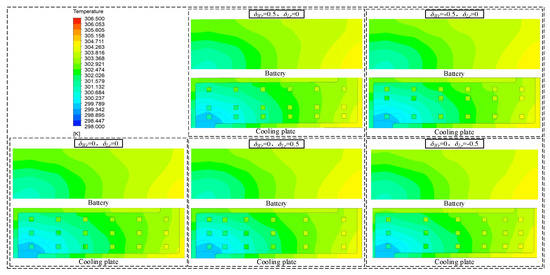
Figure 14.
Temperature contour of battery and cooling plate with various pin-fin distributions.
To more accurately analyze the influence trend of the pin-fin distribution on the heat dissipation capability, the temperature difference, average temperature, maximum temperature, and pressure drop calculated are shown in Table 7. To observe the trend more clearly, the variation trend of heat dissipation performance with pin-fin distribution is shown in Figure 15 and Figure 16.

Table 7.
Effect of various pin-fin distributions.
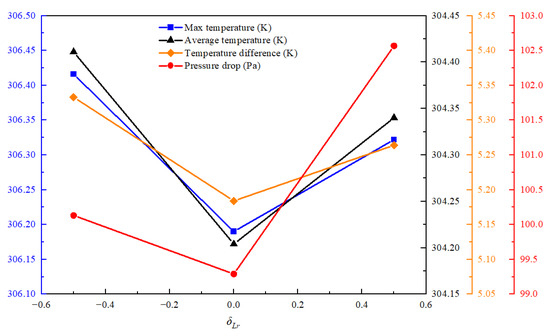
Figure 15.
Effect of different pin-fin distributions along the length direction.
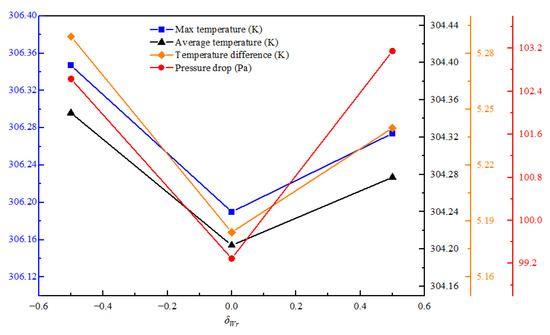
Figure 16.
Effect of different pin-fin distributions along the width direction.
In Table 7, The different pin-fin distribution has little influence on temperature and pressure drop. When the pin-fin distribution is δLr = 0, δWr = 0, δLr = 0, δWr = 0.5, δLr = 0, δWr = −0.5, δLr = 0.5, δWr = 0 and δLr = −0.5, δWr = 0, the maximum temperature is 306.19, 306.27 K, 306.35 K, 306.32 K and 306.42 K, respectively. The pressure drops are 99.29 Pa, 103.15 Pa, 102.63 Pa, 102.57 Pa and 100.13 Pa, respectively. The average temperature is 304.20 K, 304.28 K, 304.35 K, 304.34 K and 304.41 K, respectively. The temperature difference is 5.18 K, 5.24 K, 5.29 K, 5.26 K and 5.33 K, respectively. The change in the four parameters is not obvious. The difference between their maximum and minimum values is 0.23 K, 3.86 Pa, 0.21 K and 0.15 K respectively. It can be seen from the variation trend of Figure 15 and Figure 16 that the average temperature, pressure drop and maximum temperature under the scheme of δLr = 0, δWr = 0 are relatively low, indicating that the power consumption and heat dissipation capability of pin-fins uniformly distributed in the cooling plate are relatively better.
5. Conclusions
Typical parallel and serpentine microchannel liquid cooling BTMS have been extensively studied, but little research on cooling plates with pin-fins. Based on CFD simulation, this study analyzed a cooling plate with pin-fins and investigated the effect of various shapes, numbers, and distributions of pin-fins on heat dissipation capability and power consumption. The result is that the shape factor of the pin-fin has a large effect on the pressure drop, and the number and distribution of the pin-fin have a large effect on the temperature. Their changing trend provides a direction for seeking the best heat dissipation scheme for cooling plates with pin-fins. The detailed results of this work are as follows:
- The different shapes of the pin-fins have a certain influence on both temperature and pressure drop. Among them, the cooling plate with triangular section pin-fins has poor thermal performance, with a maximum temperature of 306.13 K. In contrast, the cooling plate with square section pin-fins has the best thermal capability, with a maximum temperature of 305.67 K, which is 0.47 K smaller compared with the cooling plate with triangular section pin-fins. The largest pressure drop is 195.02 Pa for the cooling plate with elliptical section pin-fins, while the smallest pressure drop is 127.01 Pa for the cooling plate with square section pin-fins. Therefore, the power consumption and heat dissipation capability of the square section pin-fin cooling plate is optimal.
- The different number of pin-fins also affects the heat dissipation capability of the cooling plate. The trend shows that as the number of pin-fins increases, the battery’s maximum temperature will tend to decrease, but the pressure drop will tend to increase. When the number of pin-fin is 3 × 4, the maximum temperature is 306.48 K, the average temperature is 304.48 K, the temperature difference is 5.36 K, and the pressure drop is 89.91 Pa. The pressure drop is the lowest of all the schemes, but the temperature is the highest. When the number of pin-fin is 4 × 8, The maximum temperature is 305.67 K, the average temperature is 303.74 K, the temperature difference is 4.84 K, and the pressure drop is 127.01 Pa. The temperature is the lowest, and the pressure drop is the highest of all the options. Therefore, to obtain better heat dissipation and lower power consumption, it is necessary to balance these two performance parameters.
- The distribution of pin-fins has only a little impact on temperature and pressure drop. However, the trend shows that cooling plates with a uniform distribution of pin-fins have lower maximum temperatures and pressure drop, indicating better heat dissipation capability and power consumption. The maximum temperature is 306.19 K, the average temperature is 304.20 K, the temperature difference is 5.18 K, and the pressure drop is 99.29 Pa, all of which are the smallest among these schemes when arranged equally spaced in the L and W directions. Therefore, pin-fin positions should be evenly arranged within the cooling plate.
Future studies will look into optimizing and finding the best scheme parameters pin-fins utilizing the surrogate model method. To enhance the performance of heat dissipation, a novel cooling plate will also be developed.
Author Contributions
Conceptualization, methodology, and supervision, W.L.; writing—original draft preparation, software, and visualization, M.X.; formal analysis and data curation, N.W.; investigation and resources, A.G.; writing—review and editing, L.G. All authors have read and agreed to the published version of the manuscript.
Funding
This research was funded by the Science and Technology Innovation Program of “Chengdu-Chongqing Double City Economic Circle Construction” [grant number KJCXZD2020013], the Special Funding for Postdoctoral Research Program in Chongqing [grant number XmT2020115], and the China Postdoctoral Science Foundation [grant number 2020M683237].
Institutional Review Board Statement
Not applicable.
Informed Consent Statement
Not applicable.
Data Availability Statement
Not applicable.
Conflicts of Interest
The authors declare no conflict of interest.
References
- Lin, J.Y.; Liu, X.H.; Li, S.; Zhang, C.; Yang, S.C. A review on recent progress, challenges and perspective of battery thermal management system. Int. J. Heat Mass Transf. 2021, 167, 120834. [Google Scholar] [CrossRef]
- Jaguemont, J.; Van Mierlo, J. A comprehensive review of future thermal management systems for battery-electrified vehicles. J. Energy Storage 2020, 31, 101551. [Google Scholar] [CrossRef]
- Wang, N.; Garg, A.; Su, S.; Mou, J.; Gao, L.; Li, W. Echelon Utilization of Retired Power Lithium-Ion Batteries: Challenges and Prospects. Batteries 2022, 8, 96. [Google Scholar] [CrossRef]
- Yuan, M.; Liu, K. Rational design on separators and liquid electrolytes for safer lithium-ion batteries. J. Energy Chem. 2020, 43, 58–70. [Google Scholar] [CrossRef]
- Lu, M.Y.; Zhang, X.L.; Ji, J.; Xu, X.F.; Zhang, Y.Y.C. Research progress on power battery cooling technology for electric vehicles. J. Energy Storage 2020, 27, 101155. [Google Scholar] [CrossRef]
- Kim, J.; Oh, J.; Lee, H. Review on battery thermal management system for electric vehicles. Appl. Therm. Eng. 2019, 149, 192–212. [Google Scholar] [CrossRef]
- Chen, F.F.; Huang, R.; Wang, C.M.; Yu, X.L.; Liu, H.J.; Wu, Q.C.; Qian, K.Y.; Bhagat, R. Air and PCM cooling for battery thermal management considering battery cycle life. Appl. Therm. Eng. 2020, 173, 115154. [Google Scholar] [CrossRef]
- Wu, W.X.; Wang, S.F.; Wu, W.; Chen, K.; Hong, S.H.; Lai, Y.X. A critical review of battery thermal performance and liquid based battery thermal management. Energy Convers. Manag. 2019, 182, 262–281. [Google Scholar] [CrossRef]
- Xu, X.M.; Tong, G.Y.; Li, R.Z. Numerical study and optimizing on cold plate splitter for lithium battery thermal management system. Appl. Therm. Eng. 2020, 167, 114787. [Google Scholar] [CrossRef]
- Zhang, J.Y.; Li, X.X.; Zhang, G.Q.; Wang, Y.Z.; Guo, J.W.; Wang, Y.; Huang, Q.Q.; Xiao, C.R.; Zhong, Z.D. Characterization and experimental investigation of aluminum nitride-based composite phase change materials for battery thermal management. Energy Convers. Manag. 2020, 204, 112319. [Google Scholar] [CrossRef]
- Thakur, A.K.; Prabakaran, R.; Elkadeem, M.R.; Sharshir, S.W.; Arici, M.; Wang, C.; Zhao, W.S.; Hwang, J.Y.; Saidur, R. A state of art review and future viewpoint on advance cooling techniques for Lithium-ion battery system of electric vehicles. J. Energy Storage 2020, 32, 101771. [Google Scholar] [CrossRef]
- Kiani, M.; Omiddezyani, S.; Houshfar, E.; Miremadi, S.R.; Ashjaee, M.; Nejad, A.M. Lithium-ion battery thermal management system with Al2O3/AgO/CuO nanofluids and phase change material. Appl. Therm. Eng. 2020, 180, 115840. [Google Scholar] [CrossRef]
- Zhi, M.Y.; Fan, R.; Yang, X.; Zheng, L.L.; Yue, S.; Liu, Q.Y.; He, Y.H. Recent research progress on phase change materials for thermal management of lithium-ion batteries. J. Energy Storage 2022, 45, 103694. [Google Scholar] [CrossRef]
- Tang, W.; Ding, H.; Xu, X.M.; Fu, J.Q.; Liu, L.; Wei, W.; Xiao, Y.; Huang, H. Research on battery liquid-cooled system based on the parallel connection of cold plates. J. Renew. Sustain. Energy 2020, 12, 045701. [Google Scholar] [CrossRef]
- Jang, D.S.; Yun, S.; Hong, S.H.; Cho, W.; Kim, Y. Performance characteristics of a novel heat pipe-assisted liquid cooling system for the thermal management of lithium-ion batteries. Energy Convers. Manag. 2022, 251, 115001. [Google Scholar] [CrossRef]
- Wang, H.; Tao, T.; Xu, J.; Mei, X.; Liu, X.; Gou, P. Cooling capacity of a novel modular liquid-cooled battery thermal management system for cylindrical lithium ion batteries. Appl. Therm. Eng. 2020, 178, 115591. [Google Scholar] [CrossRef]
- Wu, S.; Lao, L.; Wu, L.; Liu, L.; Lin, C.; Zhang, Q. Effect analysis on integration efficiency and safety performance of a battery thermal management system based on direct contact liquid cooling. Appl. Therm. Eng. 2022, 201, 117788. [Google Scholar] [CrossRef]
- Yamanaka, T.; Kihara, D.; Takagishi, Y.; Yamaue, T. Multi-Physics Equivalent Circuit Models for a Cooling System of a Lithium Ion Battery Pack. Batteries 2020, 6, 44. [Google Scholar] [CrossRef]
- Xu, J.; Chen, Z.L.; Qin, J.; Pan, M.Q. A lightweight and low-cost liquid-cooled thermal management solution for high energy density prismatic lithium-ion battery packs. Appl. Therm. Eng. 2022, 203, 117871. [Google Scholar] [CrossRef]
- Akbarzadeh, M.; Kalogiannis, T.; Jaguemont, J.; Jin, L.; Behi, H.; Karimi, D.; Beheshti, H.; Van Mierlo, J.; Berecibar, M. A comparative study between air cooling and liquid cooling thermal management systems for a high-energy lithium-ion battery module. Appl. Therm. Eng. 2021, 198, 117503. [Google Scholar] [CrossRef]
- Patil, M.S.; Seo, J.H.; Panchal, S.; Jee, S.W.; Lee, M.Y. Investigation on thermal performance of water-cooled Li-ion pouch cell and pack at high discharge rate with U-turn type microchannel cold plate. Int. J. Heat Mass Transf. 2020, 155, 119728. [Google Scholar] [CrossRef]
- Panchal, S.; Khasow, R.; Dincer, I.; Agelin-Chaab, M.; Fraser, R.; Fowler, M. Numerical modeling and experimental investigation of a prismatic battery subjected to water cooling. Numer. Heat Transf. Part A Appl. 2017, 71, 626–637. [Google Scholar] [CrossRef]
- Panchal, S.; Khasow, R.; Dincer, I.; Agelin-Chaab, M.; Fraser, R.; Fowler, M. Thermal design and simulation of mini-channel cold plate for water cooled large sized prismatic lithium-ion battery. Appl. Therm. Eng. 2017, 122, 80–90. [Google Scholar] [CrossRef]
- Mahmoud, N.S.; Jaffal, H.M.; Imran, A.A. Performance evaluation of serpentine and multi-channel heat sinks based on energy and exergy analyses. Appl. Therm. Eng. 2021, 186, 116475. [Google Scholar] [CrossRef]
- Tian, X.W.; Wang, W.; Zhang, S.Z.; Qian, S.H. A Novel Design Method of Heat Sink with Conjugate Heat Transfer by Free-Shape Channel Modeling. Int. J. Heat Mass Transf. 2021, 176, 121481. [Google Scholar] [CrossRef]
- Ibrahim, A.; Guo, J.; Wang, Y.W.; Zheng, Y.D.; Lei, B.; Jiang, F.M. Performance of serpentine channel based Li-ion battery thermal management system: An experimental investigation. Int. J. Energy Res. 2020, 44, 10023–10043. [Google Scholar] [CrossRef]
- Sheng, L.; Su, L.; Zhang, H.; Li, K.; Fang, Y.; Ye, W.; Fang, Y. Numerical investigation on a lithium ion battery thermal management utilizing a serpentine-channel liquid cooling plate exchanger. Int. J. Heat Mass Transf. 2019, 141, 658–668. [Google Scholar] [CrossRef]
- Chen, Y.M.; Chen, K.; Dong, Y.; Wu, X.L. Bidirectional symmetrical parallel mini-channel cold plate for energy efficient cooling of large battery packs. Energy 2022, 242, 122553. [Google Scholar] [CrossRef]
- Monika, K.; Chakraborty, C.; Roy, S.; Dinda, S.; Singh, S.A.; Datta, S.P. An improved mini-channel based liquid cooling strategy of prismatic LiFePO4 batteries for electric or hybrid vehicles. J. Energy Storage 2021, 35, 102301. [Google Scholar] [CrossRef]
- Shang, Z.Z.; Qi, H.Z.; Liu, X.T.; Ouyang, C.Z.; Wang, Y.S. Structural optimization of lithium-ion battery for improving thermal performance based on a liquid cooling system. Int. J. Heat Mass Transf. 2019, 130, 33–41. [Google Scholar] [CrossRef]
- Jin, L.W.; Lee, P.S.; Kong, X.X.; Fan, Y.; Chou, S.K. Ultra-thin minichannel LCP for EV battery thermal management. Appl. Energy 2014, 113, 1786–1794. [Google Scholar] [CrossRef]
- Li, A.; Yuen, A.C.Y.; Wang, W.; Chen, T.B.Y.; Lai, C.S.; Yang, W.; Wu, W.; Chan, Q.N.; Kook, S.; Yeoh, G.H. Integration of Computational Fluid Dynamics and Artificial Neural Network for Optimization Design of Battery Thermal Management System. Batteries 2022, 8, 69. [Google Scholar] [CrossRef]
- Zhang, F.; Yi, M.; Wang, P.; Liu, C. Optimization design for improving thermal performance of T-type air-cooled lithium-ion battery pack. J. Energy Storage 2021, 44, 103464. [Google Scholar] [CrossRef]
- Hu, Y.; Choe, S.Y.; Garrick, T.R. Measurement of two-dimensional heat generation rate of pouch type lithium-ion battery using a multifunctional calorimeter. J. Power Sources 2022, 532, 231350. [Google Scholar] [CrossRef]
- Du, X.; Wu, Q.; Wang, Y.N.; Pan, T.S.; Wei, Y.M.; Chen, H.S.; Song, W.L.; Fang, D.N. Visualizing two-dimensional internal temperature distribution in cylindrical Li-ion cells. J. Power Sources 2020, 446, 227343. [Google Scholar] [CrossRef]
- Zhao, R.C.; Wen, D.Y.; Lai, Z.D.; Li, W.H.; Ye, M.; Zhuge, W.L.; Zhang, Y.J. Performance analysis and optimization of a novel cooling plate with non-uniform pin-fins for lithium battery thermal management. Appl. Therm. Eng. 2021, 194, 117022. [Google Scholar] [CrossRef]
- Su, S.; Li, W.; Li, Y.; Garg, A.; Gao, L.; Zhou, Q. Multi-objective design optimization of battery thermal management system for electric vehicles. Appl. Therm. Eng. 2021, 196, 117235. [Google Scholar] [CrossRef]
- Li, A.; Yuen, A.C.Y.; Wang, W.; Weng, J.; Lai, C.S.; Kook, S.; Yeoh, G.H. Thermal Propagation Modelling of Abnormal Heat Generation in Various Battery Cell Locations. Batteries 2022, 8, 216. [Google Scholar] [CrossRef]
- Falcone, M.; De Volo, E.P.B.; Hellany, A.; Rossi, C.; Pulvirenti, B. Lithium-ion Battery Thermal Management System: A Survey and New CFD Results. Batteries 2021, 7, 86. [Google Scholar] [CrossRef]
Disclaimer/Publisher’s Note: The statements, opinions and data contained in all publications are solely those of the individual author(s) and contributor(s) and not of MDPI and/or the editor(s). MDPI and/or the editor(s) disclaim responsibility for any injury to people or property resulting from any ideas, methods, instructions or products referred to in the content. |
© 2023 by the authors. Licensee MDPI, Basel, Switzerland. This article is an open access article distributed under the terms and conditions of the Creative Commons Attribution (CC BY) license (https://creativecommons.org/licenses/by/4.0/).


