Article

Spatially Offset Raman Spectroscopy for Characterization of a Solid-State System

by
Edurne Jaime-Barquero
1,2,
Yan Zhang
1,
Nicholas E. Drewett
1,
Pedro López-Aranguren
1,
Ekaitz Zulueta
2 and
Emilie Bekaert
1,*
1
Center for Cooperative Research on Alternative Energies (CIC energiGUNE), Basque Research and Technology Alliance (BRTA), Parque Tecnológico de Alava, Albert Einstein 48, 01510 Vitoria-Gasteiz, Spain
2
Department of Systems Engineering and Automation, School 10 of Engineering of Vitoria-Gasteiz, University of The Basque Country (UPV/EHU), Nieves Cano 12, 01006 Vitoria-Gasteiz, Spain
*
Author to whom correspondence should be addressed.
Batteries 2023, 9(1), 20; https://doi.org/10.3390/batteries9010020
Submission received: 26 October 2022 / Revised: 19 December 2022 / Accepted: 24 December 2022 / Published: 27 December 2022

Abstract

:
Solid-state batteries represent a promising technology in the field of high-energy-density and safe storage systems. Improving the understanding of how defects form within these cells would greatly facilitate future development, which would be best served by applying nondestructive analytical tools capable of characterization of the key components and their changes during cycling and/or aging. Spatially offset Raman spectroscopy (SORS) represents a potentially useful technique, but currently there is a lack of knowledge regarding its use in this field. To fill this gap, we present an investigation into the use of simple defocused micro-SORS on systems constructed using typical components found within solid-state cells. By analyzing the constituents and the assembled system, it was possible to obtain depth profiling spectra and show that spectra may be obtained from layers which are normally obscured, demonstrating the technique’s potential for nondestructive chemical analysis of the subsurface. In this way, the results presented validate the potential of micro-SORS as a technique to develop to support future solid-state battery development, as well as the nondestructive battery analytical field.

1. Introduction

The growing demand for clean and efficient energy within modern society has generated considerable interest in advancing the field of energy storage to facilitate this transformation [1,2,3]. While conventional lithium-ion batteries have been successful [4,5,6] due to their high energy density and high power density, the use of organic liquid electrolytes represents a concern due to their safety risk (swelling, gas release, venting, toxic gas emissions, accumulated gas ignition, electrolyte leakage, high cell pressure, cell case rupture or explosion, or even fire) [7,8].
An alternative to liquid electrolytes is to instead employ solid-state electrolytes, which not only hold the potential to increase safety, due to greater thermal stability, but also offer a potential increase in energy density by enabling the use of lithium metal in place of conventional graphite anodes (thus reducing the weight of the system) [8,9,10]. However, significant challenges remain, primarily relating to processing scalability and the mechanical properties of the device [10,11,12], which typically involve various types of defects and their formation (e.g., lack of contact, cracks, Li dendrites, etc.). Understanding these defects is, therefore, key to future solid-state electrolyte development [13,14,15]. Furthermore, a significant bottleneck is the lack of understanding of the key interfacial characteristics (particularly upon formation, cycling, and aging), as there is a lack of nondestructive techniques capable of analysis without damage that may result in alteration [16].
In this way, a fast, nondestructive analytical technique, particularly one able to provide chemical information, would be highly desirable as it would offer a flexible approach to defect detection including in situ and ex situ examination during electrochemical cycling, and thus contribute significantly to further establishing guidelines for future solid-state battery development.
Raman spectroscopy has previously proven to be a powerful technique for characterizing many battery materials (often offering complementary data for structural characterization), and has been used not only on materials and components but also within cells for in situ and in operando measurements [15,17,18,19,20,21,22,23]. While conventional Raman spectroscopy is relatively straightforward in application (typically requiring no specific sample preparation), it nevertheless suffers from an inability to probe samples with diffuse scattering in depth (where the photon directions are mixed and direct imaging cannot be easily used to discriminate between the different layers as the photons propagate in all spatial dimensions) [24,25,26].
Spatially offset Raman spectroscopy (SORS), however, is a variant of Raman spectroscopy which exploits the fact that most materials are neither completely transparent nor opaque to light, but instead tend to scatter it, and thus it opens up the possibility of nondestructive depth profiling by detecting Raman signals from (and by this, enables the chemical analysis of) layers beneath the otherwise obscuring surfaces [27,28]. It should be noted that the degree of the depth penetration of the Raman laser is dependent on a number of variables (such as nature of material, laser wavelength, laser intensity) and, consequently, applicability of SORS should be determined on a case-by-case basis with respect to the system to be investigated [29,30,31,32,33]. For SORS to be able to detect these subsurface Raman signals, the laser must first penetrate and convert the photons of the region of interest into Raman photons, which must then diffuse back to the surface to be detected. To achieve this, two conditions must be met: first, the laser must penetrate to reach the layers of interest, and second, the photons must be detectable. It is important to consider that the path of subsurface photons is longer (compared to the path of photons at the surface), causing more lateral scattering and a spatial displacement or spatial offset between the illuminated and collected areas on the surface of the sample [27,28]. Detecting signals considering this spatial displacement enables the detection of deeper photons and, thus, inner layers of the sample [28].
There are several variations of SORS (such as point-like SORS, ring collection SORS, ring-illumination SORS or inverse SORS, defocusing SORS, and TRS) [27], which have been successfully utilized for a wide range of various applications (e.g., in the pharmaceutical [34,35], forensics and security [36], medical [37], food science [38], and analytical history [39,40,41] fields).
To the best of our knowledge, despite the potential to provide information about the chemical characteristics of the species within electrochemical cells, SORS has not yet been applied in the field of energy storage. Consequently, this study presents an investigation into this potential new application for the nondestructive SORS technique in order to determine suitability for, and challenges with respect to, collecting depth profiling information.

2. Materials and Methods

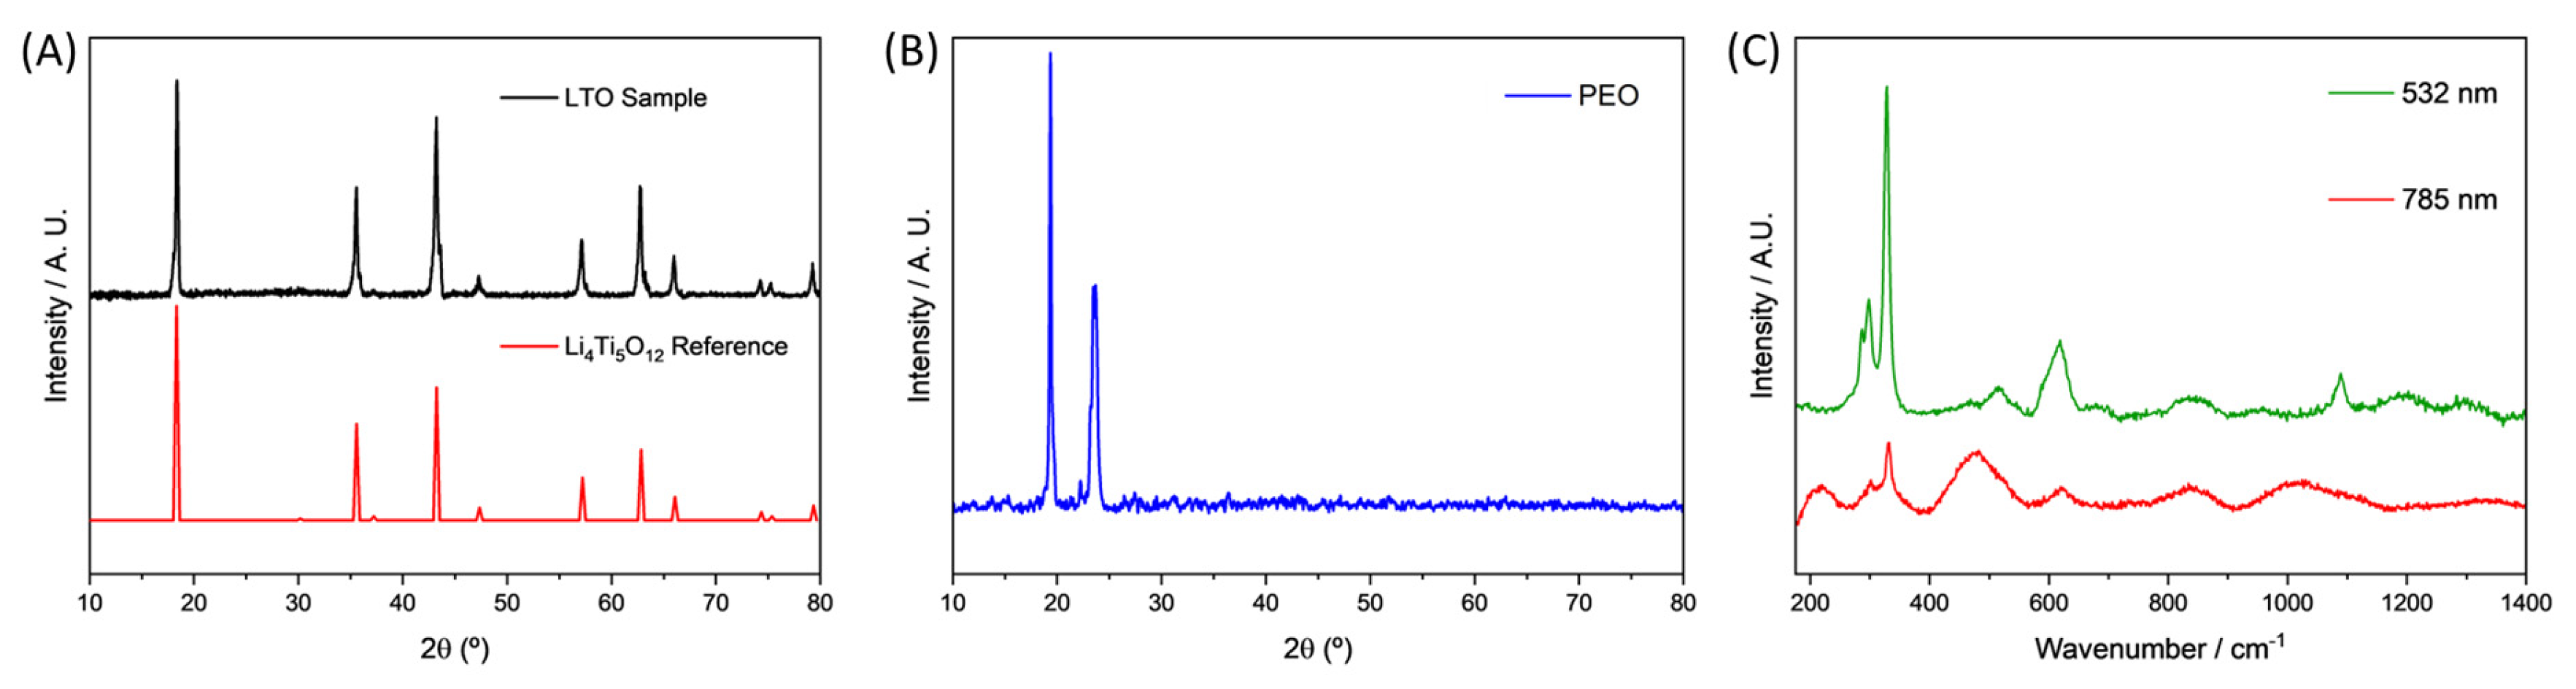
2.1. X-ray Diffraction

X-ray diffraction (XRD) patterns of the as-prepared sample were collected using a Bruker D8 Discover (Bruker, Billerica, MA, USA) diffractometer with θ/2θ Bragg–Brentano geometry, with monochromatic Cu radiation: Kα1 = 1.54056 Å. All samples were mounted inside an atmosphere-protective PXRD sample holder with a Kapton film cover.

2.2. Raman Characterization

Raman spectra were collected at room temperature (ca. 23 °C) with a Raman microscope (Renishaw In Via confocal Raman, Reinshaw, Wotton-under-Edge, UK), using a 532 or 785 nm wavelength laser focused through an inverted microscope (Leica, Wetzlar, Germany), via a 50× objective (Leica).
Suitable filters were used to minimize the laser power at the surface to <5 mW μm2. All samples were measured inside a sealed collection cell, under argon atmosphere, the covering slides of which were made from Raman inactive materials.

2.3. Defocused Micro-SORS

This technique was used to perform layer-by-layer depth analysis. The excitation and collection zones of Raman scattering were enlarged by moving the microscope objective out of the focusing position on the top surface of the samples. The moving distance is from ca. 5 to 15 μm per step, depending on the thickness of the layer being probed, while Raman signals from the sublayer under investigation constantly improve until the best signal intensities are achieved. A 532 nm wavelength laser was used in this work, with minimized laser power. Fluorescence and ambient light were removed from the background.

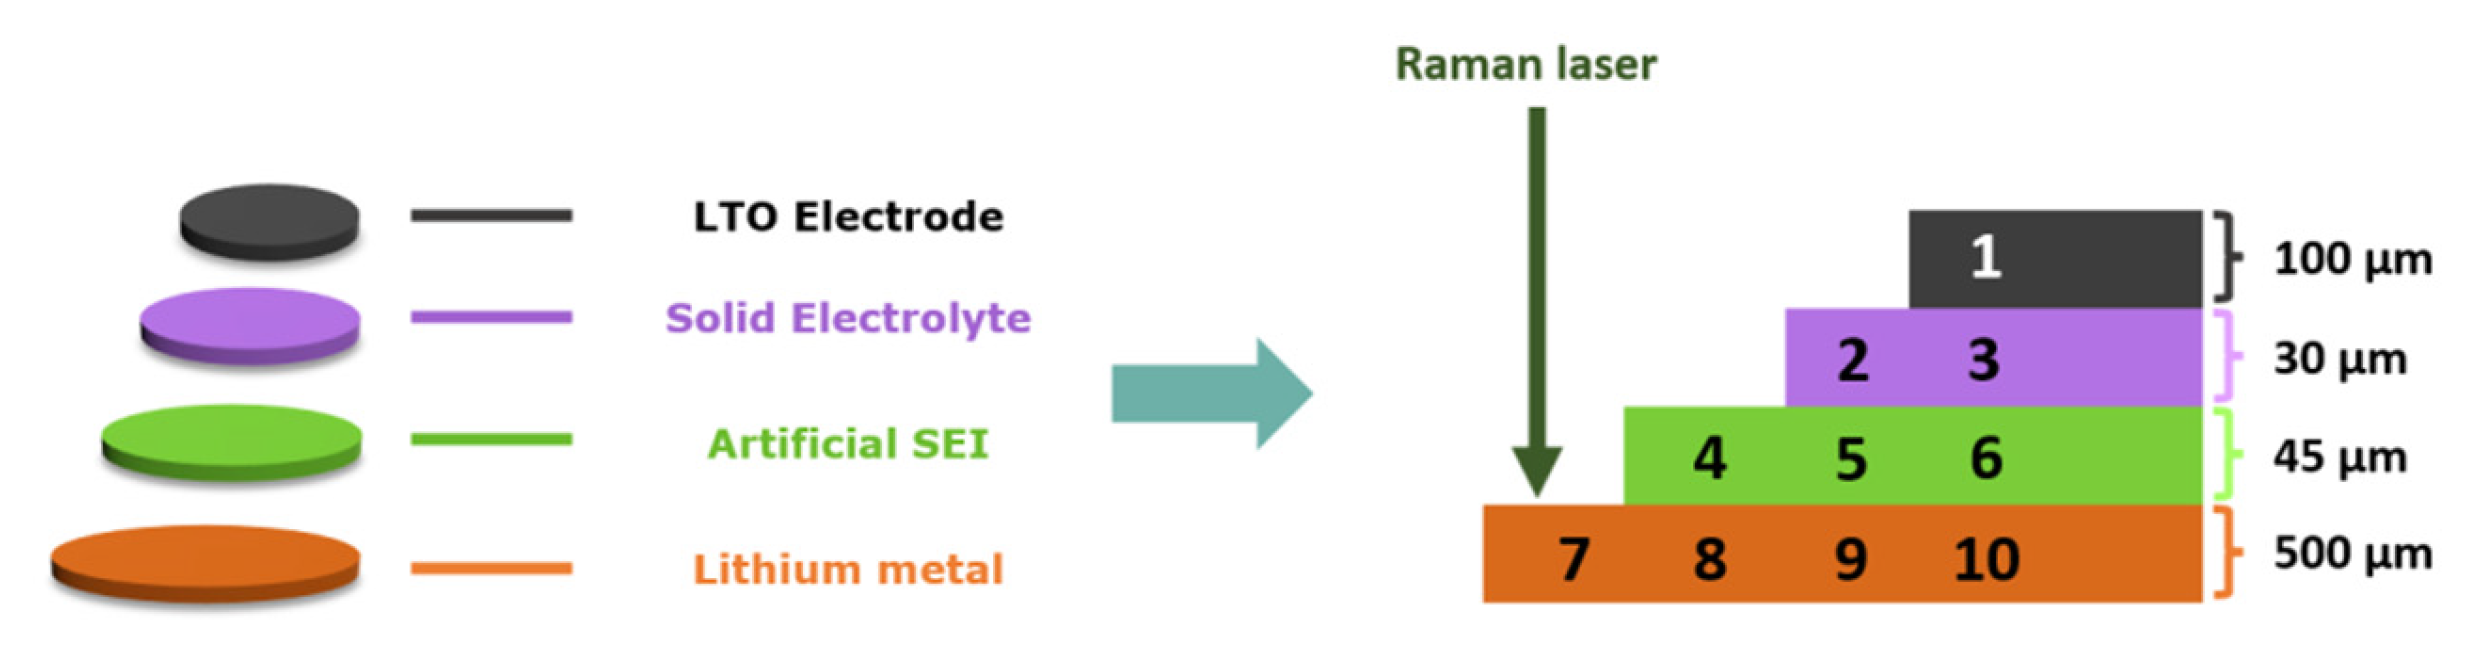
2.4. Step-Like System Assembly

To enable investigation of the applicability of SORS to typical solid-state battery constituents, a “step-like” system (see Figure 1) was constructed so that each possible configuration (from completely exposed to covered by all previous layers) could be measured.
The preparation of the four used components was carried out as follows, with all procedures undertaken in an argon-filled glovebox (<0.1 ppm O2, <0.1 ppm H2O). The catholyte was prepared by mixing polyethylene oxide (PEO, Sigma Aldrich (Darmstadt, Germany), Mw = 5 × 10⁶) and LiTFSI (lithium bis(trifluoromethanesulfonyl)imide, Solvionic (Toulouse, France)) in a 20:1 molar ratio overnight at 200 rpm in acetonitrile. The cathode was prepared, as previously described, by mixing LTO (lithium titanate, Sigma Aldrich) nanopowder with the preprepared catholyte such that the final ratio was LTO: catholyte 72:28, using an IKA ULTRA-TURRAX® (IKA, Wilmington, NC, USA) disperser [42]. This was then cast at a thickness of 400 μm using a K control coater (by RK Print Coat Instruments, Royston, UK). The solid electrolyte was prepared by mixing PEO (Mw = 5 × 10⁶) and LiTFSI in the molar ratio 20:1 overnight at 200 rpm in acetonitrile. Subsequently, it was cast to a thickness of 1500 μm and dried at 50 °C. Finally, it was hot-pressed (3 T, 100 °C) to obtain a thickness of ca. 30 μm. The Li2CO3 artificial SEI preparation consisted of mixing PEO and Li2CO3 (lithium carbonate, Sigma Aldrich) in the molar ratio of 20:1 overnight at 200 rpm in acetonitrile. It was then cast at 1500 μm thickness and dried overnight at 50 °C. The thickness was adjusted by hot press to 50 μm. Finally, the components were assembled in the step-like configuration on a cleaned lithium metal counter electrode.

2.5. Electrode–Aperture System Assembly

To investigate the ability of SORS to analyze a typical solid-state cell configuration, an LTO cathode was prepared as described for the step-like system, with a small aperture made to enable the Raman laser to pass through.
This was integrated with the solid electrolyte and cleaned lithium metal counter electrode, and contacted under an Al current collector mesh in a configuration typical for Raman experiments where a conventional current collector would block the signal (see Figure 2).
This was then mounted inside an air-sensitive holder while inside an argon-filled glovebox (<0.1 ppm O2, <0.1 ppm H2O).

3. Results

3.1. Constituent Characterization

In order to examine the constituent components, analyses were carried out on LTO, PEO, and lithium metal samples. The X-ray diffraction (XRD) pattern of the received LTO powder (see Figure 3A) revealed it could be assigned to pure Li4Ti5O12 (though the breadth of the peaks indicated a degree of lack of crystallinity), while the XRD pattern of the PEO (see Figure 3B) revealed the characteristic two peaks at ca. 19° and 24°, as expected.
Raman spectroscopic analysis of the cleaned lithium metal was undertaken inside an air-sensitive holder using a 785 nm and a 532 nm wavelength Raman laser (see Figure 3C). From this, it could be seen that lithium hydroxide peaks were present on the metal surface at ca. 287, 297, and 328 cm−1 (which we tentatively attribute to Li–O stretching modes), suggesting that residual species may still be detected for lithium metal prepared for use as a counter electrode. Significantly, it can also be seen that these bands were more intense in the spectra obtained using the 532 nm than the 785 nm wavelength laser. This observation may be attributed to the energy level of photons produced by lasing a material being inversely proportional to the wavelength of the laser, leading to the lower wavelength of 532 nm producing the more energetic photons (and thus leading to a better signal-to-noise ratio for the resulting spectrum). Consequently, all future Raman measurements were performed using the 532 nm laser in order to maximize the signals of interest within the measured data.

3.2. Investigation into Defocused Micro-SORS Applicability Using a Step-Like System

To determine if micro-SORS may be suitable for analyzing typical solid-state cells, it was necessary to determine the ability of the Raman technique to extract data and information from regions of interest. Consequently, it was necessary to investigate which layers of typical solid-state system components the Raman might successfully analyze through which other layers.
This was carried out using the step-like system, so as to enable each possible configuration (from completely exposed to covered by all previous layers) to be investigated.

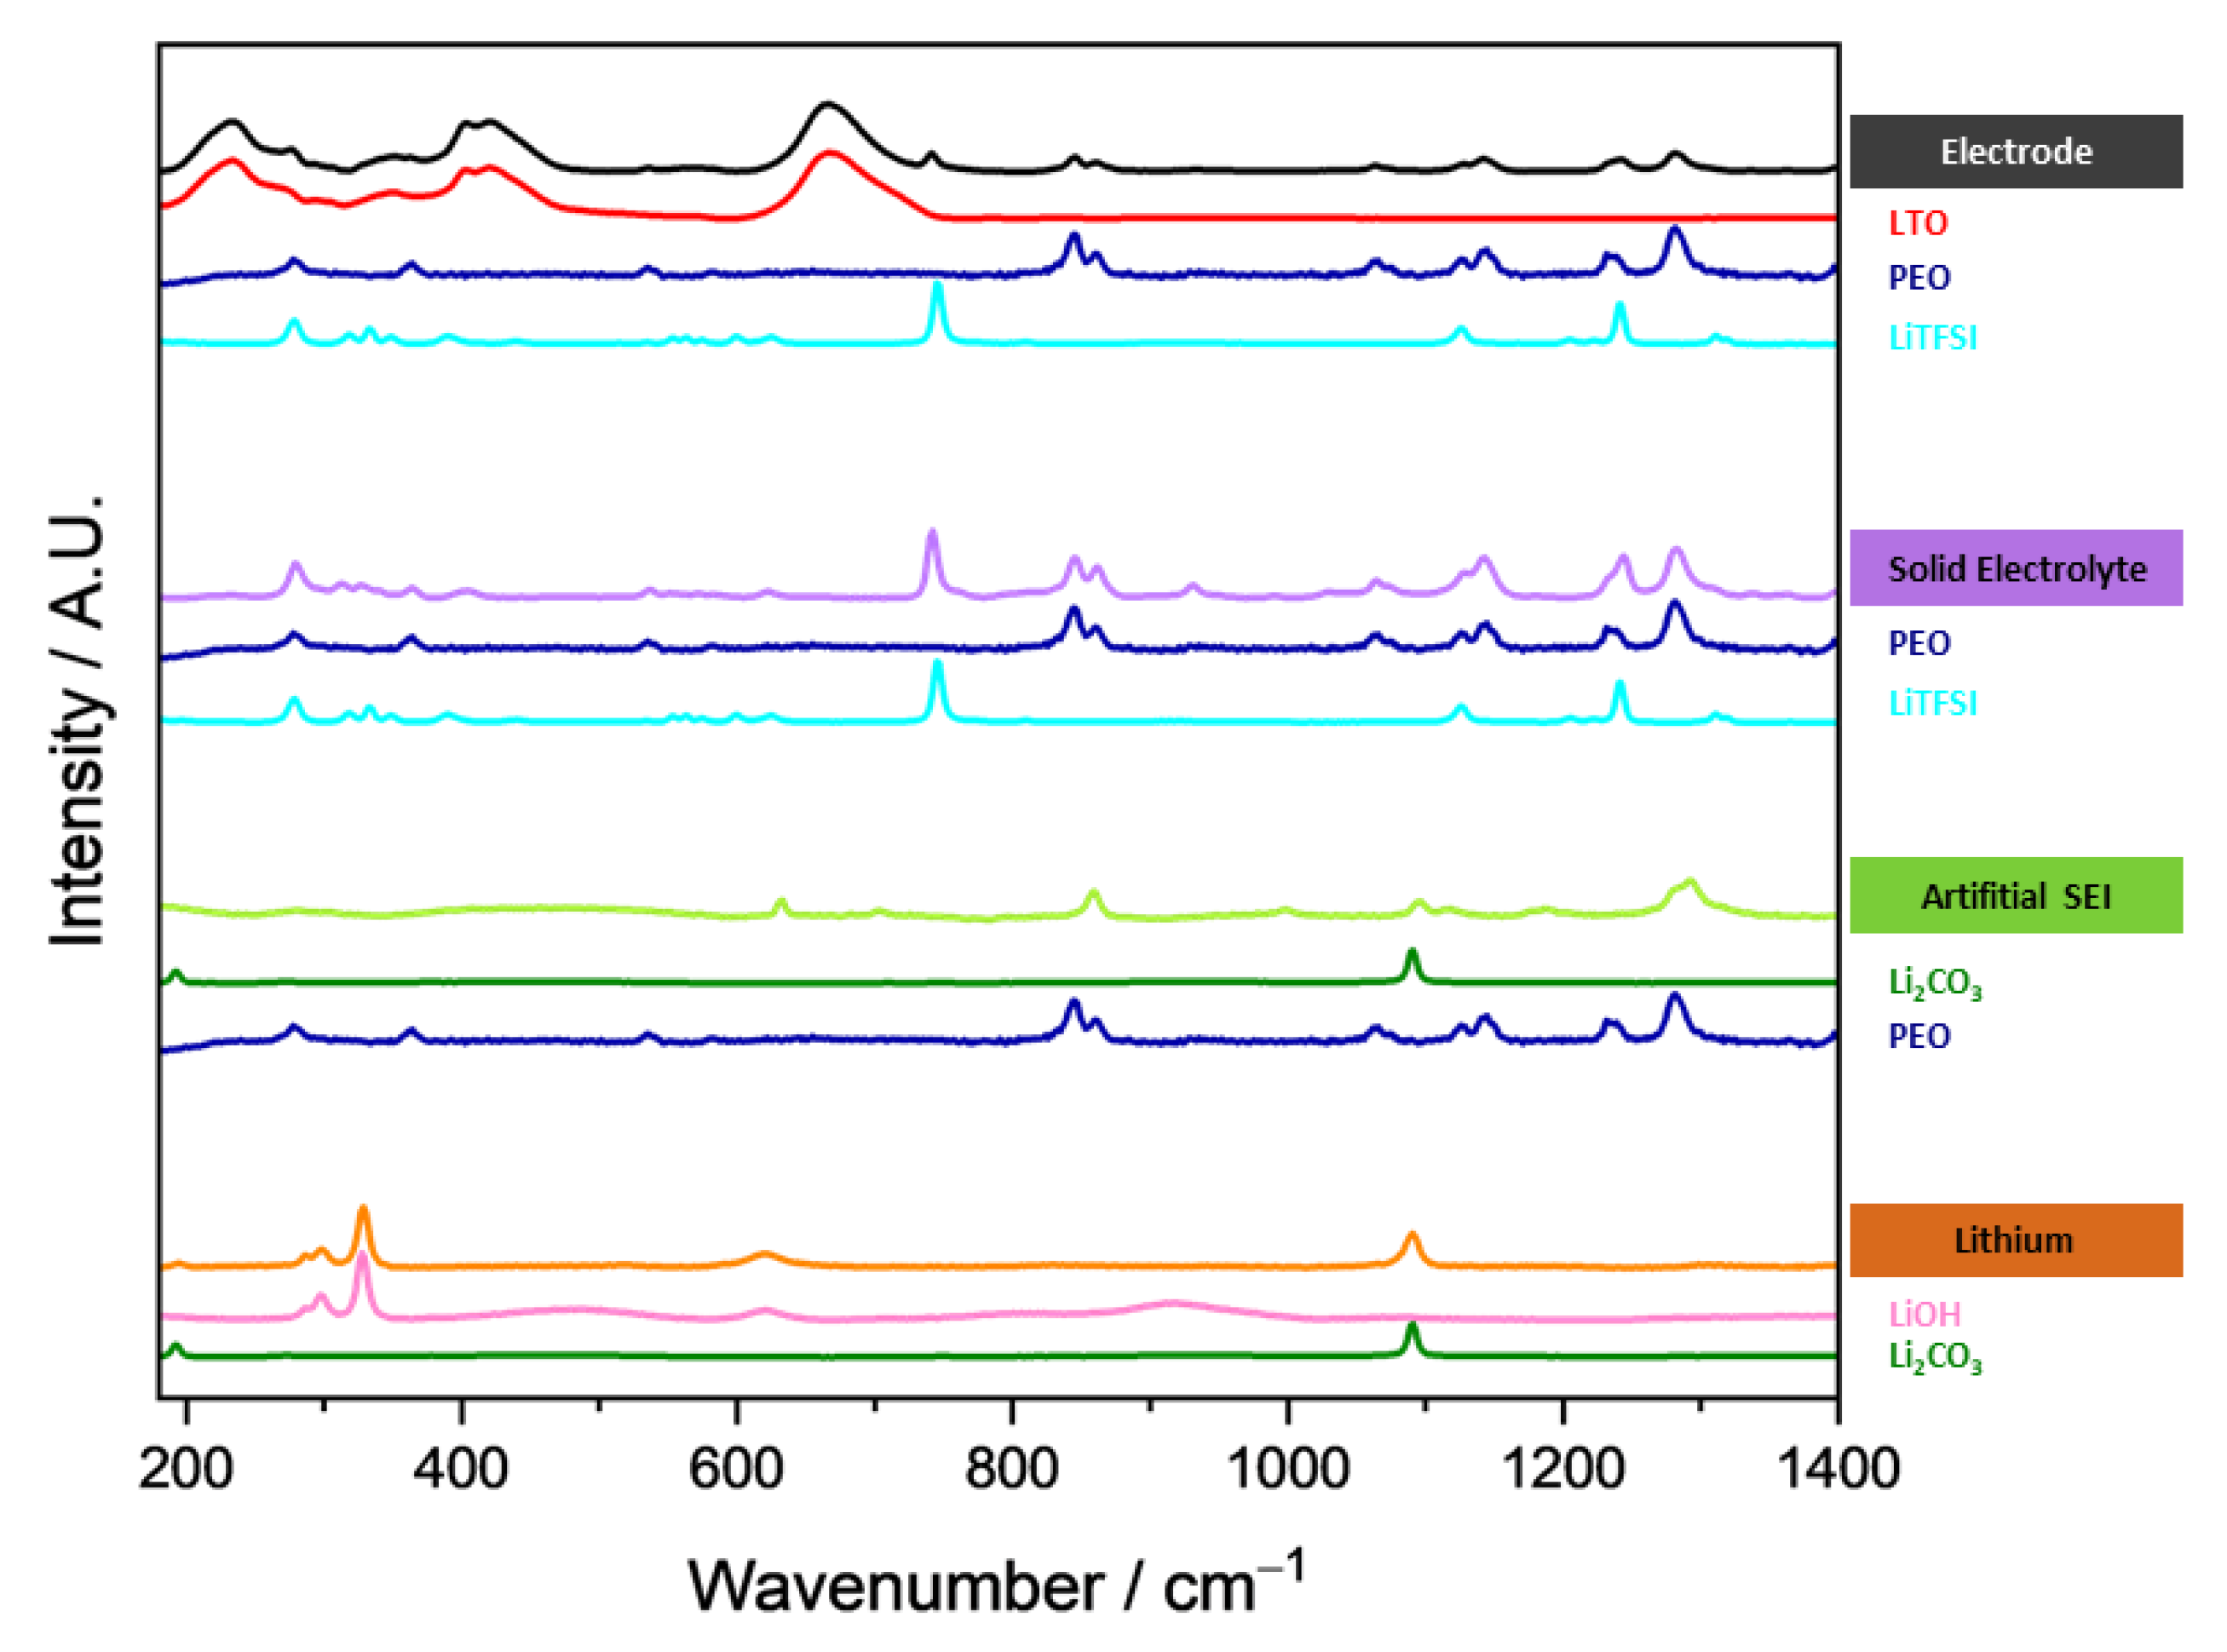
3.2.1. Raman Spectra of the Step-Like System Constituents

Initially, the Raman spectra for each of the individual components used were collected separately (see Figure 4), to enable identification of the characteristic signal peaks.
To facilitate easier identification, the most intense observed bands were identified for each of these components (see Table 1) and their modes assigned.
From this, it can be seen that the cleaned lithium metal foil indicated the existence of a residual surface (lithium metal itself has no signal, only contributing to fluorescence) predominantly belonging to lithium carbonate (peak at ca. 1090 cm−1, which represents the symmetric stretching of the carbonate anion) and lithium hydroxide (peaks at ca. 287, 297, and 328 cm−1).
While the presence of this signal enables detection of the lithium surface itself, it was important to be able to clearly determine if the interface between the lithium and the electrolyte could also be detected. For this reason, an additional “artificial SEI” layer consisting of Li2CO3 was included in the step-like system to both represent a species commonly found within SEIs and to provide a strong signal (peaks observable at 1090 cm−1) to facilitate detection. From the comparison of the spectra of the solid electrolyte with its constituents, it can be seen that there are peaks corresponding to LiTFSI (at 745 cm−1) and PEO (at 1241 cm−1). Additionally, examination of the LTO cathode spectra reveals significant signals from LiTFSI and PEO (resulting from the catholyte component), as well as those corresponding to the LTO (Li=O and Ti=O vibrations at 400–420 cm−1 and 663 cm−1, respectively).

3.2.2. Defocused Micro-SORS of Assembled Step-Like System

The system was assembled as described in the experimental section, with a “step-like” configuration. While not fully representative of the design of a conventional cell, this configuration was selected as it enabled the Raman laser to be focused on each of the layers of the step-like system before moving the beam laterally through covering layers. In this way, it was possible to collect information through a range of layer configurations, thus demonstrating the degree of Raman laser penetration (and, thus, applicability of this micro-SORS approach). Raman spectra were taken from each configuration and plotted (see Figure 5).
To aid analysis, tabulated values for the observed peaks and the estimated constituent contributions are given in the supporting information (see Tables S1–S10). From this data, the following key observations could be made:
  • The signal from the lithium surface (measurement 7) could be observed through the lithium carbonate artificial SEI (measurement 8), and through both the PEO/LiTFSI membrane and artificial SEI (measurement 9). However, this signal could not be observed through the LTO cathode (measurement 10).
  • The artificial SEI signal (measurement 4) could be observed through the PEO/LiTFSI membrane (measurement 5), but not the LTO cathode (measurement 6).
  • The PEO/LiTFSI membrane (measurement 2) itself could not be observed through the LTO cathode (measurement 3), as the associated visible PEO and LiTFSI peaks are from the catholyte, and no significant additional contribution from the membrane could be detected.
To summarize, while configurations of the lithium surface, artificial SEI, and PEO/LiTFSI membrane enabled this layer-by-layer detection approach, the LTO cathode signal overwhelmed the signals of the other layers and thus prevented measurement. This demonstrates that, for micro-SORS to be used in a typical solid-state cell, it will either be necessary to find a way to enhance the signals of the desired layers, or to engineer the system in such a way that there are regions where there is an absence of the obscuring layers.

3.3. Investigation into Micro-SORS Applicability Using an Electrode–Aperture System

One simple approach to overcoming the issues highlighted by the step-like configuration would be to use a conventional solid-state system (though with a mesh-like current collector through which the Raman laser may pass), and to induce a small aperture(s) in the LTO electrode to enable measurement of the layers beneath. To validate this specific approach, an electrode–aperture system was assembled, and Raman measurements were taken from the LTO electrode and from the solid electrolyte and lithium metal (see Figure 6).
In order to investigate the ability of this configuration to enable key spectra to be collected from areas of interest, spectra were collected from the LTO electrode surface (see Figure 6A), the solid electrolyte through the aperture (see Figure 6B), and the lithium metal electrode through the aperture and the solid electrolyte (see Figure 6C), and plotted along with comparison spectra of their relevant constituents. To better see the lithium metal signal in the spectrum taken of the lithium electrode through the solid electrolyte (lithium electrode, see Figure 6C), a mathematical subtraction of the electrolyte contribution was performed (the spectrum of the solid electrolyte was normalized with respect to that taken of the lithium electrode based on the intensities of nonoverlapping peaks, then subtracted) and the extracted spectrum (extracted lithium) was plotted along with the spectrum taken of the bare lithium metal itself for comparison (see Figure 6D). From this data, the following key observations could be made:
  • As in conventional Raman cells used for in situ measurements, it was possible to measure the LTO cathode through the mesh current collector.
  • Additionally, the solid electrolyte could be easily detected through the electrode aperture, implying that this approach would be appropriate for detecting the electrolyte and subsequent layers within a conventional configuration.
  • Finally, a signal at ca. 1850 cm−1 observed for the bare lithium metal could also be detected in the lithium metal spectrum obtained through the solid electrolyte (this band may be attributed to the stretching mode for a C≡C group within residual surface Li2C2) [60]. This demonstrates that it is possible to use the electrode–aperture configuration to nondestructively investigate layers beneath the solid electrolyte.
To summarize, by introducing a small aperture into the LTO electrode, it was possible to obtain Raman data from all other layers. This strongly suggests that a similar approach might be applicable when carrying out in situ or ex situ Raman of future solid-state systems. It is believed that by introducing several apertures of suitable sizes, at suitable distances, it will be possible to undertake spectroscopic depth profiling of areas of interest within a wide range of solid-state systems.

4. Discussion

Given that future solid-state battery development has a strong dependence on a detailed understanding of the physicochemical changes occurring during aging and cycling, the development of novel approaches to nondestructive analysis capable of providing such additional information provides a powerful tool to enhance insight, and subsequently performance, particularly during operational life. To help further development of Raman spectroscopy for solid-state battery characterization, we systematically applied defocused spatially offset Raman spectroscopy to systems composed of typical solid-state battery components for the first time.
The fact that it was possible to collect spectra through an artificial SEI and a PEO/LiTFSI membrane validates the viability of the technique, and that it is, in principle, possible to carry out nondestructive Raman depth profiling of an assembled solid-state system. Significantly, it was not possible, using the step-like configuration, to obtain a signal through the LTO cathode layer due to the strength of its signal. This represents a challenge, and so it is important to note that, when considering approaches to detecting spectra obscured by the cathode’s signal, the scattering intensities of the components will need to be accounted for (typically this depends on a variety of factors, including the concentration and the Raman cross-section, and has a weak dependence on the wavelength of the exciting laser). Thus, future work should likely focus on determining optimal cell designs. Subsequently, consideration could then be given to extending this technique to solid-state systems which have undergone electrochemical cycling (to enable ex situ and/or in situ nondestructive depth profiling of the changes undergone during cycling), then to enhancing signals further still, so as to facilitate more sensitive detection (for example, enhancement of the Raman signal of specific layers and/or interfaces/interphases, in order to probe defects and their formation within the solid-state batteries).
In order to provide a potential cell design capable of enabling micro-SORS, we considered the use of an aperture in the electrode through which Raman measurements might be taken. Our preliminary results show that this approach worked well, enabling data to be taken from the electrode and from the layers beneath the electrode in a configuration typical for solid-state systems. While the use of the aperture might introduce some degree of complexity when undertaking future Raman experiments, the possibility of probing layers and interfaces hitherto unmeasurable by nondestructive techniques offers a great deal of promise and the tantalizing possibility of enriching the solid-state battery research field.
In summary, the results presented here demonstrate, for the first time, the potential of spatially offset Raman spectroscopy for the characterization of typical solid-state cells, particularly with respect to nondestructive depth profiling analysis, allowing investigation of components not typically observable without cell disassembly and postmortem studies. In this way, this study presents a new alternative to existing nondestructive characterization methodologies, as well as a potential significant extension to the already widespread use of Raman spectroscopy within this field, which would offer a new perspective on identification of solid-state cell constituents (and the changes they may undergo during cycling and aging) in order to support future research and development.

Supplementary Materials

The following supporting information can be downloaded at: https://www.mdpi.com/article/10.3390/batteries9010020/s1, Figure S1: Schematic of the positions designed numerically for the micro- SORS; Tables S1–S10: Component contribution to Spectra 1–10.

Author Contributions

Conceptualization, N.E.D. and E.B.; methodology, E.J.-B., Y.Z., N.E.D., P.L.-A. and E.B.; validation, E.J.-B. and Y.Z.; formal analysis, E.J.-B. and Y.Z.; investigation, E.J.-B. and Y.Z.; resources, Y.Z. and P.L.-A.; data curation, E.J.-B.; writing—original draft preparation, E.J.-B. and N.E.D.; writing—review and editing, E.J.-B., Y.Z., N.E.D., P.L.-A., E.Z. and E.B.; visualization, E.J.-B.; supervision, E.Z. and E.B.; project administration, E.B.; funding acquisition, E.B. All authors have read and agreed to the published version of the manuscript.

Funding

This research received no external funding.

Data Availability Statement

Data are contained within the article.

Acknowledgments

Edurne Barquero thanks CIC energiGUNE for funding her Ph.D. fellowship. In addition, the authors gratefully acknowledge the support of Nuria Gomez, Ariana Pesce, Uxue Gonzalez, and Ander Orue regarding the fabrication of the solid-state system constituents and assembly.

Conflicts of Interest

The authors declare no conflict of interest. The funders had no role in the design of the study; in the collection, analyses, or interpretation of data; in the writing of the manuscript; or in the decision to publish the results.

References

  1. Tang, L.; Liu, Y.; Wei, H.; Yan, C.; He, Z.; Li, Y.; Zheng, J. Boosting Cell Performance of LiNi0.8Co0.1Mn0.1O2 Cathode Material via Structure Design. J. Energy Chem. 2021, 55, 114–123. [Google Scholar] [CrossRef]
  2. Goodenough, J.B.; Park, K.-S. The Li-Ion Rechargeable Battery: A Perspective. J. Am. Chem. Soc. 2013, 135, 1167–1176. [Google Scholar] [CrossRef]
  3. Li, C.; Wang, Z.; He, Z.; Li, Y.; Mao, J.; Dai, K.; Yan, C.; Zheng, J. An Advance Review of Solid-State Battery: Challenges, Progress and Prospects. Sustain. Mater. Technol. 2021, 29, e00297. [Google Scholar] [CrossRef]
  4. Deng, D. Li-Ion Batteries: Basics, Progress, and Challenges. Energy Sci. Eng. 2015, 3, 385–418. [Google Scholar] [CrossRef]
  5. Armand, M.; Tarascon, J.-M. Building Better Batteries. Nature 2008, 451, 652–657. [Google Scholar] [CrossRef]
  6. Zubi, G.; Dufo-López, R.; Carvalho, M.; Pasaoglu, G. The Lithium-Ion Battery: State of the Art and Future Perspectives. Renew. Sustain. Energy Rev. 2018, 89, 292–308. [Google Scholar] [CrossRef]
  7. Wen, J.; Yu, Y.; Chen, C. A Review on Lithium-Ion Batteries Safety Issues: Existing Problems and Possible Solutions. Mat. Express 2012, 2, 197–212. [Google Scholar] [CrossRef]
  8. Wang, Q.; Mao, B.; Stoliarov, S.I.; Sun, J. A Review of Lithium Ion Battery Failure Mechanisms and Fire Prevention Strategies. Prog. Energy Combust. Sci. 2019, 73, 95–131. [Google Scholar] [CrossRef]
  9. Liu, Q.; Su, X.; Lei, D.; Qin, Y.; Wen, J.; Guo, F.; Wu, Y.A.; Rong, Y.; Kou, R.; Xiao, X.; et al. Approaching the Capacity Limit of Lithium Cobalt Oxide in Lithium Ion Batteries via Lanthanum and Aluminium Doping. Nat. Energy 2018, 3, 936–943. [Google Scholar] [CrossRef]
  10. Pasta, M.; Armstrong, D.; Brown, Z.L.; Bu, J.; Castell, M.R.; Chen, P.; Cocks, A.; Corr, S.A.; Cussen, E.J.; Darnbrough, E.; et al. 2020 Roadmap on Solid-State Batteries. J. Phys. Energy 2020, 2, 032008. [Google Scholar] [CrossRef]
  11. Manthiram, A.; Yu, X.; Wang, S. Lithium Battery Chemistries Enabled by Solid-State Electrolytes. Nat. Rev. Mater. 2017, 2, 16103. [Google Scholar] [CrossRef]
  12. Wang, M.J.; Choudhury, R.; Sakamoto, J. Characterizing the Li-Solid-Electrolyte Interface Dynamics as a Function of Stack Pressure and Current Density. Joule 2019, 3, 2165–2178. [Google Scholar] [CrossRef]
  13. Yang, M.; Mo, Y. Interfacial Defect of Lithium Metal in Solid-State Batteries. Angew. Chem. 2021, 133, 21664–21671. [Google Scholar] [CrossRef]
  14. Kasemchainan, J.; Zekoll, S.; Spencer Jolly, D.; Ning, Z.; Hartley, G.O.; Marrow, J.; Bruce, P.G. Critical Stripping Current Leads to Dendrite Formation on Plating in Lithium Anode Solid Electrolyte Cells. Nat. Mater. 2019, 18, 1105–1111. [Google Scholar] [CrossRef]
  15. Xu, L.; Tang, S.; Cheng, Y.; Wang, K.; Liang, J.; Liu, C.; Cao, Y.-C.; Wei, F.; Mai, L. Interfaces in Solid-State Lithium Batteries. Joule 2018, 2, 1991–2015. [Google Scholar] [CrossRef] [Green Version]
  16. Orue, A.; Arrese-Igor, M.; Cid, R.; Júdez, X.; Gómez, N.; López del Amo, J.M.; Manalastas, W.; Srinivasan, M.; Rojviriya, C.; Armand, M.; et al. Enhancing the Polymer Electrolyte–Li Metal Interface on High-Voltage Solid-State Batteries with Li-Based Additives Inspired by the Surface Chemistry of Li7La3Zr2O12. J. Mater. Chem. A 2022, 10, 2352–2361. [Google Scholar] [CrossRef]
  17. Baddour-Hadjean, R.; Pereira-Ramos, J.-P. Raman Microspectrometry Applied to the Study of Electrode Materials for Lithium Batteries. Chem. Rev. 2010, 110, 1278–1319. [Google Scholar] [CrossRef]
  18. Tripathi, A.M.; Su, W.-N.; Hwang, B.J. In Situ Analytical Techniques for Battery Interface Analysis. Chem. Soc. Rev. 2018, 47, 736–851. [Google Scholar] [CrossRef]
  19. Flores, E.; Novák, P.; Berg, E.J. In Situ and Operando Raman Spectroscopy of Layered Transition Metal Oxides for Li-Ion Battery Cathodes. Front. Energy Res. 2018, 6, 82. [Google Scholar] [CrossRef]
  20. Flores, E.; Novák, P.; Aschauer, U.; Berg, E.J. Cation Ordering and Redox Chemistry of Layered Ni-Rich LixNi1–2yCoyMnyO2: An Operando Raman Spectroscopy Study. Chem. Mater. 2020, 32, 186–194. [Google Scholar] [CrossRef]
  21. Jehnichen, P.; Korte, C. Operando Raman Spectroscopy Measurements of a High-Voltage Cathode Material for Lithium-Ion Batteries. Anal. Chem. 2019, 91, 8054–8061. [Google Scholar] [CrossRef] [PubMed]
  22. Matsuda, Y.; Kuwata, N.; Okawa, T.; Dorai, A.; Kamishima, O.; Kawamura, J. In Situ Raman Spectroscopy of Li CoO2 Cathode in Li/Li3PO4/LiCoO2 All-Solid-State Thin-Film Lithium Battery. Solid State Ion. 2019, 335, 7–14. [Google Scholar] [CrossRef]
  23. Otoyama, M.; Ito, Y.; Sakuda, A.; Tatsumisago, M.; Hayashi, A. Reaction Uniformity Visualized by Raman Imaging in the Composite Electrode Layers of All-Solid-State Lithium Batteries. Phys. Chem. Chem. Phys. 2020, 22, 13271–13276. [Google Scholar] [CrossRef] [PubMed]
  24. Wynn, T.A.; Lee, J.Z.; Banerjee, A.; Meng, Y.S. In Situ and Operando Probing of Solid–Solid Interfaces in Electrochemical Devices. MRS Bull. 2018, 43, 768–774. [Google Scholar] [CrossRef] [Green Version]
  25. Long, D.A. The Raman Effect: A Unified Treatment of the Theory of Raman Scattering by Molecules; Wiley: New York, NY, USA, 2002; ISBN 978-0-471-49028-9. [Google Scholar]
  26. Ferraro, J.R.; Nakamoto, K.; Brown, C.W. Introductory Raman Spectroscopy, 2nd ed.; Academic Press: Boston, MA, USA, 2003; ISBN 978-0-12-254105-6. [Google Scholar]
  27. Mosca, S.; Conti, C.; Stone, N.; Matousek, P. Spatially Offset Raman Spectroscopy. Nat. Rev. Methods Prim. 2021, 1, 21. [Google Scholar] [CrossRef]
  28. Mosca, S.; Dey, P.; Salimi, M.; Gardner, B.; Palombo, F.; Stone, N.; Matousek, P. Spatially Offset Raman Spectroscopy-How Deep? Anal. Chem. 2021, 93, 6755–6762. [Google Scholar] [CrossRef]
  29. Born, M.; Wolf, E. Principles of Optics: Electromagnetic Theory of Propagation, Interference and Diffraction of Light; Elsevier: Amsterdam, The Netherlands, 2013. [Google Scholar]
  30. Chao, K.; Dhakal, S.; Qin, J.; Kim, M.S.; Peng, Y.; Schmidt, W.F. Depth of Penetration of a 785 nm Wavelength Laser in Food Powders. In Proceedings of the Sensing for Agriculture and Food Quality and Safety VII, Baltimore, MD, USA, 20–24 April 2015; Volume 9488, pp. 111–119. [Google Scholar]
  31. Sekar, S.K.V.; Mosca, S.; Farina, A.; Martelli, F.; Taroni, P.; Valentini, G.; Cubeddu, R.; Pifferi, A. Frequency Offset Raman Spectroscopy (FORS) for Depth Probing of Diffusive Media. Opt. Express OE 2017, 25, 4585–4597. [Google Scholar] [CrossRef] [Green Version]
  32. Mosca, S.; Lanka, P.; Stone, N.; Sekar, S.K.V.; Matousek, P.; Valentini, G.; Pifferi, A. Optical Characterization of Porcine Tissues from Various Organs in the 650–1100 Nm Range Using Time-Domain Diffuse Spectroscopy. Biomed. Opt. Express 2020, 11, 1697–1706. [Google Scholar] [CrossRef]
  33. Mosca, S.; Dey, P.; Salimi, M.; Gardner, B.; Palombo, F.; Stone, N.; Matousek, P. Estimating the Reduced Scattering Coefficient of Turbid Media Using Spatially Offset Raman Spectroscopy. Anal. Chem. 2021, 93, 3386–3392. [Google Scholar] [CrossRef]
  34. Eliasson, C.; Matousek, P. Noninvasive Authentication of Pharmaceutical Products through Packaging Using Spatially Offset Raman Spectroscopy. Anal. Chem. 2007, 79, 1696–1701. [Google Scholar] [CrossRef]
  35. Matousek, P.; Parker, A.W. Non-Invasive Probing of Pharmaceutical Capsules Using Transmission Raman Spectroscopy. J. Raman Spectrosc. 2007, 38, 563–567. [Google Scholar] [CrossRef]
  36. Eliasson, C.; Macleod, N.A.; Matousek, P. Noninvasive Detection of Concealed Liquid Explosives Using Raman Spectroscopy. Anal. Chem. 2007, 79, 8185–8189. [Google Scholar] [CrossRef] [PubMed]
  37. Ellis, D.I.; Cowcher, D.P.; Ashton, L.; O’Hagan, S.; Goodacre, R. Illuminating Disease and Enlightening Biomedicine: Raman Spectroscopy as a Diagnostic Tool. Analyst 2013, 138, 3871. [Google Scholar] [CrossRef] [PubMed] [Green Version]
  38. Qin, J.; Chao, K.; Kim, M.S. Nondestructive Evaluation of Internal Maturity of Tomatoes Using Spatially Offset Raman Spectroscopy. Postharvest Biol. Technol. 2012, 71, 21–31. [Google Scholar] [CrossRef]
  39. Conti, C.; Botteon, A.; Colombo, C.; Pinna, D.; Realini, M.; Matousek, P. Advances in Raman Spectroscopy for the Non-Destructive Subsurface Analysis of Artworks: Micro-SORS. J. Cult. Herit. 2020, 43, 319–328. [Google Scholar] [CrossRef]
  40. Botteon, A.; Yiming, J.; Prati, S.; Sciutto, G.; Realini, M.; Colombo, C.; Castiglioni, C.; Matousek, P.; Conti, C. Non-Invasive Characterisation of Molecular Diffusion of Agent into Turbid Matrix Using Micro-SORS. Talanta 2020, 218, 121078. [Google Scholar] [CrossRef]
  41. Tournié, A.; Fleischer, K.; Bukreeva, I.; Palermo, F.; Perino, M.; Cedola, A.; Andraud, C.; Ranocchia, G. Ancient Greek Text Concealed on the Back of Unrolled Papyrus Revealed through Shortwave-Infrared Hyperspectral Imaging. Sci. Adv. 2019, 5, eaav8936. [Google Scholar] [CrossRef] [Green Version]
  42. Orue Mendizabal, A.; Gomez, N.; Aguesse, F.; López-Aranguren, P. Designing Spinel Li4Ti5O12 Electrode as Anode Material for Poly(Ethylene)Oxide-Based Solid-State Batteries. Materials 2021, 14, 1213. [Google Scholar] [CrossRef]
  43. Brooker, M.H.; Bates, J.B. Raman and Infrared Spectral Studies of Anhydrous Li2CO3 and Na2CO3. J. Chem. Phys. 1971, 54, 4788–4796. [Google Scholar] [CrossRef]
  44. Kohara, S.; Koura, N.; Idemoto, Y.; Takahashi, S.; Saboungi, M.-L.; Curtiss, L.A. The Structure of LiKCO3 Studied by Ab Initio Calculations and Raman Spectroscopy. J. Phys. Chem. Solids 1998, 59, 1477–1485. [Google Scholar] [CrossRef]
  45. Koura, N.; Kohara, S.; Takeuchi, K.; Takahashi, S.; Curtiss, L.A.; Grimsditch, M.; Saboungi, M.-L. Alkali Carbonates: Raman Spectroscopy, Ab Initio Calculations, and Structure. J. Mol. Struct. 1996, 382, 163–169. [Google Scholar] [CrossRef]
  46. Midouni, A.; Houchati, M.I.; Selmi, W.; Jaouadi, M.; Yahya, M.; Hamzaoui, A.H. Investigation of Pr0.2Ce0.8O2-Δ@Li2CO3 Nanocomposite Electrolytes as Intermediate Temperature Ionic Conductors: A Thermal, Structural, and Morphological Insight. J. Solid State Electrochem. 2019, 23, 2465–2475. [Google Scholar] [CrossRef]
  47. Stowe, A.C.; Smyrl, N. Raman Spectroscopy of Lithium Hydride Corrosion: Selection of Appropriate Excitation Wavelength to Minimize Fluorescence. Vib. Spectrosc. 2012, 60, 133–136. [Google Scholar] [CrossRef] [Green Version]
  48. Anderson, A.; Lüty, F. Raman Scattering, Defect Luminescence, and Phonon Spectra of 7LiH, 6LiH, and 7LiD Crystals. Phys. Rev. B 1983, 28, 3415–3421. [Google Scholar] [CrossRef]
  49. Hase, Y.; Pagotto Yoshida, I.V. The Raman Active Vibrational Modes and Isotopic Effects of Four Isotopically Substituted Lithium Hydroxides. Chem. Phys. Lett. 1979, 65, 46–49. [Google Scholar] [CrossRef]
  50. Ding, P.; Lin, Z.; Guo, X.; Wu, L.; Wang, Y.; Guo, H.; Li, L.; Yu, H. Polymer Electrolytes and Interfaces in Solid-State Lithium Metal Batteries. Mater. Today 2021, 51, 449–474. [Google Scholar] [CrossRef]
  51. Lahiri, A.S.; Schubert, T.J.; Iliev, B.; Endres, F. LiTFSI in 1-Butyl-1-Methylpyrrolidinium Bis(Fluorosulfonyl)Amide: A Possible Electrolyte for Ionic Liquid Based Lithium Ion Batteries. Phys. Chem. Chem. Phys. 2015, 17, 11161–11164. [Google Scholar] [CrossRef] [Green Version]
  52. Suo, L.; Zheng, F.; Hu, Y.-S.; Chen, L. FT-Raman Spectroscopy Study of Solvent-in-Salt Electrolytes. Chin. Phys. B 2016, 25, 016101. [Google Scholar] [CrossRef]
  53. Liu, T.; Danten, Y.; Grondin, J.; Vilar, R. Solvation of AgTFSI in 1-Ethyl-3-Methylimidazolium Bis(Trifluoromethylsulfonyl)Imide Ionic Liquid Investigated by Vibrational Spectroscopy and DFT Calculations. J. Raman Spectrosc. 2016, 47, 449–456. [Google Scholar] [CrossRef]
  54. Elashmawi, I.S.; Gaabour, L.H. Raman, Morphology and Electrical Behavior of Nanocomposites Based on PEO/PVDF with Multi-Walled Carbon Nanotubes. Results Phys. 2015, 5, 105–110. [Google Scholar] [CrossRef]
  55. Zhu, C.; Liu, J.; Yu, X.; Zhang, Y.; Zhang, Y.; Jiang, X.; Wang, S.; Wang, Q.; Dong, P. Enhance the Electrochemical Performance of Li4Ti5O12 with Co Doping via a Facile Mechanical Activation Strategy. J. Mater. Sci. Mater. Electron. 2019, 30, 5866–5873. [Google Scholar] [CrossRef]
  56. Chou, S.-L.; Wang, J.-Z.; Liu, H.-K.; Dou, S.-X. Rapid Synthesis of Li4Ti5O12 Microspheres as Anode Materials and Its Binder Effect for Lithium-Ion Battery. J. Phys. Chem. C 2011, 115, 16220–16227. [Google Scholar] [CrossRef]
  57. Zhang, Q.; Peng, W.; Wang, Z.; Li, X.; Xiong, X.; Guo, H.; Wang, Z.; Wu, F. Synthesis and Characterization of Li4Ti5O12/Graphene Composite as Anode Material with Enhanced Electrochemical Performance. Ionics 2013, 19, 717–723. [Google Scholar] [CrossRef]
  58. Tang, Y.; Huang, F.; Zhao, W.; Liu, Z.; Wan, D. Synthesis of Graphene-Supported Li4Ti5O12 Nanosheets for High Rate Battery Application. J. Mater. Chem. 2012, 22, 11257–11260. [Google Scholar] [CrossRef]
  59. Mulder, G.; Omar, N.; Pauwels, S.; Leemans, F.; Verbrugge, B.; De Nijs, W.; Van den Bossche, P.; Six, D.; Van Mierlo, J. Enhanced Test Methods to Characterise Automotive Battery Cells. J. Power Sources 2011, 196, 10079–10087. [Google Scholar] [CrossRef]
  60. Naudin, C.; Bruneel, J.L.; Chami, M.; Desbat, B.; Grondin, J.; Lassègues, J.C.; Servant, L. Characterization of the Lithium Surface by Infrared and Raman Spectroscopies. J. Power Sources 2003, 124, 518–525. [Google Scholar] [CrossRef]
Figure 1. The layers constituting the step-like system, and the subsequent assembly in this mode with layer thickness shown.
Batteries 09 00020 g001
Figure 2. The layers constituting the electrode–aperture system, and the subsequent assembly in this mode with layer thickness shown.
Batteries 09 00020 g002
Figure 3. (A) XRD pattern of the LTO sample (black), with a Li4Ti5O12 reference (red, JCPDS card no. 49-0207); (B) XRD pattern of the PEO; (C) Raman spectra taken of a cleaned lithium metal surface using a 532 nm (green) and a 785 nm (red) wavelength laser.
Batteries 09 00020 g003
Figure 4. Spectra of each system component (electrode, black; solid electrolyte, purple; artificial SEI, light green; lithium, orange), compared with the signals of their constituents (electrode constituents: LTO, red; PEO, dark blue; LiTFSI, cyan; solid electrolyte constituents: PEO, dark blue; LiTFSI, cyan; artificial SEI constituents: Li2CO3, dark green; PEO, dark blue; lithium constituents: LiOH, pink; Li2CO3, dark green).
Batteries 09 00020 g004
Figure 5. Raman spectra obtained from the step-like system by micro-SORS, with their positions designated numerically. For comparison, the obtained spectra of the layer constituents (as shown in Figure 4) are used as a reference to indicate the main peaks, which can be observed by *. Examination of the observable peaks in comparison to the layer depth at which they were measured demonstrates the degree to which the defocused micro-SORS was able to obtain spectroscopic data.
Batteries 09 00020 g005
Figure 6. Raman spectra obtained from (A) the LTO electrode (black) and its constituents (electrode constituents: LTO, red; PEO, dark blue; LiTFSI, cyan); (B) the solid electrolyte (purple) and its constituents (solid electrolyte constituents: PEO, dark blue; LiTFSI, cyan); (C) the lithium metal surface through the solid electrolyte (lithium electrode, brown), the solid electrolyte (purple), and bare lithium metal surface (lithium metal, orange); (D) a comparison of the bare lithium metal surface (lithium metal, orange) and the extracted lithium contribution (extracted lithium, dark red).
Batteries 09 00020 g006
Table 1. Assignations for most significant observed signals.
ComponentRaman Band
Position (cm−1)
AssignationRef.
Li2CO31090C–O bond symmetric stretching[43,44,45,46]
LiOH287
297
328
Li–O stretching[47,48,49,50]
LiTFSI745S–N–S stretching[51,52,53]
PEO845
862
Hydroxyl end groups[54]
PEO1241Disordered or amorphous portions of the polymer chain[54]
LTO233Bending vibration of O–Ti–O[55,56,57,58]
LTO400–420Stretching–bending vibrations of Li–O bonds in LiO4[55,56,57,58]
LTO663Vibration of Ti–O bond in TiO6 octahedra[55,56,57,58,59]
Disclaimer/Publisher’s Note: The statements, opinions and data contained in all publications are solely those of the individual author(s) and contributor(s) and not of MDPI and/or the editor(s). MDPI and/or the editor(s) disclaim responsibility for any injury to people or property resulting from any ideas, methods, instructions or products referred to in the content.

