Article

How the Sodium Cations in Anode Affect the Performance of a Lithium-ion Battery

1
Guangdong Key Laboratory of Battery Safety, Guangzhou Institute of Energy Testing, Guangzhou 511447, China
2
School of Materials Science and Engineering, Jiangsu University, Zhenjiang 212013, China
*
Author to whom correspondence should be addressed.
Batteries 2022, 8(8), 78; https://doi.org/10.3390/batteries8080078
Submission received: 30 May 2022 / Revised: 23 June 2022 / Accepted: 6 July 2022 / Published: 28 July 2022
(This article belongs to the Special Issue Lithium-Ion Batteries and Beyond: Outlook on Present and Future)

Abstract

:
Large cations such as potassium ion (K+) and sodium ion (Na+) could be introduced into the lithium-ion (Li-ion) battery system during material synthesis or battery assembly. However, the effect of these cations on charge storage or electrochemical performance has not been fully understood. In this study, sodium ion was taken as an example and introduced into the lithium titanium oxide (LTO) anode through the carboxymethyl cellulose (CMC) binder. After the charge/discharge cycles, these ions doped into the LTO lattice and improved both the lithium-ion diffusivity and the electronic conductivity of the anode. The sodium ion’s high concentration (>12.9%), however, resulted in internal doping of Na+ into the LTO lattice, which retarded the transfer of lithium ions due to repulsion and physical blocking. The systematic study presented here shows that large cations with an appropriate concentration in the electrode would be beneficial to the electrochemical performance of the Li-ion battery.

1. Introduction

As an environmentally-friendly energy storage system with high energy density, low self-discharge rate, and long lifespan, lithium-ion batteries (LIBs) have been employed worldwide in portable electronics, electrified transportation systems, and grid energy storage [1,2,3,4,5]. They generate electricity by lithiation and delithiation in the electrodes [6,7,8,9,10,11]. For wider applications of lithium-ion batteries, scientists need to solve problems such as degradation of the electrochemical performance during cycling, possibly caused by diffusion-induced stresses and cracks of the electrode materials during lithiation and delithiation [12,13,14]. Therefore, how to improve electrochemical performance is of great significance. The ion composition of the electrode is the most critical aspect in determining the electrochemical performance of a lithium-ion battery. In this complex system, alkali metal cations besides lithium ion would also be contained in or introduced into the batteries [15,16,17,18]. Yuan et al. suggested that the presence of potassium ions (K+) in manganese dioxide cathode increased electronic conductivity and lithium-ion diffusivity and therefore improved electrochemical performance [19]. Xu et al. [20] and Guo et al. [21] doped sodium ions (Na+) into the ternary cathode materials and found that the Na doping, with a pinning effect, could improve the structural stability of the material and enlarge the diffusion channels for lithium ions. By ab initio, Chen et al. showed that the internal doping of Na+, which acted as a pillar in layered cathode material, improved the diffusion rate of the lithium ion but was not conducive to cycle performance and delithiation potential [22].
Besides the internal doping mentioned above, these large cations would also be introduced into the battery during synthesis or the assembly process, which is more common in industrial production. Binder accounts for only a small fraction of the battery but is one of the significant sources of these large alkali metal cations [23,24,25]. Carboxymethyl cellulose (CMC), for example, is a typical aqueous binder in LIBs anode [26,27,28] and is often employed in its sodium salt, carboxymethyl cellulose sodium (CMC-Na) [29]. Therefore, it is more likely to contribute to the sodium concentration in the Li-ion battery.
In this study, the authors used CMC-Na as the sodium source and took Na+ as an example to study the effects and mechanisms of the larger alkali metal cations on the Li-ion battery. Four kinds of CMC-Na polymers with different Na+ concentrations were synthesized and employed as the aqueous binder. The Na concentration in CMC-Na binders was controlled and differentiated by NaOH solution treatment. The effect of varying interfacial Na concentration on the lithium storage performance of a lithium titanate (LTO)/Li battery was studied systematically by measuring the specific capacity, Coulombic efficiency, durability, electronic conductivity, and lithium-ion diffusion coefficient of the LTO anode. The underlying mechanism was revealed using a combination of electrochemical impedance spectroscopy (EIS), scanning electron microscope (SEM), X-ray diffraction crystal structure (XRD), and density functional theory (DFT) simulations.

2. Results and Discussion

Four kinds of CMC-Na polymers were synthesized and named as CMC-9.3Na, CMC-11.2Na, CMC-12.9Na, and CMC-15.0Na, with the Na concentration of 9.3 wt.%, 11.2 wt.%, 12.9 wt.%, and 15.0 wt.%, respectively, which were measured by the ICP-AES. They were employed as the binders for LTO anodes, which are named as LTO-9.3Na, LTO-11.2Na, LTO-12.9Na, and LTO-15.0Na, respectively. According to the SEM pictures of the polymers (Figure 1b–e), the surfaces gradually became rougher with the increase in Na concentration, due to the swelling of cellulose caused by sodium hydroxide during synthesis [28,29]. After completing an electrode, sodium is uniformly distributed on the surface of LTO particles, as shown in the EDS mapping (Figure 1f).
To investigate the effect of Na+ concentration on Li+ diffusion in LTO electrodes, electrochemical impedance spectroscopy (EIS) was performed. All the Nyquist plots in Figure 2a consist of a semicircle in the high-frequency region and a sloped line in the low-frequency region, in which the semicircle reflects the charge transfer reaction at the interface between the LTO anode and electrolyte, and the sloping straight line corresponds to the Li+ diffusion in the LTO electrode [30,31,32,33]. In the equivalent circuit (Figure 2a insert), the Warburg diffusion element (Wdif) accounts for the electrolyte/electrode resistance (Re) and the charge transfer resistance (Rct) reflects the reaction rate on the electrode. As shown in Table 1 and Figure 3, the electrolyte/electrode resistance (Re) is reduced by introducing Na+. Meanwhile, the charge-transfer resistance (Rct) decreased when the Na+ concentration increased from 9.3 wt% to 11.2 wt%, but then increased when the Na+ concentration continued to increase. These fitting results of the equivalent circuit indicate that the Na+ in moderation would enhance the electronic conductivity and the lithium-ion diffusion rate in the electrode/electrolyte interface. However, an excessive amount of sodium would increase the charge-transfer resistance and hinder the reaction rate of lithiation.
To further investigate the inherent kinetics, the chemical diffusion coefficients of lithium ions (DLi+) in the LTO anodes are estimated by the EIS method [34,35]. In the low-frequency region (<25 Hz), there is a linear relationship between the real component of the impedance (Z’) and the −1/2 power of the angular frequency (ω−1/2), as shown in Figure 2b and Equation (1)
Z = R Ω + R c t + σ ω 1 / 2
where σ is the Warburg coefficient as well as the slope of the line. Furthermore, the chemical diffusion coefficient of the Li-ions (DLi+) inside an electrode can be derived from the Warburg coefficient by Equation (2) [34,35]
D Li + = 0.5 R 2 T 2 / A 2 n 4 F 4 c Li 2 σ 2
where R is the gas constant, T is the absolute temperature, A is the area of the electrode surface, n is the number of electrons per molecule during oxidization, F is Faraday’s constant, and cLi is the molar concentration of Li+. Among the samples, LTO-11.2Na shows the lowest σ and the highest DLi+, which indicates that only an appropriate concentration of Na+ could facilitate the diffusion of Li+ in the battery system.
These LTO electrodes were then assembled into Li-ion batteries with lithium metal foil as the counter electrode to measure electrochemical performance (Figure 4). All the LTO electrodes exhibited a two-phase transition between Li4Ti5O12 and Li7Ti5O12 during lithiation and delithiation, with the typical voltage plateau around 1.55 V (vs Li/Li+) (Figure 4a) [36]. As listed in Table 2, as the Na content increases from 9.3 wt.% to11.2 wt.%, the electrode shows a higher charge capacity of 153.8 mAh/g and an improved initial Coulombic efficiency (CE) of 90.6%. However, when the Na content continues to increase, both the discharge and the charge capacities are decreased, with a decreased CE of 83.6% and 80.8%, respectively. According to the electrochemical performances, sodium ions in the LTO electrodes would improve the reversible disembedding of lithium ions during the initial lithiation/delithiation, yet an excessive amount of sodium ions would inhibit the charge storage of LTO.
The voltage differences (ΔE) between the charge and discharge plateaus reflected the polarization during the discharge/charge cycles [37,38]. The voltage profiles of all the LTO electrodes were normalized, and the ΔE curves during the initial discharge/charge process are shown in Figure 4b. The sharp corners around 5% normalized capacity (marked by the arrow) correspond to the polarization caused by the electrolyte decomposition and the SEI formation at the beginning of the electrochemical process, and the following ΔE plateaus correspond to the polarization during the solid-state redox of Ti3+/4+ [39]. The LTO-11.2Na electrode showed a relatively smaller potential difference than the other three samples, which indicates an enhanced charge/discharge reversibility.
The cycling stability of these electrodes was tested by the galvanostatic charge−discharge method under the current rate of 0.2C (Figure 4c). After the initial activation, all the electrodes presented a capacity retention higher than 90% in the first 500 cycles. Subsequently, after 550 cycles, the specific capacity of the electrodes with high Na concentrations (12.9 wt.% and 15.0 wt.%) rapidly decayed below 80 mAh/g (ca. 47% of the initial capacity), while the LTO-9.3Na and LTO-11.2Na performed much better. Especially, the LTO-11.2Na electrode shows the best cycling performance among the four samples, retaining a reversible capacity of 151.1mAh/g after 1000 cycles with a small capacity fading rate of 0.01% per cycle and the CE of 99.87%, while the LTO-9.3Na electrode presented a capacity of 134.2 mAh/g after 1000 cycles.
SEM was applied to examine the surface of the LTO electrodes with the best and the worst electrochemical performance, before and after the galvanostatic cycling, to explain the different performances from the perspective of electrode morphology. As shown in Figure 5, the samples are LTO-11.2Na and LTO-15.0Na electrodes. All the pristine LTO electrodes showed a smooth surface (Figure 5a,d). However, after 500 cycles, the LTO-11.2Na electrode still has an even surface with only small porous morphology (Figure 5b), on which the LTO particles have not apparently changed (Figure 5c). The good retentivity is consistent with the lowest Rct and the highest DLi+ among the four samples, as well as the best capacity retention and the best cycling performance. By contrast, bumpy structures and cracks are forming on the LTO-15.0Na electrode (Figure 5e,f), which can lead to poor contact between the active materials and the current collector, thereby being ineffective in maintaining the electrode integrity along with rapid capacity loss.
The XRD patterns of the pristine LTO and four electrodes after 500 cycles are depicted in Figure 6a. The diffraction peaks of all the investigated samples can be attributed to expected reflections of spinel Li4Ti5O12 with a space group of Fd-3m (PDF#00-049-0207). Compared with the pristine LTO, no impurity peaks were observed from the LTO electrodes. However, the intensity of the XRD peaks decreased on the electrodes, probably due to the confinement effect or the masking effect originating from the acetylene black and binder coated on the LTO particles [40]. The peak of the (111) plane in the LTO electrodes (Figure 6b) slightly shifted to lower degrees when more Na+ was introduced into the sample. Given that the Na-ion (0.102 nm) is larger than the Li-ion (0.076 nm), the shift may indicate that a tiny percentage of Na+ has doped into and stretched the Li4Ti5O12 lattice after cycles. The broadening issue on the left-hand side of the peak may be a reflection of the lattice distortion that was generated by the macroscopic residual tensile stress following the doping of the sodium ions. Moreover, the stretched lattice may be the reason for the increased electronic/ionic conductivity and the reversible specific capacity in this study.
The effect of the doped Na-ions on the ionic conductivity of LTO is further studied by the Density Functional Theory (DFT). Firstly, all Na-doped structures, as well as the pristine LTO, were optimized, and then, based on the pristine LTO structure, a specific pathway for Li+ diffusion from the third layer to the surface was selected. Immediately, by using the cNEB method [41], the Li+ diffusion was calculated. The optimized structures and the selected Li-ion migration paths are shown in Figure 7a.
The pristine LTO has a high activation energy barrier (0.575 eV) for Li+ diffusion, in which the surface Li-ions presented less mobility than the interior ones (Figure 7b). When one or two Na atoms were doped into the lattice and were located on the surface, the potential barrier decreased to 0.30 eV and 0.31 eV, respectively (Figure 7c,d). The decreased barrier is attributed to the surface doping of Na atoms, which relocates the defect energy or doping energy level, and results in a higher conductivity for Li-ions. As the Na concentration increases, the surface migration potential barrier (P2–P3) continues to decrease. However, some of the Na atoms would insert into the lattice and cause internal doping under the high Na concentration, leading to an increase in the internal migration potential barrier (P1–P2) to 0.444 eV (for two atoms, Figure 7e) and 0.435 eV (for three atoms, Figure 7f). In summary, with the introduction of Na doping, Li migration on the surface increased; moreover, with the increase in Na, the migration would first increase and then decrease. Such a simulation conclusion also explains the experimental results of lithium-ion migration influenced by the Na+ concentration, in which the LTO-11.2Na presented the highest chemical diffusion coefficient of Li-ions and the best electrochemical performance.
From the DFT calculation and the experimental results, the properties of the interface between the LTO electrode and electrolyte are the key influence of the Li-ion migration. In this study, part of the sodium ions from the CMC-Na binder are embedded in the surface LTO lattice during the charge/discharge cycles via a similar process to the lithiation in LTO [42,43]. The peripheral electrons of the Na atoms could provide the electronic conductivity for the host material [44], i.e., the LTO on the anode. Meanwhile, according to previous studies, when metal atoms (Na, Mg, Ca, La, etc.) were doped in LTO on the site of Li, the resulting phase structure could be described as a network of intercalated edge and corner-sharing distorted TiO6 octahedra [43,44,45] with the isolated and distorted LiO4 tetrahedra located in the b-axis. This structure provides tunnels along the b-axis and facilitates the diffusion of lithium-ions. In consequence, the doped Na+ ions in this study also provided ion-conductive channels and promoted the migration of lithium-ions between the electrolyte and the LTO surface. However, when the Na+ concentration goes too high, the Li+ diffusion through the LTO lattice and the interface would be impeded by the high potential barrier. As shown in Figure 5f, some particles are observed on the surface of the LTO particles on the LTO-15.0Na electrode after 500 cycles. It is reasonable to speculate that they might be the lithium cluster, which formed due to the excessive sodium ions blocking the diffusion channels for Li-ions through repulsive electrostatic forces and physical blocking. These immobilized clusters are no longer available as an electrochemically active cation during the charge/discharge process and therefore result in sudden performance degradation in subsequent cycles.

3. Materials and Methods

3.1. Materials

The LTO powder was purchased from Shenzhen BTR New Energy and Materials Company Limited (Shenzhen, China). The carboxymethyl cellulose (CMC) (USP, 800–1200 mPa.s) was purchased from Aladdin. The NaOH (AR, ≥98%) was purchased from Mackin. The acetic acid (AR, 99.5%) was purchased from Tianjin Fuyu Fine Chemical Co. Ltd. (China). The acetylene black (AB) as conducting agent was purchased from Sigma-Aldrich. The polyolefine separator was purchased from Celgard. The electrolyte of 1MLiPF6 in dimethyl carbonate (DMC, >99.9%)/diethylene carbonate (DEC, >99.9%)/ethylene carbonate (EC, >99.9%) (1:1:1 by vol.)(1M LiPF6 DMC/DEC/EC) was purchased from Shenzhen Capchem Technology CO.,LTD. (China). All of these materials were used as received.

3.2. Preparation of CMC-Na Binders

The control of Na concentration in the CMC binder was achieved by alkali treatment using NaOH. CMC was first dissolved in deionized (DI) water with a concentration of 2.0 wt%. Different amounts of NaOH (0.0 wt.%, 0.1 wt.%, 0.2 wt.% and 0.3 wt.%) were then added to the CMC solution by magnetic stirring at 30 °C for 6h. This procedure was followed by adding dropwise acetic acid until the solution was neutralized. The CMC-Na aqueous binders were then transferred to a Teflon petri dish and dried at 80 °C for 24 h in an oven to obtain solid CMC-Na samples.

3.3. Preparation of LTO Electrodes

In order to generate a homogenous slurry, LTO powder was combined with acetylene black and the obtained CMC-Na binders in an aqueous solution using a high-speed mixer. The weight ratio for these three components was 8:1:1. The appropriate viscous slurry was spread onto copper foil that was 20 μm thick, dried for 24 h at 80 °C in a vacuum oven, and pressed to create electrode sheets with a coating thickness of around 100 μm. Finally, the electrodes were divided up into smaller pieces for storage.

3.4. Characterization

An inductively coupled plasma optical emission spectrometer was used to ascertain the quantity of sodium present in the CMC-Na sample (ICP-AES, Agilent 5110). Using a scanning electron microscope (Hitachi SU8010) equipped with an energy-dispersive detector, the morphology and microstructure of the materials were observed and analyzed (EDS, iXRF Model 550i). The acceleration voltage of the SEM defined the depth at which the compositional information was taken from the sample and transferred to the EDS detector. For the research of the surface and interface area, 10 kV was selected as the acceleration voltage because it strikes a balance between surface sensitivity (a low acceleration voltage) and the number of counts (a high acceleration voltage). An XRD examination was carried out using a PANalytical X′pert X-ray diffractometer fitted with a Cu Ka radiation source. The materials were scanned in the 2θ range of 10–80° at room temperature.

3.5. Computational and Model Details

The calculations were carried out using density functional theory (DFT) and the frozen-core projector augmented wave (PAW) potentials, as implemented in the Vienna Ab initio Simulation Package (VASP) [44,45]. The Hubbard-corrected variation in the Perdew–Burke–Ernzerhof (PBE) function was used. This functional has been shown by previous researchers to accurately represent the localization of tiny polarons, and as a result it can correctly replicate the mixed charge states of the LTO surface [45]. In the computations, a cutoff energy of 500 eV was chosen for the wave function and a minimum grid of 5 × 5 × 1 k-points of Monkhorst–Pack meshes was employed for the Brillouin zone. When the residue force on each atom was less than 0.02 eV/Å, the structure’s lattice properties and atomic locations were loosened. To determine the effect of Na introduced on the surface and interior of LTO, one to three Na atoms were considered. After performing the DFT calculation, the most stable configurations were chosen for further investigation of the influence of Na on Li+ diffusion, which was performed through the cNEB method [41].

3.6. Electrochemical Measurement

In order to evaluate the electrochemical performance of the obtained LTO electrodes with a variety of CMC-Na binders (CMC-9.3Na, CMC-11.2Na, CMC-12.9Na, and CMC-15.0Na), CR2032 coin half-cells were assembled. In an argon-filled glove box (with a water content of 1ppm and oxygen content of 1 ppm), the coin cells were assembled with 1M LiPF6 DMC/DEC/EC as the electrolyte, lithium metal foil as the counter electrode, and Celgard 2400 as the separator. The assembled CR2032 coin cells were pressurized and sealed, then stood at room temperature for 24 h before being measured. On a CT2001A Battery Test System (Lanhe, China), the obtained coin cells were then galvanostatically charged and discharged at room temperature using cutoff voltages of 0.5 and 3.0 V vs. Li/Li+. In order to conduct electrochemical impedance spectroscopic (EIS) experiments on the cells, an oscillating voltage of 5 mV was applied to the cells at room temperature and the frequency was varied from 10−2 to 105 Hz. The PGSTAT302N electrochemical workstation was used in the carrying out of the EIS measurements (Metrohm, Switzerland).

4. Conclusions

In this study, the authors introduced the sodium cations to Li-ion batteries by the aqueous binder CMC-Na on the Li4Ti5O12 (LTO) anode and examined the effect of Na+ on both the anode active materials and the battery system. According to the experimental results, after several charge/discharge cycles, some of the Na+ incorporated in the lattice of the anode active material and increased the electronic conductivity and lithium-ion diffusivity of the anode. These improvements facilitated the inherent kinetics and thus led to better electrochemical performance of the battery, including specific capacity and battery durability. DFT simulations also proved that Na+ doping on the surface of the LTO lattice would lower the potential barrier for Li-ions and lead to the improvements mentioned above. However, under an excessively high concentration, some of the Na+ inserted into the LTO lattice and increased the potential barrier, which hinders the migration of Li ions. Meanwhile, the Na+ would also hinder the lithiation by repulsion and physical blocking, thus worsening the electrochemical performance of the anode. This study would be helpful to understand the functions and effects of the impurity cations in a Li-ion battery system and would provide insights into the design of high-performance electrodes for practical applications.

Author Contributions

D.S. and X.L. designed the study and wrote the manuscript; D.R. simulated the system with DFT; D.S. and A.W. implemented the experiment; all authors participated in the analysis and collation of the data. The project was guided by X.L. All authors have read and agreed to the published version of the manuscript.

Funding

This study was supported by the National Key R & D Program of China (No. 2021YFF0601101), Pearl River Talents Scheme (2019QN01L385), Science and Technology Program of Guangzhou, China (202201011357) and the Guangdong Key Laboratory of Battery Safety (2019B121203008).

Institutional Review Board Statement

Not applicable.

Informed Consent Statement

Not applicable.

Data Availability Statement

The raw/processed data required to reproduce these findings cannot be shared at this time as the data also forms part of an ongoing study.

Conflicts of Interest

The authors declare no conflict of interest.

References

  1. Deng, D. Li-ion batteries: Basics, progress, and challenges. Energy Sci. Eng. 2015, 3, 385–418. [Google Scholar] [CrossRef]
  2. Ding, Y.L.; Cano, Z.P.; Yu, A.P.; Lu, J.; Chen, Z.W. Automotive Li-ion batteries: Current status and future perspectives. Electro. Ener. Rev. 2019, 2, 1–28. [Google Scholar] [CrossRef]
  3. Miao, Y.; Hynan, P.; VonJouanne, A.; Yokochi, A. Current Li-ion battery technologies in electric vehicles and opportunities for advancements. Energies 2019, 12, 1074. [Google Scholar] [CrossRef] [Green Version]
  4. Fan, E.S.; Li, L.; Wang, Z.P.; Lin, J.; Huang, Y.X.; Yao, Y.; Chen, R.J.; Wu, F. Sustainable recycling technology for Li-ion batteries and beyond: Challenges and future prospects. Chem. Rev. 2020, 120, 7020–7063. [Google Scholar] [CrossRef]
  5. Tian, Y.S.; Zeng, G.B.; Rutt, A.; Shi, T.; Kim, H.; Wang, J.Y.; Koettgen, J.; Sun, Y.Z.; Ouyang, B.; Chen, T.N.; et al. Promises and challenges of next-generation "Beyond Li-ion" batteries for electric vehicles and grid decarbonization. Chem. Rev. 2021, 121, 1623–1669. [Google Scholar] [CrossRef] [PubMed]
  6. Logan, E.R.; Dahn, J.R. Electrolyte design for fast-charging Li-ion batteries. Trends Chem. 2020, 2, 354–366. [Google Scholar] [CrossRef]
  7. Wang, X.X.; Ding, Y.L.; Deng, Y.P.; Chen, Z.W. Ni-rich/Co-poor layered cathode for automotive Li-ion batteries: Promises and challenges. Adv. Energy Mater. 2020, 10, 1903864. [Google Scholar] [CrossRef]
  8. Yi, T.F.; Wei, T.T.; Li, Y.; He, Y.B.; Wang, Z.B. Efforts on enhancing the Li-ion diffusion coefficient and electronic conductivity of titanate-based anode materials for advanced Li-ion batteries. Energy Stor. Mater. 2020, 26, 165–197. [Google Scholar] [CrossRef]
  9. Li, P.; Hwang, J.Y.; Sun, Y.K. Nano/microstructured silicon-graphite composite anode for high-energy-density Li-ion battery. ACS Nano. 2019, 13, 2624–2633. [Google Scholar] [CrossRef]
  10. Saal, A.; Hagemann, T.; Schubert, U.S. Polymers for battery applications-active materials, membranes, and binders. Adv. Energy Mater. 2021, 11, 2001984. [Google Scholar] [CrossRef]
  11. Zha, G.J.; Hu, W.; Agarwal, S.; Ouyang, C.Y.; Hu, N.G.; Hou, H.Q. High performance layered LiNi0.8Co0.07Fe0.03Mn0.1O2 cathode materials for Li-ion battery. Chem. Eng. J. 2021, 409, 128343. [Google Scholar] [CrossRef]
  12. Banerjee, A.; Ziv, B.; Luski, S.; Aurbach, D.; Halalay, I.C. Increasing the durability of Li-ion batteries by means of manganese ion trapping materials with nitrogen functionalities. J. Power Sources 2017, 341, 457–465. [Google Scholar] [CrossRef]
  13. Evertz, M.; Horsthemke, F.; Kasnatscheew, J.; Börner, M.; Winter, M.; Nowak, S. Unraveling transition metal dissolution of Li1.04Ni1/3Co1/3Mn1/3O2 (NCM 111) in lithium ion full cells by using the total reflection X-ray fluorescence technique. J. Power Sources 2016, 329, 364–371. [Google Scholar] [CrossRef]
  14. Husmann, S.; Zarbin, A.J.G. Cation effect on the structure and properties of hexacyanometallates-based nanocomposites: Improving cathode performance in aqueous metal-ions batteries. Electrochim. Acta. 2018, 283, 1339–1350. [Google Scholar] [CrossRef]
  15. Yoon, Y.; Shin, D.; Kim, D.; Lee, K.; Kim, S. Effects of sodium content of titanate nanotubes on lithium battery performance. J. Nanosci. Nanotechnol. 2010, 10, 6206–6210. [Google Scholar] [CrossRef]
  16. Yuan, Y.; Zhan, C.; He, K.; Chen, H.; Yao, W.; Sharifi-Asl, S.; Song, B.; Yang, Z.; Nie, A.; Luo, X.Y.; et al. The influence of large cations on the electrochemical properties of tunnel-structured metal oxides. Nat. Commun. 2016, 7, 13374. [Google Scholar] [CrossRef]
  17. Xu, C.Y.; Li, J.L.; Sun, J.; Zhang, W.Z.; Ji, B.M. Li-rich layered oxide single crystal with Na doping as a high-performance cathode for Li ion batteries. J. Alloys Compd. 2021, 895, 162613. [Google Scholar] [CrossRef]
  18. Guo, L.F.; Xie, Y.L. Na-doped LiNi1/3Co1/3Mn1/3O2 with enhanced rate performance as a cathode for Li-ion batteries. Ionics 2022, 28, 2117–2123. [Google Scholar] [CrossRef]
  19. Chen, Y.Z.; Hu, W.; Zhou, Q.H.; Li, H.L. Conflicting roles of Na-doped layered cathode material LiCoO2 for Li-ion batteries. J. Solid State Electr. 2021, 25, 2565–2569. [Google Scholar] [CrossRef]
  20. Shahjalal, M.; Roy, P.K.; Shams, T.; Fly, A.; Chowdhury, J.I.; Ahmed, M.R.; Liu, K. A review on second-life of Li-ion batteries: Prospects, challenges, and issues. Energy 2022, 241, 122881. [Google Scholar] [CrossRef]
  21. Shi, Y.; Zhou, X.Y.; Yu, G.H. Material and structural design of novel binder systems for high-energy, high-power lithium-ion batteries. Acc. Chem. Res. 2017, 50, 2642–2652. [Google Scholar] [CrossRef] [PubMed] [Green Version]
  22. Zhao, Y.M.; Yue, F.S.; Li, S.C.; Zhang, Y.; Tian, Z.R.; Xu, Q.; Xin, S.; Guo, Y.G. Advances of polymer binders for silicon-based anodes in high energy density lithium-ion batteries. InfoMat 2021, 3, 460–501. [Google Scholar] [CrossRef]
  23. Wennig, S.; Langklotz, U.; Prinz, G.M.; Schmidt, A.; Oberschachtsiek, B.; Lorke, A. The influence of different pre-treatments of current collectors and variation of the binders on the performance of Li4Ti5O12 anodes for lithium ion batteries. J. Appl. Electrochem. 2015, 45, 1043–1055. [Google Scholar] [CrossRef]
  24. Chou, S.L.; Gao, X.W.; Wang, J.Z.; Wexler, D.; Wang, Z.X.; Chen, L.Q.; Liu, H.K. Tin/polypyrrole composite anode using sodium carboxymethyl cellulose binder for lithium-ion batteries. Dalton Trans. 2011, 40, 12801–12807. [Google Scholar] [CrossRef] [PubMed]
  25. Choi, Y.; Maken, S.; Lee, S.; Chung, E.; Park, J.; Min, B. Characteristics of water-soluble fiber manufactured from carboxymethyl cellulose synthesis. Korean J. Chem. Eng. 2007, 24, 288–293. [Google Scholar] [CrossRef]
  26. Racz, I.; Borsa, J. Swelling of carboxymethylated cellulose fibres. Cellulose 1997, 4, 293–303. [Google Scholar] [CrossRef]
  27. Nzereogu, P.U.; Omah, A.D.; Ezema, F.I.; Iwuoha, E.I.; Nwanya, A.C. Anode materials for lithium-ion batteries: A review. Appl. Surf. Sci. 2022, 9, 100233. [Google Scholar] [CrossRef]
  28. Yin, Y.; Luo, X.; Xu, B. In-situ self-assembly synthesis of low-cost, long-life, shape-controllable spherical Li4Ti5O12 anode material for Li-ion batteries. J. Alloy. Compds. 2022, 904, 164026. [Google Scholar] [CrossRef]
  29. Zhang, S.S.; Xu, K.; Jow, T.R. EIS Study on the formation of solid electrolyte interface in Li-ion battery. Electrochim. Acta 2006, 51, 1636–1640. [Google Scholar] [CrossRef]
  30. Uhlemann, M.; Madian, M.; Leones, R.; Oswald, S.; Maletti, S.; Eychmüller, A.; Mikhailova, D. In-depth study of Li4Ti5O12 performing beyond conventional operating conditions. ACS Appl. Mater. Interfaces 2020, 12, 37227–37238. [Google Scholar] [CrossRef]
  31. Yuan, T.; Cai, R.; Ran, R.; Zhou, Y.K.; Shao, Z.P. A mechanism study of synthesis of Li4Ti5O12 from TiO2 anatase. J. Alloy. Compd. 2012, 505, 367. [Google Scholar] [CrossRef]
  32. Liu, W.; Shao, D.; Luo, G.; Gao, Q.; Yan, G.; He, J.; Chen, D.; Yu, X.; Fang, Y. Mesoporous spinel Li4Ti5O12 nanoparticles for high rate lithium-ion battery anodes. Electrochim. Acta 2014, 133, 578–582. [Google Scholar] [CrossRef]
  33. Zhang, W.; Seo, D.H.; Chen, T.; Wu, L.J.; Topsakal, M.; Zhu, Y.M.; Lu, D.Y.; Ceder, G.; Wang, F. Kinetic pathways of ionic transport in fast-charging lithium titanate. Science 2020, 367, 1030. [Google Scholar] [CrossRef]
  34. Mai, Y.J.; Shi, S.J.; Zhang, D.; Lu, Y.; Gu, C.D.; Tu, J.P. NiO–graphene hybrid as an anode material for lithium ion batteries. J. Power Sources 2012, 204, 155–161. [Google Scholar] [CrossRef]
  35. Dreyer, W.; Jamnik, J.; Guhlke, C.; Huth, R.; Moskon, J.; Gaberscek, M. The thermodynamic origin of hysteresis in insertion batteries. Nat. Mater. 2010, 9, 448–453. [Google Scholar]
  36. Lee, K.C.; Chang-Jian, C.W.; Ho, B.C.; Ding, Y.R.; Huang, J.H.; Hsiao, Y.S. Conductive PProDOT-Me2–capped Li4Ti5O12 microspheres with an optimized Ti3+/Ti4+ ratio for enhanced and rapid lithium-ion storage. Ceram. Int. 2019, 45, 15252–15261. [Google Scholar] [CrossRef]
  37. Hu, Y.S.; Cakan, R.D.; Titirici, M.M.; Müller, J.O.; Schlögl, R.; Antonietti, M.; Maier, J. Superior storage performance of a Si@SiOx/C nanocomposite as anode material for lithium-ion batteries. Angew. Chem. Int. Ed. 2008, 47, 1645–1649. [Google Scholar] [CrossRef] [Green Version]
  38. Zhou, W.; Hao, F.; Fang, D. The effects of elastic stiffening on the evolution of the stress field within a spherical electrode particle of lithium-ion batteries. Int. J. Appl. Mech. 2013, 5, 1350040. [Google Scholar] [CrossRef]
  39. Christensen, J.; John Newman, J. A mathematical model of stress generation and fracture in lithium manganese oxide. J. Electrochem. Soc. 2006, 153, A1019–A1030. [Google Scholar] [CrossRef]
  40. Zhou, W. Effects of external mechanical loading on stress generation during lithiation in Li-ion battery electrodes. Electrochim. Acta. 2015, 185, 28–33. [Google Scholar] [CrossRef] [Green Version]
  41. Henkelman, G.; Uberuaga, B.P.; J´onsson, H. A climbing image nudged elastic band method for finding saddle points and minimum energy paths. J. Chem. Phys. 2000, 113, 9901–9904. [Google Scholar] [CrossRef] [Green Version]
  42. Kick, M.; Scheurer, C.; Oberhofer, H. Formation and stability of small polarons at the lithium-terminated Li4Ti5O12 (LTO) (111) surface. J. Chem. Phys. 2020, 153, 144701. [Google Scholar] [CrossRef] [PubMed]
  43. Tada, K.; Kitta, M.; Ozaki, H.; Tanaka, S. A comparative study of Na3LiTi5O12 and Li4Ti5O12: Geometric andelectronic structures obtained by density functional theory calculations. Chem. Phys. Lett. 2019, 731, 136598. [Google Scholar] [CrossRef]
  44. Shenouda, A.Y.; Murali, K.R. Electrochemical properties of doped lithium titanate compounds and their performance in lithium rechargeable batteries. J. Power Sources 2008, 176, 332–339. [Google Scholar] [CrossRef]
  45. Li, Y.; Chen, Q.; Meng, Q.; Lei, S.; Song, F.; Ma, J. Synergy of a hierarchical porous morphology and anionic defects of nanosized Li4Ti5O12 toward a high-rate and large-capacity lithium-ion battery. J. Energy. Chem. 2021, 54, 699–711. [Google Scholar] [CrossRef]
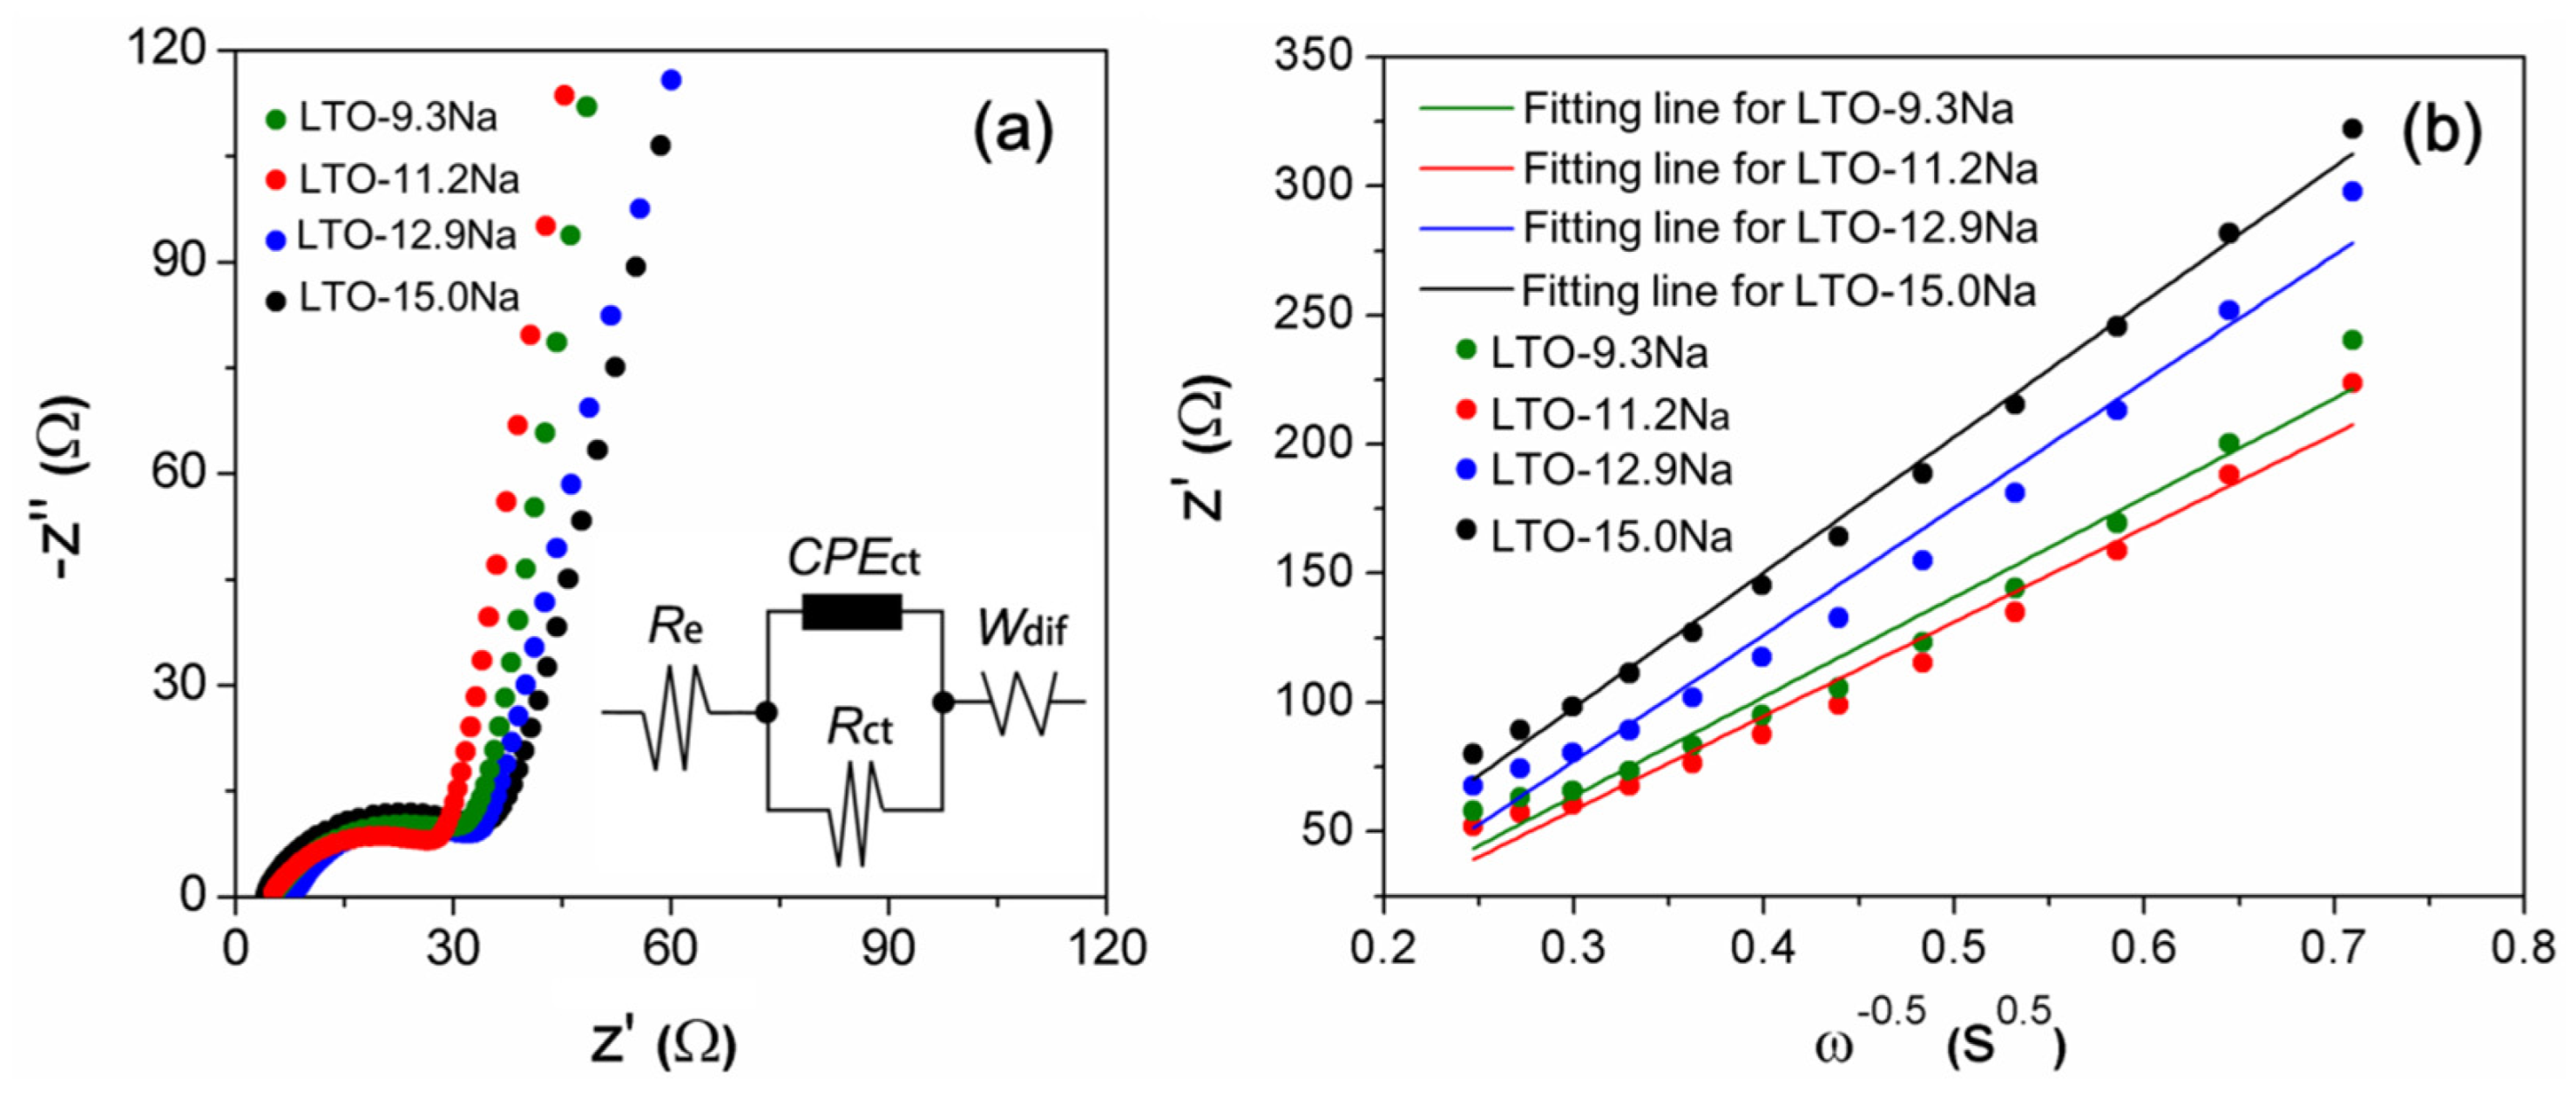
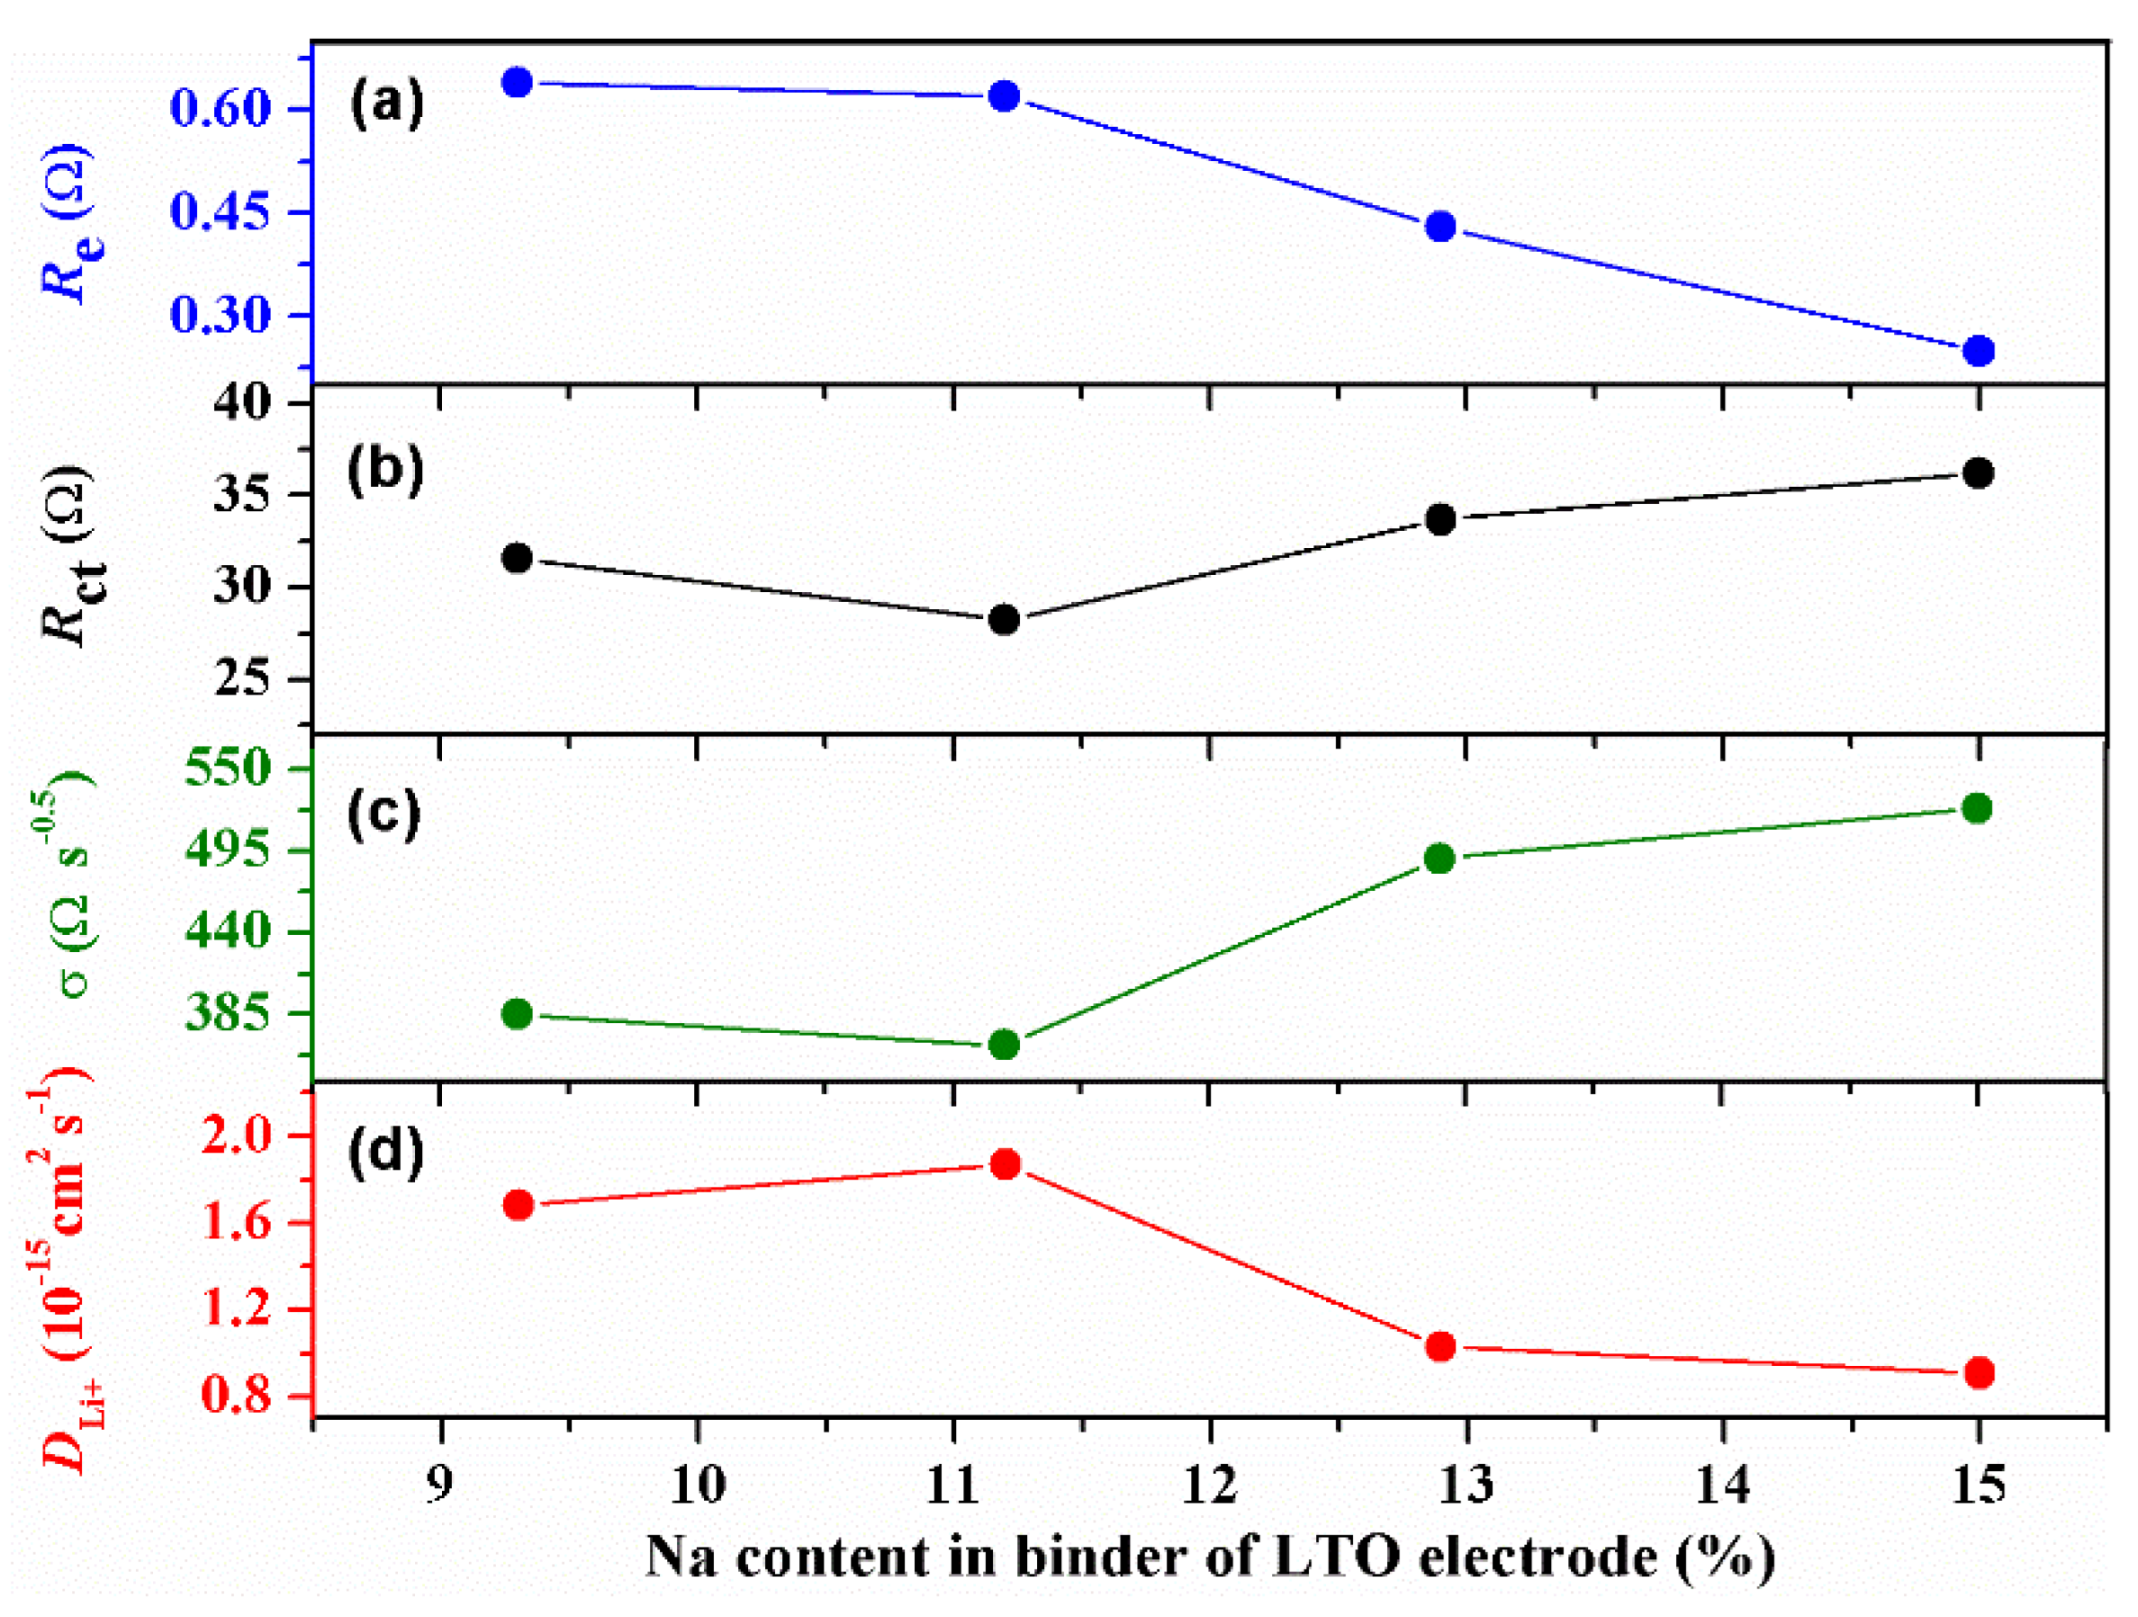
Figure 1. (a) EDS spectra of four kinds of CMC-Na polymers. SEM images of (b) CMC-9.3Na, (c) CMC-11.2Na, (d) CMC-12.9Na, and (e) CMC-15.0Na. (f) SEM image and the corresponding EDS mappings of the LTO-15.0Na electrode.
Batteries 08 00078 g001
Figure 2. (a) Nyquist plots and (b) linear fitting to Zversus ω−1/2 plots in the low frequency range of the LTO electrodes using four CMC-Na binders with different sodium contents. The scatter points are the experimental data and the lines represent the simulation results using the equivalent circuit shown in (a), insert.
Batteries 08 00078 g002
Figure 3. (a) Electrolyte/electrode resistance Re, (b) charge transfer resistance Rct, (c) Warburg coefficient σ, and (d) chemical diffusion coefficients of lithium ions DLi+ for LTO electrodes with different binders.
Batteries 08 00078 g003
Figure 4. (a) Initial charge-discharge curves at 0.2C, (b) voltage difference between charge and diacharge curves, and (c) long cycle performance of LTO electrodes with different binders at 0.2C.
Batteries 08 00078 g004
Figure 5. SEM images of LTO-11.2Na (a), LTO-15.0Na (d) before cycling, and LTO-11.2Na (b,c), LTO-15.0Na (e,f) after cycling at different magnifications.
Batteries 08 00078 g005
Figure 6. (a) XRD patterns of the pristine LTO and four LTO electrodes after 500 charge-discharge cycles, and (b) partial magnification XRD patterns of the samples.
Batteries 08 00078 g006
Figure 7. (a) The structure model and the selected pathway from P1 to P3 via the P2 site. The optimized pathway and barrier for (b) pristine LTO lattice, (c) one Na atom on the surface, (d) two Na atoms on the surface, (e) one Na atom on surface and the other inside the lattice, and (f) two Na atoms on the surface and the other one inside the lattice.
Batteries 08 00078 g007
Table 1. Sodium content in binder of LTO electrodes and transport properties derived from the impedance spectra.
ElectrodesSodium Content in Binder (%)Re (Ω)Rct (Ω)σ (Ωs−1/2)DLi+ (cm2 s−1)
LTO-9.3Na9.30.6431.57384.81.68 × 10−15
LTO-11.2Na11.20.6228.22364.01.87 × 10−15
LTO-12.9Na12.90.4333.70490.11.03 × 10−15
LTO-15.0Na15.00.2536.21523.99.06 × 10−16
Table 2. Initial discharge capacity, charge capacity, and Coulombic efficiency for LTO electrodes.
ElectrodesInitial Discharge Capacity (mAh/g)Initial Charge Capacity (mAh/g)CE (%)
LTO-9.3Na170.3148.987.4
LTO-11.2Na169.6153.890.6
LTO-12.9Na167.7140.283.6
LTO-15.0Na167.8135.680.8
Publisher’s Note: MDPI stays neutral with regard to jurisdictional claims in published maps and institutional affiliations.

