Abstract
Nail penetration is one of the most critical scenarios for a lithium-ion cell: it involves the superposition of electrical, thermal and mechanical abusive loads. When an electrically conductive nail is introduced into the active layers of a lithium-ion cell, an electric short circuit takes place between the conductive components (electrodes and current collectors). Hence, for this load case, electro-thermal modeling must be performed considering each and every layer of the cell in order to predict the electric quantities and the cell temperature (with numerical models). When standard conic nails are used, as is typical for this class of tests, the electrical contact between conductive components and the nail itself suffers of poor reproducibility mainly due to the separator that interposes between the electrically conductive components. This phenomenon makes it difficult to validate electro-thermal models, since the electrical contact between nail and lithium-ion cell parts cannot be safely determined. In this work, an alternative nail with an optimized ratio between the external surface and volume is presented to overcome this issue. To demonstrate the effectiveness of the designed nail, five tests (with the same conditions) were conducted on five commercial lithium-ion pouch cells, monitoring the tabs voltage and surface temperature. In all tests, thermal runaway was reached within 30 s and the tabs voltage showed comparable behavior, indicating that the short circuit values for all five repetitions were similar. The investigation included the implementation of a detailed layers model to demonstrate how the validation of such model would be possible with the novel data.
1. Introduction
In last decade, lithium-ion (Li-ion) battery technology has been broadly applied in the automotive and aerospace industry [1,2,3]. Regarding the automotive applications, the need to reduce CO2 emissions is leading the industry to replace combustion engine vehicles with more efficient electric powertrain systems. In this scenario, Li-ion battery storage systems display significant advantages with respect to other storage technologies and are becoming dominant in the generation of new electric vehicles. Thereby, it is crucial that safety conditions are met in all possible scenarios, including abusive conditions. In general, the safe operation of the battery pack can be achieved if the Li-ion cells operate within a restricted temperature and voltage range [2].
Cell manufacturers recommend a maximum operative temperature in order to guarantee safe working conditions. During operation, heat is generated in the inner cell volume; therefore, the core temperature is certainly higher than the external surface temperature. Since the core temperature cannot be experimentally measured, thermal simulations must be carried out to determine operative conditions that could lead to over temperature in the cell core [4,5]. Furthermore, the orthotropic thermal characteristics of a Li-ion cell, increase the complexity of formulating the thermal problem. In particular, the thermal conductivity of the cell in the through-thickness direction is significantly lower than the other two directions [6]. This implies the presence of a higher temperature gradient in this direction during operation.
Modeling a Li-ion cell with an homogeneous material, therefore, would not allow a correct prediction of the inner temperature, since the cell is a sandwich of several materials with different thermal properties [7]. The alternation between good thermal conductors (e.g., current collectors) with materials that are poorer thermal conductors (e.g., separators or electrodes) result in an inhomogeneous inner temperature distribution during operation [4,8]. To accurately predict the inner temperature, a multilayer electro-thermal model needs to be implemented. Such a model also enables the evaluation of local short circuit load cases due to mechanical abuse conditions. In fact, if the Li-ion cell is subjected to a mechanical abuse load case, the separator integrity must be evaluated to predict an eventual electrical short circuit and the resulting heat generation due to the Joule effect [9]. Thus, this heat generation is triggered by the failure of the electrical insulation. The nail penetration load case represents an extreme scenario, whereby the electrical short circuit is provoked by the nail itself. If the nail is constituted by an electrically conductive material, it represents a path for the electrical current. Therefore, a mechanical abuse case scenario, such as nail penetration, can only be accurately evaluated with an electro-thermal detailed layers model [8,10,11,12]. As example, Vyroubal et al. [13] described a possible workflow that could be used to couple a mechanical model with an electro-thermal model in the case of nail penetration. The models are coupled by defining the electrical insulation failure due to the separator rupture and computing the temperature based on the battery self-discharging on the internal short circuit (ISC).
However, a detailed layers model that includes the local definition of electro-chemical variables could require great computational effort; for this reason, some studies are focused on finding the best trade-off in terms of accuracy and computational complexity. As an example, Hu et al. [14] developed an electro-thermal model with a dedicated optimization algorithm for the prediction of the cell temperature with reduced computational cost. It is necessary to design adequate experiments to meet the requirements for building predictive numerical models, but also to understand the ongoing processes and to generate data that are then used to validate the numerical models. However, standard nail penetration experiments are subject to a strong limitation: The value of the ISC resistance is extremely hard to control and, furthermore, the local voltage cannot be measured for further model validation [15,16,17,18]. The nail used for a standard Li-ion cell test is typically a conical nail with a defined diameter and entering angle. Regarding the cell, the only parameters that can be physically measured are the differential voltage of the cell tabs and the surface temperature. Chen et al. [19] built a customized cell with an inner temperature sensor to measure the internal temperature during tests. However, if the intent is to study an existing pouch cell, introducing a temperature sensor into the inner cell volume would require the partial disassembly of the cell. This disassembly would certainly result in the partial evaporation of the electrolyte, loss of vacuum conditions after pouch re-sealing, different electrical behavior and, most likely, an altered pouch opening for gas venting (in the case of thermal runaway event). Finegan et al. [20] built a special nail with an inner temperature sensor that enabled the researchers to measure its temperature and estimate the amount of heat generated by measuring the amount of electric current flowing through the nail. In the nail penetration abuse scenario, this procedure has been followed since the electrical short circuit resistance is hard to estimate and displays high variability in test environments [21,22,23]. In fact, the results from nail penetration tests are poorly reproducible, and this aspect complicates both the modeling and validation of such an abuse scenario. To try to overcome this problem, Abaza et al. [24] conducted preliminary external short circuit tests to obtain information about the differential voltage behavior at the cell tabs for a known short circuit resistance. The ISC resistance (due to nail penetration) was then estimated based on correlations with the discharge voltage curve, which was measured at the tabs. In all of these studies, the electrical short circuit resistance measured in the nail penetration tests—performed with standard conic nails—was highly variable and, consequently, so was the cell self-heating rate. The electrical short circuit variability could be attributed to the nail shape for the following reason: introducing a conical volume with a low external surface-area-to-volume ratio causes an imprecisely defined layers displacement. This, in turn, results in the random interposition of the separator between the nail and the electrically conductive layers. This effect has been observed when using the X-ray technique in nail penetration experiments [25,26]. Hence, carefully choosing the nail shape could reduce this issue and help researchers to obtain reliable and meaningful nail penetration test results.
In this manuscript, a novel nail shape with increased external surface-area-to-volume ratio is investigated. Reducing the introduced volume (with respect to the standard conical nail) was expected to reduce the randomness in the movement of the cell layers during the nail penetration. To assess the effectiveness of the nail, five identical tests were carried out on five cells; the results are presented here. The results show that the voltage responses of the cell tabs are comparable, indicating that the electrical short circuit values were similar in all tests. Furthermore, the experimental results were then used to validate a detailed multilayer electro-thermal model, which is described in this work, to demonstrate how the presented tests can be used to validate such numerical models.
2. Simulation Method
2.1. Electro-Thermal Model
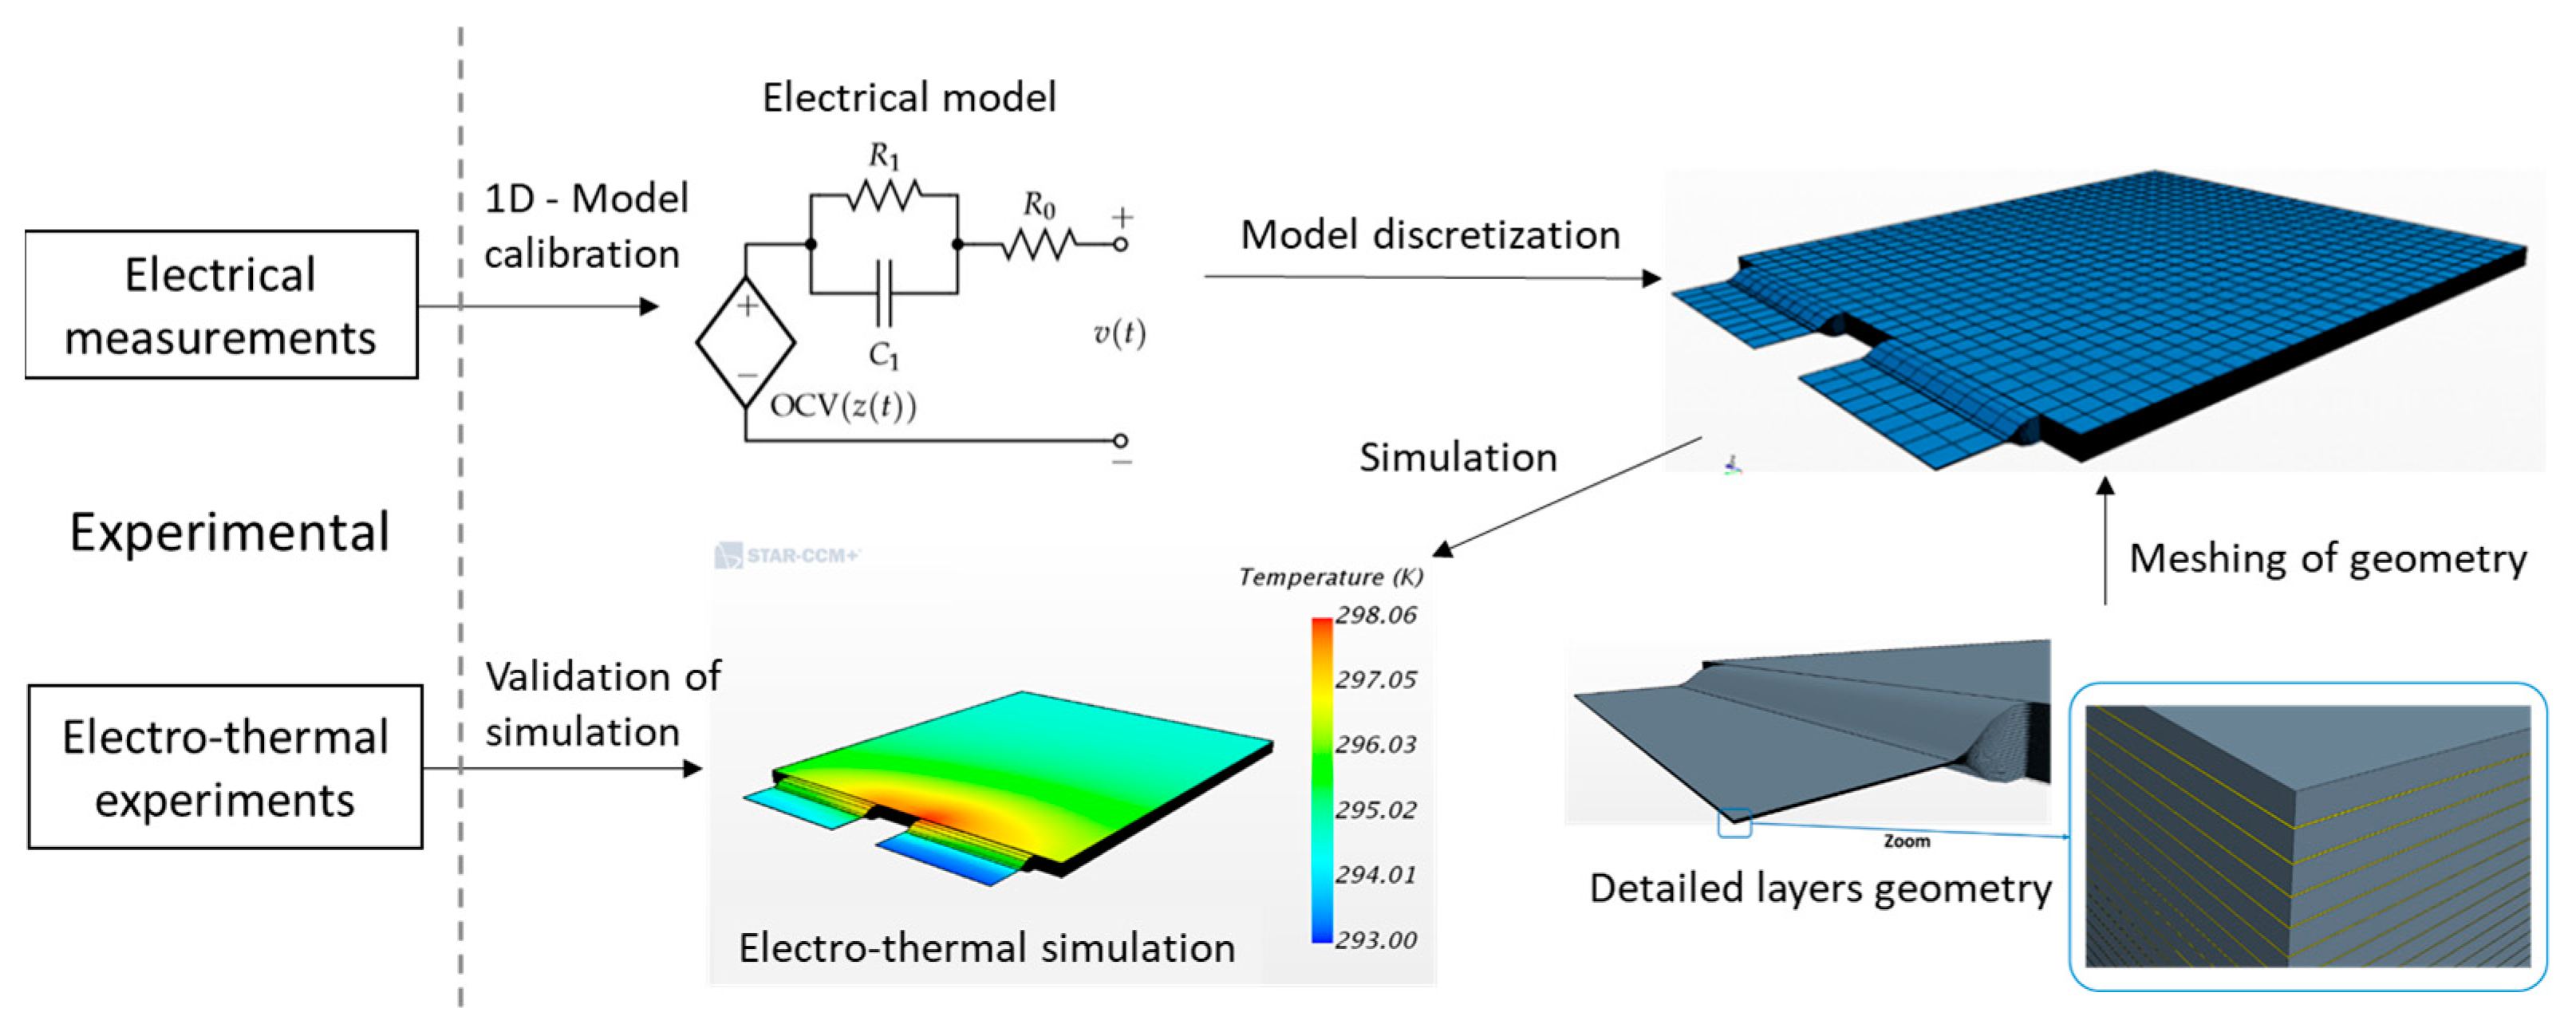
A detailed multilayer electro-thermal model is used primarily to predict the temperature, electrical current density, electrical potential and state of charge (SOC) distributions in the cell volume during operation. The detailed model can be used to predict the local status of these variables under transient conditions. To construct the model, the detailed cell geometry was first built, then the cell region volumes were associated with the equivalent circuit model. The internal cell geometry was investigated by disassembling one cell sample and extracting a specimen to measure the thickness of each layer, as well as the total number of layers; the complete procedure was described by Kovachev et al. [7]. Based on experimental measurements, the geometry was built with three-dimensional (3D) Computer Aided Design (CAD) software. The geometry was then discretized with dedicated software: The mesh size and density distribution were chosen according to the expected locations of the gradients (depending on the specific load case). A schematic workflow of the utilized procedure is reported in Figure 1.
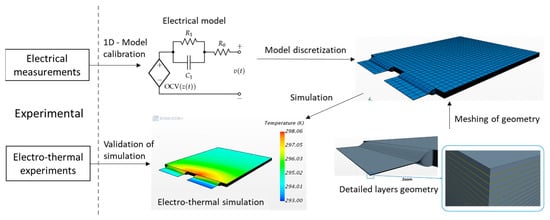
Figure 1.
Schematic of the workflow strategy used for the cell testing, simulation and validation processes. On the left-hand side of the dotted line, the experimental section is divided in-to calibration and validation tests. On the right-hand side of the dotted line, the main steps of modeling process used to generate the electro-thermal model are shown.
The equivalent circuit model was calibrated based on the experimental electrical measurements described in Section 2.2. The equivalent circuit model is constituted by a controlled voltage source with a first order R-RC network. Such a model can be calibrated with experimental data by using several different methods described in the literature [27,28,29,30,31]. However, this calibration is beyond the scope of this manuscript. The electrical model was then transferred to the cell geometry for the 3D evaluation of the electric and thermal quantities. The model was then used to reproduce the nail penetration test scenario, and the experimental results were used to validate the model.
2.2. Equivalent Circuit Model Definition
Based on a literature review and the electric circuit theory, the electrical behavior of a Li-ion cell can be modeled with an equivalent circuit network. A battery equivalent circuit is modelled to predict the voltage and electric current under operating conditions (i.e., when an external load is applied) [28,32]. The equivalent circuit can be practically modelled with a controlled voltage source in addition to a suitable impedance [32]. The electric voltage source mainly depends on the battery SOC, but temperature and external mechanical pressure can also affect the cell voltage and its electrical behavior [33]. The Open Circuit Voltage (OCV) can be measured over the whole SOC range to calibrate the controlled voltage source and determine the level of SOC dependence. The impedance, meanwhile, needs to be modeled with an electric network; the complexity of this network depends by the model target requirements. This impedance can be arbitrarily chosen to best fit the experimentally measured impedance behavior [29]. The circuit parameters—voltage source and electric components of the equivalent circuit network—can be calibrated based on the charging–discharging curves and the results of electrochemical impedance spectroscopy analyses of the cell, making this approach both robust and empirical [28,29,32]. In this research, a general first order R-RC circuit was adopted, as will be shown in Section 2.3, this choice will be suitable for the adopted discretization method. Furthermore, the electrical load case under study (i.e., fast discharging with constant resistance) does not exhibit high dynamics, hence making suitable, for this scope, a first order R-RC circuit.
2.3. Discretization Method
An equivalent circuit model provides the cell voltage and current (at the cell tabs) for a certain electrical load case condition. In a multidimensional model, such as finite elements modelling (FEM), information about the cell voltage, current, SOC and temperature must be distributed throughout the cell volume and discretized by applying a proper strategy. No standard discretization procedure could be identified in the literature review; therefore, a discretization strategy was implemented, which is described in this section.
A pouch Li-ion cell is formed by placing several elementary cells in parallel and electrically connecting them to each other via the cell tabs. Each elementary cell contains all components required for the electrochemical energy storage and, in principle, could work independently; the elementary cell generates a voltage and electric current according to its SOC status and ambient conditions (i.e., temperature, external pressure). The number of elementary layers obtained by dissecting a cell sample is reported in Section 3.1, and this number was used to deduce the number of elementary cells. If one elementary cell were split (ideally) in small blocks, each block would contain a portion of all needed cell electrochemical components: current collectors, electrodes and separator (soaked in electrolyte). The obtained elementary block could (ideally) generate the cell voltage and sustain an electric current (scale depending on the block size), considering its volume with respect to the whole active material volume. A sketch of an exemplary elementary block (a small fraction of the whole cell) and its correlation to an equivalent circuit model is shown in Figure 2. The elementary block should keep track of the electrical current passing through it, so that the amount of charge can be calculated and the appropriate voltage can be set. This feature has been implemented in the FEM software with a custom field function. Regarding the discretization strategy, the electrical quantities of the equivalent circuit were associated with the electrical conductivity of each layer of the elementary block. As result, the total resistance of the layers was fitting the equivalent circuit quantities obtained from the empirical measurements. The equivalent circuit was then split into two parts (maintaining the overall resistance and capacitance values) to obtain correspondence with the cell internal layers disposition. The OCV, shown in Figure 2 with terminals VA and VB on the equivalent circuit, was then transferred to the geometry on the surfaces between the separator and the electrodes. Each node of the OCV generator corresponds to an isopotential surface on the geometry.
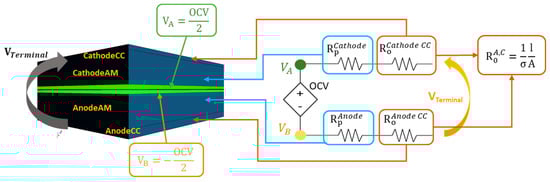
Figure 2.
Transfer of the discretization strategy from the equivalent circuit model to the volumetric finite elements model. Rp is the polarization resistance, Ro is the ohmic resistance, CC stands for “current collector”, σ is the electrical conductivity, l is the layer thickness and A is the block surface section. The parallel RC element has been replaced by an equivalent single resistor: Its values depend on the variation in the voltage drop, which introduce the desired capacitive effect.
The contribution of the ohmic resistance (indicated by Ro) is transferred to the current collector layers, while the contribution of the polarization resistance (indicated by Rp) is transferred to the electrode volumes. The electrical conductivities of each layer were calculated with the formula indicated in Figure 2 to match the resistance values of the equivalent circuit. In a first-order R-RC circuit, the polarization resistance finds a capacitor in parallel with it; however, the capacitive effect was included by considering the polarization resistance value depending on its voltage in the previous instant, since the capacitive effect cannot be directly modeled with pure electrical resistivity (in the FEM model). The complete procedure has been described by Plett [33]. This discretization method is applied to obtain a model that can then be used to calculate the cell heat production based on the results of the experimental tests. Since it is not possible to experimentally measure the local voltage, electric current density or the SOC of the cell in its active material volume, the electrical quantities can only be validated by measuring the voltage and current at the tabs. Therefore, the model was validated by simulating the experimental test conditions and comparing the tab voltage and cell surface temperature results.
2.4. Mesh and Simulation Setup
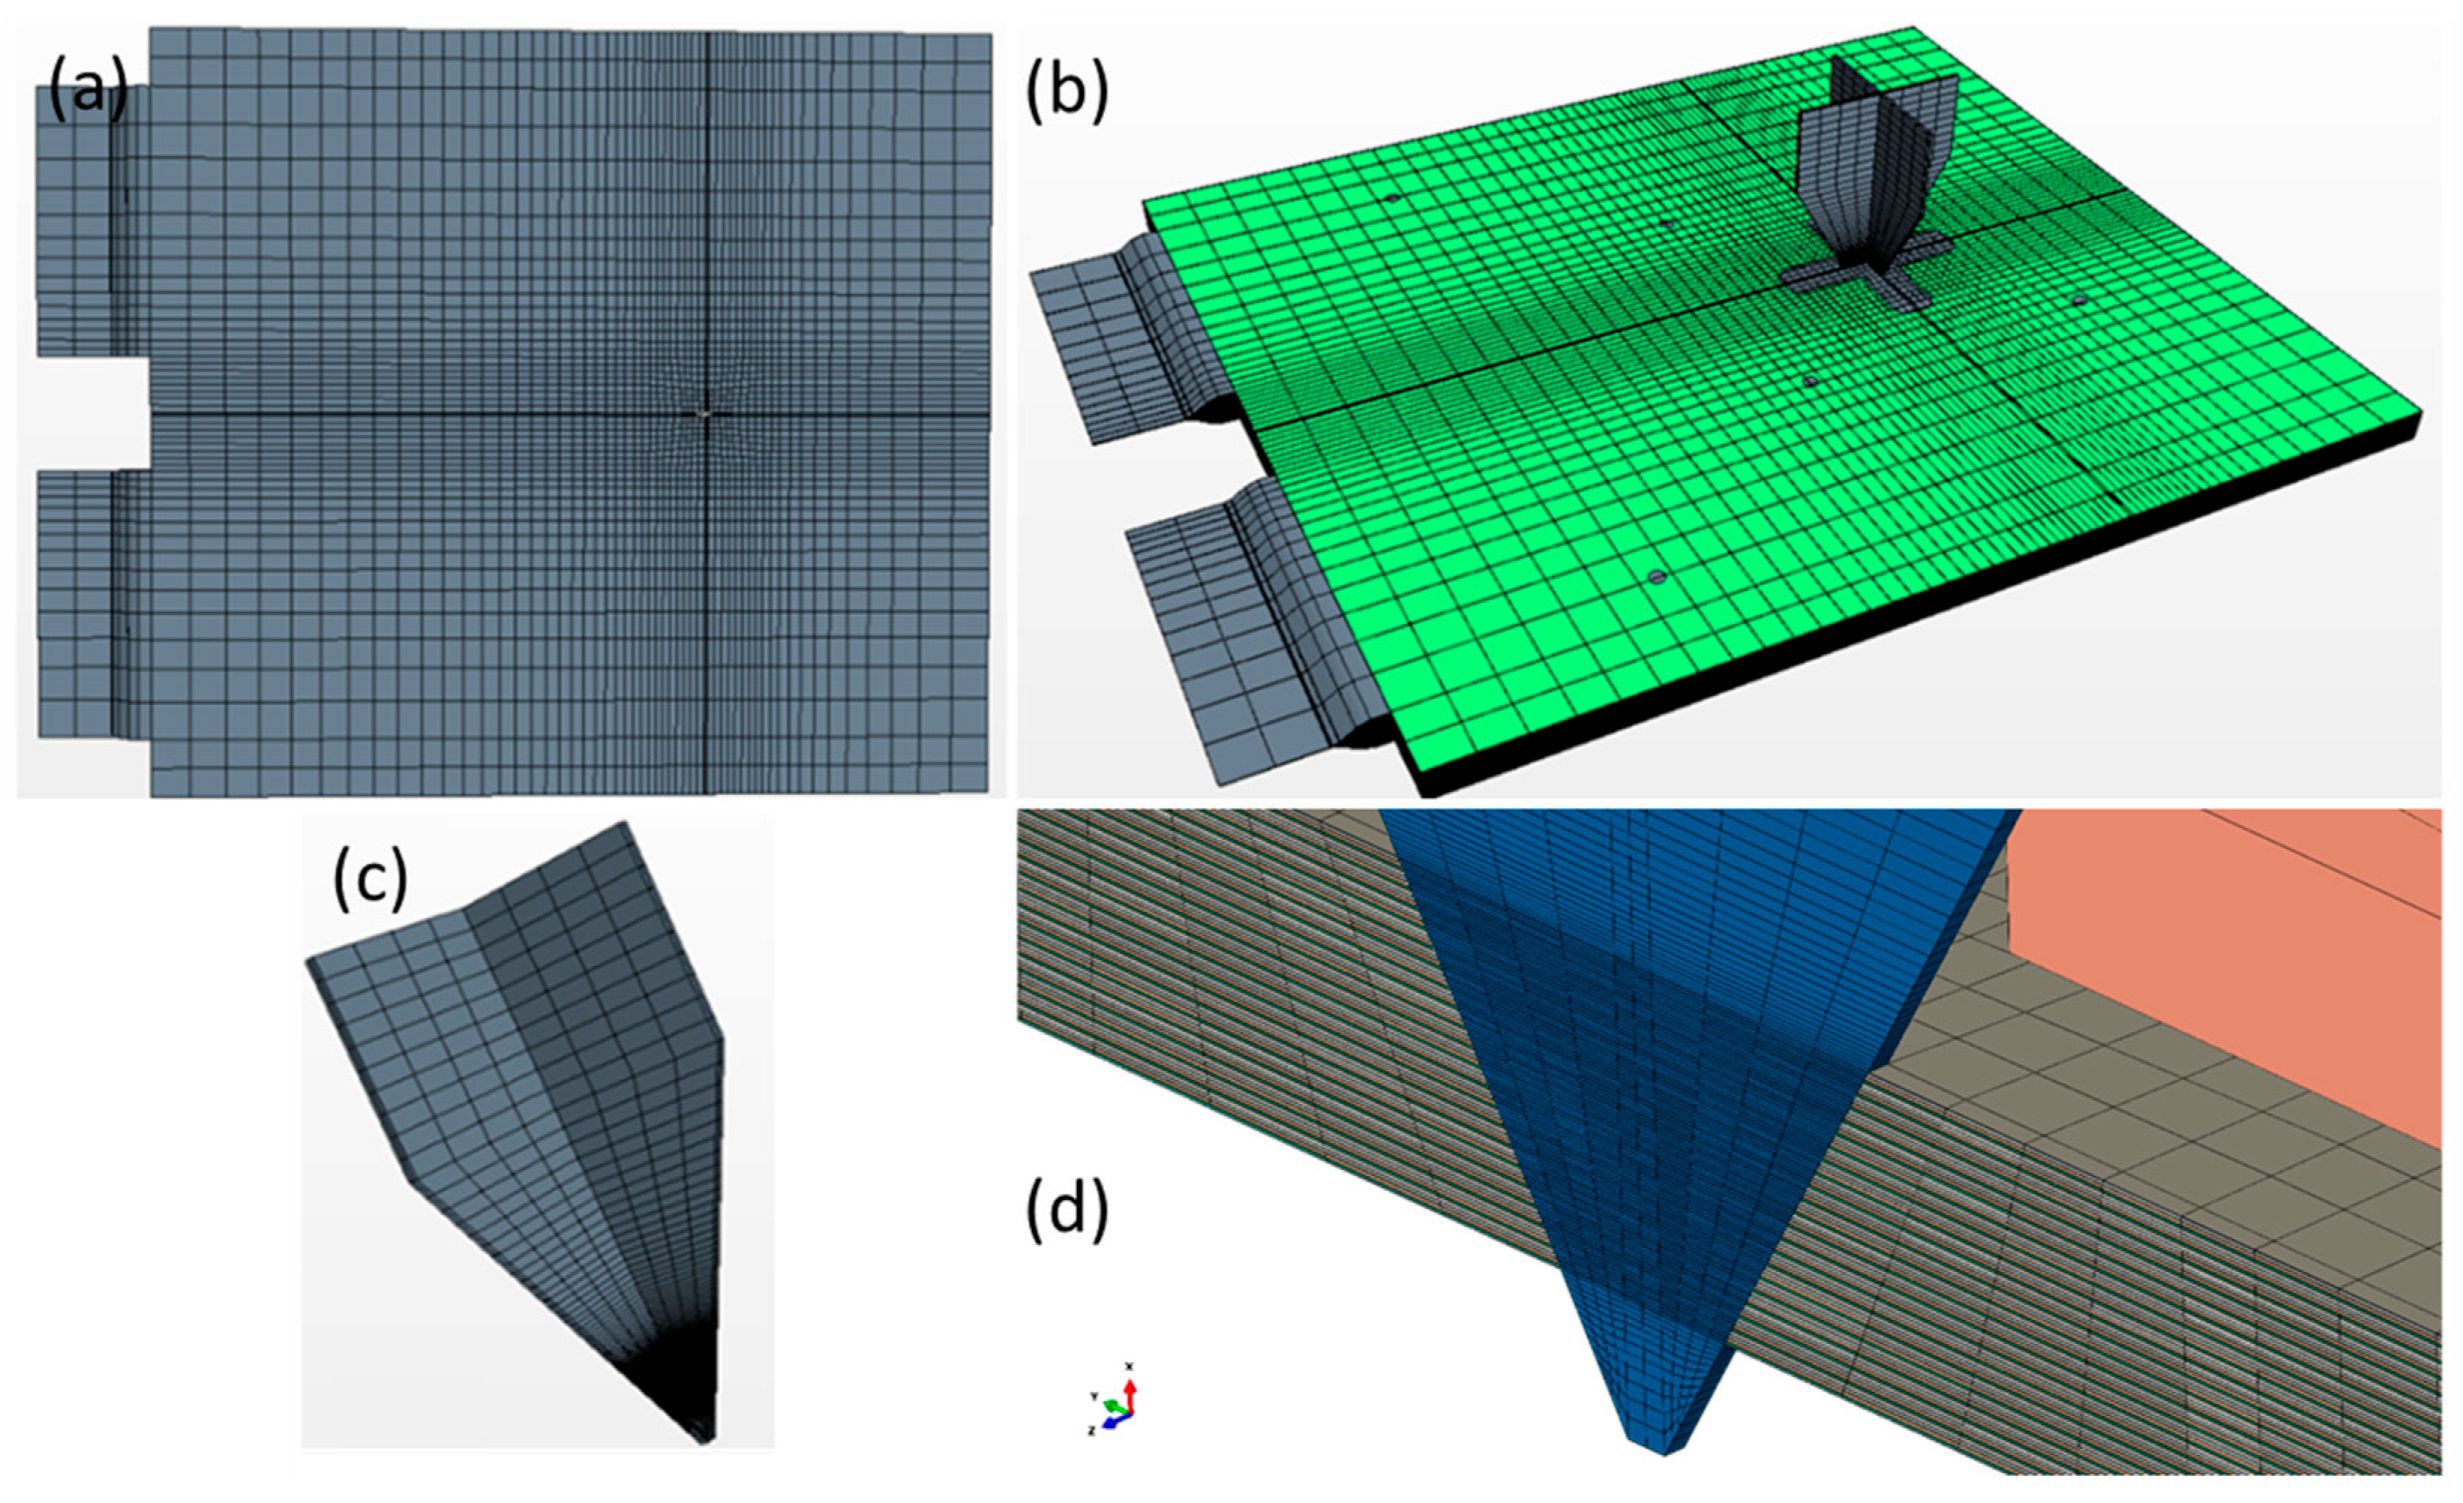
The calculation was carried out with Star CCM+. The calculation settings were established to reproduce the test set-up described in the experimental section. The geometry of the penetrated cell was obtained by intersecting the cell (in its pristine condition) and the nail in its final position; the intersected cell volume was then removed to accommodate the nail and obtain coincident contact surfaces. The meshing of the cell volume was performed by implementing a higher element density in the surrounding in the nail surroundings (due to higher gradients expected in that region). In order to facilitate convergency, the mesh of the nail and the one of the cell were constructed to be coincident (coincident contact nodes). A visual report of the mesh layout is shown in Figure 3. The thermal and physical density of the cell internal components were obtained from Maleki et al. [34]. The electrical properties of the current collectors and active material layers were established as described in Section 2.3. A user field function was built to keep track of the electric current passing through each element of the active material and to calculate the local relative SOC. This calculation enabled the proper local voltage to be set according to the OCV curve. The top steel plate (described in the experimental section) was modeled as a thermal mass. The bottom part of the cell was set in adiabatic condition, since it was in contact with wood, which is a good thermal insulator. The top of the steel plate was set with forced convection heat transfer condition (to reproduce the air flow due to the blower) at the monitored ambient temperature.

Figure 3.
Overview of the mesh utilized for the calculation. (a) Top view of the cell, whereby the mesh has finer seeds near the point of nail puncture; (b) overview of the cell and the nail in its final position; (c) the nail was meshed in order to obtain coincident nodes at the contact surface; therefore, the elements density is higher on the portion of the nail that is in contact with the cell; and (d) section view of the nail introduced into the cell volume.
3. Experimental Method
3.1. Cell Description
The cell samples were laminate pouch-type cells with a rated capacity of 41 Ah and a nominal voltage of 3.7 V. The electrodes chemistry was experimentally determined by analytically dissecting the cell as described in Kovachev et al. [7]. It was found out that the cathode chemistry is a spinel of NMC and LMO, and the anode electrode material is graphite. The cell weight was approximately 800 g and with a size of 290 × 216 × 8 mm. Several cell samples were dissected to investigate the internal components. The thicknesses of the internal layers were measured with scanning electron microscopy and the result is reported in Table 1. Regarding the thermal properties of the cell, the orthotropic thermal conductivity was measured in situ as described in Aiello et al. [6]; the obtained values were referred to the overall cell stack and not to each single layers. However, since the current collectors were made with known materials (copper and aluminum) and the thickness of the layers was known, the estimation of the thermal conductivity of the active material (including electrodes and separator) was calculated from the equation of the thermal network of the cell. The missing parameters, such as specific heat and density of the active material, were obtained from Maleki et al. [34]. An overview of the thermal values used in simulation are reported in Table 1.

Table 1.
Physical properties of the components contained in the cell and the thickness of its internal layers obtained by scanning electron microscopy.
More detailed information about the procedure used for the cell dissection and analysis can be found in Kovachev et al. [7].
3.2. Equipment Description
Nail penetration was performed with an automated quasi-static hydraulic press. The speed and position of the nail was controlled by the system and recorded with an expandable datalogger device (National Instruments model: cDAQ-NI 9178). Furthermore, the voltages and temperatures (sensed with type K thermocouples) were measured and acquired with the same datalogger device. Since smoke production and gas venting were expected during the test, a blower was positioned in front of the hydraulic press; this device had a dual function: to protect the operators and to flush the smoke away to allow the operators to keep the apparatus in sight.
3.3. Nail Design
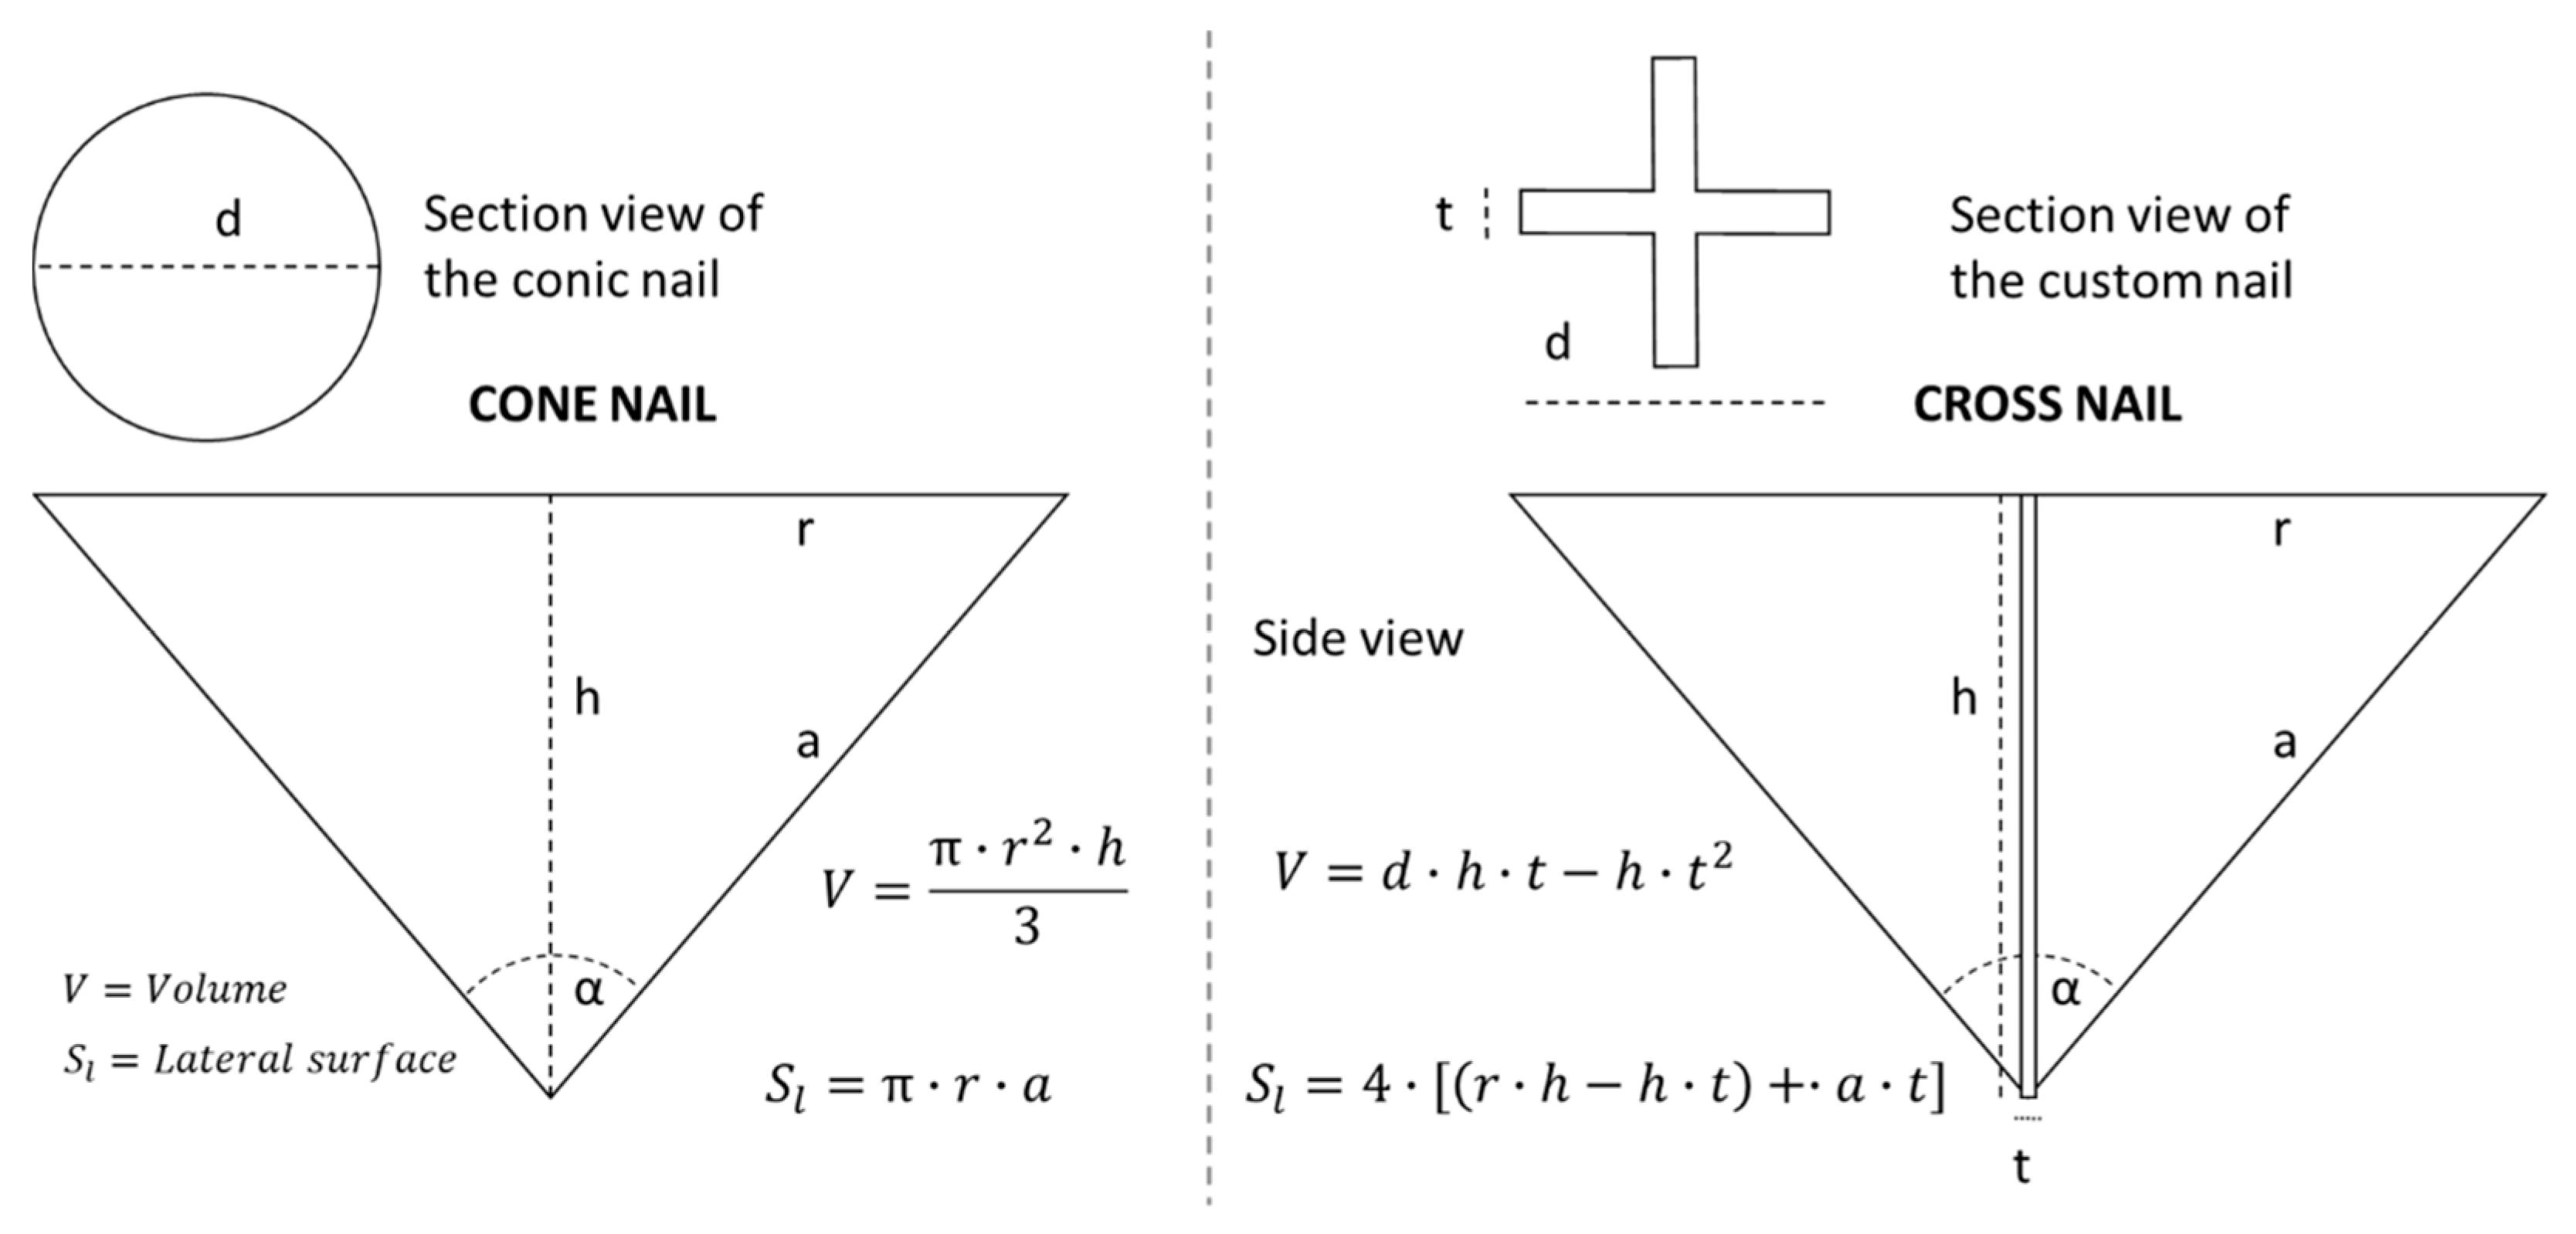
The introduction of an external volume during nail penetration causes the delamination and strong movement of the layers near the nail [25,26]. This phenomenon has two relevant effects: First, the (potential) interposition of the separator between the nail and the cell layers (electrodes and current collectors) mitigates the electrical short circuit amplitude and, second, the displacement and delamination alter the electrical behavior of the cell. The layer delamination and displacement near the nail can be mitigated by reducing the volume of the introduced object. Thus, the nail was designed to maximize the surface contact with the cell layers and to minimize the introduced volume. The standard nails that are used for testing are typically conical in shape, with an entering angle of 30° and with variable diameter typically of 5 mm thickness [25]. As an important requirement, the nail has to provide adequate stiffness and mechanical stability to sustain the reaction forces and prevent deflection from occurring during the penetration. If we compare the section perimeters of several possible geometrical shapes with equal diameter (circular, square, triangular and cross), we can note that the nail with cross shape perimeter shows a higher value, suggesting that the respective extruded solid has a higher external surface area. The results of the geometrical evaluation are shown in Figure 4.
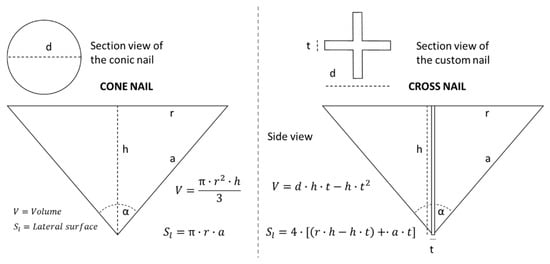
Figure 4.
Geometrical comparison of the external surface and the volume for the conical and cross-shaped nail. Next to the geometries are specified the equations used for the calculation of the external surface and the object volume.
Assuming an entering angle of 60° and a fixed diameter of 40 mm, the external surface and volume can be calculated for the conical and cross-shaped nail as described in Figure 4; the resultant values of external lateral surface areas and volumes for the two different shapes are compared in Table 2.
Table 2.
Comparison of the lateral surface areas and volumes for the conical and cross-shaped nails.
The ratio between external surface and volume is significantly higher for the cross-shaped nail with respect to the conical nail. The cross-shaped nail would introduce a volume that is about 12 times lower into the cell active material, reducing the effect of delamination and layers movement. With except of the nail shape, the designed nail characteristics (i.e., entering angle, material and diameter) and the testing procedure (i.e., nail speed) described in the following chapter meet the requirements specified in the Global Technical Regulation (GTR) for electric vehicles [35].
3.4. Test Settings Description
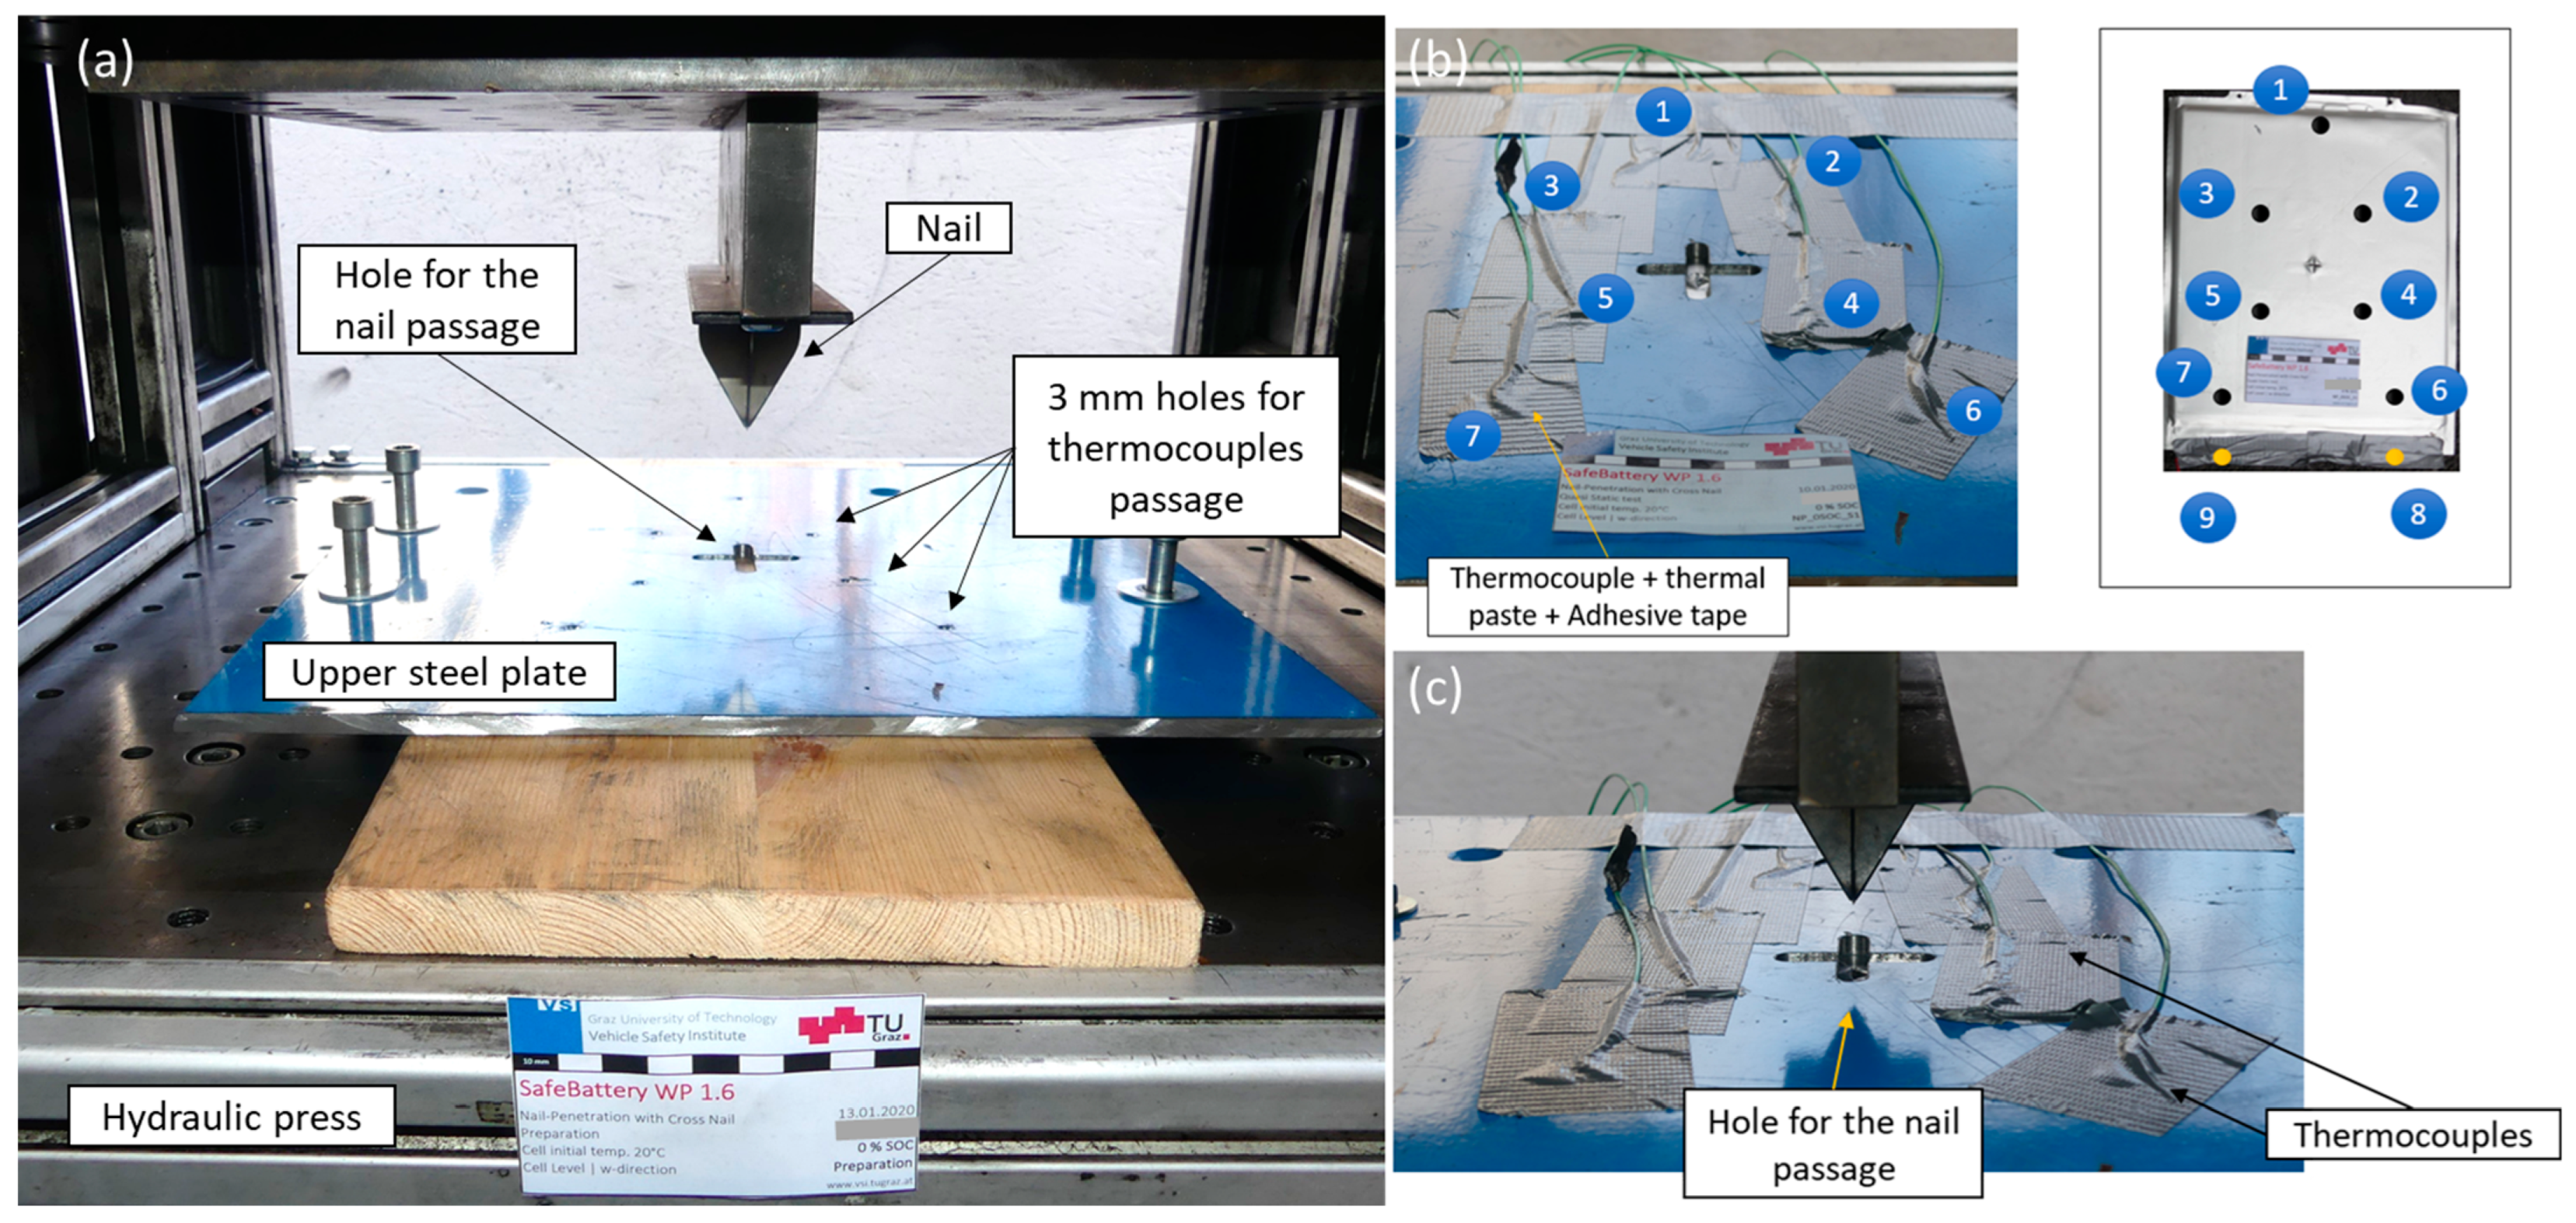
The quasi-static hydraulic press was used to control the speed and position of the nail during the penetration. To hold the cell in position during the tests (thermal runaway and venting was expected), a 10-mm-thick steel plate was placed on top of the cell. The steel plate was prepared by creating an opening at its center with the nail section projection, which allowed the nail passage; this opening was created with a milling machine. The tab voltage and temperatures at seven points on the cell surface were monitored during the test. Two additional thermocouples were added to the tabs to monitor their temperature as well (one thermocouple per tab). A camera was positioned in front of the test bench to create video documentation and a blower was used to flush away the smoke and protect the operators during the tests. The ambient temperature was also monitored during the tests. An overview of the test setup and sensors positions is shown in Figure 5. The five cell samples were charged to 100% SOC and kept in a storage room at 20 °C temperature for at least 12 h prior the tests. The SOC was set with a programmable DC power supply (Model: EA-PSI 9000 3U) and an electronic load (Model: EA-EL 9000 B): a charging current was applied at 1-C rate (i.e., 41 A), then once the charging device switched to voltage control mode, the procedure was terminated when electrical current was below the value of C/20 of C-rate. The following procedure was used for all tests: The nail speed was set to 1 mm/s, and the total displacement of the nail was set to 12 mm (cell thickness was about 8 mm) to ensure that the whole length of the cell was fully penetrated. After insertion, the nail was left in the penetrated position for 10 min before it was extracted.
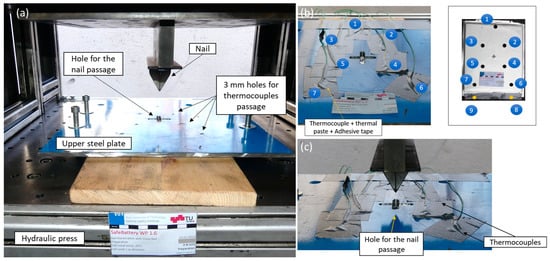
Figure 5.
Overview of the test setup. (a) A wood plate was placed below the Li-ion cell to protect the quasi-static hydraulic press and a steel plate was placed on top of the cell to keep the cell in position during the thermal runaway event; (b) thermocouples numbering and positions; the sensors were in contact with the cell through holes (3 mm diameter) on the steel plate, additional thermal paste was applied for each thermocouple then finally fixed with adhesive tape; and (c) thermocouples were positioned to sense the temperature gradient on the cell surface, extending from the area surrounding the nail to the edges.
4. Results and Discussion
4.1. Experimental Results
The results show that violent exothermal behavior and gas venting occurred in-all the conducted tests. Observing all the five test repetitions it is possible to identify common stages indicative of evolution of internal cell pressure and gas ignition that occur during the process. Initially, it was possible to observe the expansion of cell and the consequent movement of the steel plate just a few seconds after the nail was inserted (i.e., within the first 5 mm of penetration). Approximately five seconds after the nail penetrated the cell, violent gas venting occurred. With gases being ejected from the opening produced by the nail. During the release of these gases, numerous sparks and embers were produced in the vicinity of the nail, potentially due to extremely high electric currents generated in the area near the nail. This effect can be attributed to the high current density and resulting local melting of current collectors. If environmental conditions are suitable (atmospheric pressure and humidity), the sparks and embers produced can ignite the hot gases that are released into the surroundings. This phenomenon was observed two times in five test repetitions. The duration of the main exothermal behavior was about 30 s; afterward, the cell cooled down slowly, but evidence of the combustion was still apparent potentially due to uncombusted residual active material. In Figure 6, all of these described phases are illustrated; for each of these phases, a representative screenshot from the video documentation is shown.
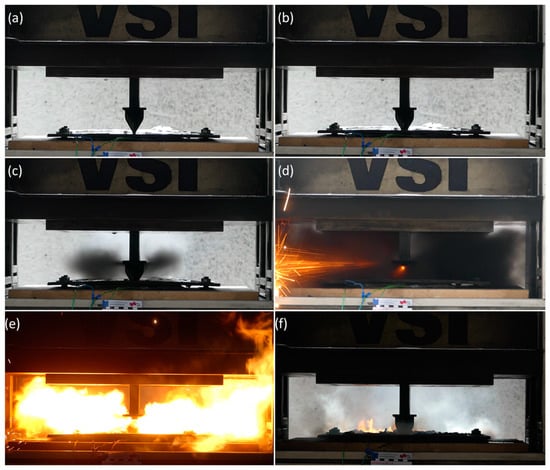
Figure 6.
Screenshots highlighting video-documented phases observed during tests. (a) Nail position before the penetration (t = 0 s); (b) nail penetrates through half of the stack (t = 5 s); (c) the increase in the internal cell pressure causes the top steel plate to bend and the initially produced gas to vent through the steel plate hole (t = 11 s); (d) sparks and embers occur during the violent gas venting stage; (e) vented gas ignites (potentially triggered by sparks) and, at this stage, the fire is actively sustained by the gas venting (t = 16 s); and (f) cell cools down slowly until reactants are completely consumed, while the internal electric current activity may still be ongoing (t > 40 s).
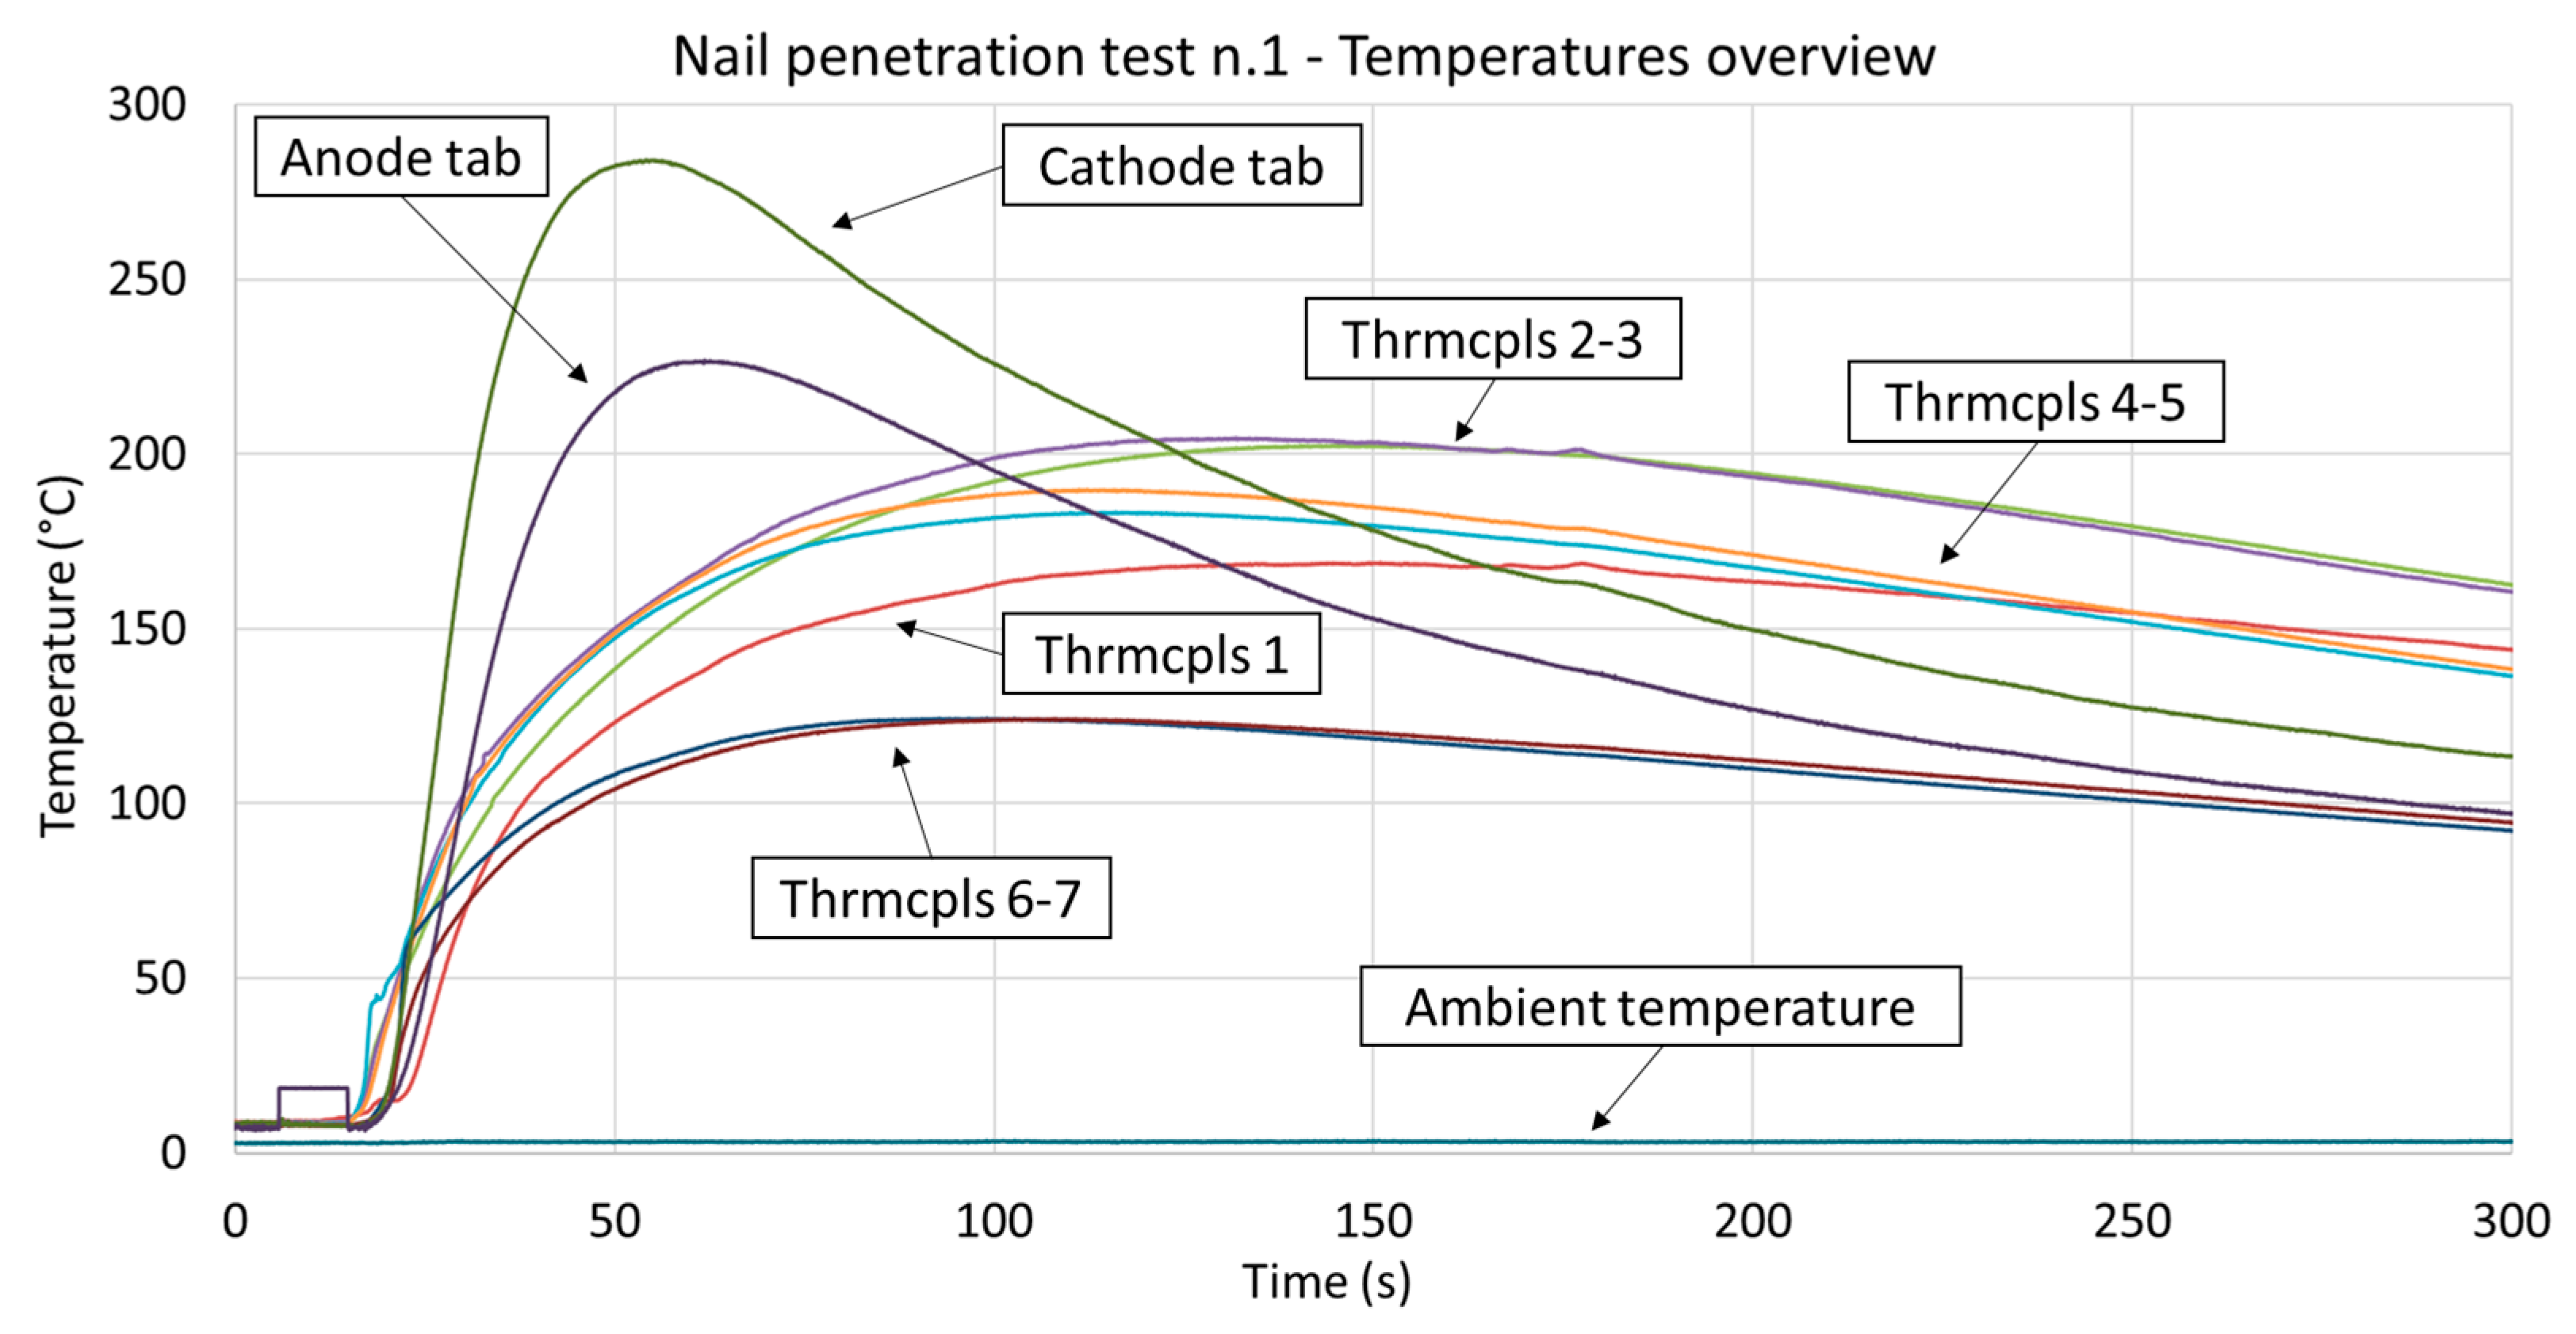
The change in temperature on the cell surface and tabs is shown in Figure 7. The tab temperatures reached considerably higher values (i.e., about 50% more) than the surface values. This can be explained by considering that the pouch bag introduces a certain thermal resistance in between the active material and the external surface (where the temperature sensors are placed), while the metal tabs are, in fact, in a direct thermal path to the inner active material. Additionally, the steel plate introduces a substantial thermal mass and cooling conditions that limit the temperature variations on the cell surface. Furthermore, the nail itself represents a thermal path to the hydraulic press steel structure, which had a temperature close to ambient (included within the range 0–5 °C).

Figure 7.
Temperature measurements made in the nail penetration test. The thermocouples numbers and position are described in Figure 5. The temperatures of the anode and cathode tabs increased more rapidly in the initial stage of the test. Thermocouples 6 and 7 registered markedly lower temperatures due to their greater distance from the nail. The ambient temperature was within the range 0–5 °C.
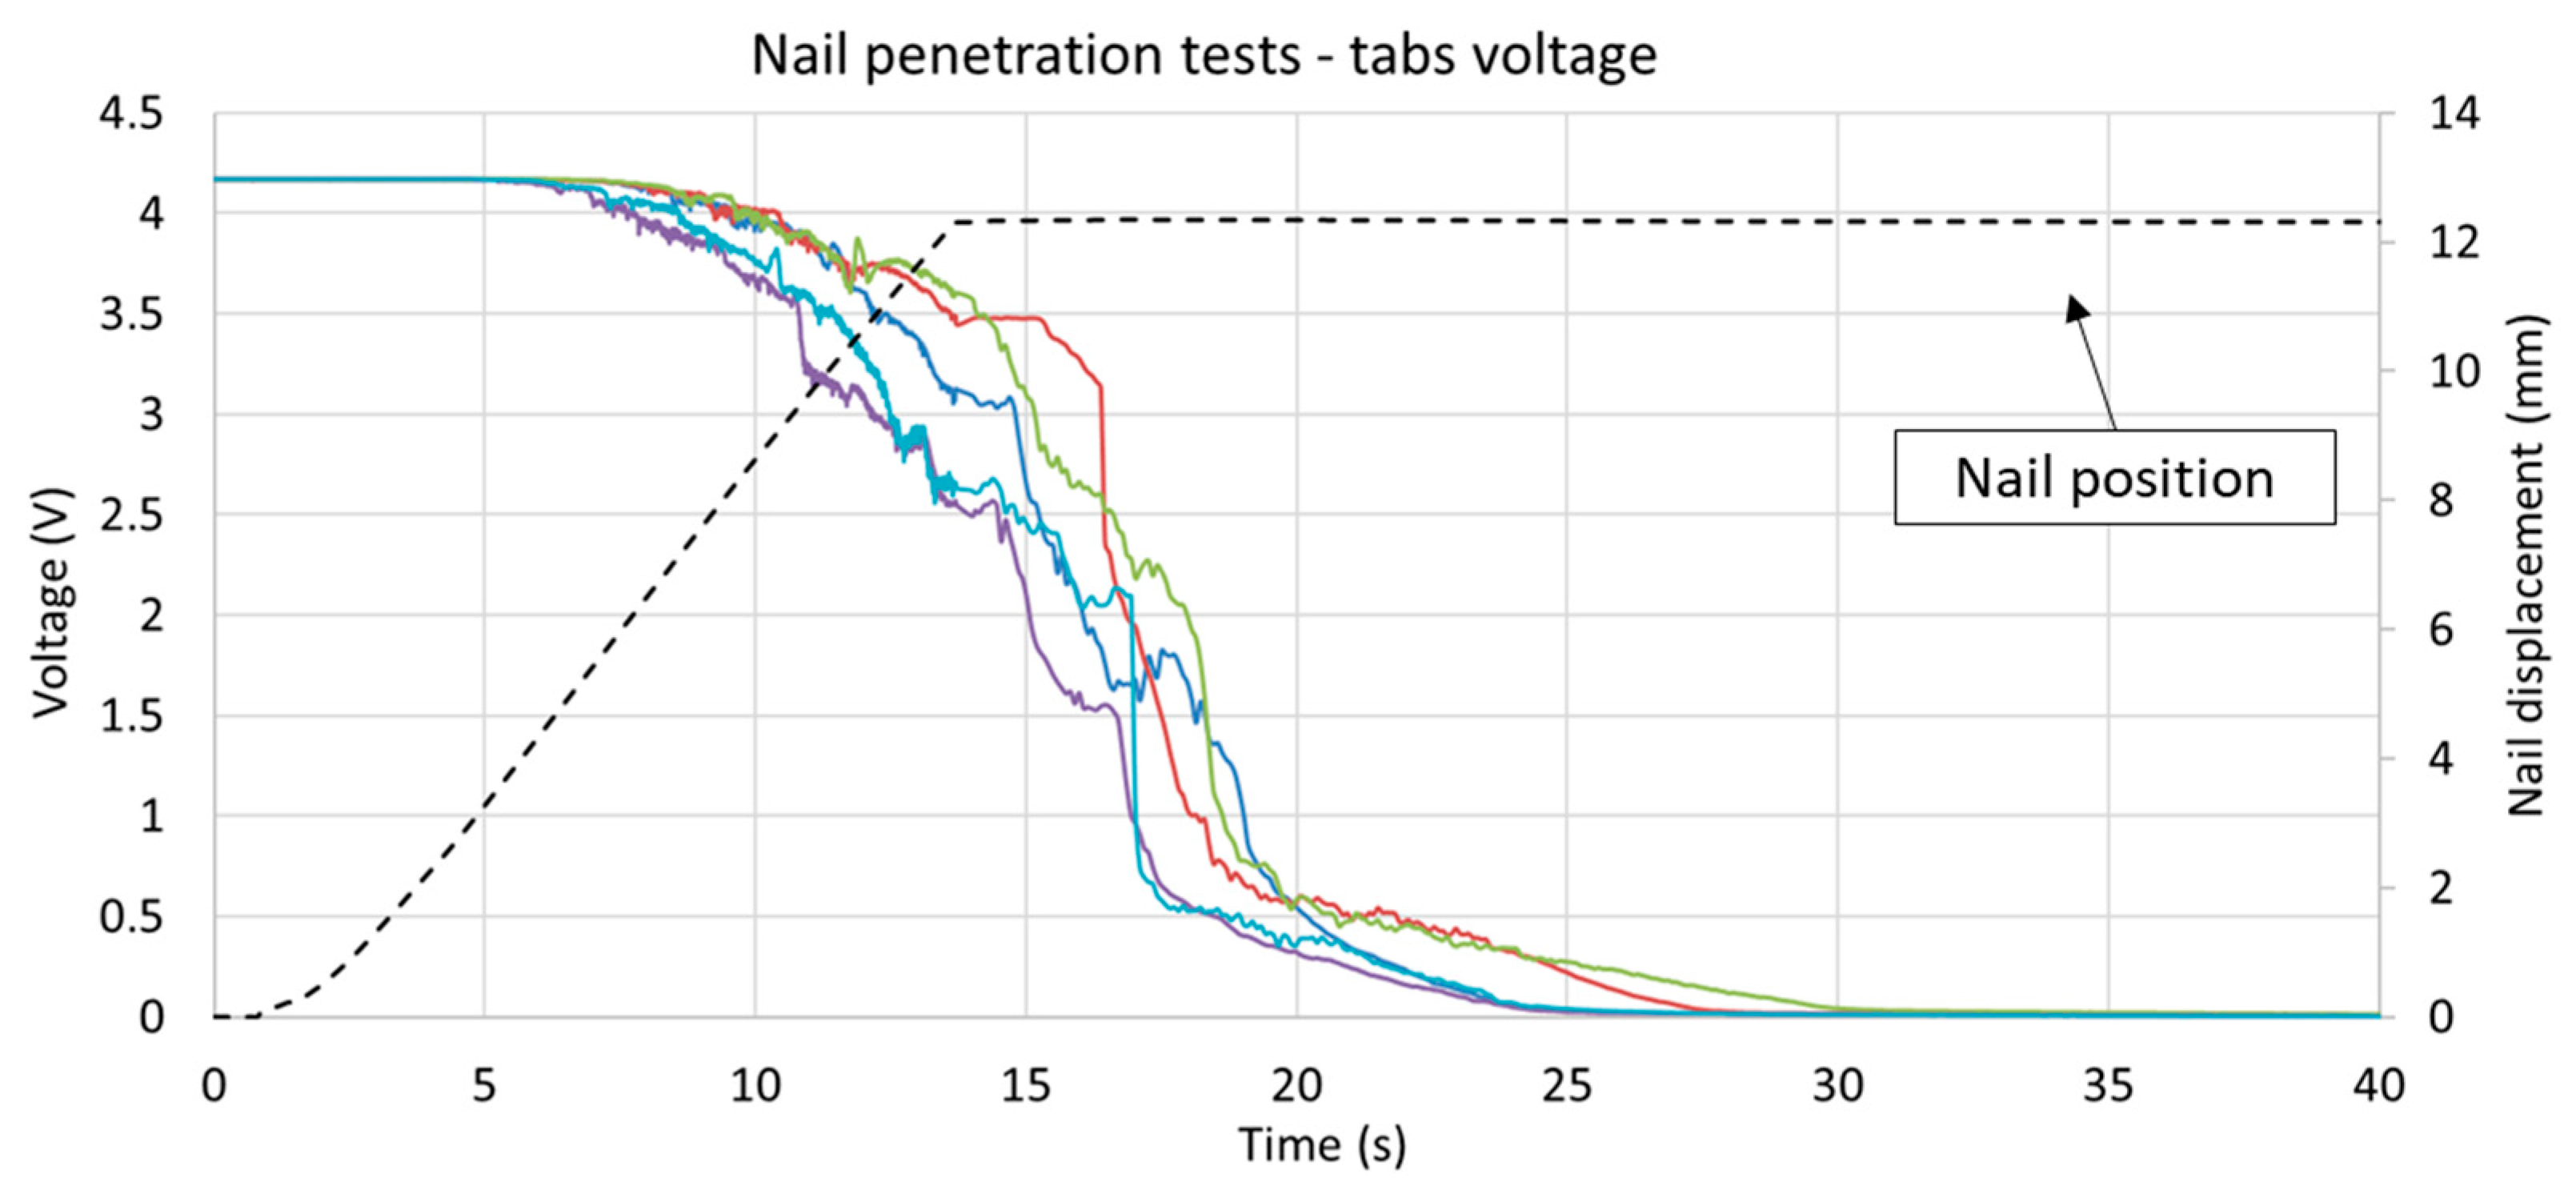
The electric short circuit stability and effectiveness of the nail functionality can be observed by examining the cell electric behavior. The customized nail with a cross-shaped section provided a stable electrical short circuit in all five repeated tests, and the nail reliability can be assessed by comparing the differential tab voltage measurements made in each test, as shown in Figure 8.
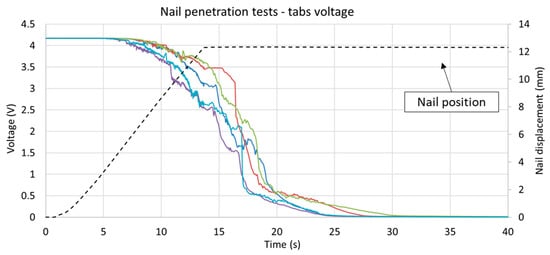
Figure 8.
Overview of the Li-ion cells voltage and nail displacement observed during the nail penetration tests. All curves showed similar behavior and reach 0 V approximately 25 s after varying the initial voltage. As the nail penetrates further in to the cell volume, the slope (i.e., its absolute value) increases, suggesting a reduction in the electrical short circuit resistance.
Although the voltage curves display a certain variability, the voltage reached zero in a similar amount of time (an interval of 20–25 s), indicating that the discharging current was comparable in all repetition tests. A certain delay was observed between different stages of the test: the initial mechanical nail intrusion, the electrical short circuit and the increase in temperature. Comparing the cell voltage and nail position measurements (shown in Figure 8), it was possible to determine that the first appreciable electrical failure occurred when the nail had penetrated to a depth of approximately 5 mm (i.e., about 60% of the cell thickness). When the nail reached its final position (12 mm penetration depth after 12 s) internal over pressure was observable (due to the deformation of the steel plates) and temperature started to rapidly increase (as shown in Figure 7).
The experimental temperature and voltage data were used to validate the detailed layers model, the setup of which is described in the Methods section. The model validation was then performed by considering the electrical and thermal measurements as shown in Section 4.2.
4.2. Simulation Results
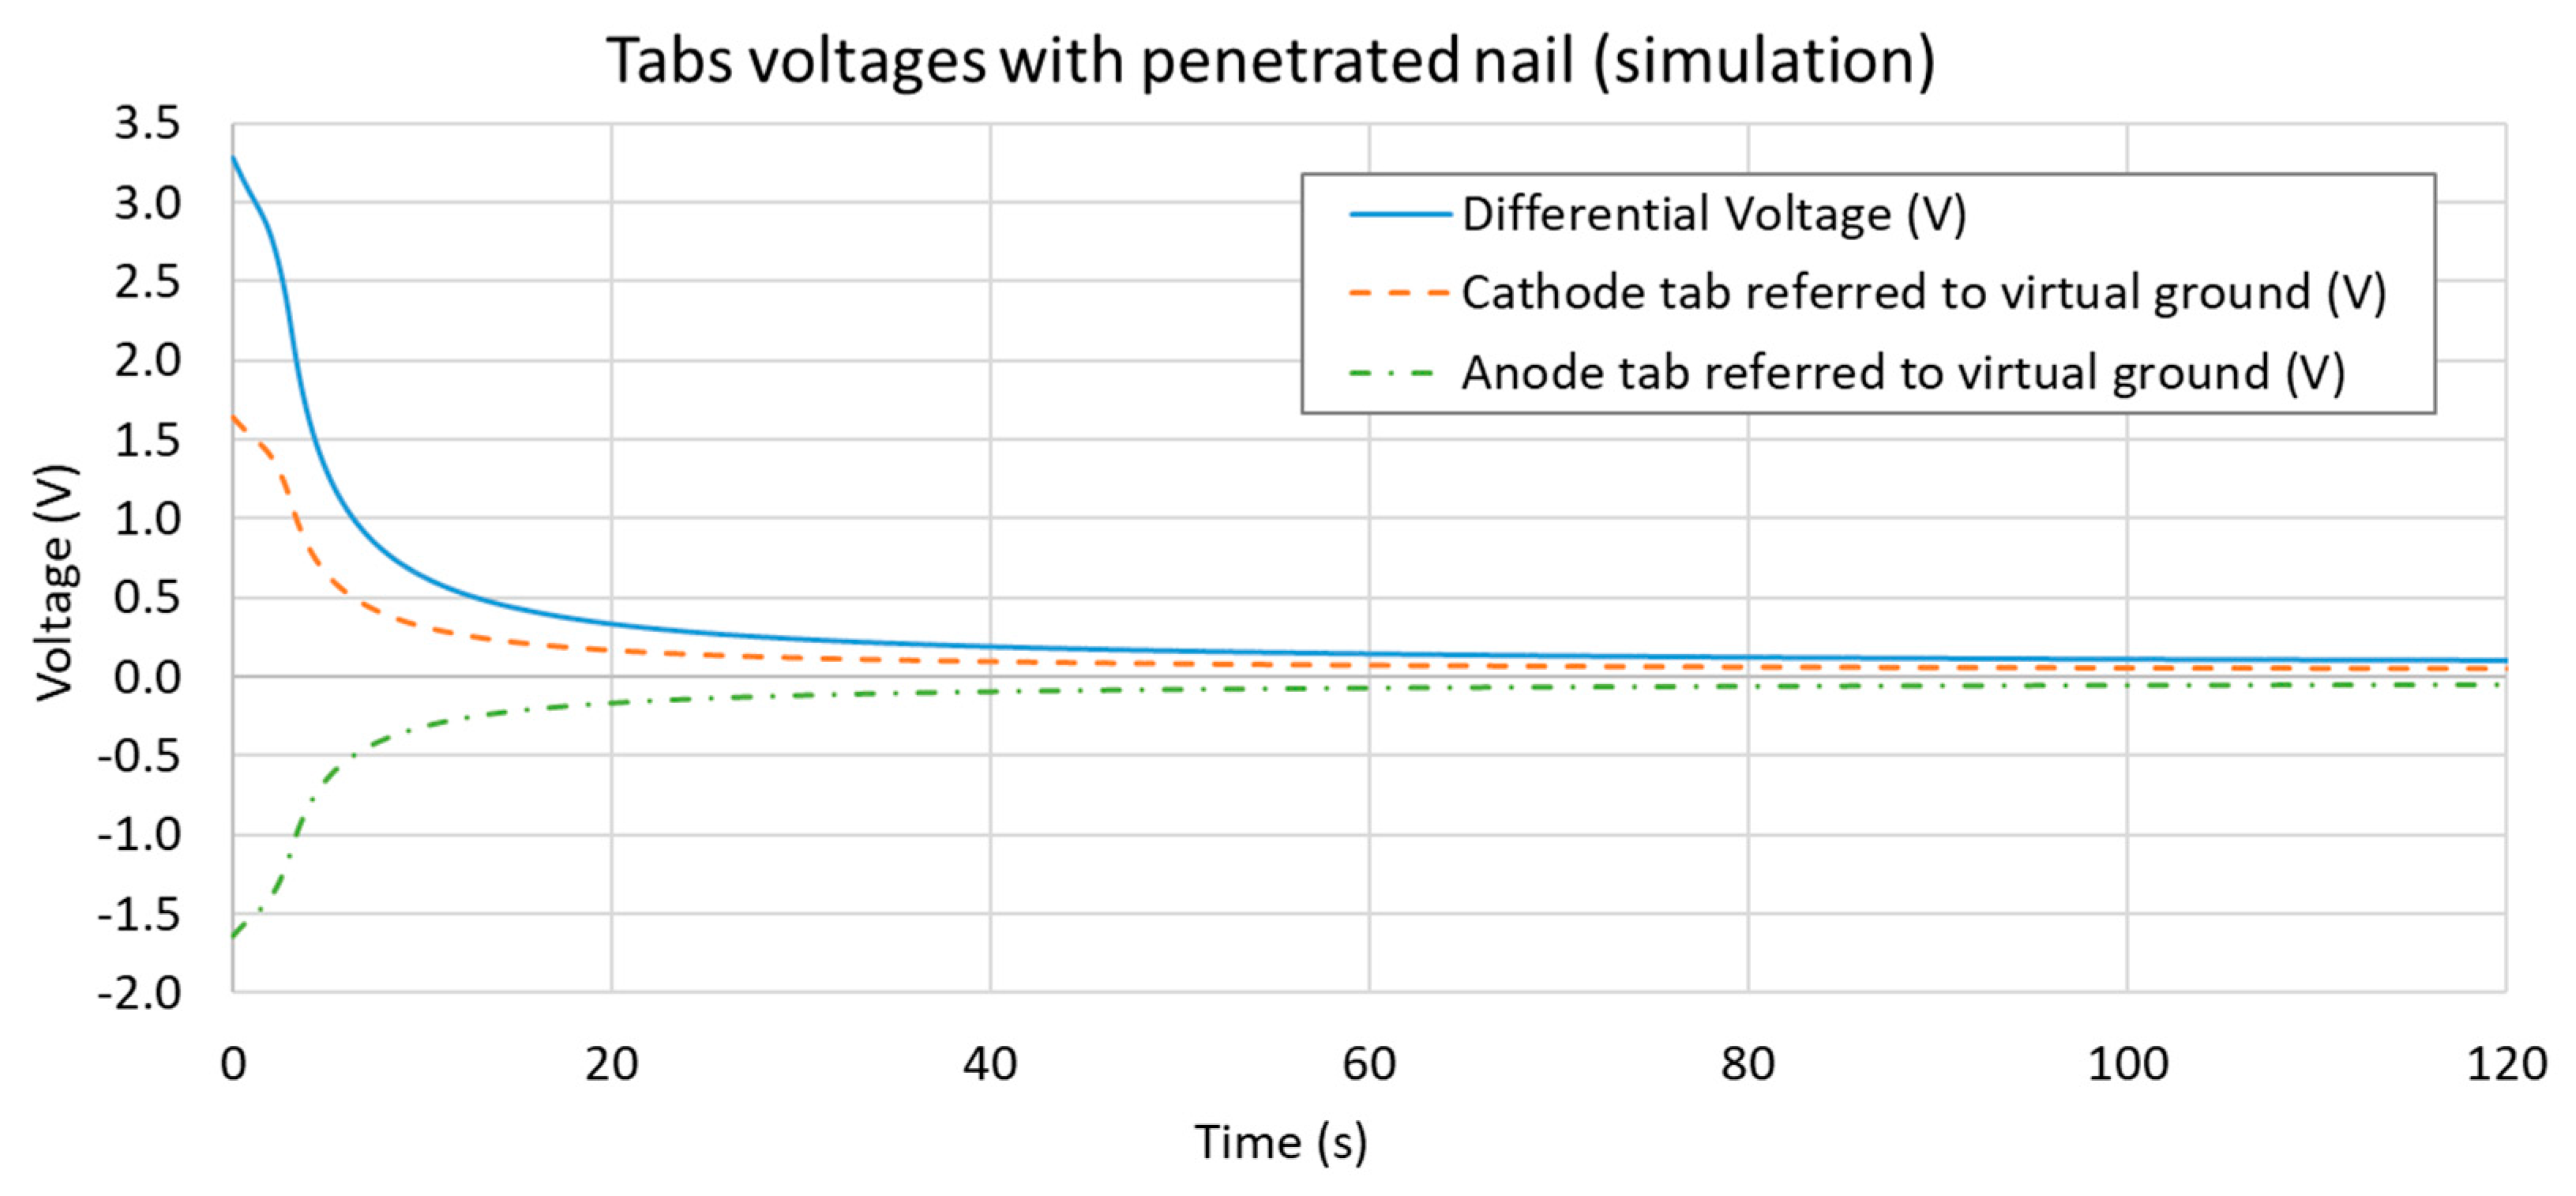
The initial SOC of the cell was set at 100%; hence, the initial tab voltage was 4.2 V (highest OCV voltage value). In the simulation, the nail was considered directly in its final displacement position (fully penetrated through the stack). Thus, the maximum electrical short circuit value was already imposed from the first time-increment, hence the tabs differential voltage resulted in a significant drop from the first-time increment and on. This effect can be observed by examining the tabs voltages (as compared to a virtual ground state) and their differential value, as reported in Figure 9. The differential voltage curve can be used for comparison with the results of the experimental data.
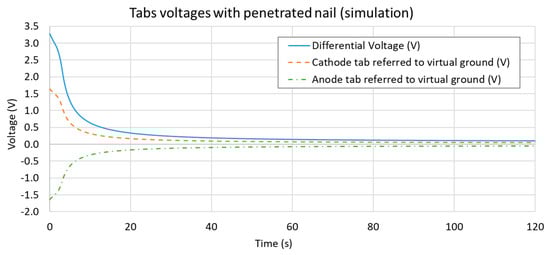
Figure 9.
Overview of each tab voltage obtained in the simulation (as compared to a virtual electrical ground state) and the tabs differential value obtained as their difference. Although a boundary condition of 100% SOC (initial differential voltage of 4.2 V) was set, since the nail was simulated already in its final position, the tab voltage dropped to 3.3 V during the first simulation increment.
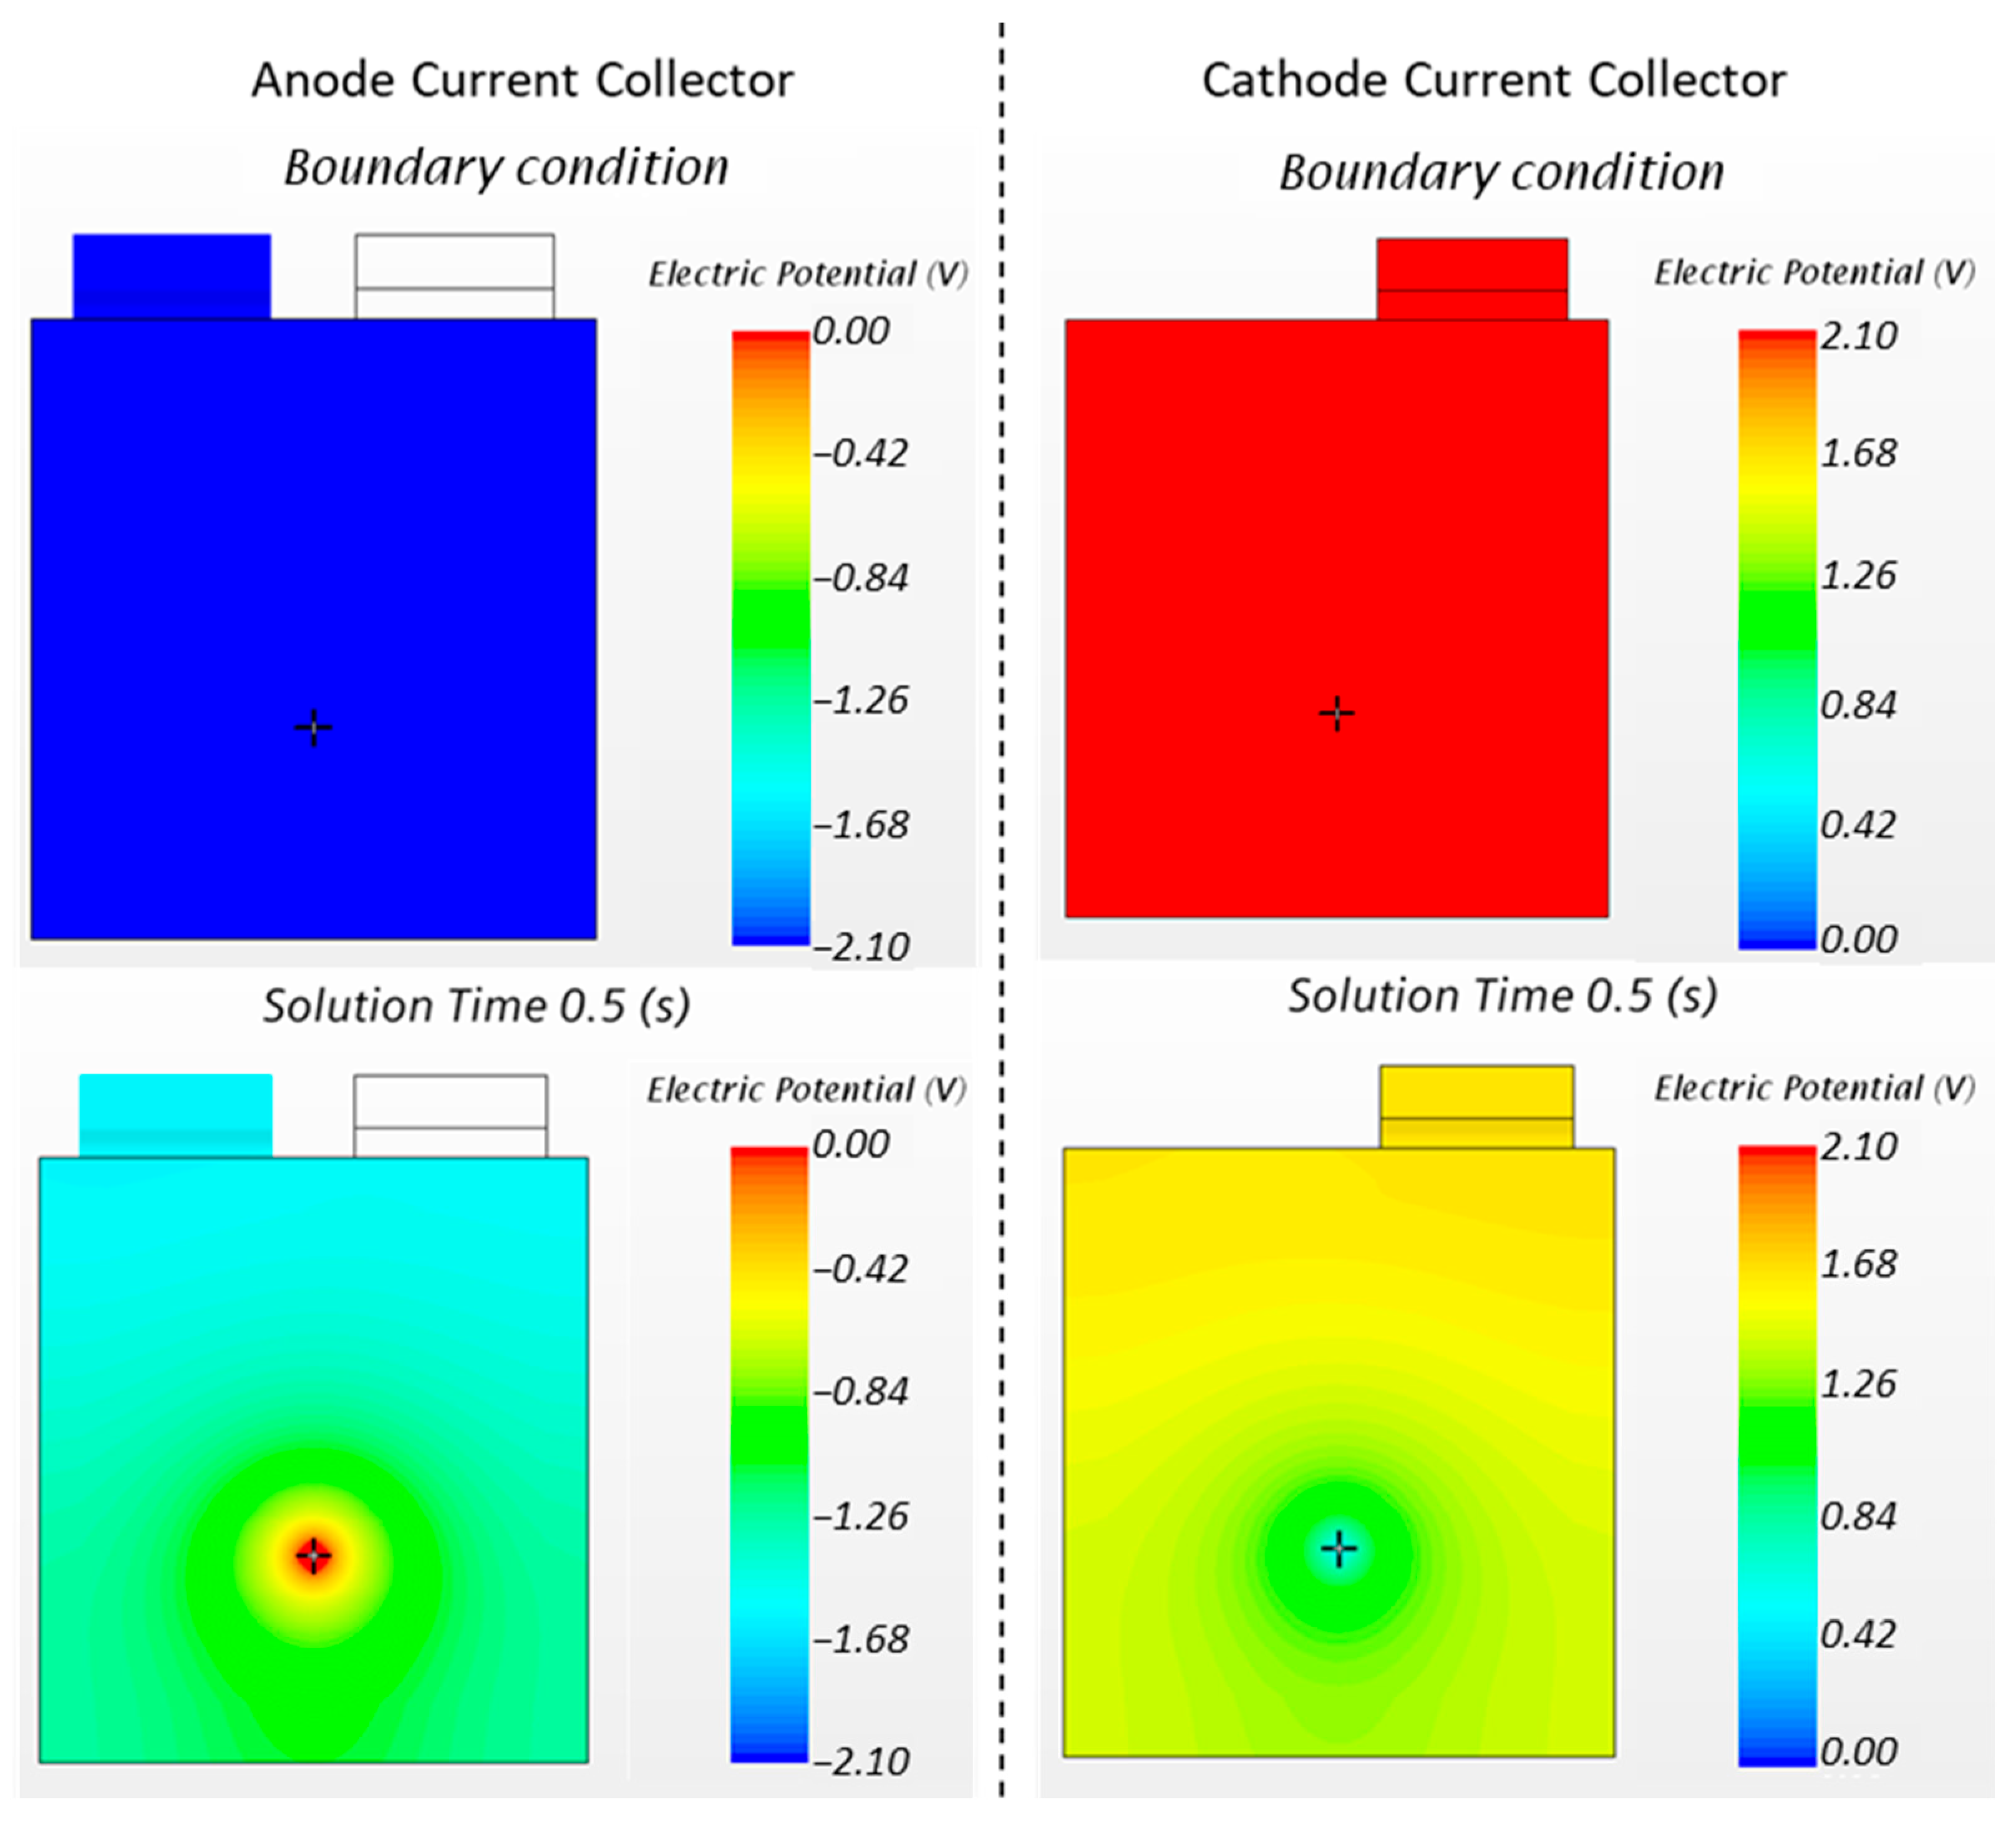
Due to the extremely high electrical currents, high voltage gradients occurred throughout the cell volume. In fact, in the simulation, even if the tab voltage falls to zero in about 30 s, the local voltage around the nail drops to zero in less than one second. During the transient period, this effect can be attributed to the high speed of discharge around the nail, which causes a localized drop in SOC. Figure 10 shows the distribution of the cell voltage potential on the current collectors (anode and cathode from the top view) from their initial condition (SOC 100%) up to 0.5 s of simulation.
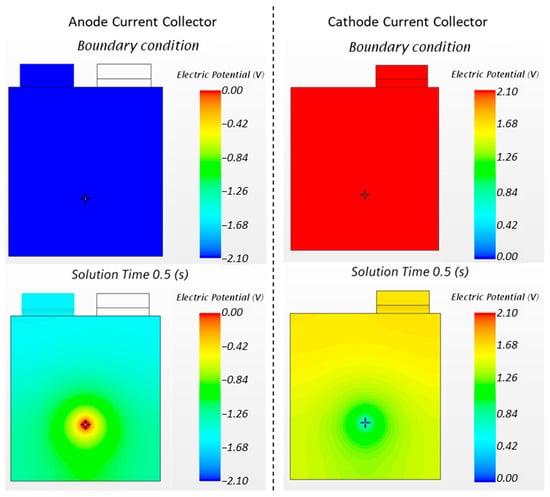
Figure 10.
Voltage distribution on the anode and cathode current collectors for the nail penetration load case at different stages. The boundary condition of 100% SOC sets the differential voltage to 4.2 V (+2.1 V for the cathode and −2.1 V for the anode). During the transient period, the local differential voltage around the nail is markedly lower than the voltage measured at the tabs.
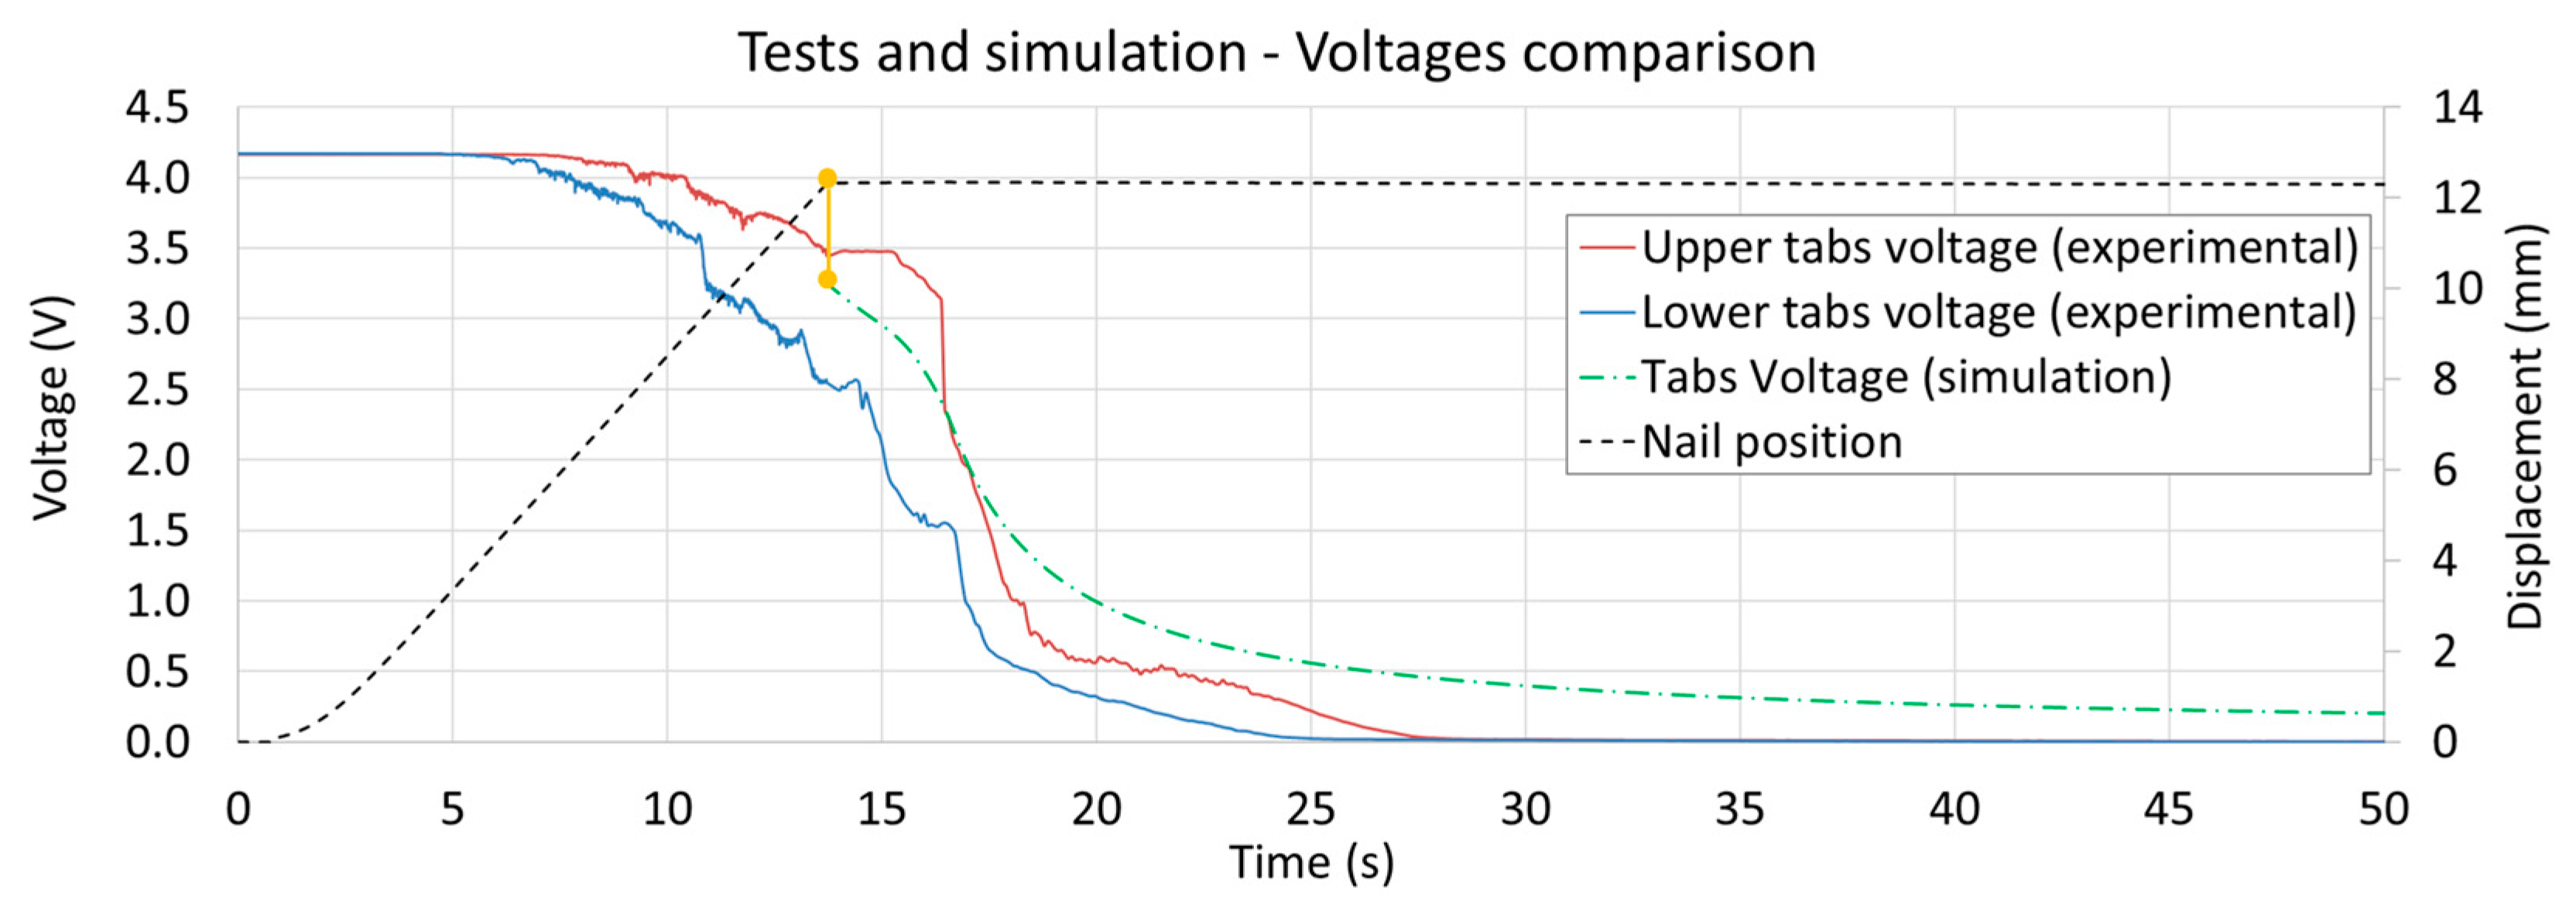
After 0.5 s, the nail (with its electrical load) provokes a localized drop in the voltage (i.e., SOC) to almost zero even if the voltage at the tabs is still at a differential value of approximately 3.0 V. Since it is not possible to place voltage probes in the cell volume without damaging it, the described voltage gradients (of Figure 10) cannot be fully validated. However, the tab voltage values obtained in simulation are comparable with the values measured during experiments (as shown in Figure 11), suggesting that the simulation results of the cell internal voltage gradients must also be consistent with the experimental, not accessible, voltage values.
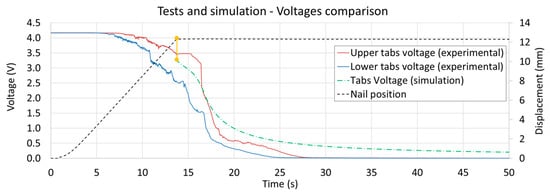
Figure 11.
Comparison between tests (upper and lower tests boundaries) and simulation results for the cell tabs differential voltage. Since the nail displacement was not simulated, the comparison is meaningful just after the nail has fully penetrated the cell volume.
4.3. Comparison and Model Validation
Since the mechanical displacement of the nail was not considered in the simulation, the tabs voltage observed in experimental tests can be compared with the simulation results just after the nail has fully penetrated the cell volume (i.e., 12 mm displacement). The comparison of the tab voltages reveals a similar trend between the test and simulation results, as shown in Figure 11.
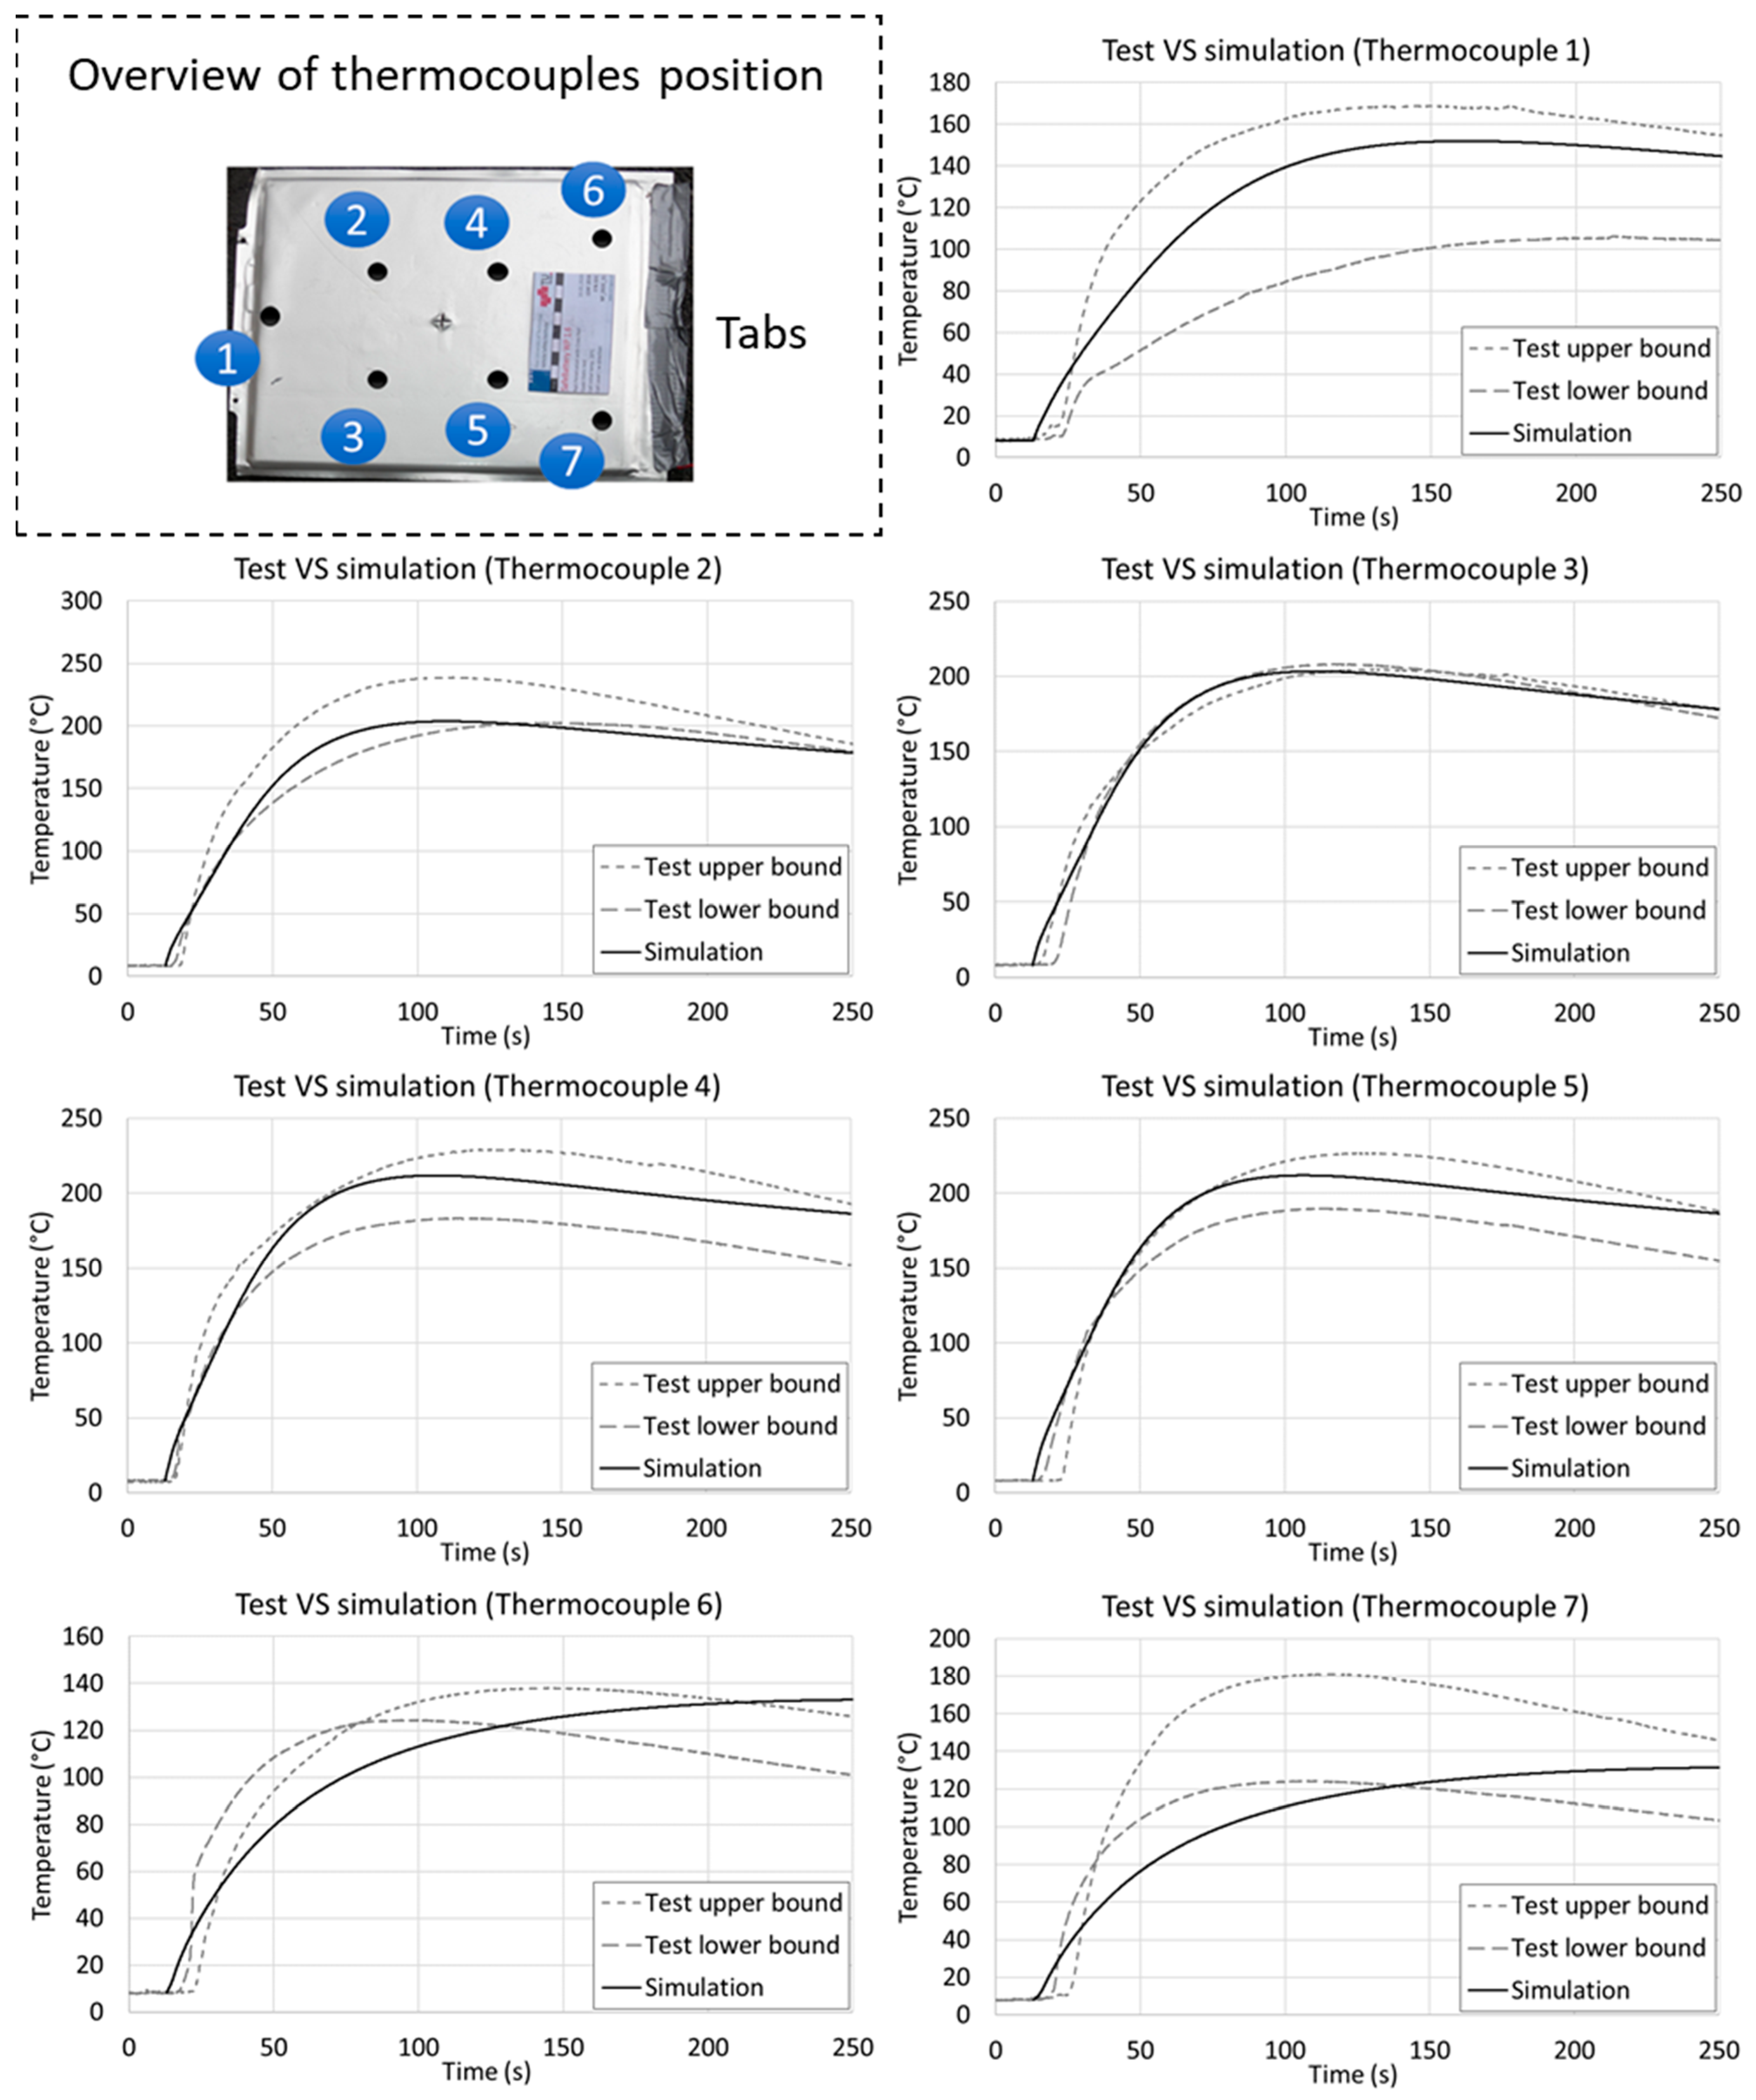
The temperature results from the simulation were evaluated by considering the temperature behavior at the nodes and comparing these with the thermocouple positions. The comparison was carried out considering the lowest and highest temperature results from the five tests for each thermocouple, as shown in Figure 12.
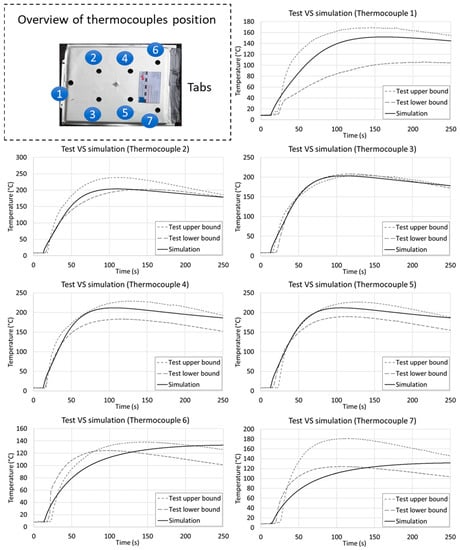
Figure 12.
Comparison among the temperatures on the cell surface in the tests and simulation for the nail penetration load case. The simulation monitor points were chosen with respect to the thermocouples in the experiments. With the exceptions of thermocouples 6 and 7, all other temperature results are consistent in terms of the maximum temperature and transient behavior.
The results show similarities between the simulated temperatures and the experimental tests. Deviation of temperature transient behavior is noticeable for thermocouples 6 and 7, this could be addressed to two main physical phenomena not considered in the model: convective behavior of the electrolyte (due to high temperature gradients) and welding resistance of the tabs producing heat during the experiment (due to electric currents). In fact, due to its entering angle, the nail generates short circuit values different for each layer, due to its different cross section at each cell layer (on the top layer the nail cross section is bigger). Furthermore, since in simulation environment the nail is considered in its final position from the first-time increment, results show deviation from the tests. In fact, during the first 10 s of the test, the nail is still penetrating the cell not providing the massive short circuit as fully penetrated. Hence, the temperature obtained from simulation exhibits a higher slope with respect to the experimental data in the first 10 s of test. However, looking at the maximum temperature and transient behavior during most of the time experiment, simulation results and test data show an overall comparable behavior; furthermore, considering the extreme load case under analysis, the observed deviation during the first 10 s was considered acceptable.
5. Conclusions
Nail penetration tests for Li-ion batteries that are performed with the standard conic nails show poor reproducibility due to the uncertainty related to triggering the electrical short circuit. For this reason, they can rarely be used for model validation purposes. As an example, Abaza et al. [24] performed ten identical tests with a steel nail, and an electrical short circuit occurred only four times (i.e., 60% of the tests did not trigger an electrical short circuit). The current study resulted in a new nail design with an optimized external surface-to-volume ratio. This newly designed nail could be used to obtain reliable electrical short circuit information; thus, it is suitable for numerical electro-thermal model validation purposes. The nail was demonstrated to be effective: Five identical nail penetration tests were carried out, and a stable electrical short circuit was obtained in all cases. The implications of these novel findings and their high reproducibility indicate that the nail can be used to validate electro-thermal models.
To demonstrate a possible workflow for the validation of a model, a multilayer model was used, and the simulation results were compared with the test results. The results confirm the validity of the procedure, even for an extreme load case such as nail penetration in conjunction with thermal runaway and gas venting, which is usually hard to simulate.
The results from applying the model reveal similarities between the temperature behavior observed in the tests and the simulation on almost all cell surface. However, to achieve a higher accuracy of results, some improvements could be made; in fact, some discrepancies between the experimental tests and simulation occurred due to unmodeled physical phenomena. For example, when the melting temperature of aluminum is clearly reached, the researcher must consider that the melted aluminum will not be available to conduct electricity, as it loses its mechanical stability (and probably its contact with the cathode electrode). In the simulation in this study, the melting point of aluminum was not considered. At high temperatures, convective effects due to the boiling electrolyte could occur, causing an increase of the in-plane thermal conductivity of the cell: This would explain why the temperatures at two out of seven thermocouples (see Figure 12 thermocouples 6 and 7) rose slowly in the simulation, but did not rise in the test measurement. This convective phenomenon involving the electrolyte would be extremely hard to simulate due to the porous separator structure.
Furthermore, as a possible improvement of the model, a higher order of the equivalent electrical circuit could be used. As example, using a second order RC circuit, in order to follow the same discretization strategy, the geometry of the internal layers would need to be modified: With the first order RC circuit, can be found a correspondence between electrical components and geometrical layers (as shown in Figure 2), the addition of a branch in the equivalent circuit would require an additional geometrical layer. Such a layer could be obtained by splitting the active material layer.
The findings presented in this paper allow the following overall conclusions to be drawn:
- The use of a cross-shaped nail (in cross-section) is very well-suited to generating reproducible internal electrical short circuits in nail penetration experiments.
- Due to the reproducibility of the cross-shaped nail experiments, the experimental data obtained can be used to validate numerical models.
- A multilayer electro-thermal model can be applied to reproduce the transient electro-thermal behavior of Li-ion cells in case of nail intrusion.
Despite the minor deviations that were documented between the simulation and experimental results, the findings provide researchers with a useful workflow and testing device. These research findings indicate new possibilities for using a nail penetration test to validate a multilayer electro-thermal model.
6. Patents
Title: “Impaktor zum Prüfen von Batteriezellen”; Patent number: 4B A 51066/2020-3; Filed in Austria by “Technische Universität Graz”. Issued: 09.12.2020–Filed: 09.09.2021.
Author Contributions
Conceptualization, L.A.; methodology, L.A.; investigation, L.A., G.G.; data curation, L.A.; writing—original draft preparation, L.A., G.G.; writing—review and editing, L.A., G.G., S.E., B.K., W.S.; visualization, L.A.; supervision, W.S.; project administration, C.E.; funding acquisition, W.S. and C.E. All authors have read and agreed to the published version of the manuscript.
Funding
This work origins from the research project SafeBattery (grant no. 856234). The K-project SafeBattery is funded by the federal ministry for transport, innovation, and technology (BMVIT), federal ministry of digital and economic affairs (BMDW), Austria and Land Styria within the program COMET—Competence Centers for Excellent Technologies. The program COMET is administered by the FFG. This work was also based on the research project SafeLIB (grant no. 882506). The K-project SafeLIB is funded by the Austrian federal ministry for climate action, environment, energy, mobility innovation and technology (BMK), federal ministry of digital and economic affairs (BMDW), the provinces Styria and Upper Austria within the program COMET—Competence Centers for Excellent Technologies. The program COMET is administered by the FFG. Supported by TU Graz Open Access Publishing Fund.
Conflicts of Interest
The authors declare no conflict of interest.
References
- Dubarry, M.; Devie, A.; McKenzie, K. Durability and reliability of electric vehicle batteries under electric utility grid operations: Bidirectional charging impact analysis. J. Power Sources 2017, 358, 39–49. [Google Scholar] [CrossRef]
- Lu, L.; Han, X.; Li, J.; Hua, J.; Ouyang, M. A review on the key issues for lithium-ion battery management in electric vehicles. J. Power Sources 2013, 226, 272–288. [Google Scholar] [CrossRef]
- Masias, A.; Marcicki, J.; Paxton, W.A. Opportunities and Challenges of Lithium Ion Batteries in Automotive Applications. ACS Energy Lett. 2021, 6, 621–630. [Google Scholar] [CrossRef]
- Pan, Y.; Hua, Y.; Zhou, S.; He, R.; Zhang, Y.; Yang, S.; Liu, X.; Lian, Y.; Yan, X.; Wu, B. A computational multi-node electro-thermal model for large prismatic lithium-ion batteries. J. Power Sources 2020, 459, 228070. [Google Scholar] [CrossRef]
- Alipour, M.; Esen, E.; Kizilel, R. Investigation of 3-D multilayer approach in predicting the thermal behavior of 20 Ah Li-ion cells. Appl. Therm. Eng. 2019, 153, 620–632. [Google Scholar] [CrossRef]
- Aiello, L.; Kovachev, G.; Brunnsteiner, B.; Schwab, M.; Gstrein, G.; Sinz, W.; Ellersdorfer, C. In Situ Measurement of Orthotropic Thermal Conductivity on Commercial Pouch Lithium-Ion Batteries with Thermoelectric Device. Batteries 2020, 6, 10. [Google Scholar] [CrossRef] [Green Version]
- Kovachev, G.; Schröttner, H.; Gstrein, G.; Aiello, L.; Hanzu, I.; Wilkening, H.M.R.; Foitzik, A.; Wellm, M.; Sinz, W.; Ellersdorfer, C. Analytical Dissection of an Automotive Li-Ion Pouch Cell. Batteries 2019, 5, 67. [Google Scholar] [CrossRef] [Green Version]
- Chen, M.; Bai, F.; Song, W.; Lv, J.; Lin, S.; Feng, Z.; Li, Y.; Ding, Y. A multilayer electro-thermal model of pouch battery during normal discharge and internal short circuit process. Appl. Therm. Eng. 2017, 120, 506–516. [Google Scholar] [CrossRef] [Green Version]
- Hendricks, C.; Williard, N.; Mathew, S.; Pecht, M. A failure modes, mechanisms, and effects analysis (FMMEA) of lithium-ion batteries. J. Power Sources 2015, 297, 113–120. [Google Scholar] [CrossRef] [Green Version]
- Ye, Y.; Shi, Y.; Cai, N.; Lee, J.; He, X. Electro-thermal modeling and experimental validation for lithium ion battery. J. Power Sources 2012, 199, 227–238. [Google Scholar] [CrossRef]
- Chiu, K.-C.; Lin, C.-H.; Yeh, S.-F.; Lin, Y.-H.; Chen, K.-C. An electrochemical modeling of lithium-ion battery nail penetration. J. Power Sources 2014, 251, 254–263. [Google Scholar] [CrossRef]
- Ramadass, P.; Fang, W.; Zhang, Z. Study of internal short in a Li-ion cell I. Test method development using infra-red imaging technique. J. Power Sources 2014, 248, 769–776. [Google Scholar] [CrossRef]
- Vyroubal, P.; Kazda, T. Finite element model of nail penetration into lithium ion battery. J. Energy Storage 2018, 20, 451–458. [Google Scholar] [CrossRef]
- Hu, X.; Liu, W.; Lin, X.; Xie, Y.; Foley, A.M.; Hu, L. A Control-Oriented Electrothermal Model for Pouch-Type Electric Vehicle Batteries. IEEE Trans. Power Electron. 2021, 36, 5530–5544. [Google Scholar] [CrossRef]
- Mao, B.; Chen, H.; Cui, Z.; Wu, T.; Wang, Q. Failure mechanism of the lithium ion battery during nail penetration. Int. J. Heat Mass Transf. 2018, 122, 1103–1115. [Google Scholar] [CrossRef]
- Zhao, W.; Luo, G.; Wang, C.-Y. Modeling Nail Penetration Process in Large-Format Li-Ion Cells. J. Electrochem. Soc. 2014, 162, A207. [Google Scholar] [CrossRef]
- Reichert, M.; Haetge, J.; Berghus, D.; Wendt, C.; Meier, V.; Rodehorst, U.; Passerini, S.; Schappacher, F.; Winter, M. Lithium-Ion Cell Nail Penetration Safety Experiments under Adiabatic Conditions. ECS Trans. 2014, 61, 87–103. [Google Scholar] [CrossRef]
- Yamanaka, T.; Takagishi, Y.; Tozuka, Y.; Yamaue, T. Modeling lithium ion battery nail penetration tests and quantitative evaluation of the degree of combustion risk. J. Power Sources 2019, 416, 132–140. [Google Scholar] [CrossRef]
- Chen, L.; Hu, M.; Cao, K.; Li, S.; Su, Z.; Jin, G.; Fu, C. Core temperature estimation based on electro-thermal model of lithium-ion batteries. Int. J. Energy Res. 2020, 44, 5320–5333. [Google Scholar] [CrossRef]
- Finegan, D.P.; Tjaden, B.; Heenan, T.M.; Jervis, R.; Di Michiel, M.; Rack, A.; Hinds, G.; Brett, D.J.L.; Shearing, P.R. Tracking Internal Temperature and Structural Dynamics during Nail Penetration of Lithium-Ion Cells. J. Electrochem. Soc. 2017, 164, A3285–A3291. [Google Scholar] [CrossRef]
- Huang, S.; Du, X.; Richter, M.; Ford, J.; Cavalheiro, G.M.; Du, Z.; White, R.T.; Zhang, G. Understanding Li-Ion Cell Internal Short Circuit and Thermal Runaway through Small, Slow and In Situ Sensing Nail Penetration. J. Electrochem. Soc. 2020, 167, 90526. [Google Scholar] [CrossRef]
- Diekmann, J.; Doose, S.; Weber, S.; Münch, S.; Haselrieder, W.; Kwade, A. Development of a New Procedure for Nail Penetration of Lithium-Ion Cells to Obtain Meaningful and Reproducible Results. J. Electrochem. Soc. 2020, 167, 90504. [Google Scholar] [CrossRef]
- Chen, M.; Ye, Q.; Shi, C.; Cheng, Q.; Qie, B.; Liao, X.; Zhai, H.; He, Y.; Yang, Y. New Insights into Nail Penetration of Li-Ion Batteries: Effects of Heterogeneous Contact Resistance. Batter. Supercaps 2019, 2, 874–881. [Google Scholar] [CrossRef]
- Abaza, A.; Ferrari, S.; Wong, H.K.; Lyness, C.; Moore, A.; Weaving, J.; Blanco-Martin, M.; Dashwood, R.; Bhagat, R. Experimental study of internal and external short circuits of commercial automotive pouch lithium-ion cells. J. Energy Storage 2018, 16, 211–217. [Google Scholar] [CrossRef]
- Yokoshima, T.; Mukoyama, D.; Maeda, F.; Osaka, T.; Takazawa, K.; Egusa, S.; Naoi, S.; Ishikura, S.; Yamamoto, K. Direct observation of internal state of thermal runaway in lithium ion battery during nail-penetration test. J. Power Sources 2018, 393, 67–74. [Google Scholar] [CrossRef]
- Yokoshima, T.; Mukoyama, D.; Maeda, F.; Osaka, T.; Takazawa, K.; Egusa, S. Operando Analysis of Thermal Runaway in Lithium Ion Battery during Nail-Penetration Test Using an X-ray Inspection System. J. Electrochem. Soc. 2019, 166, A1243–A1250. [Google Scholar] [CrossRef]
- Lai, X.; Wang, S.; Ma, S.; Xie, J.; Zheng, Y. Parameter sensitivity analysis and simplification of equivalent circuit model for the state of charge of lithium-ion batteries. Electrochim. Acta 2020, 330, 135239. [Google Scholar] [CrossRef]
- Feng, T.; Yang, L.; Zhao, X.; Zhang, H.; Qiang, J. Online identification of lithium-ion battery parameters based on an improved equivalent-circuit model and its implementation on battery state-of-power prediction. J. Power Sources 2015, 281, 192–203. [Google Scholar] [CrossRef]
- Liaw, B.Y.; Nagasubramanian, G.; Jungst, R.G.; Doughty, D.H. Modeling of lithium ion cells?A simple equivalent-circuit model approach. Solid State Ion. 2004, 175, 835–839. [Google Scholar] [CrossRef]
- Hariharan, K.S.; Senthil Kumar, V. A nonlinear equivalent circuit model for lithium ion cells. J. Power Sources 2013, 222, 210–217. [Google Scholar] [CrossRef]
- Tran, M.-K.; Mevawala, A.; Panchal, S.; Raahemifar, K.; Fowler, M.; Fraser, R. Effect of integrating the hysteresis component to the equivalent circuit model of Lithium-ion battery for dynamic and non-dynamic applications. J. Energy Storage 2020, 32, 101785. [Google Scholar] [CrossRef]
- Lin, X.; Perez, H.E.; Mohan, S.; Siegel, J.B.; Stefanopoulou, A.G.; Ding, Y.; Castanier, M.P. A lumped-parameter electro-thermal model for cylindrical batteries. J. Power Sources 2014, 257, 1–11. [Google Scholar] [CrossRef]
- Plett, G. Battery Management Systems Vol. I: Battery Modeling; Artech House: Norwood, MA, USA, 2015. [Google Scholar]
- Maleki, H.; Hallaj, S.A.; Selman, J.R.; Dinwiddie, R.B.; Wang, H. Thermal Properties of Lithium-Ion Battery and Components. J. Electrochem. Soc. 1999, 146, 947–954. [Google Scholar] [CrossRef]
- Global Registry. Global Technical Regulation on the Electric Vehicle Safety (EVS), ECE-United Nations. 2018. Available online: https://unece.org/ (accessed on 22 March 2022).


Publisher’s Note: MDPI stays neutral with regard to jurisdictional claims in published maps and institutional affiliations. |
© 2022 by the authors. Licensee MDPI, Basel, Switzerland. This article is an open access article distributed under the terms and conditions of the Creative Commons Attribution (CC BY) license (https://creativecommons.org/licenses/by/4.0/).