Article

Integrated All-Climate Heating/Cooling System Design and Preheating Strategy for Lithium-Ion Battery Pack

1
State Key Laboratory of Automotive Simulation and Control, Jilin University, Changchun 130015, China
2
School of Electrical & Electronic Engineering, Harbin University of Science & Technology, Harbin 150080, China
3
School of Automation, Nanjing University of Science & Technology, Nanjing 210094, China
4
State Key Laboratory of Automotive Safety and Energy, Tsinghua University, Beijing 100084, China
*
Author to whom correspondence should be addressed.
Batteries 2022, 8(10), 179; https://doi.org/10.3390/batteries8100179
Submission received: 19 August 2022 / Revised: 15 September 2022 / Accepted: 8 October 2022 / Published: 12 October 2022
(This article belongs to the Collection Advances in Battery Energy Storage and Applications)

Abstract

:
The continuous low temperature in winter is the main factor limiting the popularity of electric vehicles in cold regions. The best way to solve this problem is by preheating power battery packs. Power battery packs have relatively high requirements with regard to the uniformity of temperature distribution during the preheating process. Aimed at this problem, taking a 30 Ah LiFePO4 (LFP) pouch battery as the research object, a three-sided liquid cooling structure that takes into account the preheating of the battery module was designed. On the basis of analyzing the influence of the cooling plate arrangement, cooling liquid flow rate, liquid medium, and inlet temperature on the temperature consistency of the battery module, the orthogonal simulation method was used to formulate the optimal combination of factors for different cooling objectives. Using the designed preheating structure, a combined internal and external preheating strategy based on the available battery power is proposed. The research results show that the cooling plate arrangement scheme and the inlet temperature have obvious influences on the preheating effect, while the increase in the flow velocity of the preheating effect is saturated. The optimized external preheating structure can maintain the preheating temperature difference of the battery module at less than 5 °C. On this basis, the proposed combined internal and external preheating strategy saves 50% of the preheating time compared with three-sided preheating.

1. Introduction

With the gradual development of urban transportation and the continuous improvement in living standards, new energy vehicles have become the primary choice for the sustainable development of transportation [1,2]. Lithium-ion batteries have developed rapidly in the field of new energy vehicles due to their high power density, high reliability, and good durability [3,4]. However, the ohmic internal resistance and polarization resistance of lithium batteries increases significantly at low temperatures, which leads to a sharp drop in their usable capacity and working efficiency as the temperature decreases [5,6]. In addition, lithium dendrites will precipitate on the negative electrode when a battery is charged at a low temperature. If a battery is operated at a low temperature for a long period, lithium dendrites can grow, resulting in irreversible loss of battery capacity [7,8]. When lithium dendrite grows to a certain extent, it may penetrate the separator and cause an internal short circuit in a battery. When a serious internal short circuit occurs in a battery, 70% of the electric energy will be released within 60 s, which will induce the thermal runaway of the battery and violent spontaneous combustion. This greatly increases the safety risk of batteries [9,10]. On the other hand, batteries generate a lot of heat during the charging and discharging process caused by the complex internal electrochemical reaction and the internal resistance of the battery. At this time, unreasonable battery layout and thermal management will further lead to heat accumulation, which will aggravate battery aging and also bring the risk of thermal runaway. In summary, the design and optimization of a battery thermal management system is of great significance for improving the safety and service life of the power battery. Current research on the thermal management of power batteries under all-climate conditions is mainly divided into two parts: low-temperature preheating and high-temperature cooling [11,12].
In the study of low temperature preheating, there are mainly two methods: external heating and internal heating [13]. External heating methods have low system complexity, but often require longer heating times. Internal heating can significantly reduce heating time but has higher safety risks [14,15]. Internal heating uses the large internal resistance of the battery at low temperatures or the built-in heat-generating element to generate the heat by applying appropriate excitation, thereby preheating the battery at low temperatures [16]. Ruan H et al. proposed an optimal internal warm-up strategy based on a multi-objective genetic algorithm, which considered two evaluation indicators: warm-up time and capacity loss. The battery was rapidly heated from −30 °C to 2.1 °C in 103 s, and the capacity loss was only 1.4% after repeated heating for 500 times [17]. Ruan H et al. proposed a low-temperature composite self-heating strategy that integrates internal and external heating methods. By balancing the three factors of heating time, temperature gradient and capacity decay, efficient and fast heating is achieved under the premise of ensuring battery life [18]. Guo S et al. found that the AC preheating strategy is not suitable for lithium batteries in a high SOC (state of charge, representing the remaining charge capacity), so they proposed a DC-AC rapid heating method that can preheat an LiB (lithium battery) from −20 °C to 10.02 °C within 443 s and a series-connected LiB pack from −19.26 °C to 10.97 °C within 395 s at an average heat generation rate of 4.07 °C/min and 4.6 °C/min, respectively [19]. Qu et al. proposed a pulsed current heating strategy that can heat a battery from −10 °C to 10 °C in 175 s, and DC discharge heating in the same heating environment requires 280 s, so the pulsed heating greatly reduces the heating time [20]. Ghassemi A et al. further studied the influence of the AC preheating method on battery aging. Through research on the aging index of a single LiFePO4 (LFP) battery in a shallow charge–discharge cycle, it was found that the voltage polarization caused by AC is the key index affecting the aging of lithium batteries [21]. External preheating uses a heat source outside the battery to preheat the battery by means of convection or conduction, including liquid preheating, hot air preheating, heat pipe preheating, electric heating film preheating, Peltier element preheating, PTC (positive temperature coefficient) component preheating, etc. [22]. Ruan H et al. developed a lightweight composite self-heating system that optimizes external heating resistance with the help of an adaptive particle swarm optimization algorithm, and utilizes two external lightweight aluminum heaters to recover the escaping heat and use it for external heating. The available discharge capacity of the heated battery is increased by 70.4% [23]. Yabo Wang et al. studied the influence of factors, such as coolant flow rate and the number of batteries, on the preheating performance in the immersion preheating system. The research shows that the number of batteries has a great influence on the preheating effect. A high heating rate of up to 4.18 °C/min was subsequently achieved through parameter optimization [24]. Jian Guo et al. proposed and analyzed a refrigerant-based thermal management system for electric vehicles, which enables the battery to be directly heated or cooled by the refrigerant without additional equipment. The battery preheating process is completed within 9 min [25]. Most of the above reports started from the perspective of single cells and used the temperature rise rate as the judgment standard, but often ignored the key indicator of the module temperature difference, lacking research on a combined internal and external preheating method. Therefore, from the perspective of ensuring the temperature difference of the battery module, this paper comprehensively considers the preheating time and the minimum temperature of the battery pack, and conducts research on a combined internal and external preheating strategy. Meanwhile, to avoid greatly increasing the design burden of the additional battery preheating system and to reduce the cost of the battery system, this article considers the application of the current cooling system structure. On this basis, combined with design optimization, an integrated preheating system is proposed to realize the integrated design of a battery preheating/cooling structure. The aim is to achieve a longer battery life with the least cost.
In this paper, a 30 Ah LiFePO4 battery is taken as the research object, and the finite element analysis method is used to construct the heat generation model. On this basis, a preheating/cooling integrated thermal management system for all-climate environmental conditions was constructed, and an analysis of the influencing factors of the external preheating of the battery pack was carried out. Subsequently, optimization was carried out to address the issues of the poor temperature consistency of the components and the long preheating time in the established external preheating system. Based on the established thermal management system, the influencing factors of the cooling effect of different coolant temperatures and different coolant flow rates are analyzed. From the perspective of improving the temperature consistency of the module, a combined preheating strategy inside and outside the battery module is proposed.

2. Construction and Verification of Thermal Model of Battery Pack

2.1. Experimental Platform Construction and Battery Performance Parameter Testing

The basic parameters of the batteries selected as research objects are shown in Table 1.
In this study, the battery test platform shown in Figure 1 was built, and the capacity, internal resistance and entropy coefficient of the battery were tested with the performance parameters shown in Figure 2.
In addition, the specific heat capacity and various thermal conductivity of the battery were tested using an accelerating calorimeter. After testing, the specific heat capacity of the 30 Ah LFP cell used was 1033 J/(kg·°C), and the directional thermal conductivity and normal thermal conductivity were, respectively, 26.50 (W/m/K) and 1.20 (W/m/K).

2.2. Construction of Thermal Model of Lithium-Ion Battery

2.2.1. Lithium-Ion Battery Heat Generation Model

During the battery charging and discharging process, the complex chemical reaction inside the battery is accompanied by the consumption and generation of substances, as well as the existence of the internal resistance of the charging and discharging of the battery, so that part of the chemical energy and electrical energy is converted into heat energy, which increases the temperature of the battery. The heat production of the battery follows the Bernardi equation. The precondition for the establishment of the heat production equation is that the heat production is uniform and the average electrode potential is used in the calculation, as shown in Formula (1):
Q = I ( U ocv U t ) + I T amb d U ocv d T ,
where Uocv is the battery open circuit voltage (V); Ut denotes the battery terminal voltage (V); T stands for the temperature (°C); dUocv/dT refers to the battery entropy coefficient (unit: mV/K), which is related to the battery SOC; I is the charging current (A); and Tamb represents the ambient temperature (°C).
In the actual charging and discharging process, the open circuit voltage of the battery cannot be measured in real time. For the convenience of calculation, the Joule heat part is usually replaced by the internal resistance heat generation of the battery. Therefore, Formula (1) can be further equivalent to Formula (2). The two terms on the right side of the formula represent the Joule heat and reaction heat of the battery, namely irreversible heat and reversible heat:
Q = I 2 R + I T amb d U ocv d T .
In the process of charging and discharging lithium-ion batteries, the temperature change is affected by two factors: heat generation and heat transfer. The influence rule is mainly determined by the heat balance equation of Formula (3) [26]. During the battery charging process, part of the heat energy generated is stored inside the battery due to the existence of the specific heat capacity of the battery, and the other part is dissipated due to the heat exchange between the battery and the external environment.
C p M d T d t = I 2 R + I T amb d U ocv d T Q ˙ cool h A ( T T amb ) ,
where CP is the specific heat capacity of the battery (J/(kg·°C)); M stands for the mass of the battery (kg); T denotes battery temperature (°C); t refers to time (s); I represents the charging current (a); R is the internal resistance of the battery (Ω); dUocv/dT stands for the entropy coefficient of the battery (unit: MV/k); Qcool denotes the cooling power of the battery (W); h represents the convective heat transfer coefficient and A represents the heat dissipation surface area of the battery (m2); and Tamb is the ambient temperature (°C).
The positive tab material of the battery is aluminum and the negative tab material is copper. During the battery charging and discharging process, these two parts will not participate in the chemical reaction, so no electrochemical reaction heat will be generated. However, due to the flow of current, the positive and negative tabs will generate Joule heat. The formula for calculating the heating rate is shown in Formula (4):
q A l , C u = Q A l , C u V A l , C u = I 2 R A l , C u V A l , C u ,
where QAl,Cu is the heat production rate of the positive and negative electrodes (W); RAl,Cu represents the resistance of the anode and cathode (Ω); VAl,Cu denotes the volume of the anode and the cathode (m3); and I stands for the battery charge current (A).

2.2.2. Lithium-Ion Battery Heat Transfer Model

The normal charging working temperature of a lithium battery is 0–45 °C, and the discharging working temperature is −20–60 °C. Since the battery used in this paper is a flat liquid design, the electrolyte inside the single cell basically does not flow. Therefore, when analyzing the heat transfer model of Li-ion batteries, only the heat conduction inside the battery is considered. According to the solid heat transfer theory, heat will spontaneously transfer from the high-temperature object to the low-temperature object. In this study, it is assumed that the heat is uniformly generated by the battery, transferred to the boundary through the battery material, and transferred out through the liquid cooling plate and natural convection of air. Under the condition where the specific heat capacity and density of the cell are considered to be uniform, the temperature distribution inside the battery satisfies the basic equation of solid heat transfer shown in Formula (5):
ρ C p T t = Q · + x λ x T x + y λ y T x + z λ z T z .
The initial condition of temperature is shown in Formula (6):
T x , y , z = T amb .
The three types of boundary conditions for the battery heat transfer model are shown in Formula (7). The first type of boundary condition includes heat transfer between cells and heat exchange with the liquid cooling plate; the second type of boundary condition is convective heat exchange with the external environment; and the third type of boundary condition is heat radiation to the external environment:
λ x T x = h T T a m b , x = 0 , a λ y T y = h T T a m b , y = 0 , b λ z T z = h T T a m b , z = 0 , h
where λx, λy, and λz represent the thermal conductivity of the battery in the x, y, and z directions, respectively; Tamb is the external ambient temperature; a, b, and h denote the length, width, and height of the battery (m); and ρ stands for the battery cell density.

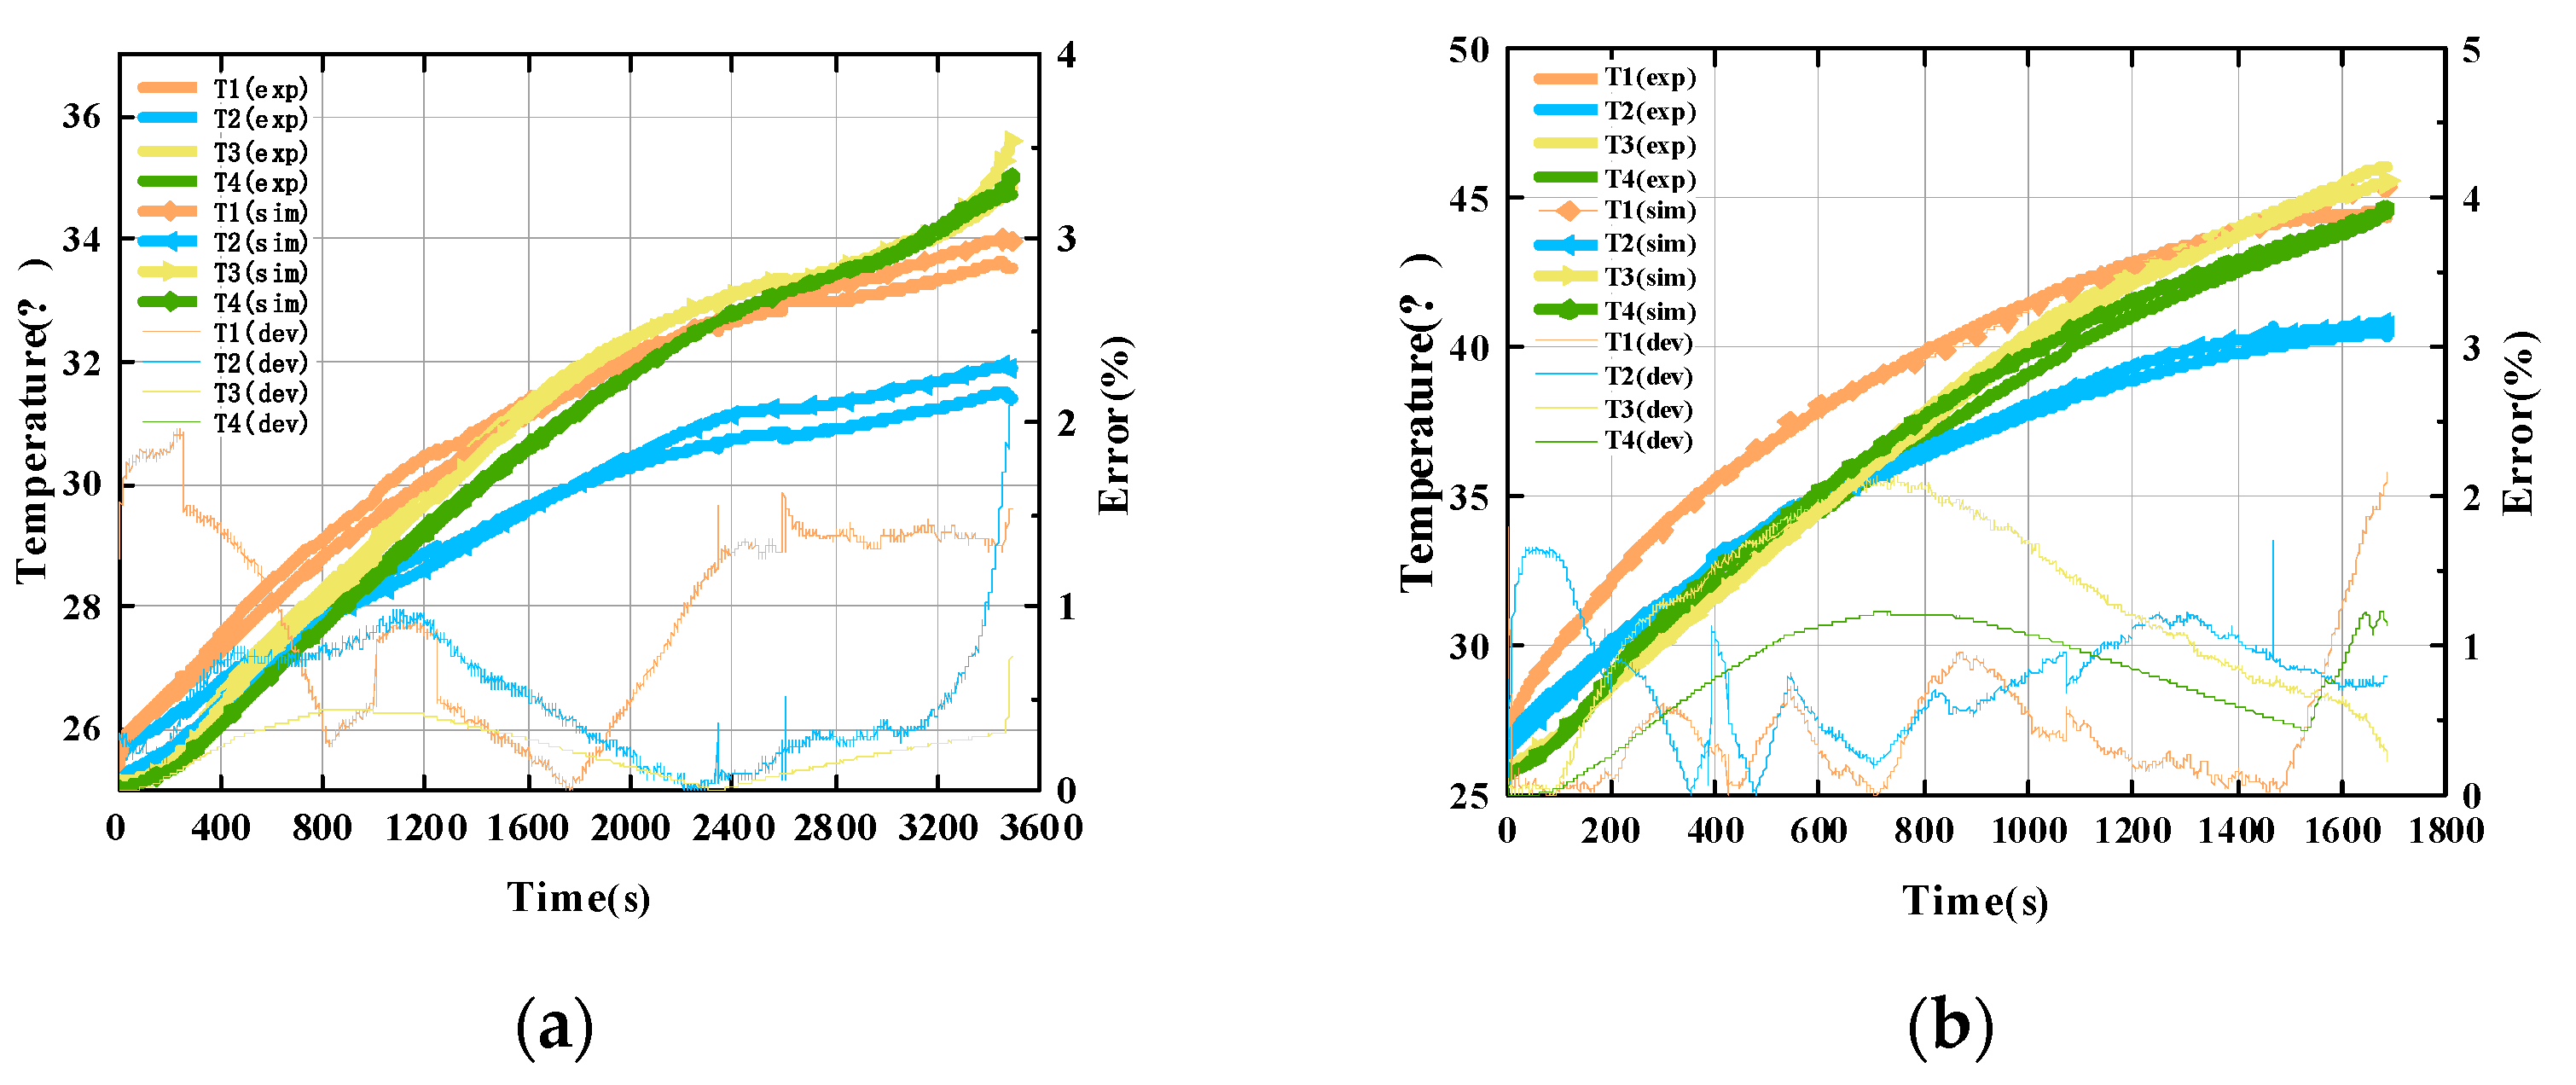
2.3. Model Validation

Based on the establishment of the above heat generation and heat transfer models, a battery rate charging heat generation experiment is designed to verify the accuracy of the established model and the measured parameters, and to provide a basis for subsequent simulations. The designed experimental process is shown in Figure 3.
The specific experimental steps and verification process are as follows:
(1)
Determine the position of the thermocouple, arrange the thermocouple in the corresponding position, wrap it with thermal insulation cotton, and connect the thermocouple to the data collector;
(2)
Connect the battery to the charger/discharge machine, set the temperature of the incubator to 25 °C, and place the battery with the thermocouple arranged in the incubator for 3 h;
(3)
Use the host computer to write a program to set the experimental steps, so that the battery is charged with constant current from the lower cut-off voltage (2 V) to the upper cut-off voltage (3.65 V) at 1C and 2C rates, respectively, and the temperature data at each temperature point are recorded;
(4)
Based on the heat generation and heat transfer model of the battery, a three-dimensional heat generation model of the battery cell is established through finite element analysis software, and the battery parameters and boundary conditions are input to simulate and record the temperature change during the battery charging process.
By comparing the temperature rise data obtained from the experiment with the model temperature rise data, the applicability of the established battery heat generation model and heat transfer model to the subsequent low-temperature preheating simulation is evaluated. The verification results at 1C and 2C charge rates are shown in Figure 4.
The average deviation of the model heat production is 1.5% and 1.64% at charge rates of 1C and 2C, respectively. This shows that the heat generation model and the heat transfer model established in this paper can well reflect the actual condition of the battery, providing the foundation for subsequent simulation research.

3. Design and Optimization of External Thermal Management System

Bottom cooling and side cooling are often used in electric vehicle battery pack liquid cooling thermal management systems [27,28]. In this paper, a three-sided cooling plate arrangement was selected to establish a liquid-cooled cooling structure for the battery pack, and the performance of the cooling structure was analyzed through simulation. On the basis of this cooling structure, the battery pack was preheated by heating the coolant, the structure of the cooling system was optimized on the basis of the uneven temperature distribution of the battery pack after preheating, and the integration of the battery pack cooling/preheating system was realized.

3.1. Design of Cooling/Preheating Structure of Li-Ion Battery Pack

The channel structure inside the cooling plate can be roughly divided into serpentine channel, parallel channel, and multiple inlet/outlet runner designs [29]. In practical applications, the serpentine channel has issues of low heat exchange efficiency near the exit position and a large temperature difference of the battery module after preheating/cooling. In this paper, parallel channels were used to design the cooling plate, the physical property parameters of liquid cooling plate and cooling material are from the material library of Comsol, as shown in Table 2. The designed cooling plate structure and battery pack preheating structure are shown in Figure 5. In the bottom channel, 16 aluminum fins were embedded inside the cooling plate to restrict the flow direction and flow distribution of the liquid medium to improve the temperature uniformity of the module after cooling. Due to the high height of the battery, in order to distribute the flow evenly and to improve the temperature difference of the module, the number of inlets and outlets of the side cooling plate was designed to be 2, and 22 aluminum fins were embedded inside. In the cooling system structure, this study mainly chose the three-sided cooling plate arrangement for comparative analysis.

3.2. Parameter Optimization and External Preheating Scheme Analysis Method

According to the established battery pack thermal management system, the battery pack was preheated by heating the coolant. Therefore, the optimal preheating method was explored by changing the parameters and optimizing the cooling plate structure. Aiming at the problem of uneven temperature distribution after preheating, the external preheating structure of the battery pack was optimized, and the optimized structure influencing factors were analyzed to determine a reasonable parameter range where the uniformity of the preheated module met the requirements. The optimization process is shown in Figure 6.
To simulate the low temperatures and cold environment of winter, an ambient temperature and initial battery environment of −20 °C was selected, along with an initial preheating time of 1800 s, and the three-sided preheating simulation analysis was carried out using the orthogonal simulation method.

3.3. Optimization of Preheating Parameters on Three Sides of Power Battery Pack

In this study, the battery pack was preheated from a three-sided preheating structure; that is, on a bottom preheating basis, liquid cooling plates were added on both sides of the battery pack, which effectively increased the contact area between the battery pack and the external structure.

3.3.1. Analysis of the Influence of Flow Velocity

Set the initial temperature and ambient temperature of the battery pack to −20 °C, use water as the cooling medium, set the coolant inlet temperature to 25 °C, change the flow rate to preheat the battery pack at a low temperature, and record the minimum temperature and temperature difference after the battery pack is preheated.
The preheating effect of the battery pack at different flow rates is shown in Figure 7. When the liquid flow rate was low (0.1–0.4 m/s), with the increase in the flow rate, the maximum temperature difference of the battery pack had a significant downward trend. When the flow rate was 1 m/s, the temperature difference of the battery pack was reduced to its lowest. It was proved that the flow rate increases, and the module temperature difference and the minimum temperature were obviously optimized. However, when the flow rate was higher than 0.5 m/s, the decreasing trend of the temperature difference slowed down; when the flow rate of the cooling liquid was greater than 0.6 m/s, the minimum temperature and maximum temperature difference of the battery pack were almost constant. At this time, the preheating effect of the flow rate on the battery pack had reached saturation.
In order to examine the flow velocity saturation problem to improve the preheating effect of the battery pack, the internal temperature iso-surface and the temperature distribution cloud map of the battery pack after preheating when the flow velocity was 0.6 m/s and 1 m/s were selected for comparison, as shown in Figure 8. It can be seen from the figure that, under the two flow rates, the temperature distribution and temperature gradient of the battery pack after preheating are roughly the same. From the cooling plate to the inner center of the battery, the temperature gradient shows a gradually decreasing trend. During the preheating process, the cooling plate was similar to a constant temperature surface. The heat exchange between the cooling plate and the battery contact surface was mainly affected by the thermal conductivity of the two. After the cooling liquid flow rate reached a certain value, the improvement in the preheating effect would be less as saturation occurred.
In order to quantitatively analyze the influence of flow rate on the preheating effect of the battery pack, the simulation results data are summarized, as shown in Table 3. When the flow rate was low (0.1–0.6 m/s), the preheating effect of the battery pack increased significantly with the increase in the flow rate, and the minimum temperature of the battery pack after preheating increased by 1.12 °C on average for every 0.2 m/s increase in the flow rate, while the maximum temperature difference decreased by 1.12 °C on average. When the flow rate was greater than 0.7 m/s, limited by the heat exchange capacity between the cooling plate and the battery, the improvement in the flow rate on the preheating effect of the battery pack tended to be saturated.

3.3.2. Analysis of the Influence of Inlet Temperature

In order to explore the influence of the inlet temperature on the preheating effect of the three sides of the battery pack, the simulation scheme shown in Table 4 was designed. The initial temperature and ambient temperature of the battery pack was set at −20 °C, water was used as the cooling medium, and 20 sets of orthogonal simulations of flow rate/inlet temperature were designed.
A comparison of the simulation results of the orthogonal simulation is shown in Figure 9. When the coolant flow rate was 0.5 m/s, with the increase in the inlet temperature, the minimum temperature of the battery pack and the temperature difference of the module increased significantly. For every 2 °C increase in the inlet temperature, the minimum temperature of the battery module would increase by 1.84 °C, and the temperature difference would increase by approximately 0.65 °C. When the inlet temperature was the same, the preheating effect when the flow velocity was 0.3 m/s was worse than that when the flow velocity was 0.5 m/s. During the low temperature preheating process of the battery, affected by the heat exchange between the battery and the liquid cooling plate and the heat transfer coefficient of the battery itself, the temperature rise rate of the battery pack was slower than the rise rate of the inlet temperature, and the increase in the inlet temperature increased the battery temperature. At the same time, this also led to an increase in the temperature gradient inside the battery, which then led to a larger temperature difference between the modules after preheating.

3.4. Structural Optimization and Analysis of External Preheating Scheme

3.4.1. Analysis of Adding a Cooling Plate and the Influence on Preheating Effect

Through the above analysis, it is found that, by changing the flow rate and inlet temperature, the preheating effect of the battery pack can be effectively improved. However, due to the heat transfer coefficient between the battery and the cooling plate and the limitations of the preheating structure, the temperature difference between the modules of the battery pack is still large, and the temperature at the center of the module is too low. Therefore, we adopted the “bisection method” commonly used in engineering. On the basis of preheating on three sides, an extra cooling plate was added in the middle of the battery pack to achieve system optimization. The optimized structure of the battery pack is shown in Figure 10.
The ambient temperature was set at −20 °C, water was used as the cooling medium, and the inlet temperature of the coolant was 25 °C. The preheating effect of the optimized preheating structure was studied by changing the flow rate, and the simulation results of the three-side preheating in the previous section were compared. The comparison is shown in Figure 11. It can be seen that, with the increase in the flow rate, the variation law of the preheating effect of the two is roughly the same, but the preheating effect of the optimized preheating structure is obviously better than that of the pre-optimized preheating structure. Under the same flow rate, the temperature difference of the battery pack after the optimized preheating structure is reduced by 0.75 °C on average. When the flow rate is greater than 0.8 m/s, the temperature difference of the battery module drops to below 5 °C, and the temperature uniformity of the module is significantly optimized.
In order to analyze the influence of the inlet temperature on the preheating effect of the optimized preheating structure, the cooling fluid flow rate was selected as 0.8 m/s, the ambient temperature was −20 °C, water was used as the cooling medium, and the inlet temperature was changed to simulate the battery pack. The results with the preheating effect of the structure before optimization were compared. As shown in Figure 12, at the same inlet temperature, the minimum temperature of the battery pack after preheating with the optimized structure is increased by 0.5 °C on average compared with the three-sided channel, and the temperature difference is decreased by 0.5 °C on average. As the inlet temperature increases, the temperature difference between the modules after the battery pack is preheated will gradually increase. When the inlet temperature exceeds 25 °C, the optimized structure cannot ensure that the battery pack uniformity meets the requirements after preheating.

3.4.2. Parameter Selection of Preheating Structure after Optimization

In order to determine the parameter range of the influencing factors that ensure the temperature difference of the module meets the requirements under the three-sided optimal structure, the orthogonal simulation shown in Table 5 was designed. The 42 groups of orthogonal simulations under the dual influence factors of flow velocity and inlet temperature were analyzed, and the reasonable range of influencing factors to satisfy the uniformity of the module was determined.
The initial temperature and ambient temperature of the battery pack were −20 °C, and water was used as the cooling medium. The simulation results are shown in Figure 13. It can be seen that, with the increase in the flow rate, the temperature difference of the battery pack will gradually decrease, and this rule is more significant at a higher inlet temperature and lower flow rate. When the flow rate is 0.1–0.4 m/s, the temperature difference is most affected by the flow rate. Every time the flow rate increases by 0.1 m/s, the maximum temperature difference of the battery pack decreases by 0.8 °C on average. When the flow rate continues to increase, limited by the thermal conductivity of the battery pack in all directions, the decreasing trend of the temperature difference becomes slower. With the increase in the inlet temperature, the temperature difference of the battery pack will gradually increase, and this law is more significant at a low flow rate and a high inlet temperature.
Table 6 displays a quantitative analysis of the preheating effect, and gives the parameter range of influencing factors that ensure the uniformity of the module meets the requirements. Green means that the temperature difference of the module is less than 5 °C (meeting the requirement), and orange means that the temperature difference of the module is greater than 5 °C (requirement not met). In the actual preheating process of the battery pack, the two objectives of preheating temperature and temperature difference can be taken into account according to actual needs, and further reasonable influencing factor parameters can be selected.

4. Combined Internal and External Battery Pack Preheating Strategy

The optimized preheating structure established in the above research adopted the heating coolant method to externally preheat the battery pack, and kept the temperature and temperature difference of the battery pack within a reasonable range after preheating. However, the external preheating still has a long preheating time issue. When the temperature difference of the battery is preheated to meet the requirements, the preheating time needs to be 1800 s. Therefore, in this part of the research, while the battery was preheated at a low temperature, the battery pack was DC discharged to achieve simultaneous heating inside and outside the battery pack, so as to shorten the preheating time.

4.1. Establishment and Effect Analysis of Combined Preheating System Inside and Outside the Battery Pack

The parameters for external preheating and internal preheating selection are shown in Table 7. The initial temperature and ambient temperature of the battery pack were set at −20 °C, and the preheating time was set to 1800 s. An internal and external joint preheating simulation analysis of the battery pack was carried out. The external preheating adopts three-sided cooling plate preheating, the cooling liquid flow rate was selected as 1 m/s, and the cooling liquid inlet temperature was selected as 25 °C. The internal preheating adopted the method of discharging the battery at a small rate, and the discharge current was selected as 3 A.
The temperature distribution of the battery during the thermal process is shown in Figure 14. When only external preheating is used, the minimum temperature of the battery pack after preheating for 1800 s is 19.6 °C, and the temperature difference is 5.4 °C. When using combined internal and external preheating, it takes only 860 s to achieve the same preheating effect as external preheating, and the time is reduced by 940 s; the battery pack takes only 925 s to make the temperature difference of the battery pack less than 5 °C. When the preheating time is 1800 s, the maximum temperature of the battery is 25 °C, the minimum temperature is 21.8 °C, and the temperature difference between the modules is 3.2 °C.

4.2. Orthogonal Simulation Scheme Formulation and Analysis

In order to further explore the influence law between external preheating and internal preheating parameters, the orthogonal simulation scheme shown in Table 8 was formulated in this study. In the external preheating, the arrangement of three-sided cooling plates was adopted, the coolant flow rate was 1 m/s, and the inlet temperature was selected from four groups of 20 °C, 25 °C, 30 °C, and 35 °C; while the discharge currents in the internal preheating were 3 A and 6 A, respectively. The state of charge of the primary battery was 80%, the preheating time is 1800 s, and the preheating target was defined as a module temperature difference of less than 5 °C.
Figure 15 shows the time required to meet the preheating temperature difference target under different orthogonal preheating schemes. The results show that, at the same discharge current, the higher the coolant temperature, the longer it takes to reach the preheating temperature difference target. When the discharge current is 3 A and 6 A, the preheating time increases by 63.3 s and 56.67 s on average when the inlet temperature increases by 5 °C, respectively. Under the same coolant temperature, the larger the discharge current, the less time it takes to reach the expected temperature difference target. The rise in the discharge current increases the heat generation power of the battery and reduces the internal temperature gradient of the battery, thereby effectively shortening the preheating time. Under the four coolant temperatures of 20 °C, 25 °C, 30 °C and 35 °C, the preheating time of the battery pack is reduced by 45 s, 55 s, 55 s, and 65 s, respectively.

4.3. Internal and External Joint Preheating Strategy Based on Available Capacity of Battery

During the discharge phase, when the SOC of the lithium battery is lower than 20%, its power output will be limited [30]. In addition, in a low temperature environment, the available capacity of the battery will be further reduced, and the available capacity of the battery may not be able to meet the discharge requirements of combined internal and external preheating. Therefore, the discharge capacity of the battery was tested at −20 °C, −10 °C, 0 °C, and 25 °C to find the relationship between the battery’s available capacity, remaining capacity, and ambient temperature. Then, a combined internal and external preheating strategy based on the available capacity of the battery was proposed, and the preheating effect of the strategy was verified.
The results of the capacity test are shown in Figure 16. It can be seen that the discharge capacity of the battery decreases as the ambient temperature decreases, and the usable capacity of the battery also decreases. The discharge capacities at −20 °C, −10 °C, 0 °C, and 25 °C are 10.993 Ah, 15.04 Ah, 26.39 Ah, and 30.58 Ah, respectively. The usable capacity of the battery with 30% SOC at −20°C was only 3.298 Ah. If the battery in this state is preheated by DC discharge, the capacity of the battery will drop to the lower threshold before the preheating is completed.
Therefore, this study proposed a combined internal and external preheating strategy based on the battery’s available capacity and ambient temperature, as shown in Figure 17. The minimum threshold of the battery state of charge was set at 20%, and the battery was divided with different states of charge into four parts:
  • When the state-of-charge of the battery is lower than 20%, the battery is preheated by external preheating, the three-sided cooling plate structure is adopted, and the coolant flow rate is selected as 1 m/s. To reduce the temperature difference of the module after preheating, the inlet temperature of the coolant is 20 °C;
  • When the state of charge of the battery is 30%, the external preheating method is used to preheat the battery first. A coolant inlet temperature of 35 °C is selected as the upper limit, and a flow rate of 1 m/s to shorten the time of external preheating. When the minimum temperature of the battery reaches −10 °C, the available capacity of the battery increases, the internal and external preheating method is then adopted, the discharge current is 3 A, and the inlet temperature is switched to 25 °C to reduce the temperature difference of the module after preheating and to shorten the preheating time;
  • When the state of charge of the battery is 40–50%, it meets the requirements of continuous DC discharge during the preheating time. Therefore, the combined internal and external preheating method is adopted, the discharge current is 3 A, the inlet temperature is 25 °C, and the flow rate is 1 m/s;
  • When the state of charge of the battery is above 60%, the usable capacity of the battery is relatively large. The internal and external preheating method is adopted, and the discharge current is 6 A to shorten the preheating time. The coolant inlet temperature is selected as 25 °C, and the flow rate is 1 m/s.
According to the above preheating strategy, the battery packs in different states of charge are preheated. The preheating results prove the rationality of the preheating strategy. The preheating time and effect are shown in Table 9. The preheating strategy considers the currently available capacity of the battery, and effectively solves the long preheating time issue of the external battery preheating system, which is helpful for the use and promotion of electric vehicles in cold regions.

5. Conclusions

This paper takes a 30 Ah LiFePO4 pouch battery as the research object, optimizes the liquid cooling system of the battery pack for its low-temperature preheating requirements, and analyzes the factors affecting the internal and external preheating of the battery pack. On this basis, a combined internal and external preheating method based on DC discharge and liquid preheating was designed, a combined internal and external preheating strategy based on the available battery power was proposed, and the preheating effect of the preheating strategy was verified.
The main conclusions of this paper are as follows:
  • In the external preheating method, the cooling plate arrangement scheme and the inlet temperature have an obvious influence on the preheating effect, while the improvement in the flow velocity on the preheating effect is saturated;
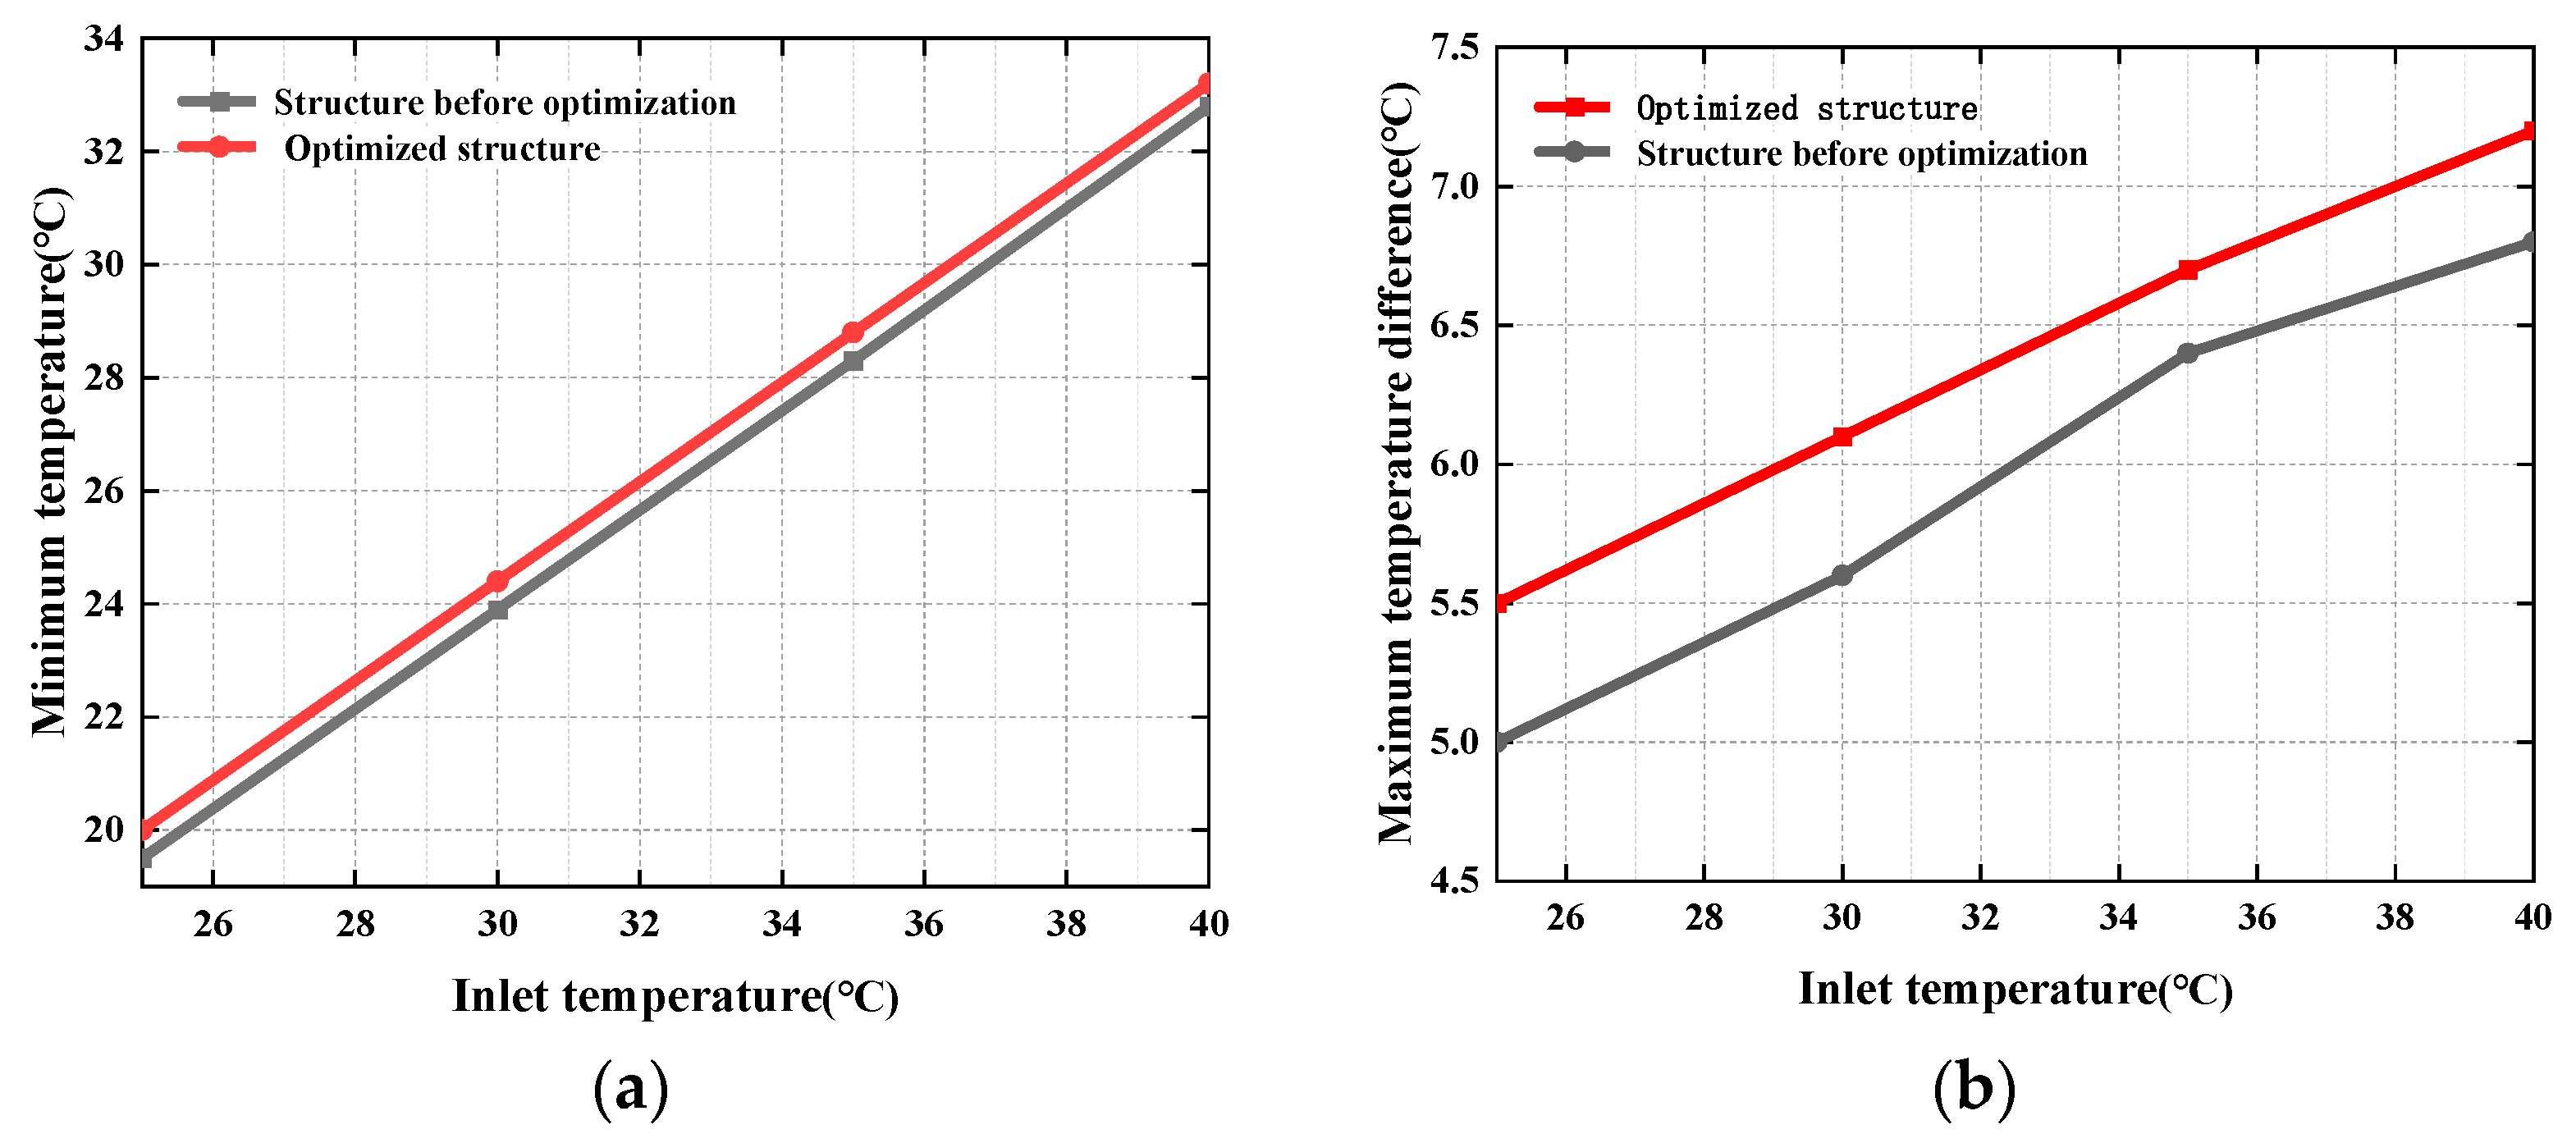
  • To solve the issue regarding the uneven distribution of external preheating, an optimized external battery pack preheating structure is established that can significantly improve the preheating effect. Compared with three-sided preheating, the temperature difference of the module at the same flow rate and the same inlet temperature is reduced by an average of 0.75 °C and 0.5 °C, respectively;
  • Aimed at a long external preheating time, a combined internal and external preheating method based on DC discharge and external preheating is proposed according to the currently available battery power. The results show that, compared with external preheating, the preheating time of this preheating method is reduced by approximately 50%, which can effectively improve the issue regarding the battery’s long external preheating time.

Author Contributions

Conceptualization, X.W. and Y.S.; methodology, Z.W.; software, J.S.; validation, X.W., Y.S. and Z.W.; formal analysis, X.W.; investigation, Y.S.; resources, Z.W and Y.S.; writing—original draft preparation, Y.S.; writing—review and editing, J.D.; project administration, X.W. All authors have read and agreed to the published version of the manuscript.

Funding

This research was funded by Foundation of State Key Laboratory of Automotive Simulation and Control, grant number 20210202.

Data Availability Statement

Not applicable.

Conflicts of Interest

The authors declare no conflict of interest.

References

  1. Hao, X.; Yuan, Y.; Wang, H.; Ouyang, M. Plug-in hybrid electric vehicle utility factor in China cities: Influencing factors, empirical research, and energy and environmental application. eTransportation 2021, 10, 100138. [Google Scholar] [CrossRef]
  2. Liu, J.; Wang, Z.; Hou, Y.; Qu, C.; Hong, J.; Lin, N. Data-driven energy management and velocity prediction for four-wheel-independent-driving electric vehicles. eTransportation 2021, 9, 100119. [Google Scholar] [CrossRef]
  3. Leng, F.; Tan, C.M.; Pecht, M. Effect of Temperature on the Aging rate of Li Ion Battery Operating above Room Temperature. Sci. Rep. 2015, 5, 12967. [Google Scholar] [CrossRef] [PubMed] [Green Version]
  4. Yang, X.; Doyle-Davis, K.; Gao, X.; Sun, X. Recent progress and perspectives on designing high-performance thick electrodes for all-solid-state lithium batteries. eTransportation 2021, 11, 100152. [Google Scholar] [CrossRef]
  5. Waag, W.; Kabitz, S.; Sauer, D. Experimental investigation of the lithium-ion battery impedance characteristic at various conditions and aging states and its influence on the application. Appl. Energy 2013, 102, 885–897. [Google Scholar] [CrossRef]
  6. Zheng, F.; Jiang, J.; Sun, B.; Zhang, W.; Pecht, M. Temperature dependent power capability estimation of lithium-ion batteries for hybrid electric vehicles. Energy 2016, 113, 64–75. [Google Scholar] [CrossRef]
  7. Liao, C. Electrolytes and additives for batteries Part I: Fundamentals and insights on cathode degradation mechanisms. eTransportation 2020, 5, 100068. [Google Scholar] [CrossRef]
  8. Wang, Y.; Zhang, X.; Chen, Z. Low temperature preheating techniques for Lithium-ion batteries: Recent advances and future challenges. Appl. Energy 2022, 313, 118832. [Google Scholar] [CrossRef]
  9. Hu, G.; Huang, P.; Bai, Z.; Wang, Q.; Qi, K. Comprehensively analysis the failure evolution and safety evaluation of automotive lithium-ion battery. eTransportation 2021, 10, 100140. [Google Scholar] [CrossRef]
  10. Petzl, M.; Kasper, M.; Danzer, M.A. Lithium plating in a commercial lithium-ion battery-A low-temperature aging study. J. Power Sources 2015, 275, 799–807. [Google Scholar] [CrossRef]
  11. Hales, A.; Prosser, R.; Diaz, L.B.; White, G.; Patel, Y.; Offer, G. The Cell Cooling Coefficient as a design tool to optimise thermal management of lithium-ion cells in battery packs. eTransportation 2021, 6, 100089. [Google Scholar] [CrossRef]
  12. Qin, P.; Sun, J.; Yang, X.; Wang, Q. Battery thermal management system based on the forced-air convection: A review. eTransportation 2021, 7, 100097. [Google Scholar] [CrossRef]
  13. Stuart, T.A.; Hande, A. HEV battery heating using AC currents. J. Power Sources 2004, 129, 368–378. [Google Scholar] [CrossRef]
  14. Wu, S.; Xiong, R.; Li, H.; Nian, V.; Ma, S. The state of the art on preheating lithium-ion batteries in cold weather. J. Energy Storage 2020, 27, 101059. [Google Scholar] [CrossRef]
  15. Yue, Q.L.; He, C.X.; Wu, M.C.; Zhao, T.S. Advances in thermal management systems for next-generation power batteries. Int. J. Heat Mass Transf. 2021, 181, 121853. [Google Scholar] [CrossRef]
  16. Ji, Y.; Wang, C.Y. Heating strategies for Li-ion batteries operated from subzero temperatures. Electrochim. Acta 2013, 107, 113797. [Google Scholar] [CrossRef]
  17. Ruan, H.; Jiang, J.; Sun, B.; Su, X.; He, X.; Zhao, K. An optimal internal-heating strategy for lithium-ion batteries at low temperature considering both heating time and lifetime reduction. Appl. Energy 2019, 256, 1–11. [Google Scholar] [CrossRef]
  18. Ruan, H.; Sun, B.; Zhu, T.; He, X.; Su, X.; Cruden, A.; Gao, W. Compound self-heating strategies and multi-objective optimization for lithium-ion batteries at low temperature. Appl. Therm. Eng. 2021, 186, 116158. [Google Scholar] [CrossRef]
  19. Guo, S.; Yang, R.; Shen, W.; Liu, Y.; Guo, S. DC-AC hybrid rapid heating method for lithium-ion batteries at high state of charge operated from low temperatures. Energy 2022, 238, 121809. [Google Scholar] [CrossRef]
  20. Qu, Z.; Jiang, Z.; Wang, Q. Experimental study on pulse self-heating of lithium-ion battery at low temperature. Int. J. Heat Mass Transf. 2019, 135, 696–705. [Google Scholar] [CrossRef]
  21. Ghassemi, A.; Hollenkamp, A.F.; Banerjee, P.C.; Bahrani, B. Impact of high-amplitude alternating current on LiFePO4 battery life performance: Investigation of AC-preheating and microcycling effects. Appl. Energy 2022, 314, 118940. [Google Scholar] [CrossRef]
  22. Hu, X.; Zheng, Y.; Howey, D.A.; Perez, H.; Foley, A.; Pecht, M. Battery warm-up methodologies at subzero temperatures for automotive applications: Recent advances and perspectives. Prog. Energy Combust. Sci. 2020, 77, 100806. [Google Scholar] [CrossRef]
  23. Ruan, H.; Sun, B.; Cruden, A.; Zhu, T.; Jiang, J.; He, X.; Su, X.; Ghoniem, E. Optimal external heating resistance enabling rapid compound self-heating for lithium-ion batteries at low temperatures. Appl. Therm. Eng. 2022, 200, 117536. [Google Scholar] [CrossRef]
  24. Wang, Y.; Rao, Z.; Liu, S.; Li, X.; Li, H.; Xiong, R. Evaluating the performance of liquid immersing preheating system for Lithium-ion battery pack. Appl. Therm. Eng. 2021, 190, 116811. [Google Scholar] [CrossRef]
  25. Guo, J.; Jiang, F. A novel electric vehicle thermal management system based on cooling and heating of batteries by refrigerant. Energy Convers. Manag. 2021, 237, 114145. [Google Scholar] [CrossRef]
  26. Lin, C.; Wang, F.; Fan, B.; Ren, S.; Zhang, Y.; Han, L.; Liu, S.; Xu, S. Comparative study on the heat generation behavior of lithium-ion batteries with different cathode materials using accelerating rate calorimetry. Energy Procedia 2017, 142, 3369–3374. [Google Scholar] [CrossRef]
  27. Monika, K.; Chakraborty, C.; Roy, S.; Dinda, S.; Singh, S.A.; Datta, S.P. An improved mini-channel based liquid cooling strategy of prismatic LiFePO4 batteries for electric or hybrid vehicles. J. Energy Storage 2021, 35, 102301. [Google Scholar] [CrossRef]
  28. Liu, H.; Chika, E.; Zhao, J. Investigation into the effectiveness of nanofluids on the mini-channel thermal management for high power lithium-ion battery. Appl. Therm. Eng. 2018, 142, 511–523. [Google Scholar] [CrossRef]
  29. Chen, F.C.; Gao, Z.; Loutfy, R.O.; Hecht, M. Analysis of Optimal Heat Transfer in a PEM Fuel Cell Cooling Plate. Fuel Cells 2003, 3, 181–188. [Google Scholar] [CrossRef]
  30. Lyu, P.; Liu, X.; Qu, J.; Zhao, J.; Huo, Y.; Qu, Z.; Rao, Z. Recent advances of thermal safety of lithium-ion battery for energy storage. Energy Storage Mater. 2020, 31, 195–220. [Google Scholar] [CrossRef]
Figure 1. Battery performance test experimental platform.
Batteries 08 00179 g001
Figure 2. Test results of various electrical performance parameters of the battery: (a) battery internal resistance−SOC curve; (b) battery OCV−SOC curve; (c) entropy coefficient−SOC curve.
Batteries 08 00179 g002
Figure 3. Flow chart of battery charging heat generation experiment and verification; (1) Batteries used in the study and the location of thermocouple arrangement; (2) Battery charging/discharging machine and incubator used in the experiment; (3) Upper computer and data acquisition instrument; (4) Model of single battery.
Batteries 08 00179 g003
Figure 4. Comparison of temperature rise between simulation and experiment: (a) 1C charging rate; (b) 2C charging rate.
Batteries 08 00179 g004
Figure 5. Internal channel of battery pack external preheating structure: (a) bottom channel internal structure; (b) bottom trench post-package structure; (c) side channel internal structure; (d) side trench post-package structure; (e) three-sided preheating structure.
Batteries 08 00179 g005aBatteries 08 00179 g005b
Figure 6. Flow chart of low-temperature preheating simulation.
Batteries 08 00179 g006
Figure 7. Comparison of minimum temperature/maximum temperature difference after preheating at different flow velocities.
Batteries 08 00179 g007
Figure 8. Comparison of battery pack temperature after preheating at flow rates of 0.6 m/s and 1 m/s: (a) surface temperature distribution of battery pack after preheating at 0.6 m/s; (b) temperature gradient of battery pack after warm-up at 0.6 m/s; (c) surface temperature distribution of battery pack after preheating at 1 m/s; (d) temperature gradient of battery pack after warm-up at 1 m/s.
Batteries 08 00179 g008
Figure 9. Comparison of minimum temperature/maximum temperature difference of the battery pack after preheating with different inlet temperatures/velocity orthogonal scheme.
Batteries 08 00179 g009
Figure 10. External preheating optimization structure of battery pack.
Batteries 08 00179 g010
Figure 11. Comparison of three-sided preheating and optimized structure after preheating of the battery pack at different flow velocities: (a) minimum temperature comparison at different flow velocities; (b) comparison of the maximum temperature difference at different flow velocities.
Batteries 08 00179 g011
Figure 12. Comparison of three-sided preheating and optimized structure after preheating at different inlet temperatures of the battery pack: (a) comparison of minimum temperature under different inlet temperatures; (b) comparison of maximum temperature difference at different inlet temperatures.
Batteries 08 00179 g012
Figure 13. Comparison of the maximum temperature difference between different flow rates/inlet temperatures under the optimized structure: (a) comparison of the maximum temperature difference at different flow velocities; (b) comparison of maximum temperature difference at different inlet temperatures.
Batteries 08 00179 g013
Figure 14. Temperature distribution of battery pack under different preheating times: (a) 860 s; (b) 925 s; (c) 1800 s.
Batteries 08 00179 g014
Figure 15. Effect of different combined internal and external preheating schemes on preheating time of battery pack.
Batteries 08 00179 g015
Figure 16. Relationship between battery’s available capacity, residual capacity, and ambient temperature.
Batteries 08 00179 g016
Figure 17. Combined internal and external battery preheating strategy.
Batteries 08 00179 g017
Table 1. Basic parameters of LiFePO4 soft pack battery for experiment.
Parameters/UnitsNumber
Weight/g795 ± 2
Dimensions (L × W × H)/mm251 × 174 × 10.2
Nominal capacity/Ah30
Nominal voltage/V3.2
Charge cut-off voltage/V3.65
Discharge cut-off voltage/V2.0
Charging working temperature/°C0~45
Discharge working temperature/°C−20~60
Standard charge and discharge rate0.3 C
Table 2. Physical property parameters of liquid cooling plate and coolant material.
MaterialSpecific Heat Capacity (J/kg·K)Density (kg/m³)Thermal Conductivity (W/(m·K))Viscosity (Pa·s)
water4180998.230.5990.001001
aluminum9032707237--
Table 3. Temperature of the battery module under different flow rates of three-side preheating.
Maximum Temperature (°C)Minimum Temperature (°C)Temperature Difference (°C)Ambient Temperature (°C)
0.1 m/s2516.28.8−20
0.2 m/s2517.57.5−20
0.3 m/s2518.56.5−20
0.4 m/s2518.86.2−20
0.5 m/s2519.15.9−20
0.6 m/s2519.35.7−20
0.7 m/s2519.45.6−20
0.8 m/s2519.55.5−20
0.9 m/s2519.65.4−20
1.0 m/s2519.65.4−20
Table 4. Orthogonal simulation scheme of velocity/inlet temperature under three-side preheating mode.
26 °C27 °C28 °C29 °C30 °C31 °C32 °C33 °C34 °C35 °C
0.3 m/s26/0.327/0.328/0.329/0.330/0.331/0.332/0.333/0.334/0.335/0.3
0.5 m/s26/0.527/0.528/0.529/0.530/0.531/0.532/0.533/0.534/0.535/0.5
Table 5. Orthogonal simulation scheme for flow rate and inlet temperature.
Flow Velocity/Inlet Temperature20 °C21 °C22 °C23 °C24 °C25 °C
0.1 m/s0.1/200.1/210.1/220.1/230.1/240.1/25
0.2 m/s0.2/200.2/210.2/220.2/230.2/240.2/25
0.3 m/s0.3/200.3/210.3/220.3/230.3/240.3/25
0.4 m/s0.4/200.4/210.4/220.4/230.4/240.4/25
0.5 m/s0.5/200.5/210.5/220.5/230.5/240.5/25
0.6 m/s0.6/200.6/210.6/220.6/230.6/240.6/25
0.7 m/s0.7/200.7/210.7/220.7/230.7/240.7/25
Table 6. Module temperature difference under orthogonal simulation of dual influencing factors of flow velocity/inlet temperature.
Flow Velocity/
Inlet Temperature
20 °C21 °C22 °C23 °C24 °C25 °C
0.1 m/s5.45.55.65.85.98
0.2 m/s5.25.45.45.55.56.6
0.3 m/s55.15.25.35.46
0.4 m/s555.15.15.25.6
0.5 m/s4.84.954.95.15.5
0.6 m/s4.74.84.9555.3
0.7 m/s4.74.84.84.94.95.1
Batteries 08 00179 i001: ≤ 5 °C; Batteries 08 00179 i002: ≥ 5 °C.
Table 7. Combined internal and external preheating regulations for battery packs.
Preheating MethodParameterNumerical Value
External preheatingCooling plate arrangementThree-sided cooling plate structure
Coolant flow rate1 m/s
Coolant temperature25 °C
Internal preheatingDC discharge3 A
Table 8. Orthogonal preheating simulation scheme of discharge current/inlet temperature.
Discharge Current/
Inlet Temperature
20 °C25 °C30 °C35 °C
3 A3/203/253/303/35
6 A6/206/256/306/35
Table 9. Comparison of battery pack preheating time under combined internal and external preheating strategy.
State of ChargeExternal Preheating
Time (s)
Combined Internal and External Preheating Time (s)Total Time (s)Minimum Temperature after Preheating (°C)Maximum Temperature Difference after Preheating (°C)
<20%1740--1740155
30%155790945205
40–50%--925925205
>60%--865865205
Publisher’s Note: MDPI stays neutral with regard to jurisdictional claims in published maps and institutional affiliations.

