Article

Cell-Internal Contacting of Prismatic Lithium-Ion Batteries Using Micro-Friction Stir Spot Welding

Institute for Machine Tools and Industrial Management (iwb), TUM School of Engineering and Design, Technical University of Munich, Boltzmannstrasse 15, 85748 Garching, Germany
*
Author to whom correspondence should be addressed.
Batteries 2022, 8(10), 174; https://doi.org/10.3390/batteries8100174
Submission received: 10 August 2022 / Revised: 29 September 2022 / Accepted: 1 October 2022 / Published: 10 October 2022
(This article belongs to the Special Issue Trends and Prospects in Lithium-Ion Batteries)

Abstract

:
The reliable production of high-quality lithium-ion battery components still poses a challenge, which must be met to cope with their rising demand. One key step in the production sequence is the process of cell-internal contacting, during which the electrode carrier foils of the anode and the cathode are joined with the arrester. This is usually done with ultrasonic or laser beam welding. Both joining processes, however, show limitations concerning the quality of the weld. This paper presents a new approach for cell-internal contacting by using micro-friction stir spot welding. Welding experiments were conducted in which joints with high mechanical strengths were produced. It was also shown that large stacks with foil numbers of 100 can be joined in only a few tenths of a second. The process is therefore especially of interest for the fast production of large-scale battery cells or other new types of high-energy-dense battery cells.

1. Introduction and State of the Art

The increasing demand for lithium-ion batteries [1] (i.e., for electric vehicles) requires fast and high-quality production processes for its components. Lithium-ion battery packs consist of single battery cells [2] for which the production chain encompasses a large number of steps [3] (pp. 212–219). One of these is the cell-internal contacting (example in Figure 1). During this step, the uncoated parts of the stacked or rolled collector foils are joined with the arrester [2] (also called collector [4,5]). The quality of the joint is crucial, since it is part of the electrical circuit of the cell [6] and because rejects late in the production chain increase costs [7].
Currently, ultrasonic welding (USW) and laser beam welding (LBW) are industrially applied for cell-internal contacting [3] (p. 217). For both processes, however, quality reducing defects, such as ruptured foils (USW and LBW) [8,9] pores (only LBW) [5,8], and a low reproducibility (USW [10]), have been reported. Another problematic issue is the possible damaging of the cell due to process induced vibrations (USW [2]) or spatter and fumes (LBW [5]). With regard to large-scale battery cells with a high layer number [11] and therefore high material costs [7,12], the process stability is of high importance. This is especially important with the cell-internal contacting; approx. 80% of the total manufacturing costs of battery cells are accumulated [12]. Not only a fast, but also a robust process is needed for large-scale cells. Robust in this case means that welds with joint properties, which meet the defined requirements, can be generated even when disturbances occur (e.g., imprecise fit-up of the foils). With USW and LBW, however, the welding time or defects and spatter (LBW [5]) increase with the number of welded foils, since higher joining energies are necessary for welding larger parts [13].
Figure 1. (a) Example of a prismatic lithium-ion battery cell with a hard case [11] and (b) the process sequence for cell-internal contacting using μFSSW in multi-sheet butt joint configuration. The arrows indicate the direction of movement.
Batteries 08 00174 g001
This analysis shows that LBW and USW show disadvantages for the application of cell-internal contacting, especially for large-scale cells. One possible alternative joining technology is micro-friction stir spot welding (μFSSW). The process is derived from friction stir spot welding (FSSW), which is used in the aerospace, automotive, and railway industry [14]. It is known for the high quality of the welds [15] and the high process robustness [16]. The prefix “micro” (μ) is added when workpieces with dimensions below 1 mm (e.g., foils) are joined [17].
μFSSW is a solid-state process (like USW) with which the joining partners are welded through frictional heat and material flow, and not through melting (like LBW). In Figure 1b, the process sequence is shown for a multi-sheet butt joint configuration. In the first process step, a rotating tool consisting of a shoulder and a probe is plunged (plunge speed vp) into the joining partners. The tool dwells there for a specified time td to increase the material softening and flow within the weld (second step). Afterwards (third step), the tool is retracted (retract speed vr), thereby leaving a characteristic negative imprint and flash on the surface. The process is highly automated and is typically monitored by using inline measured signals of the axial force Fz and the spindle torque Mz (process variables) [18,19,20].
A recent study [21] revealed the high potential of the process for cell-internal contacting. Gera et al. [21] joined stacks consisting of 50 commercially pure aluminium foils (no standard given) with one arrester tab (aluminium alloy 2024-T3, no standard given) on each side of the stack in a multi-sheet lap joint configuration. They employed a special three-piece welding tool, which included an additional circular clamping ring outside the rotating shoulder (“refill FSSW” [14]) and with which defect free spot welds with good mechanical properties were produced.
The results show that it is feasible to weld foil stacks with arrester tabs using μFSSW. The welding experiments were, however, not conducted with commonly used cathode and anode materials (pure aluminium and copper), which impedes an assessment of the process for cell-internal contacting, and results in a need for further investigations.

2. Objective, Materials and Methods

2.1. Objective of the Investigations

The objective of the investigations reported in this paper was a holistic assessment of the μFSSW process for cell-internal contacting of prismatic lithium-ion battery cells. For this, welding experiments were conducted, and the results discussed with regard to the following requirements (R1–R8) taken from literature:
R1.
high process stability and no welding defects [5];
R2.
no spatters or particles to prevent short circuits inside the cell [22,23];
R3.
high repeatability of the weld quality [22];
R4.
bonding of all foils and no damaged foils [22];
R5.
no thermal damaging of temperature sensitive cell components [22];
R6.
low electrical resistance of the joint [22];
R7.
high static mechanical strength of the joint [22];
R8.
low welding time [5].

2.2. Materials and Methods for the Experimental Investigations

The welding experiments were conducted with stacks of 30 electrode carrier foils and two thin arrester bars. A sketch of the workpiece configuration is shown in Figure 2 and the materials and dimensions are given in Table 1. For each workpiece, the foils were cut to size, stacked, and welded with the arrester bars in a multi-sheet butt joint configuration. This configuration was derived from a design with two thin arrester bars for each electrode, as shown by Lundgren et al. [24] and Kleiner et al. [4].
Like LBW [9], μFSSW needs sufficient clamping to restrain the delicate foils and arrester bars from deforming during the process. The design of the clamping system is, together with the applied fit-up process, described in Appendix A.1 and shown in Figure A1. Two different tools (tool 1 without a probe and tool 2 with a probe) were designed (see Appendix A.2, Figure A2) with which the welding experiments were conducted. For each tool (1 and 2) and material (aluminium and copper), four spot welds were produced on one workpiece, resulting in four spots produced by tool 1 and four spots produced by tool 2. This was done in order to analyze the reproducibility of the process (R3). The welding machine setup and the applied process parameters are also described in Appendix A.1 and Appendix A.2.

2.3. Methods for Evaluation

Evaluation criteria were derived for each requirement (R1–R8) and are listed in Table 2. The testing setups are described in Appendix B. Established evaluation methods, such as visual inspection and mechanical testing, were applied and adapted to the sample configuration.

3. Results and Discussion

The welding experiments were conducted, and the produced samples were analyzed as described in Section 2 and Appendix A and Appendix B. A summary of all collected data is given in Table A1 in Appendix C. The results from the acquired data are presented and discussed in the following section.

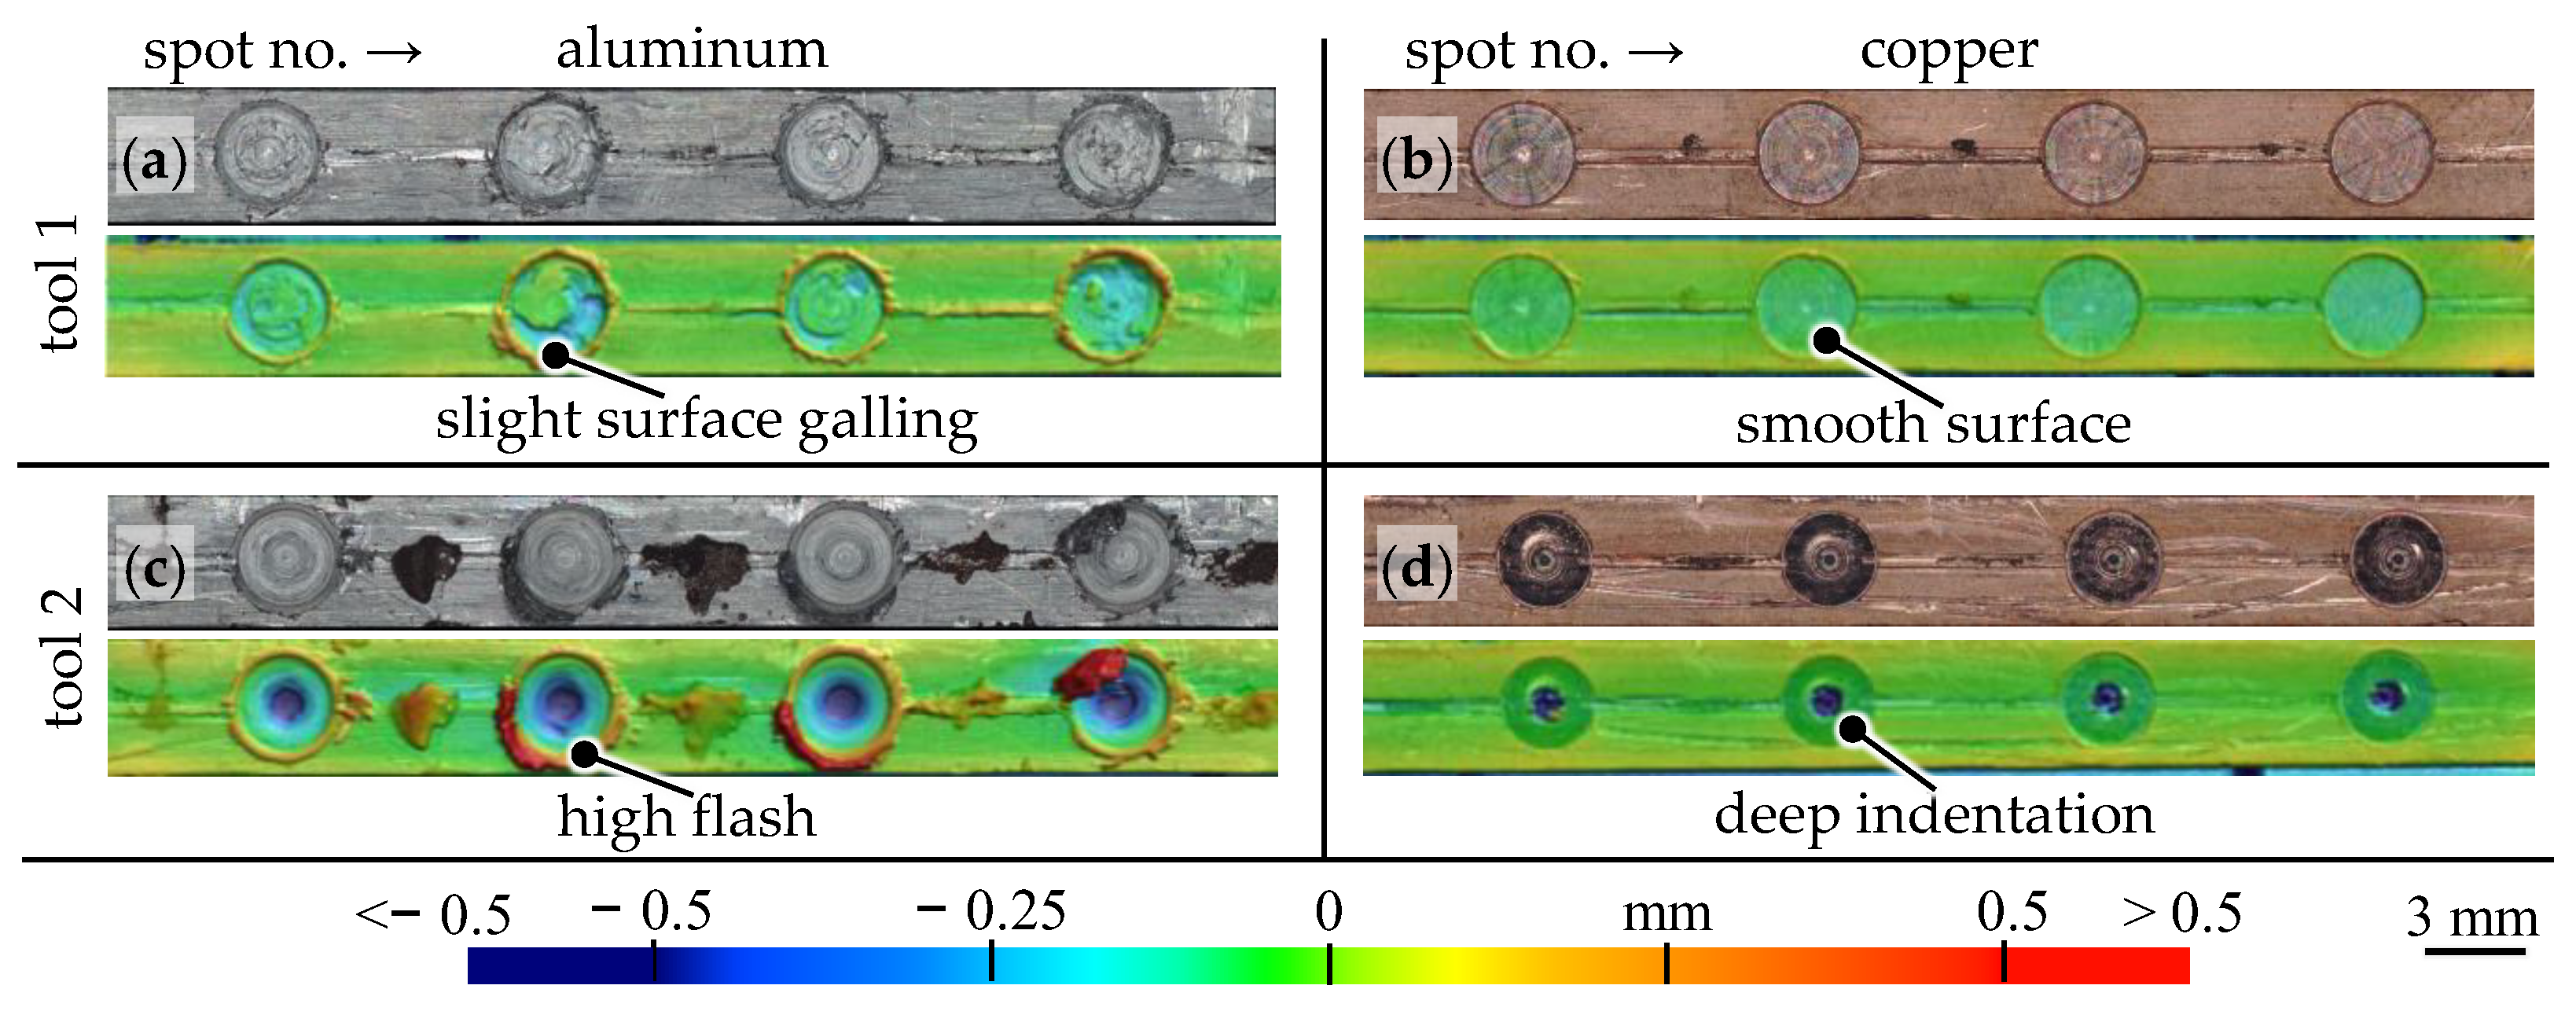
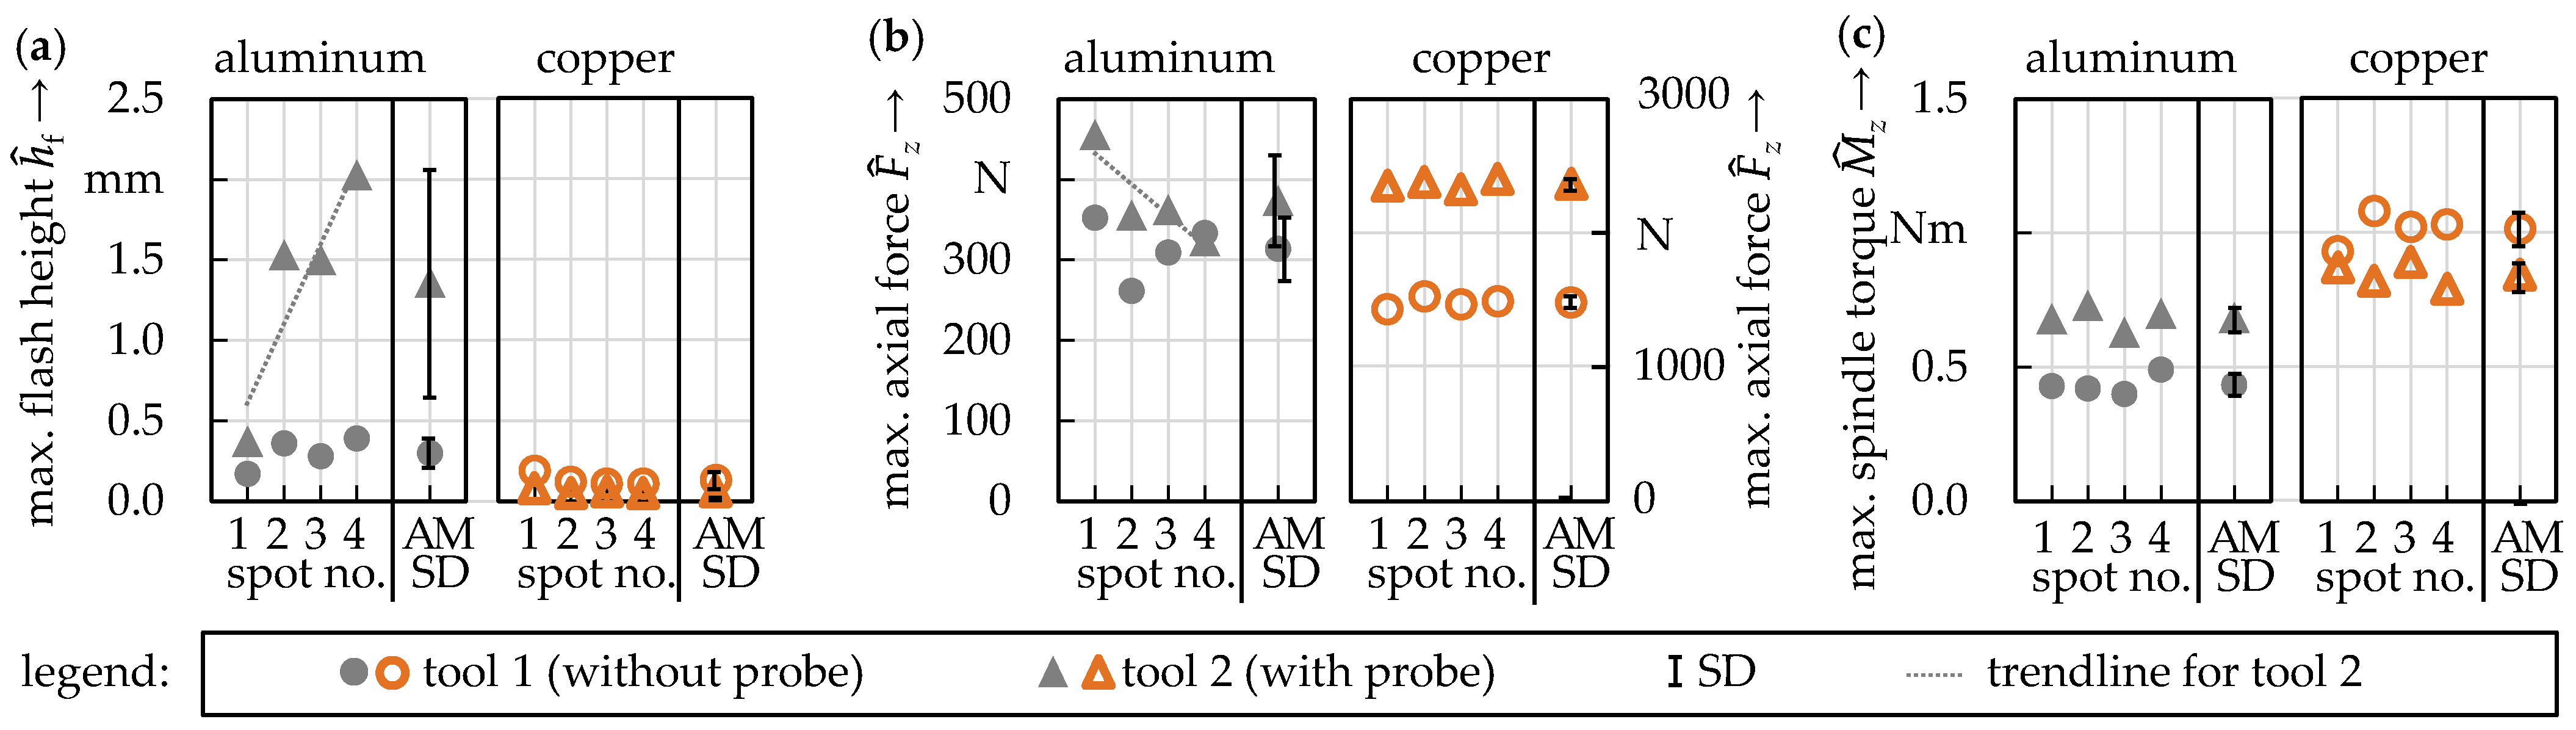
3.1. Visual Inspection and Weld Topographies (R1, R2 and R4)

First, a visual inspection (see Appendix B.1) of all welds was conducted. Sound welds (Figure 3) without defects (R1) were produced for aluminium and copper with both tools. All foils were connected and remained unruptured (R4). As expected, the tools left circular imprints on the surfaces of the parts. With tool 2, deep indentations were caused by the probe in the center of the spots. The weld surfaces for copper were generally more uniform than for aluminium. Characteristic surface galling (tool 1) and high flash (tool 2, max. flash heights h ^ f between 0.37 mm and 2.03 mm) were noticed for the aluminium spot welds. The visual inspection of tool 2 revealed the cause to be adhered aluminium material at and around the base of the probe. The material adhesion and particle detachment might be reduced by coating the tool’s surface (e.g., with TiB2 [30]).
No particle detachment from the workpieces was otherwise noticed during the welding experiments (R2). Aside from this, all other welds featured max. flash heights h ^ f below 0.39 mm, which is less than the height of the indentations in USW (approx. 0.7 mm) as reported by Shin et al. [29].
It is to be summarized that defect free welds (R1) can be produced without particle detachment (R2) by using appropriate tools (tool 1 for aluminium and both tools for copper). All welding samples showed completely attached and unruptured foils (R4).

3.2. Repeatability of the Process (R3)

The topographical data (see Appendix B.2) of the four spot welds were also used to assess the repeatability of the process (R3, Figure 4a). Using tool 1 for aluminium, low standard deviations (SD) of the flash heights h ^ f were achieved (0.09 mm) with a coefficient of variation (CV) of 30%. A trend in the data was noticed with tool 2 for aluminium, which is due to the described material adhesion on this tool (see Section 3.1). With copper, the lowest SD (0.01 mm) and CV (17%) were produced by using tool 2.
In addition to the topographical data, the process variable data (see Appendix B.3) was analyzed (R3). The measurement data of the max. axial forces F ^ z and the max. spindle torques M ^ z are shown in Figure 4b,c. For aluminium, the lowest values for the AM (314.14 N), the SD (34.09 N) and the CV (11%) of the max. axial forces F ^ z were achieved with tool 1. As with the topographical data, a trend in the data was noticed for tool 2 (only aluminium). The max. flash heights h ^ f correlated significantly (p-value below 0.05 [27], p. 74) with the max. axial forces F ^ z with a Pearson correlation coefficient of 0.9980. This indicates that the axial force F ^ z might be suitable for inline control of the weld surfaces.
For copper, the AMs of the max. axial force F ^ z and the max. spindle torques M ^ z were generally higher than for aluminium, which is due to its higher material strength [31]. Using tool 1, the lowest AM of the max. axial force F ^ z (1481.19 N) and using tool 2, the lowest SD (28.06 N) and CV (1%) were reached for copper.
The max. spindle torques M ^ z for μFSSW were generally very low (3 to 10 times lower than for FSSW [19]), ranging from 0.44 Nm ± 0.03 Nm (tool 1) to 0.69 Nm ± 0.04 Nm (tool 2) for aluminium and from 0.80 Nm ± 0.04 Nm (tool 2) to 1.02 Nm ± 0.05 Nm (tool 1) for copper with generally very low CV for both tools (aluminium: 6–7%, copper: 5%). No trend or significant correlation could be detected for the max. spindle torque M ^ z.
Based on this analysis, it can be summarized that a high reproducibility (R3) can be achieved with tool 1 for aluminium and with both tools for copper. The highest variation in the data was noticed for the max. flash height h ^ f (aluminium, tool 1: CV of 30% and copper, tool 2: CV of 17%). Controlling the max. axial force F ^ z and using surface-coated tools are feasible approaches for more uniform weld surfaces.
Due to different process variables, different measurement methods and a lack of data with regard to the weld topography in literature, a direct comparison to USW and LBW was not possible.

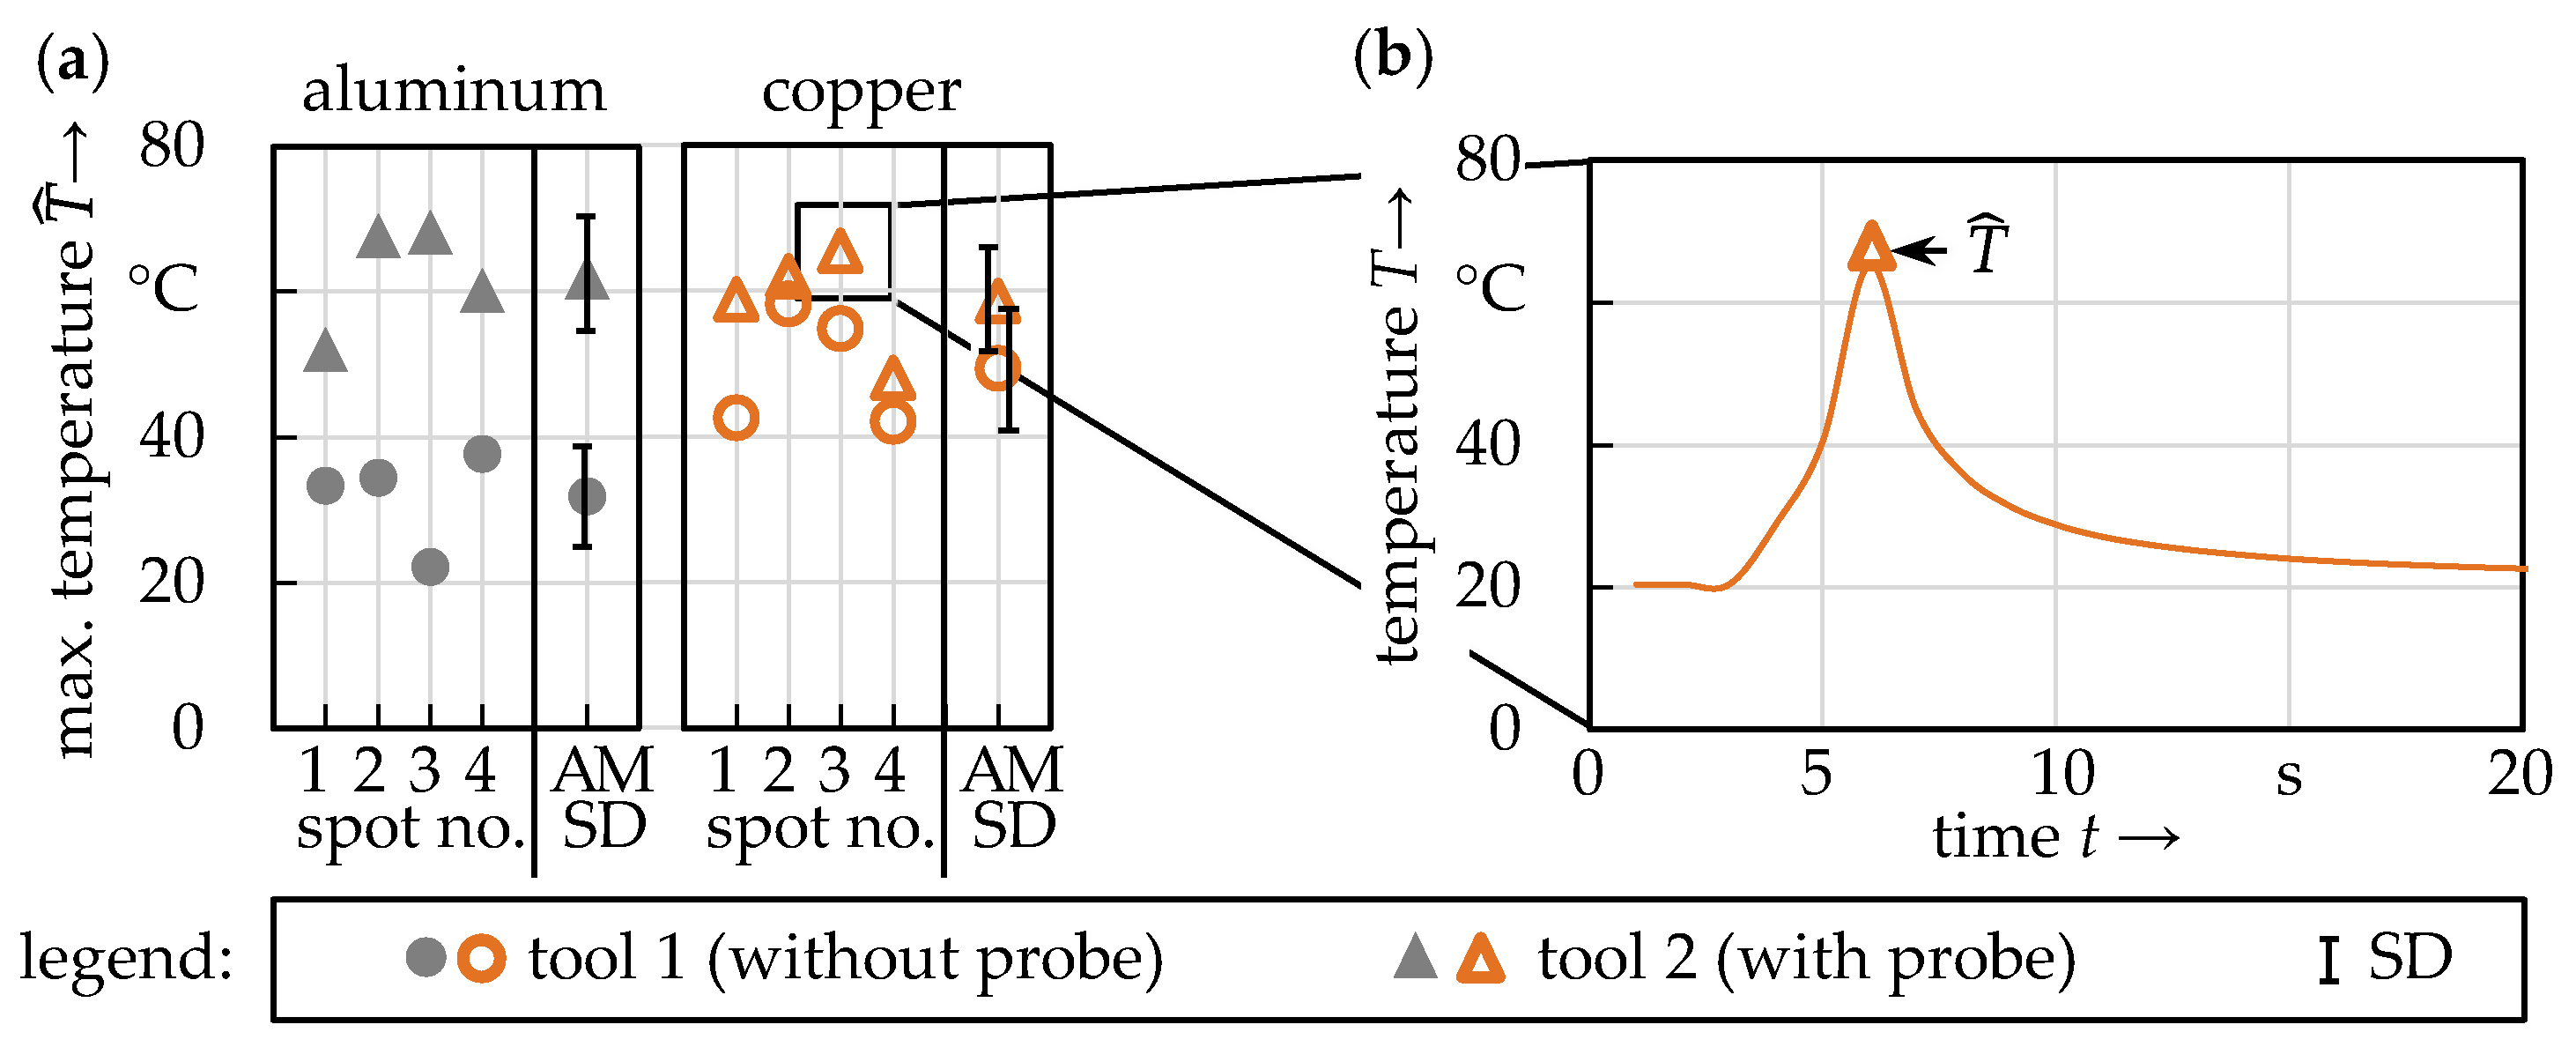
3.3. Temperatures in the Weld Surrounding Areas (R5)

The temperatures in the surrounding area of the welds (4.5 mm from the center of the spots, see Appendix B.4) were measured to determine whether thermal damaging of the temperature sensitive separators has to be expected (R5). The data (Figure 5a) showed that all temperatures were far lower than the defined limit of 90 °C. (see Table 2). Figure 5b displays the timeline of one exemplary measurement. It can be seen that the material’s temperature rose from room temperature (approx. 20 °C) to a max. value T ^ (here: 65.47 °C), and quickly declined again. The highest max. values T ^ of all experiments were 68.17 °C for aluminium (tool 2) and 65.47 °C for copper (tool 2). The temperatures when using tool 1 were generally lower than when using tool 2, which can be explained by the shorter plunge time (tool 1: 0.24 s, tool 2: 1.56 s, see Section 3.6) and the smaller tool surface area.
It can be concluded that at a distance of 4.5 mm to the spot centers, no thermal damaging of the separators (R5) was to be expected, as the measured temperatures were all lower than the defined limit of 90 °C.

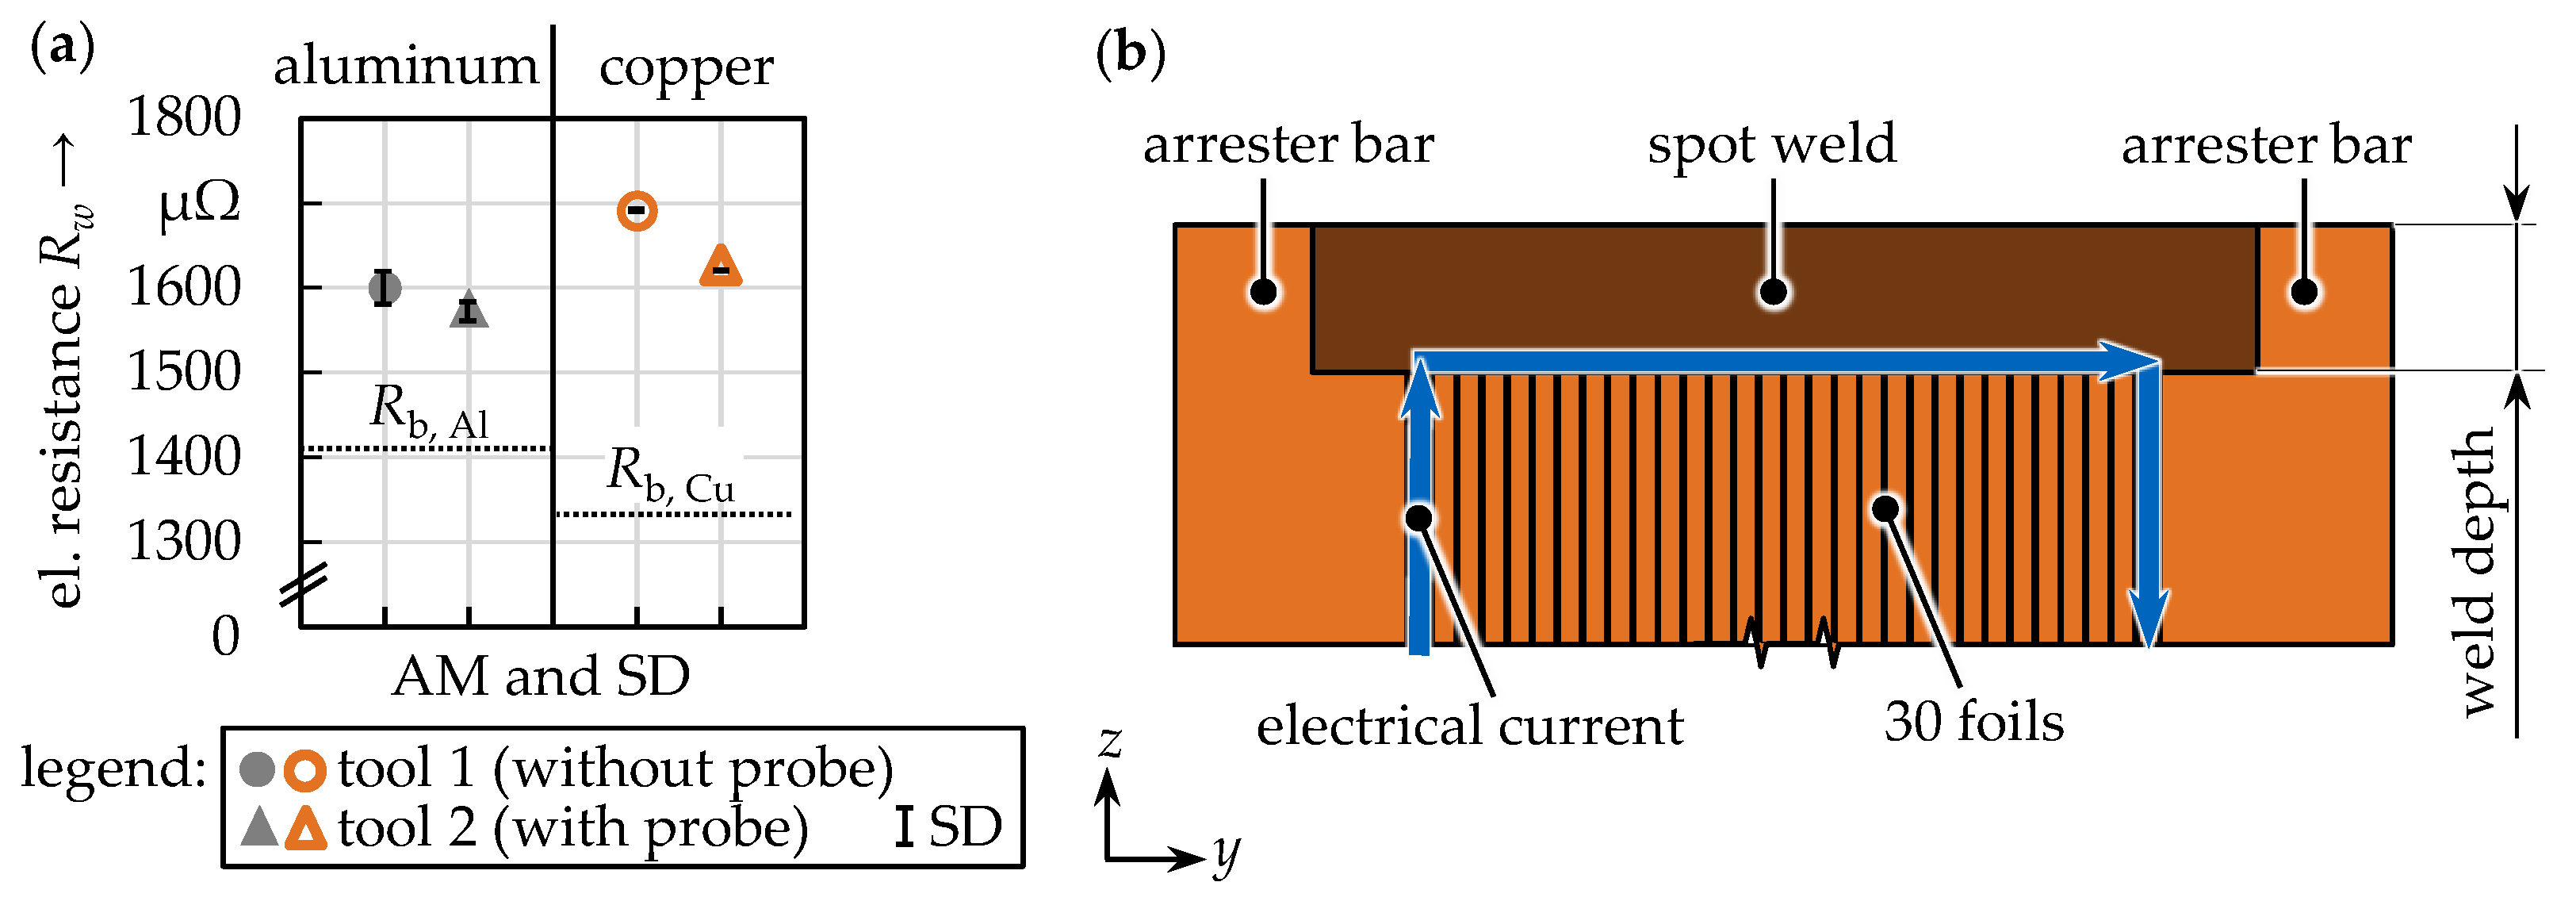
3.4. Electrical Resistances (R6)

The electrical resistances Rw (R6) of testing samples comprising three spot welds were determined as described in Appendix B.5. The testing revealed an increased electrical resistance Rw for all samples compared to unwelded reference foils Rb (Figure 6a), for aluminium from 1413.67 μΩ ± 0.50 μΩ (Rb, Al) to 1577.78 μΩ ± 12.38 μΩ (Rw, Al, tool 2) and for copper from 1334.52 μΩ ± 0.59 μΩ (Rb, Cu) to 1627.53 μΩ ± 0.45 μΩ (Rw, Cu, tool 2). The electrical resistances with tool 1 were higher than with tool 2: 1599.28 μΩ ± 13.82 μΩ (Rw, Al, tool 1) for aluminium, and 1690.57 μΩ ± 2.96 μΩ (Rw, Cu, tool 1) for copper.
One explanation for the generally increased electrical resistances Rw is that the foils were only connected through 3 spot welds, which means that only approx. 37% (3 spots with a diameter of 3 mm) of the 24.5 mm wide testing samples were joined. This reduces the cross-sectional area for the electrical current, thereby increasing the resistance in the arrester bar by a factor of approx. 2.70 (inverse of 37%). Also, a slightly higher specific electrical resistance of the arrester material (Cu-ETP) must be added.
Another explanation can be seen in increased conductor lengths inside the arrester bars resulting from the applied testing setup. This thought is schematically shown in Figure 6b. The welds in μFSSW are only created near the surface of the arrester bars (see weld depth). This means that the electrical current flows through the spot welds, through parts of unconnected foils at the lower end of the arrester bars and between those unconnected foils. The hypothesis that decreased weld depths result in higher electrical resistances Rw is supported by the lower electrical resistances produced by tool 2. With that, the theoretical conductor lengths are reduced by approx. 0.55 mm (length of the probe) on both sides of the weld (1.1 mm in total). Using these values and Pouillet’s law (see Appendix B.5), the total theoretical increase for the current flow within the unconnected foils can be calculated: 86.39 μΩ for aluminium and 81.55 μΩ for copper. However, the effects in the experimental data are less severe (aluminum: increase of 21.50 μΩ, copper: increase of 63.04 μΩ), which points towards positive influences on the electrical conductivity, such as a larger weld area produced by tool 2 or a higher electrical current flow between the unconnected parts of the foils.
It has to be noted that lower electrical resistances Rw are expected for a different testing setup. The resistance increase in the welding samples was determined simultaneously for both sides of the foil stacks with the setup applied in this study. In practical application, however, the electrical current will flow from the foil via the weld to the closest arrester bar. Additionally, imprecise part fit-up for testing might have resulted in longer measuring lengths, and therefore higher electrical resistances, resulting in errors in the range of several tenths of a μΩ.
From the analysis of the electrical resistances Rw (R6), the use of tool 2 is advised for both materials. Another improvement might be achieved by using tools which enhance the material mixing and result in a higher weld depth (i.e., tools with threads). Further investigations also need to be conducted concerning the positioning and size of the spot welds.

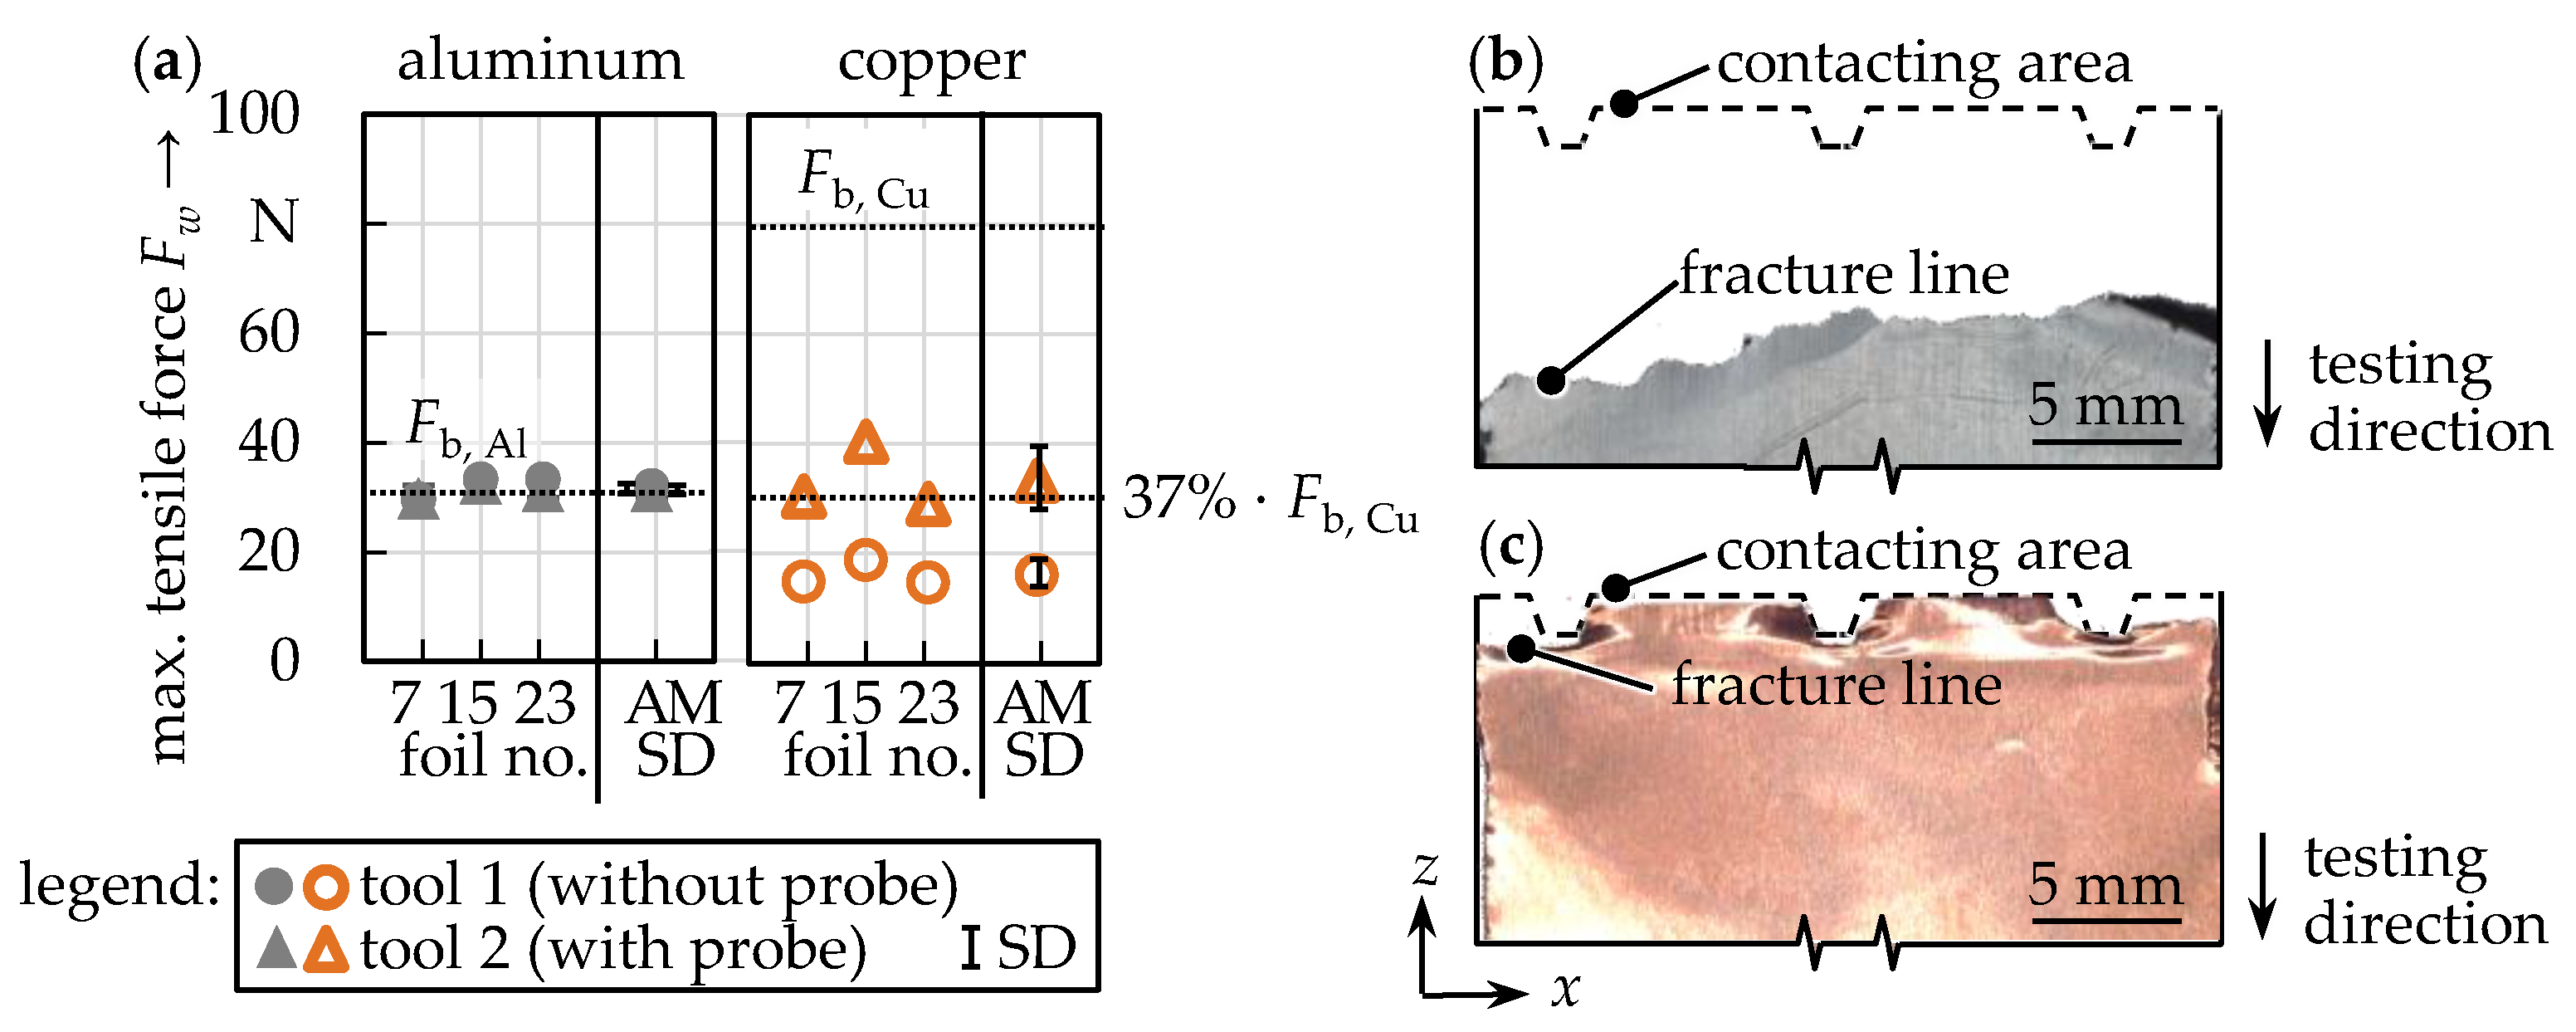
3.5. Mechanical Strength (R7)

Tensile testing was performed while the foils were removed from the stack one by one (see Appendix B.6). Almost all aluminium foils failed outside the contacting area (example in Figure 7b) with max. tensile forces Fw, Al in the range of the aluminium base material (Fb, Al of 33.44 N ± 0.60 N) for both tools (tool 1: 32.11 N ± 1.69 N, CV of 5% and tool 2: 31.16 N ± 1.13 N, CV of 4%). This shows that the mechanical strength of the aluminium foils was not impacted by welding.
With copper, however, the tensile strengths were lowered due to welding. The foils all failed close to the contacting area (Figure 7c). The reason for the lowered strengths could be the smaller joint areas due to the spot welds (37%, see Section 3.4). This hypothesis is supported by the data from tool 2 (see dotted line in Figure 7). The generally softer material and possible micro force closure outside the spot welds might be the reasons why there was no impact from welding on the strengths of the aluminium samples. The strongest welds for copper were produced by using tool 2 (Fw, Cu, tool 2 of 33.33 N ± 5.07 N, CV of 15%). With tool 1, the max. tensile forces F w, Cu, tool 1 were lower (16.20 N ± 1.90 N, CV of 12%), which might be the result of the reduced weld depths using this tool. Compared to shear testing conducted for LBW joined foil stacks [8], the SD and CV were low. Similarly to the electrical conductivities, it is expected that the strengths in the copper welds can be improved by welding with tools that enhance the material mixing (e.g., structured tools).
It should be noted that the cell design is influenced by the lowest joint strengths. Comparing both materials, it can be concluded that similar strengths (R7) can be achieved using an appropriate tool (tool 1 or tool 2 for aluminium and tool 2 for copper). It should also be noted that a reduction in strength is usual with LBW [8] and USW [2,5].

3.6. Welding Speed (R8)

The welding times tweld were calculated (see Appendix B.7) from the process parameters used in the experimental study (plunge speed vp of 25 mm/min, retreat speed vr of 100 mm/min, dwell time td of 0 s and a plunge depth of 0.1 mm, see Appendix A.2). Using tool 1, a welding time tweld, tool 1 of 0.30 s was determined for both materials, which lies in the faster ranges for USW of 40 foils [29]. Using tool 2, the welding time tweld is higher (1.95 s) due to the probe, which had a length of 0.55 mm.
The use of multi-spindle heads is suggested for a production of several spots at once. Since the process parameters for this study were not chosen with the objective of a minimized production time, lower welding times are expected to be possible.

4. Conclusions and Outlook

Through an experimental study, it was shown that μFSSW is a promising new joining technology for internal contacting in prismatic lithium-ion battery cells. Spot welds were fabricated for stacks consisting of 30 aluminium and 30 copper foils with two different tools (with and without a probe). The process produced welds with good properties, with regard to pre-defined requirements (R1–R8) taken from literature. The most important findings are:
  • Using μFSSW, sound aluminium and copper spot welds without visible defects or ruptured foils can be produced. Due to the low temperatures, no thermal damaging of the battery components has to be expected.
  • Aside from the multi-sheet lap joint configuration [21,32], the process also allows cell-internal contacting in multi-sheet butt joint configuration, which increases the flexibility in cell design.
  • The tensile strengths of the aluminium samples were not impacted by welding. For the copper samples, the strengths were reduced to that of aluminium. It is hypothesized that the mechanical quality can be improved by welding with tools that enhance the material mixing (e.g., structured tools).
  • For both aluminium and copper, the electrical resistances of the welding samples were higher than that of unwelded reference foils. It is expected that resistances can be improved by increasing the cross-section area of the weld, for example, by welding with larger or with structured tools. Another possibility is to produce line welds [32].
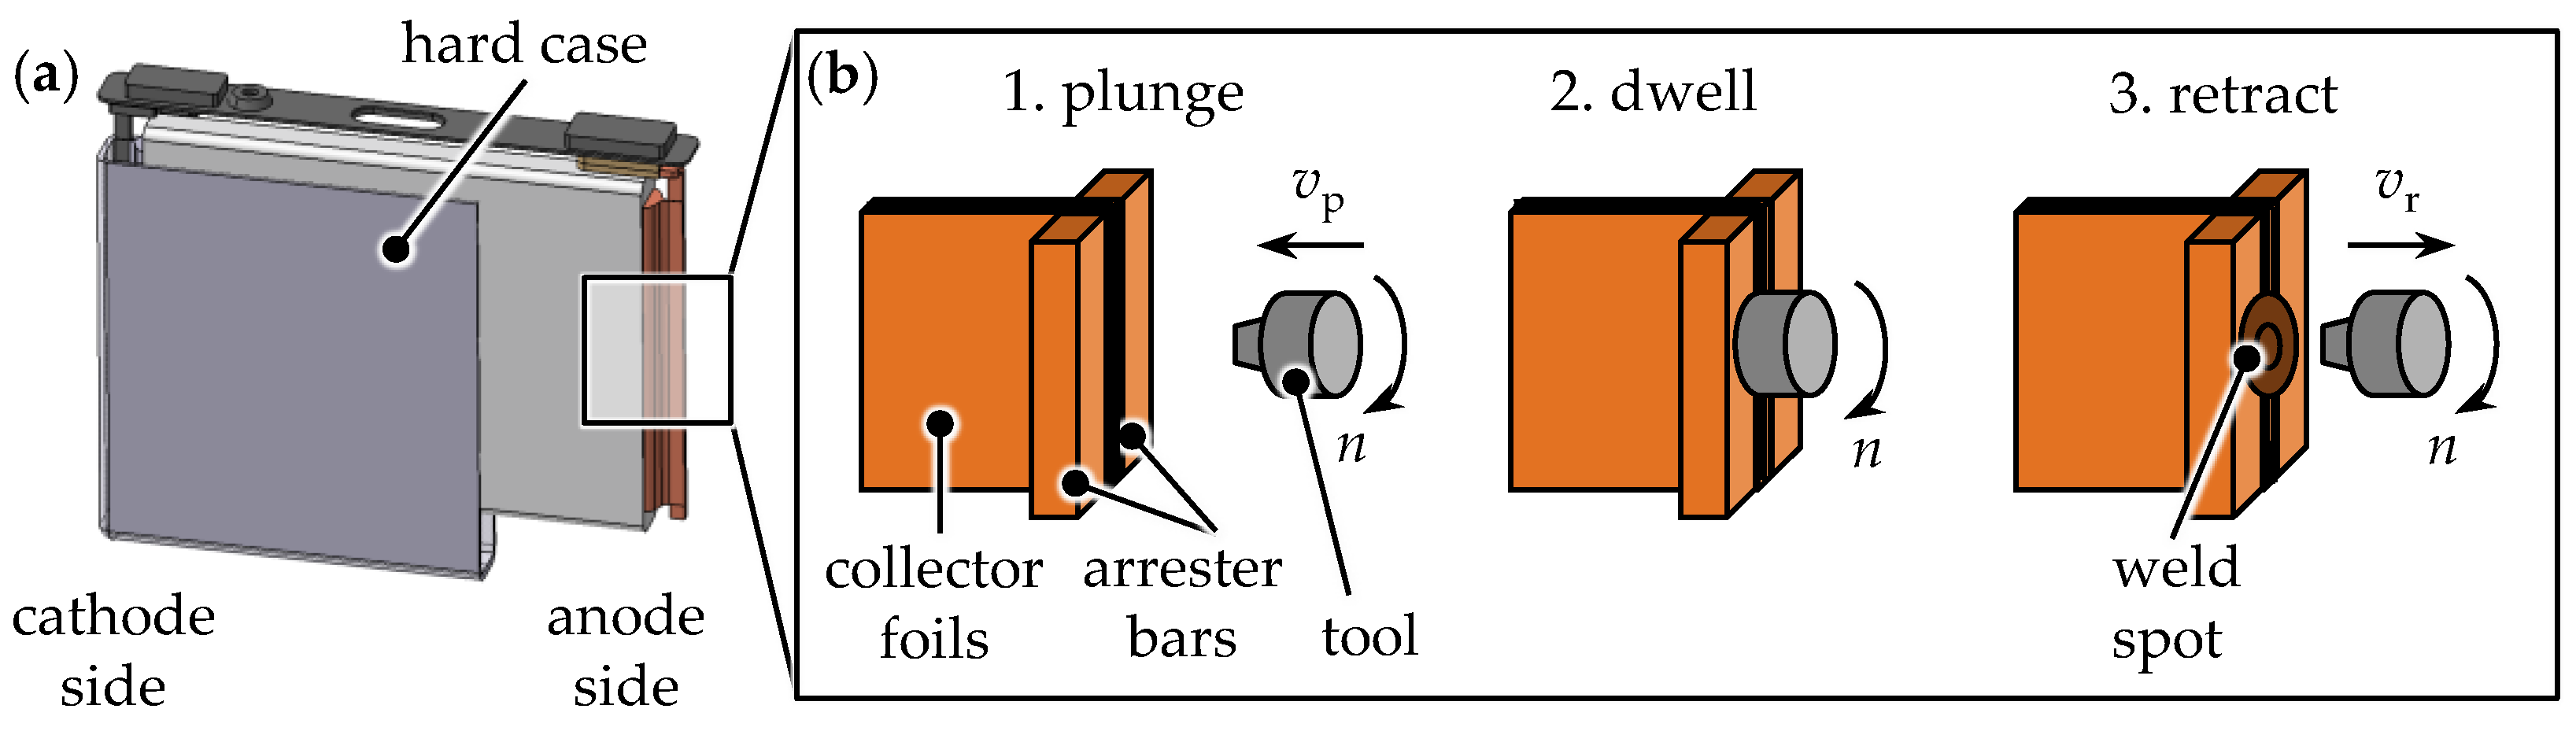
  • Spot welds can be produced in 0.3 s. The welding speed can be improved by increasing the plunge (vp) and the retreat speed (vr) of the tool.
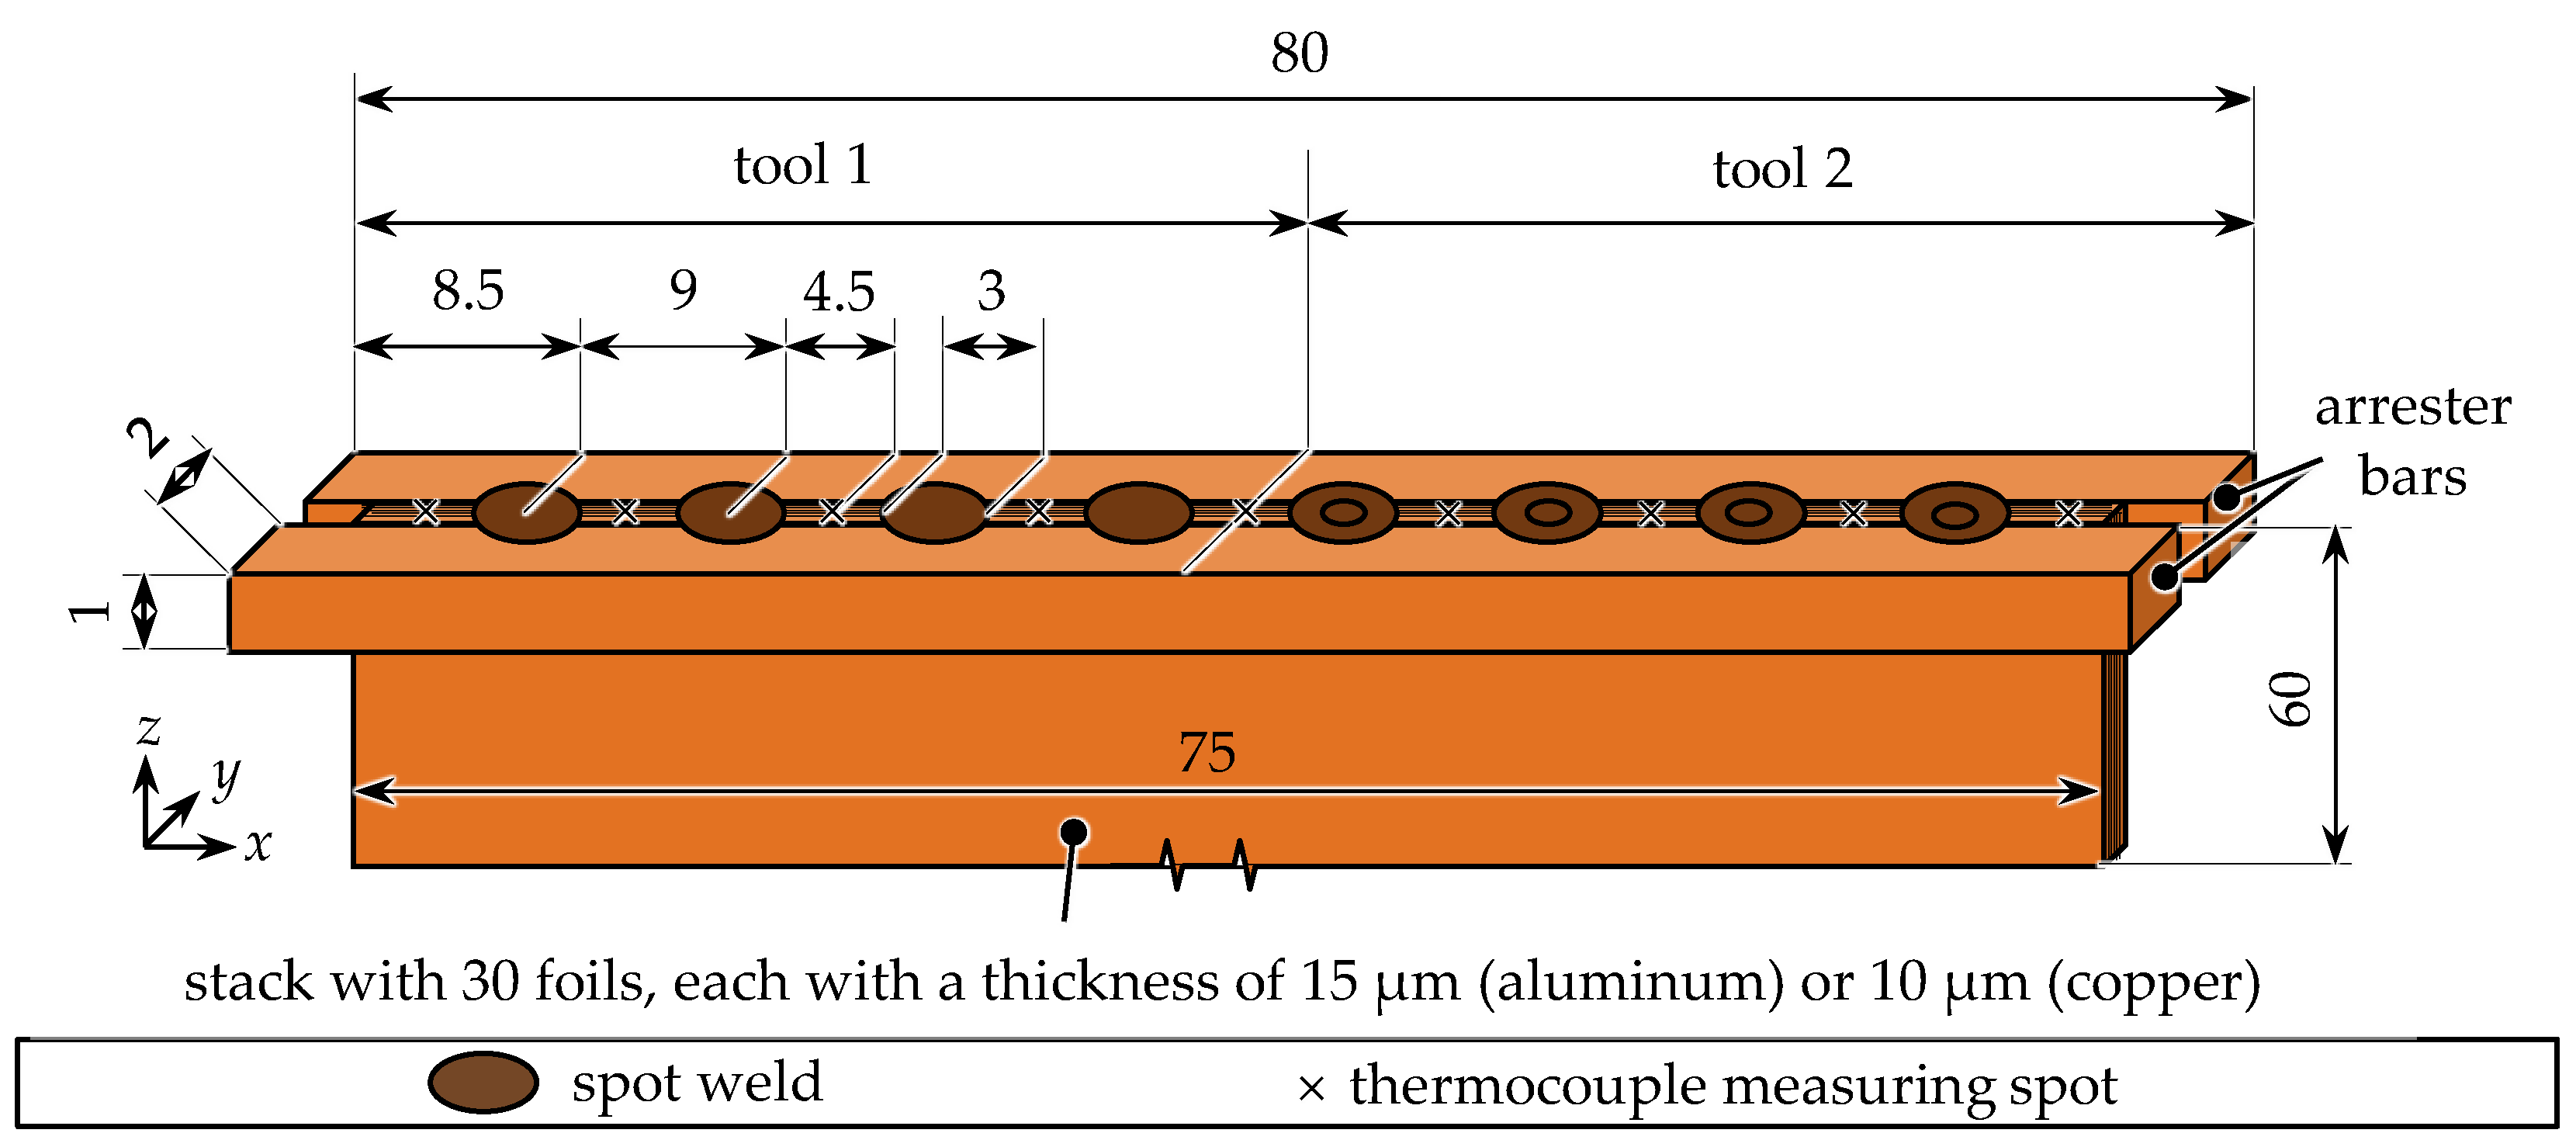
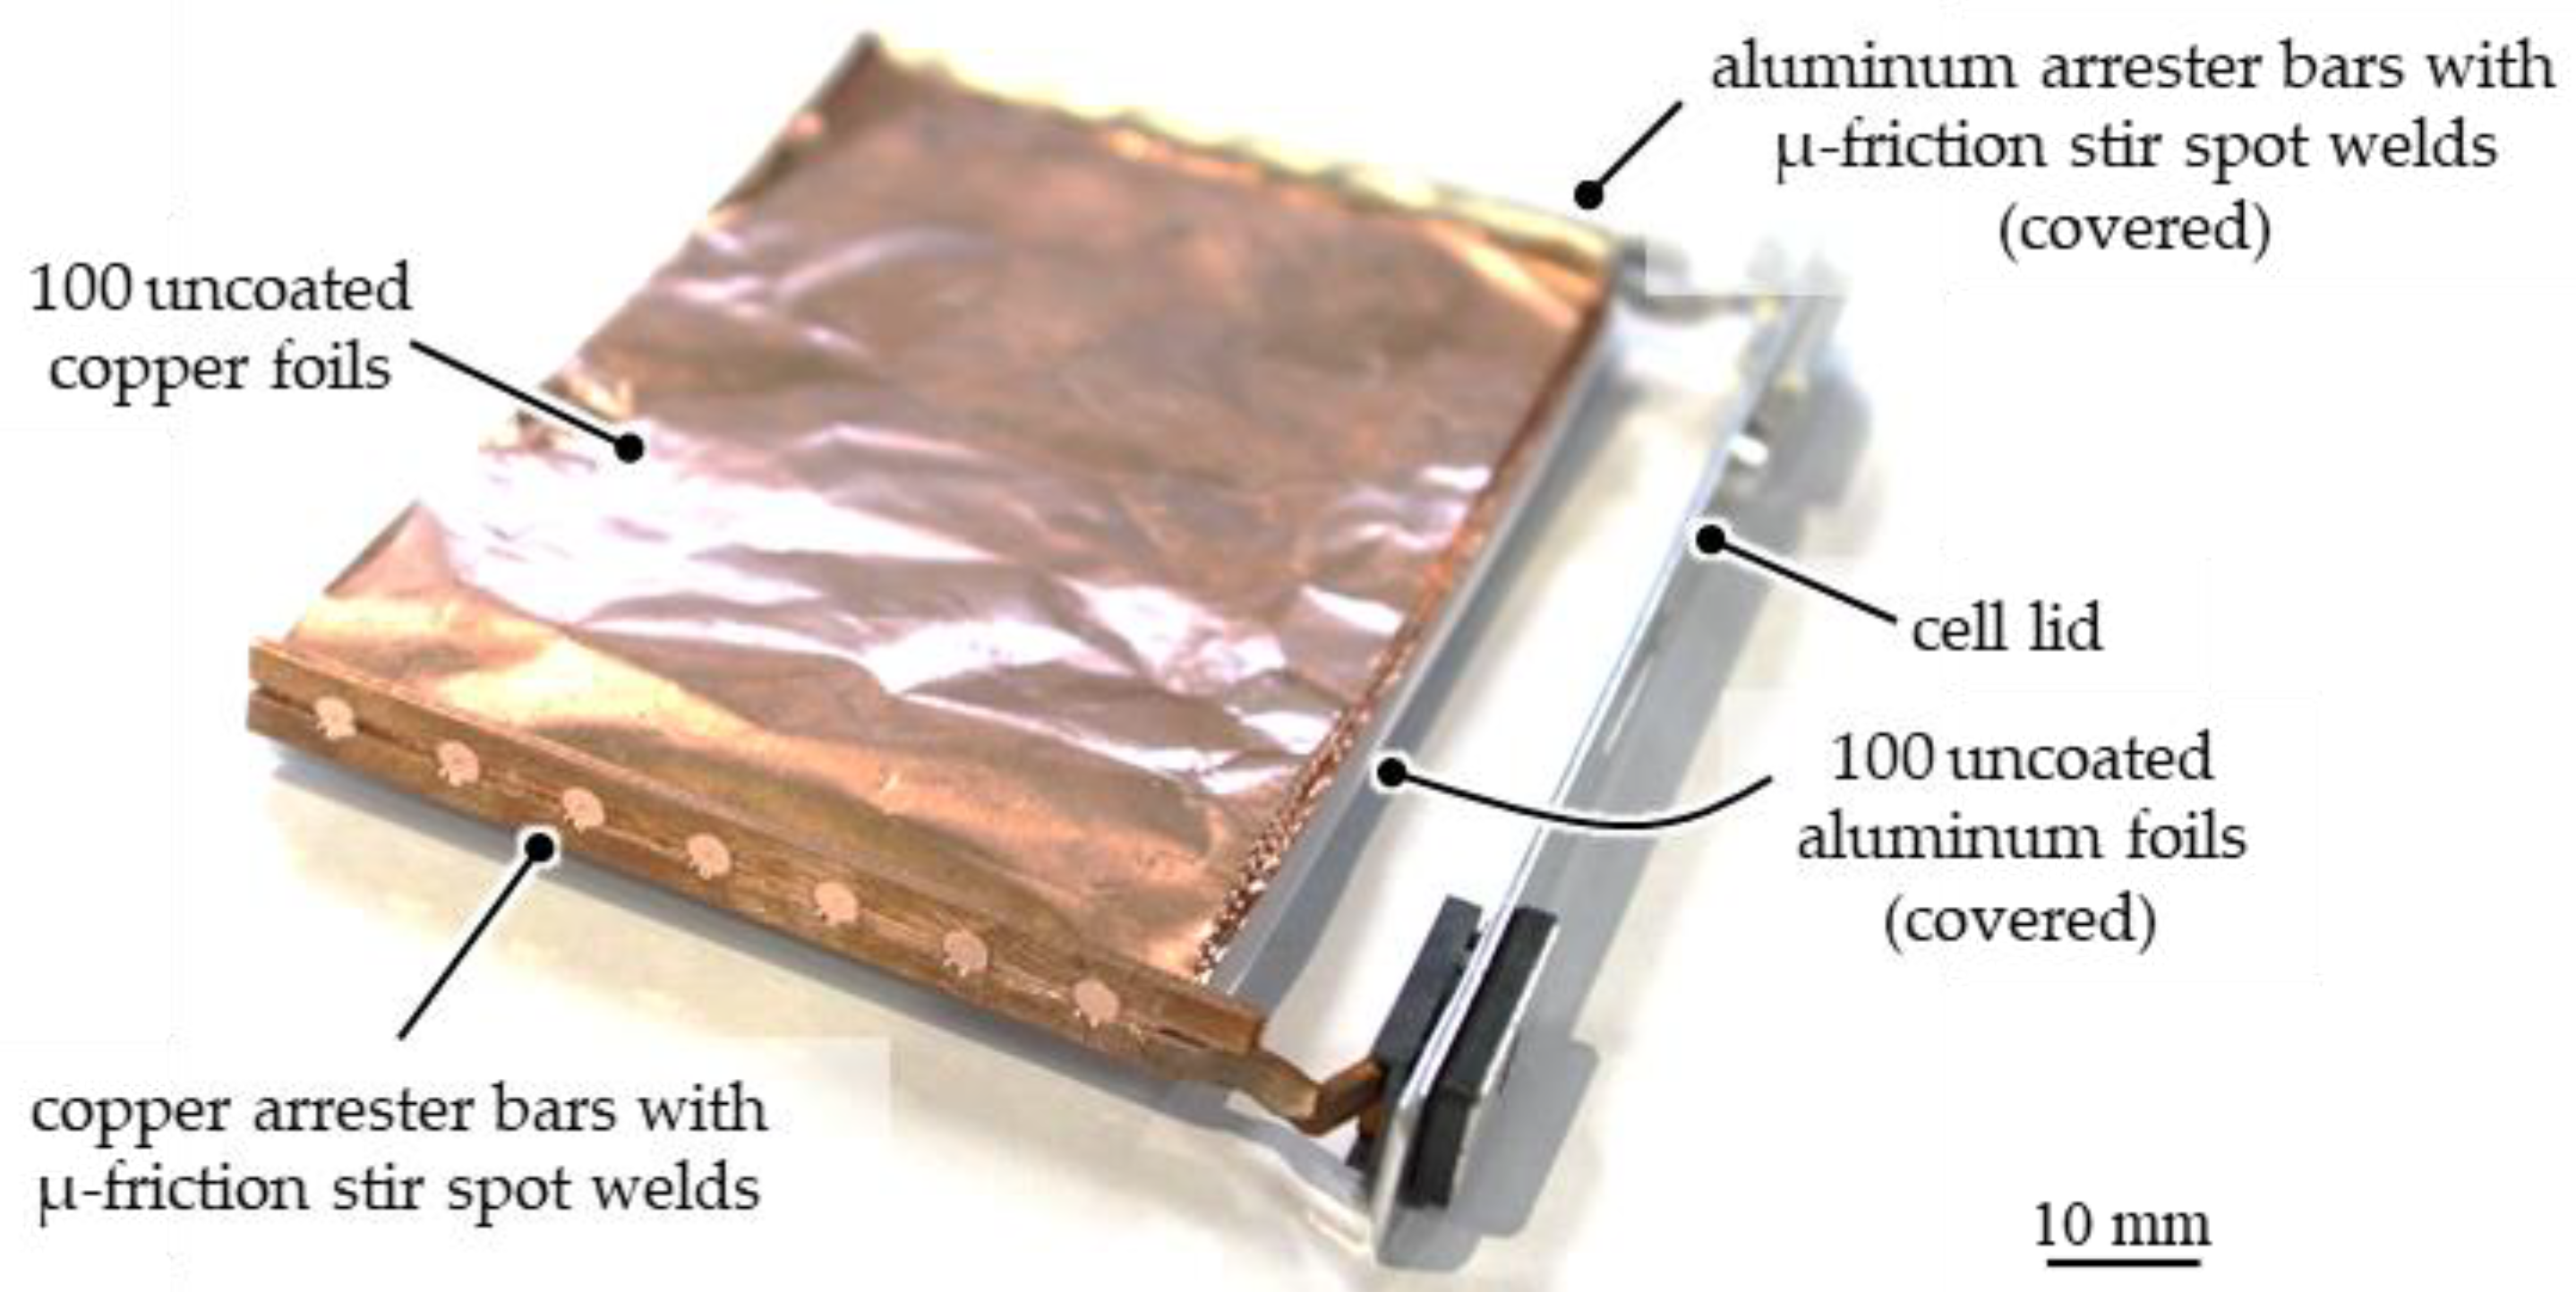
  • In addition, a scaled up prismatic demonstrator, which is comprised of 100 uncoated aluminium and 100 uncoated copper foils, was produced with two arrester bars on each side (Figure 8) to show the potential of the process for the production of large-scale high-energy-dense battery cells.
  • Like USW [2], μFSSW [33] is a solid-state welding process with a low energy consumption and no fumes (in contrast to LBW). The welding times of μFSSW, USW, and LBW are similar, however, with μFSSW, the required welding times are not increased by higher foil stack sizes. Both multi-sheet lap joints and multi-sheet butt joints can be fabricated by LBW and by μFSSW, but not by USW. LBW and μFSSW therefore allow for more flexibility with regard to the cell design. Both processes, however, also require good joint fit-up [2], which means a higher effort for positioning and clamping before welding.
  • The experimental results show that μFSSW has a high potential for cell-internal contacting of prismatic cells. An application for other cell formats like cylindrical cells is regarded feasible by the authors and might be advantageous due to the high uniformity of the spot welds and the high speed of the process.
  • Due to different applied materials and welding geometries, a literature-based comparison between μFSSW, USW, and LBW was not possible for all defined requirements. This will be a topic of future investigations.
  • Future research will also deal with an assertion of the electrochemical performance of lithium-ion cells, which were produced using μFSSW.

Author Contributions

Conceptualization, M.E.S.; methodology, M.E.S.; validation, M.E.S.; formal analysis, M.E.S.; investigation, M.E.S. and L.-F.K.; resources, S.G.; data curation, M.E.S. and L.-F.K.; writing—original draft preparation, M.E.S.; writing—review and editing, M.E.S., S.G., L.-F.K., R.H. and M.F.Z.; visualization, M.E.S.; supervision, M.F.Z., project administration, M.E.S., S.G. and A.Z.; funding acquisition, M.F.Z. All authors have read and agreed to the published version of the manuscript.

Funding

The IGF-research project no. 48 EWN of the ‘Research Association on Welding and Allied Processes of the DVS’ has been funded by the AiF within the framework of the promotion of industrial collective research (IGF) of the Federal Ministry for Economic Affairs and Climate Action because of a decision by the German Bundestag.

Institutional Review Board Statement

Not applicable.

Informed Consent Statement

Not applicable.

Data Availability Statement

Not applicable.

Acknowledgments

We thank the AWM Maschinenbau GmbH for the fabrication of the clamping system and the Hufschmied Zerspanungssysteme GmbH for supplying the welding tools.

Conflicts of Interest

The authors declare that they have no conflict of interest.

Appendix A. Setup for the Welding Experiments

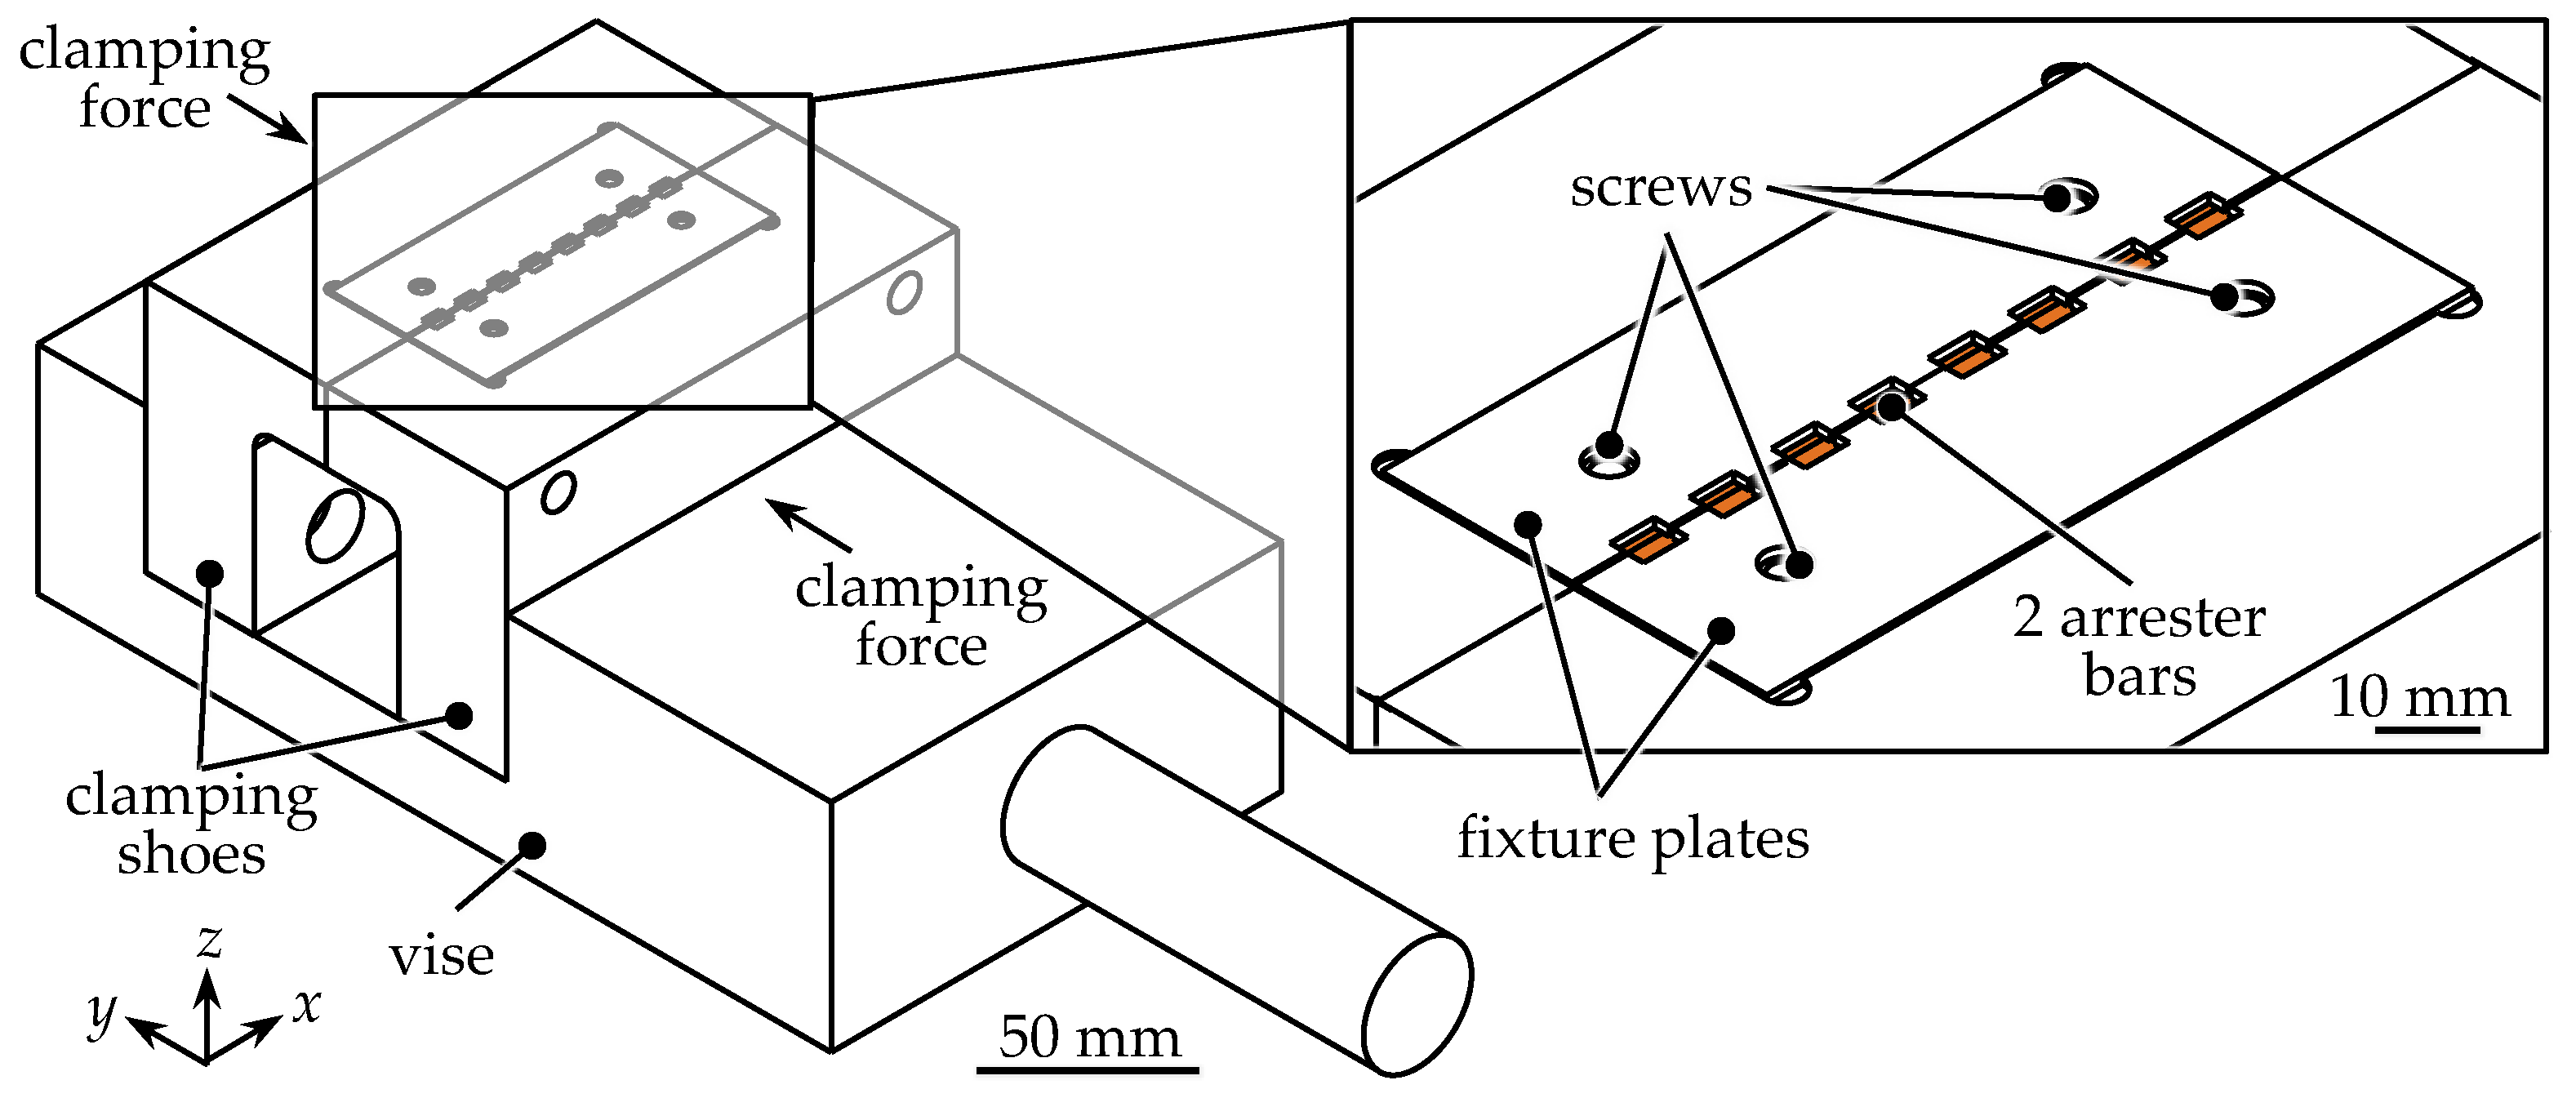
Appendix A.1. Welding Machine, Clamping System and Part Fit-Up

The welding experiments were conducted in position-controlled mode using a four-axis horizontal milling machine (MCH 250, Gebr. Heller Maschinenfabrik GmbH, Nuertingen, Germany), which had been adapted for friction stir welding.
A stainless-steel clamping system (Figure A1) was designed for the welding task, which consisted of two clamping shoes, each with a groove for one arrester bar. The shoes were mounted on a vise for automatic and fast clamping using air pressure. Two additional fixture plates with comb-shaped openings for access of the welding tool were pressed against the bar surfaces and prevented misalignment.
Figure A1. Sketch of the clamping fixture; screws are not displayed.
Batteries 08 00174 g0a1
For fit-up, the arrester bars were first placed inside the grooves. Afterwards, the foil stack was positioned between the shoes, so that the edges of the foils were flush with the arrester bar surfaces. After clamping the foil stack and the two arrester bars, the comb-shaped plates were mounted and fixed with screws.

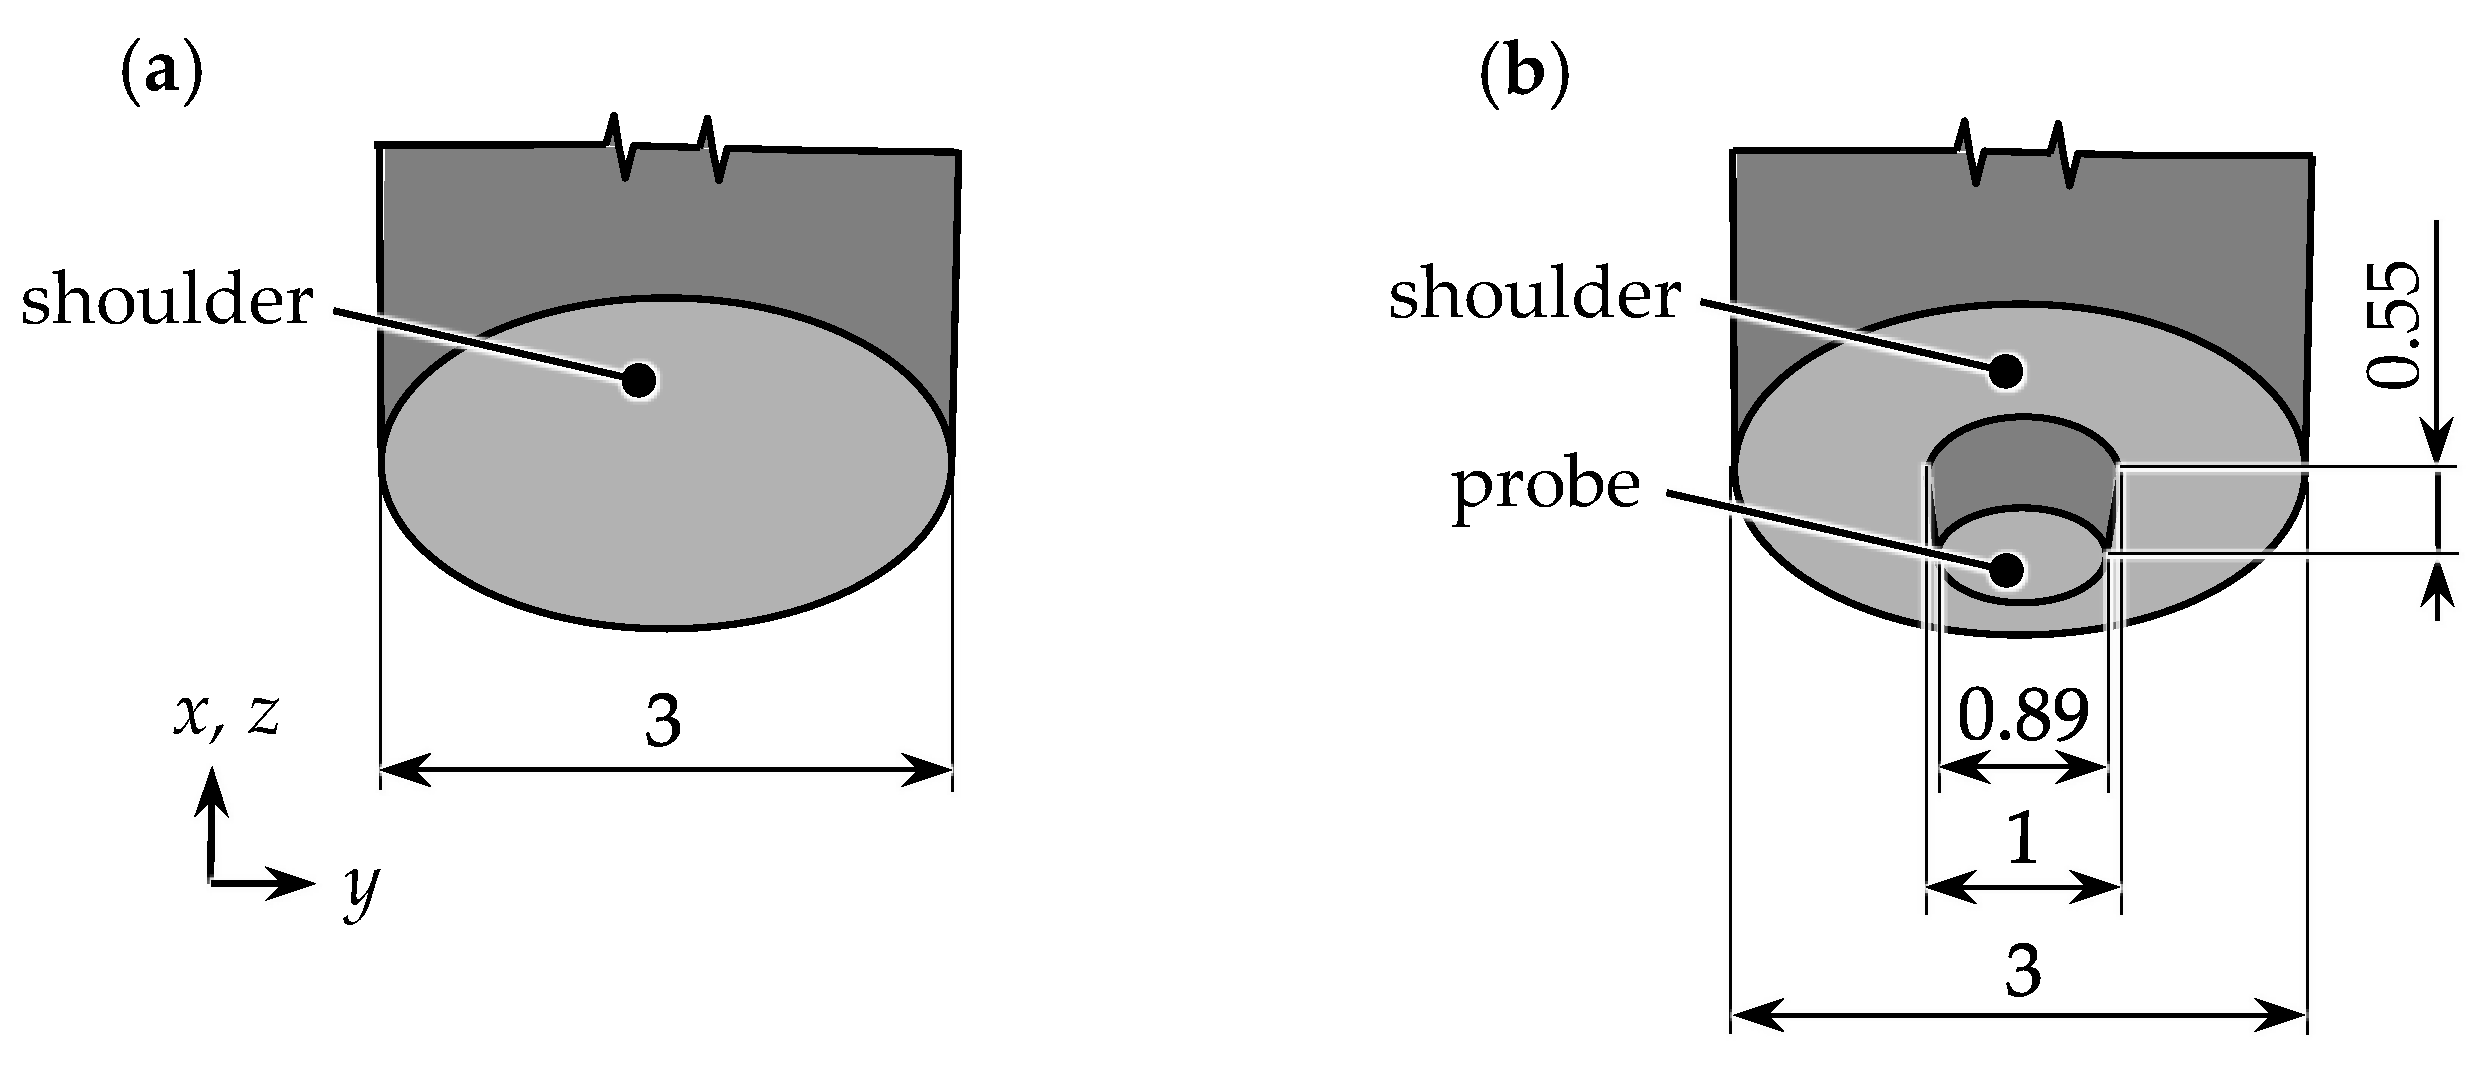
Appendix A.2. Welding Tools and Process Parameters

A sketch of the tools used for experimentation is shown in Figure A2. Two tools were designed: one without a probe (tool 1, displayed in Figure A2a) and one with a probe (tool 2, displayed in Figure A2b). Both tools had a flat and unstructured shoulder with a diameter of 3 mm.
Figure A2. Sketches of the welding tools used for experimentation: (a) tool 1 and (b) tool 2; geometrical values are not to scale and are given in mm if not otherwise indicated.
Batteries 08 00174 g0a2
The process parameters were chosen from preceding studies: a rotational speed n of 4800 r/min, a shoulder plunge depth dp of 0.1 mm, a dwell time td of 0 s, a plunge speed vp of 25 mm/min, and a retract speed vr of 100 mm/min.

Appendix B. Setup for Testing

Appendix B.1. Visual Inspection

Visual inspection was performed following the ISO 18785-5 [34] and the ISO 17637 [35]. The weld as well as the tools were inspected, and the welding process was observed by the machine operator.

Appendix B.2. Topographical Data

The weld topographies were measured using a three-dimensional profilometer (VR-3100, Keyence Corporation, Osaka, Japan) with a 12-fold magnification and a measurement accuracy of 3 μm in the z-direction, as described by Hartl et al. [36]. The arrester bar surface was defined as the reference base (0 mm).

Appendix B.3. Process Variable Data

Process variable data were collected during welding. Using a dynamometer, which was developed together with Hottinger Brüel & Kjaer GmbH (Darmstadt, Germany) and which is described by Krutzlinger et al. [37], the axial force Fz as well as the spindle torque Mz signals were measured inline.

Appendix B.4. Temperature Measurement

The temperatures T were measured using type K thermocouples (443-7973, RS Components GmbH, Frankfurt am Main, Germany) with a measuring tolerance of ±1.5 °C for temperatures up to 375 °C [38]. The tips of the thermocouples were positioned between the spot welds (3 mm from the spot edges, i.e., 4.5 mm from the spot centers, Figure 2). To ensure an accurate measurement, the tips were covered with a thin layer of highly conductive copper paste (Anti-seize Compound, Rocol, Glenview, IL, USA). A measurement chassis with a temperature input module (cDAQ-9178 and NI 9213, National Instruments, Austin, TX, USA) was used to acquire the temperatures with a sampling rate of 1.5 Hz.

Appendix B.5. Electrical Resistance Measurement

The electrical resistances R of the samples were acquired using the four-terminal sensing method. A large distance between the measuring tips and a large surface area are necessary for a high measurement accuracy. This is why not one, but three spots were measured at once. The samples were cut to a length of 24.5 mm. For a large distance between the tips, the electrical resistance was measured from one side of the foil pack to the other side. For this, the foil stack was folded in half (Figure A3a), and the measured foils were insulated from the stack to ensure that the foils were only connected through the spot welds. Due to possible staining of the outer foils from handling the samples, the third foil of each side was used. All measurements were conducted three times.
Figure A3. Sketch of (a) the weld testing sample and (b) the reference sample for electrical testing; geometrical values are not to scale and are given in mm if not otherwise indicated.
Batteries 08 00174 g0a3
The measuring tips were pressed onto the surfaces with a force of 3 N and at a distance of 18 mm. A measuring current I of 10 A and input voltage of 5 V was provided by a power supply unit (HMP4040, Rohde & Schwarz GmbH & Co. KG, Munich, Germany). The electrical resistance R was determined by measuring the output voltage U after 0.3 s using a precision multimeter (8846A, Fluke, Everett, Washington, DC, USA) and calculated applying Ohm’s law [39]:
R = U/I.
Using this setup, the electrical resistances of single unwelded foils (base material) with a sample width of 24.5 mm (Figure A3b) were determined as 1413.67 μΩ ± 0.50 μΩ (Rb, Al) and 1334.52 μΩ ± 0.59 μΩ (Rb, Cu). The electrical resistance R generally depends on the specific electrical resistance of the material ρ (inverse of the conductivity), the conductor’s cross-section A and the conductor’s length l.
The relationship can be described by applying Pouillet’s law:
R = ρl/A.
For the single unwelded foils, the specific electrical resistances were calculated as 28.86 × 10⁻³ Ω mm²/m (ρb, Al) and 18.16 × 10⁻³ Ω mm²/m (ρb, Cu).

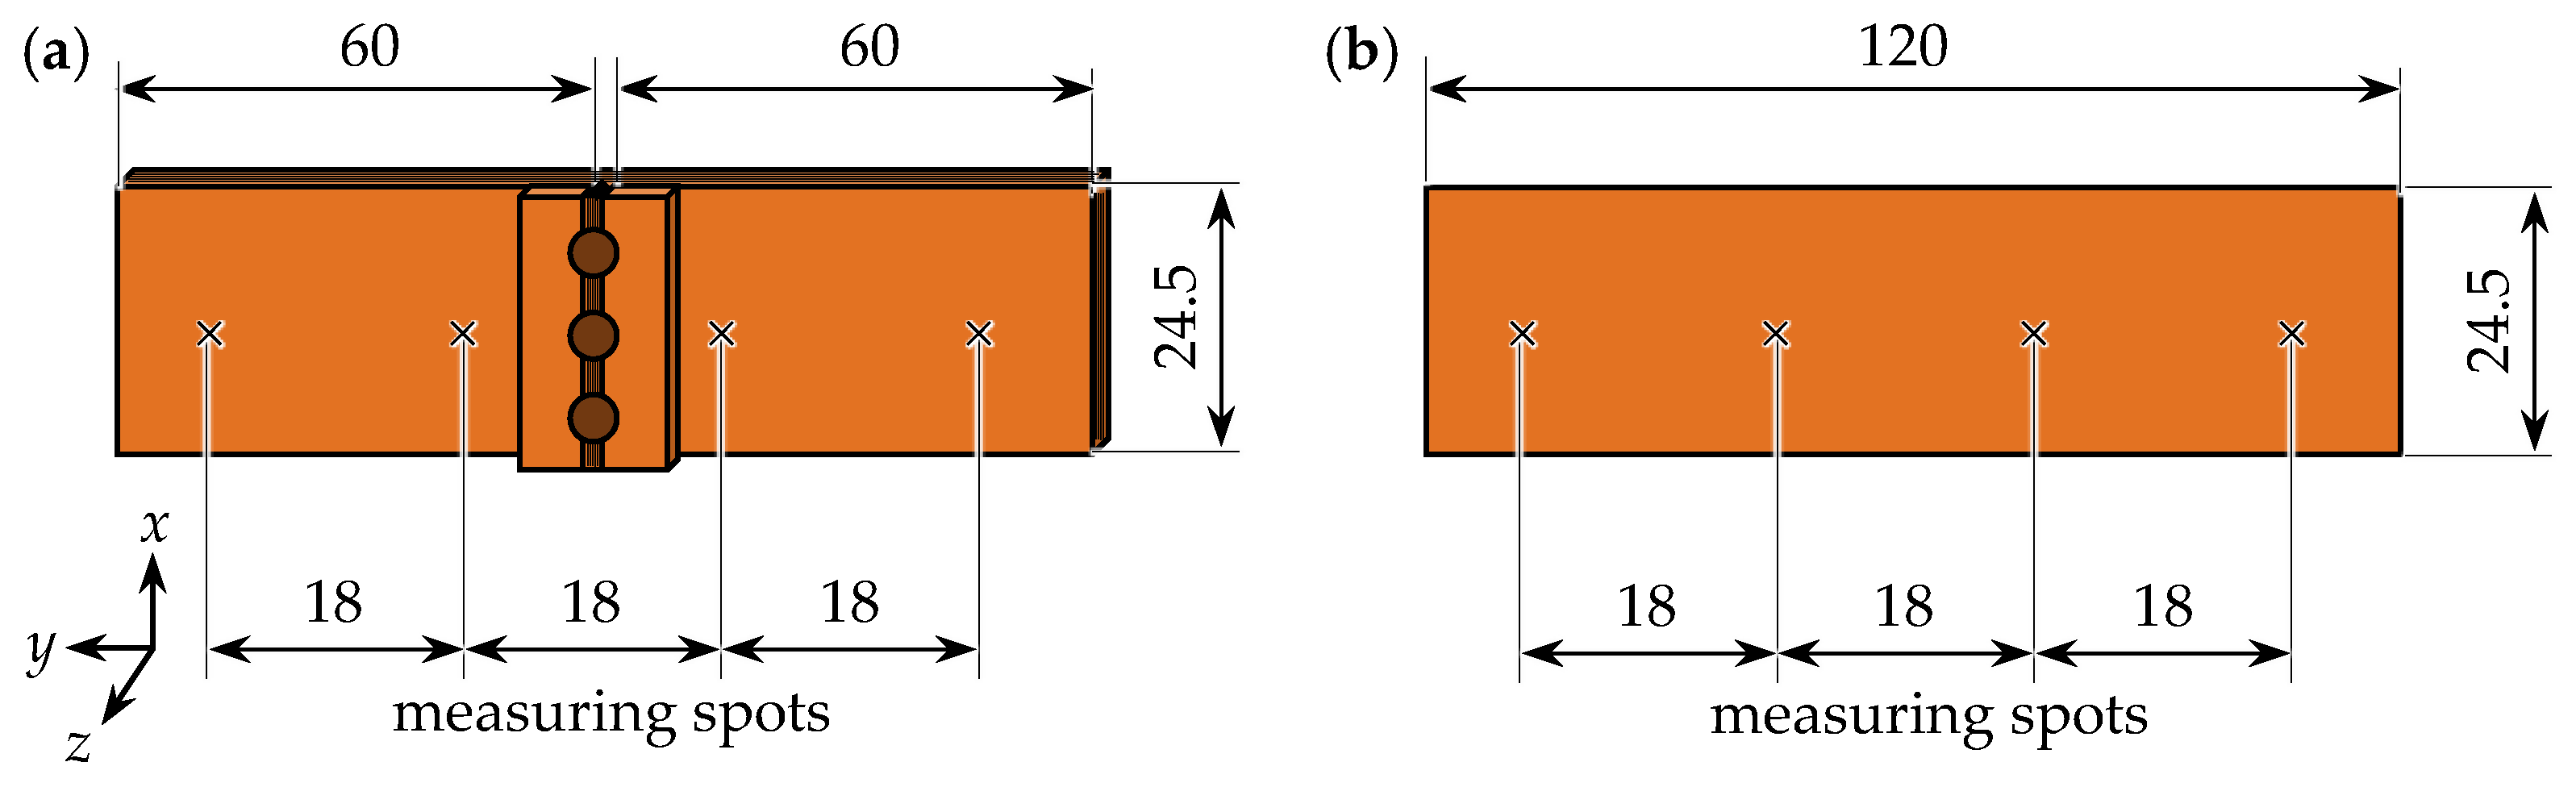
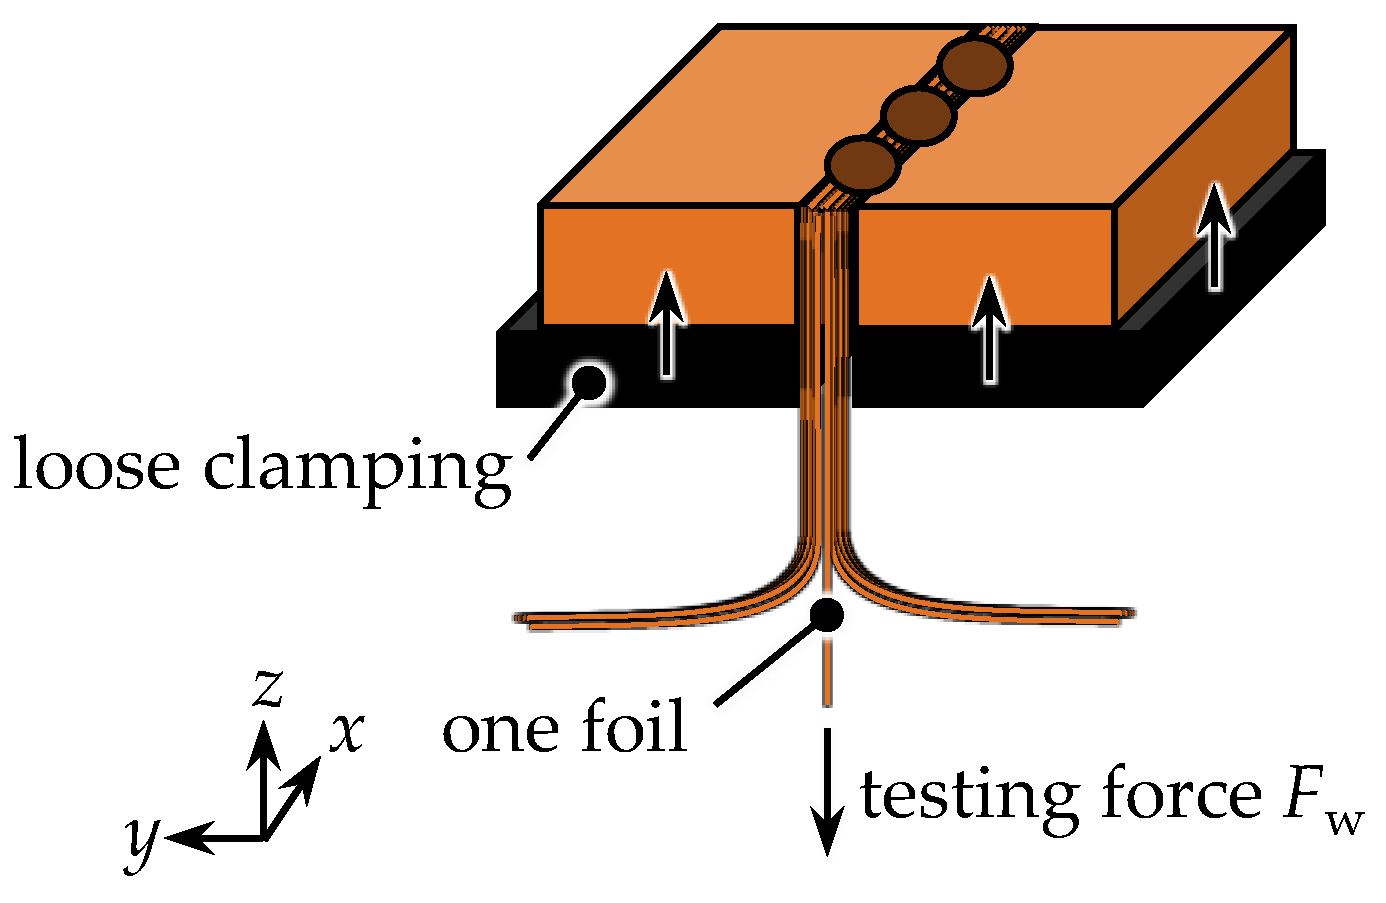
Appendix B.6. Tensile Strength Measurement

To determine the mechanical strength of the seams, tensile testing was performed on the samples from electrical testing, using a material testing machine (Z050, ZwickRoell GmbH & Co. KG, Ulm, Germany) with a 1 kN load cell (Xforce HP, ZwickRoell GmbH & Co. KG, Ulm, Germany). Due to the shape of the weld geometries, no standard tensile testing could be performed. Instead, the arrester bars were loosely fixed, so that they did not compress the foil stack during testing (Figure A4). Single foils (the 7th, the 15th, and the 23rd foil) were tested one by one to determine the bonding quality. A testing speed of 50 mm/min was applied.
Figure A4. Sketch of the weld testing sample for mechanical testing; geometrical values are not to scale and are given in mm if not otherwise indicated.
Batteries 08 00174 g0a4

Appendix B.7. Welding Time Calculation

The welding time tweld was calculated from the process parameters plunge speed vp, retreat speed vr, plunge depth dp, and dwell time td:
tweld = dp/vp + td + dp/vr.
It should be noted that the welding time tweld does not include the time for part fit-up, clamping, and unclamping, since no comparable data for these steps were found in literature for USW and LBW.

Appendix C. Experimental Data

Table A1. Data of the welding experiments and samples.
Tool No.Spot No.MaterialMax. Flash Height h ^
in mm
Electrical Resistances Rw
in μΩ
Max. Tensile Forces Fw 1
in N
Fracture
Locations 1
Max. Temperature T ^
in °C
Max. Axial Force F ^ z
in N
Max. Spindle Torque M ^ z
in Nm
11aluminium0.1733.32352.320.43
2
3
4
0.36
0.28
0.39
1599.28
± 13.82
29.71, 33.32, 33.33 o, o, o 34.37
22.22
37.66
261.29
309.40
333.54
0.42
0.40
0.49
21aluminium0.3752.08455.400.68
2
3
4
1.53
1.50
2.03
1577.78
± 12.38
29.80, 32.58, 31.09 o, w, o 67.70
68.17
60.11
355.47
362.32
323.43
0.73
0.63
0.70
11
2
3
copper0.19
0.12
0.11
1690.57
± 2.96
14.87, 18.89, 14.83 w, w, w 42.52
58.13
54.78
1434.16
1528.92
1471.24
0.93
1.08
1.02
40.1142.091490.441.03
21
2
3
copper0.08
0.05
0.06
1627.53
± 0.45
30.40, 40.46, 29.13 w, w, w 58.77
61.89
65.47
2354.08
2380.80
2328.61
0.87
0.82
0.89
40.0547.952403.320.79
1 foils 7, 15 and 23; o: outside the contacting area; w: within the contacting area.

References

  1. Thielmann, A.; Sauer, A.; Wietschel, M. Gesamt-Roadmap Lithium-Ionen-Batterien 2030 (Translated Title: “Complete Roadmap Lithium-Ion Batteries 2030”); Fraunhofer-Institut für System- und Innovationsforschung ISI: Karlsruhe, Germany, 2015. [Google Scholar]
  2. Das, A.; Li, D.; Williams, D.; Greenwood, D. Joining Technologies for Automotive Battery Systems Manufacturing. World Electr. Veh. J. 2018, 9, 22. [Google Scholar] [CrossRef] [Green Version]
  3. Korthauer, R. (Ed.) Lithium-Ion Batteries: Basics and Applications; Springer: Berlin/Heidelberg, Germany, 2019; ISBN 978-3-662530-71-9. [Google Scholar]
  4. Kleiner, J.; Komsiyska, L.; Elger, G.; Endisch, C. Thermal Modelling of a Prismatic Lithium-Ion Cell in a Battery Electric Vehicle Environment: Influences of the Experimental Validation Setup. Energies 2020, 13, 62. [Google Scholar] [CrossRef] [Green Version]
  5. Schedewy, R.; Beyer, E.; Brenner, B.; Standfuss, J. Prospects of welding foils with solid state laser for lithium-ion batteries. In International Congress on Applications of Lasers & Electro-Optics, Proceedings of the 30th International Congress on Laser Materials Processing, Laser Microprocessing and Nanomanufacturing (ICALEO), Orlando, FL, USA, 23–27 October 2011; Laser Institute of America: Orlando, FL, USA, 2011. [Google Scholar]
  6. Keppeler, M.; Roessler, S.; Braunwarth, W. Production Research as Key Factor for Successful Establishment of Battery Production on the Example of Large-Scale Automotive Cells Containing Nickel-Rich LiNi 0.8 Mn 0.1 Co 0.1 O 2 Electrodes. Energy Technol. 2020, 8, 2000183. [Google Scholar] [CrossRef]
  7. Duffner, F.; Mauler, L.; Wentker, M.; Leker, J.; Winter, M. Large-scale automotive battery cell manufacturing: Analyzing strategic and operational effects on manufacturing costs. Int. J. Prod. Econ. 2021, 232, 107982. [Google Scholar] [CrossRef]
  8. Grabmann, S.; Kriegler, J.; Harst, F.; Günter, F.J.; Zaeh, M.F. Laser welding of current collector foil stacks in battery production–mechanical properties of joints welded with a green high-power disk laser. Int. J. Adv. Manuf. Technol. 2022, 118, 2571–2586. [Google Scholar] [CrossRef]
  9. Lee, S.S.; Kim, T.H.; Hu, S.J.; Cai, W.W.; Abell, J.A. Joining Technologies for Automotive Lithium-Ion Battery Manufacturing: A Review. In Proceedings of the International Manufacturing Science and Engineering Conference (ASME), Erie, PA, USA, 12–15 October 2010. [Google Scholar]
  10. Balz, I.; Rosenthal, E.; Reimer, A.; Turiaux, M.; Schiebahn, A.; Reisgen, U. Analysis of the thermo-mechanical mechanism during ultrasonic welding of battery tabs using high-speed image capturing. Weld World 2019, 63, 1573–1582. [Google Scholar] [CrossRef]
  11. Knoche, T.; Reinhart, G. Electrolyte Filling of Large-Scale Lithium-Ion Batteries: Challenges for Production Technology and Possible Approaches. Appl. Mech. Mater. 2015, 794, 11–18. [Google Scholar] [CrossRef]
  12. Kwade, A.; Haselrieder, W.; Leithoff, R.; Modlinger, A.; Dietrich, F.; Droeder, K. Current status and challenges for automotive battery production technologies. Nat. Energy 2018, 3, 290–300. [Google Scholar] [CrossRef]
  13. Grabmann, S.; Kick, M.K.; Geiger, C.; Harst, F.; Zaeh, M.F. Toward the Flexible Production of Large-Format Lithium-Ion Batteries Using Laser-Based Cell-Internal Contacting. Procedia CIRP, 2022; in press. [Google Scholar]
  14. ISO 18785-1; Friction Stir Spot Welding—Aluminium—Part 1: Vocabulary. Beuth: Berlin, Germany, 2018.
  15. Lohwasser, D.; Chen, Z. Introduction. In Friction Stir Welding: From Basics to Applications; Lohwasser, D., Chen, Z., Eds.; CRC Press LLC: Oxford, UK, 2010; pp. 1–12. ISBN 978-1-845697-71-6. [Google Scholar]
  16. Kallee, S.W. Industrial applications of friction stir welding. In Friction Stir Welding: From Basics to Applications; Lohwasser, D., Chen, Z., Eds.; CRC Press LLC: Oxford, UK, 2010; pp. 118–163. ISBN 978-1-845697-71-6. [Google Scholar]
  17. Sen, M.; Shankar, S.; Chattopadhyaya, S. Micro-friction stir welding (μFSW)—A review. Mater. Today Proc. 2020, 27, 2469–2473. [Google Scholar] [CrossRef]
  18. Hartl, R.; Bachmann, A.; Habedank, J.B.; Semm, T.; Zaeh, M.F. Process Monitoring in Friction Stir Welding Using Convolutional Neural Networks. Metals 2021, 11, 535. [Google Scholar] [CrossRef]
  19. Tchouaha Tankoua, A.; Köhler, T.; Bergmann, J.P.; Grätzel, M.; Betz, P.; Lindenau, D. Tool Downscaling Effects on the Friction Stir Spot Welding Process and Properties of Current-Carrying Welded Aluminum–Copper Joints for E-Mobility Applications. Metals 2021, 11, 1949. [Google Scholar] [CrossRef]
  20. Sigl, M.E.; Bachmann, A.; Mair, T.; Zaeh, M.F. Torque-Based Temperature Control in Friction Stir Welding by Using a Digital Twin. Metals 2020, 10, 914. [Google Scholar] [CrossRef]
  21. Gera, D.; Fu, B.; Suhuddin, U.F.H.R.; Plaine, A.; Alcantara, N.; dos Santos, J.F.; Klusemann, B. Microstructure, mechanical and functional properties of refill friction stir spot welds on multilayered aluminum foils for battery application. J. Mater. Res. Technol. 2021, 13, 2272–2286. [Google Scholar] [CrossRef]
  22. Grabmann, S.; Tomcic, L.; Zaeh, M.F. Laser beam welding of copper foil stacks using a green high power disk laser. Procedia CIRP 2020, 94, 582–586. [Google Scholar] [CrossRef]
  23. Sun, Y.; Yuan, Y.; Lu, L.; Han, X.; Kong, X.; Wang, H.; Ouyang, M.; Gao, P.; Zheng, H.; Wang, K. A comprehensive research on internal short circuits caused by copper particle contaminants on cathode in lithium-ion batteries. eTransportation 2022, 13, 100183. [Google Scholar] [CrossRef]
  24. Lundgren, H.; Svens, P.; Ekström, H.; Tengstedt, C.; Lindström, J.; Behm, M.; Lindbergh, G. Thermal Management of Large-Format Prismatic Lithium-Ion Battery in PHEV Application. J. Electrochem. Soc. 2016, 163, A309–A317. [Google Scholar] [CrossRef]
  25. Korff AG. Technisches Datenblatt zu Reinaluminiumfolie (Translated Title: "Technical Datasheet for Pure Aluminum Foil"); Korff AG: Oberbipp, Switzerland, 2021. [Google Scholar]
  26. DIN EN 13599; Copper and Copper Alloys-Copper Plate, Sheet and Strip for Electrical Purposes. Beuth: Berlin, Germany, 2014.
  27. Schiefer, H.; Schiefer, F. Statistics for Engineers; Springer Fachmedien: Wiesbaden, Germany, 2021; ISBN 978-3-658-32396-7. [Google Scholar]
  28. Celgard, LLC. High Performance Battery Separators: Technical Datasheet; Celgard, LLC: Charlotte, NC, USA, 2009. [Google Scholar]
  29. Shin, S.; Nam, S.; Yu, J.; Park, J.; Kim, D. Ultrasonic Metal Welding of Multilayered Copper Foils to Nickel-Plated Copper Sheet in Lithium-Ion Battery Cell. Metals 2021, 11, 1195. [Google Scholar] [CrossRef]
  30. Hufschmied Zerspanungssysteme GmbH. Special Tools for Machining Aluminum: Product Catalog; Hufschmied Zerspanungssysteme GmbH: Bobingen, Germany, 2022. [Google Scholar]
  31. Schlenk Metal Foils GmbH & Co. KG. Cu-PHC: Technical Datasheet; Schlenk Metal Foils GmbH & Co. KG: Roth-Barnsdorf, Germany, 2019. [Google Scholar]
  32. Sigl, M.E.; Grabmann, S.; Zens, A.; Hartl, R.; Zaeh, M.F. Friction Stir Welding of Carrier Foils and Arresters for Prismatic Battery Cells. In Proceedings of the DVS Congress, Koblenz, Germany, 19–21 September 2022. [Google Scholar]
  33. Akinlabi, E.T.; Akinlabi, S.A. Friction Stir Welding Process: A Green Technology. Int. J. Mech. Mechatron. Eng. 2012, 6, 2514–2516. [Google Scholar] [CrossRef]
  34. ISO 18785-5; Friction Stir Spot Welding—Aluminium—Part 5: Quality and Inspection Requirements. Beuth: Berlin, Germany, 2018.
  35. ISO 17637; Non-Destructive Testing of Welds–Visual Testing of Fusion-Welded Joints. Beuth: Berlin, Germany, 2016.
  36. Hartl, R.; Bachmann, A.; Liebl, S.; Zens, A.; Zaeh, M.F. Automated surface inspection of friction stir welds by means of structured light projection. IOP Conf. Ser. Mater. Sci. Eng. 2019, 480, 012035. [Google Scholar] [CrossRef]
  37. Krutzlinger, M.; Bachmann, A.; Wirth, F.X.; Roth, A.; Sünger, S.; Pieczona, S.J.; Zah, M.F. Implementierung einer Messsensorik in ein Fräsbearbeitungszentrum zur Ermittlung der Prozesskräfte und des Prozessmoments beim Rührreibschweißen (Translated title: “Implementation of a measuring system in a milling machining center to determine the process forces and the process torque during friction stir welding”). In Proceedings of the DVS Congress, Duesseldorf, Germany, 15–17 September 2015. [Google Scholar]
  38. DIN EN 60584-1; Thermocouples–Part 1: EMF Specifications and Tolerances. Beuth: Berlin, Germany, 2014.
  39. Grabmann, S.; Mayr, L.; Kick, M.K.; Zaeh, M.F. Enhancing laser-based contacting of aluminum current collector foils for the production of lithium-ion batteries using a nanosecond pulsed fiber laser. Procedia CIRP 2022, 111, 778–783. [Google Scholar] [CrossRef]
Figure 2. Sketch of the weld sample with the dimensions showing eight spot welds; geometrical values are not to scale and are given in mm if not otherwise indicated. More information on the thermocouple measuring method can be found in Appendix B.4.
Batteries 08 00174 g002
Figure 3. Top view on the weld surfaces and the topographies (a,b) produced with tool 1 and (c,d) with tool 2 (a,c) for aluminium and (b,d) for copper.
Batteries 08 00174 g003
Figure 4. (a) Max. flash heights h ^ f, (b) max. axial forces F ^ z (separate vertical axes for aluminium and copper), and (c) max. spindle torques M ^ z for the spot welding experiments with their AM and SD.
Batteries 08 00174 g004
Figure 5. (a) Max. temperature T ^ and (b) temperature timeline T, measured at a distance of 4.5 mm to the spot centers with their AM and SD.
Batteries 08 00174 g005
Figure 6. (a) Electrical resistances Rw with their AM and SD for a measurement length of 18 mm and (b) schematic sketch of a cross-section through a spot weld showing the electrical current flow (in blue) through the weld area.
Batteries 08 00174 g006
Figure 7. (a) Maximum tensile forces Fw for the tested foils 7, 15 and 23 with their AM and SD; examples of foil samples after testing showing the fracture patterns: (b) aluminium with fracture outside the contacting area (tool 1) and (c) copper with fracture next to the spot welds (tool 2).
Batteries 08 00174 g007
Figure 8. Photograph of a demonstrator with 100 copper and 100 aluminium foils, which were contacted using μFSSW.
Batteries 08 00174 g008
Table 1. Materials and geometries for the welding experiments.
ElectrodePartMaterialSize in mm³QuantitySupplier
cathodearrester barsEN AW-1050A 180 × 2 × 12Korff AG 4
carrier foilsEN AW-1050A 175 × 0.015 × 6030Korff AG 4
anodearrester barsCu-ETP 280 × 2 × 12KME Mansfeld GmbH 5
carrier foilsCu-PHC 375 × 0.010 × 6030Schlenk AG 6
1 Degree of purity: 99.5% [25]; 2 Degree of purity: 99.9% [26]; 3 Degree of purity: 99.95% [26]. 4 Oberbipp, Switzerland; 5 Hettstadt, Germany; 6 Roth, Germany.
Table 2. Applied methods for testing (description in Appendix B) and evaluating the process with defined evaluation criteria and reference to the requirements R1–R8.
Testing and Evaluation Methods with Descriptions in Appendix BEvaluation Criteria
R1visual inspection of the weld (Appendix B.1)no welding defects
R2visual inspection during the welding process (Appendix B.1)no detached particles
R3statistical analysis of the data of four identical spot welding experiments: topography (Appendix B.2) and process variables (Appendix B.3)no trend, low standard deviations (SD) and low coefficients of variation (CV) 1
R4visual inspection of the workpiece (Appendix B.2)no loose and/or no ripped foils
R5measurement of the maximum temperatures T ^ surrounding the
weld area (Appendix B.4)
T ^ < 90 °C 2
R6measurement of the electrical resistances of the weld samples
Rw, Al and Rw, Cu (Appendix B.5)
low electrical resistances
Rw, Al and Rw, Cu 3
R7mechanical testing of single welded foils: measurement of maximum tensile forces Fw, Al and Fw, Cu (Appendix B.6)high maximum tensile forces
Fw, Al and Fw, Cu 3
R8welding times tweld per spot welding experiment (Appendix B.7)tweld < 0.3 s (USW) or 1 s (LBW) 4
1 ratio of the arithmetic mean (AM) and the SD to compare the dispersion of different measures [27] (p. 31); 2 shrinkage temperature of a common polypropylene separator [28]; 3 no comparable data found in literature for USW or LBW; 4 lowest welding times found in literature: 0.3 s (USW of 40 copper foils with an arrester tab [29]) or 1 s for a 20 mm long aluminium line weld (LBW of 30 aluminium foils with one arrester tab [8]); Al: aluminium; Cu: copper.
Publisher’s Note: MDPI stays neutral with regard to jurisdictional claims in published maps and institutional affiliations.

