Article

State-of-Health Prediction of Lithium-Ion Batteries Based on CNN-BiLSTM-AM

1
School of Electrical and Control Engineering, North University of China, Taiyuan 030051, China
2
School of Data Science and Technology, North University of China, Taiyuan 030051, China
*
Author to whom correspondence should be addressed.
Batteries 2022, 8(10), 155; https://doi.org/10.3390/batteries8100155
Submission received: 15 August 2022 / Revised: 12 September 2022 / Accepted: 29 September 2022 / Published: 3 October 2022

Abstract

:
State-of-Health (SOH) prediction of lithium-ion batteries is crucial in battery management systems. In order to guarantee the safe operation of lithium-ion batteries, a hybrid model based on convolutional neural network (CNN)-bidirectional long short-term memory (BiLSTM) and attention mechanism (AM) is developed to predict the SOH of lithium-ion batteries. By analyzing the charging and discharging process of batteries, the indirect health indicator (HI), which is highly correlated with capacity, is extracted in this paper. HI is taken as the input of CNN, and the convolution and pooling operations of CNN layers are used to extract the features of battery time series data. On this basis, a BiLSTM depth model is built in this paper to collect the data coming from CNN forward and reverse dependencies and further emphasize the correlation between the serial data by AM to obtain an accurate SOH estimate. Experimental results based on NASA PCoE lithium-ion battery data demonstrate that the proposed hybrid model outperforms other single models, with the root mean square error (RMSE) of SOH prediction results all less than 0.01, and can accurately predict the SOH of lithium-ion batteries.

Graphical Abstract

1. Introduction

The lithium-ion battery industry is an essential precursor to the world’s advanced technology development [1]. With the characteristics of higher energy density, higher power density, higher conversion rate, longer cycle time, and less pollution, lithium-ion batteries are extensively applied in electric vehicles and various energy storage systems [2]. Lithium-ion batteries are now being applied more widely in mobile communications, transportation, electrical energy storage, new energy resources in storage, and aerospace [3]. Considering the widespread application of lithium-ion batteries, the secure operation of lithium-ion batteries must be given paramount importance, and the state of health (SOH) is the most critical parameter for evaluating the current state and performance of lithium-ion batteries [4]. Consequently, optimizing the design and management of lithium-ion batteries and accurately predicting the SOH of lithium-ion batteries is essential to assessing degradation and aging mechanisms.
The methods for predicting lithium-ion batteries can be classified into three groups: model-based methods [5,6,7,8,9,10], data-driven methods [11,12,13], and hybrid methods [14,15]. Model-based methods require extensive knowledge in the field of physical chemistry, understanding the reaction mechanisms internal to the battery, accurately describing the mathematical equations for the internal reactions, and building efficient simulation models, which can be difficult in practical applications. Data-driven approaches have been demonstrated to be one of the most significant methods for modelling battery degradation and assessing battery SOH due to their flexibility and the lack of need to build models of physical mechanisms such as artificial neural networks [16,17,18], relevance vector machine [19,20], Gaussian process regression [21,22], etc. Deep learning has been gaining more and more attention when it comes to SOH prediction for lithium-ion batteries [23,24,25]. For instance, Chaoui et al. proposed a simple Recurrent Neural Network (RNN)-based approach to estimate the SOH of lithium-ion batteries using a dynamically driven RNN [26]. Chen et al. used constant current discharge time, the charge/discharge cycle number, and charge capacity to build a long- and short-term memory network (LSTM) model to enable SOH prediction for lithium-ion batteries [27]. Hybrid methods are combinations of two or several models that use the same or different types of methods for SOH prediction. Bezha et al. combined Convolutional Neural Network (CNN) and LSTM for battery SOH prediction, taking the current–voltage profile as input and SOH as output, and it is demonstrated that the proposed hybrid method has the advantage of providing accurate estimates in terms of SOH [28]. Qu et al. developed an LSTM model and combined LSTM with particle swarm optimization (PSO) and Attention Mechanism (AM) to achieve monitoring and prediction of SOH for lithium-ion batteries. The results demonstrate a high level of accuracy of the estimates [29].
In summary, the single data-driven model cannot take into account feature extraction from lithium-ion batteries and accurate SOH prediction. Therefore, highly accurate models and methods are needed to achieve the SOH prediction of lithium-ion batteries. It is considered that the correlation between input data can be enhanced by AM and has an application to many forecasting tasks, for instance, stock forecasting and electricity forecasting [30,31,32,33,34]. The CNN-BiLSTM-AM model is presented in this paper to predict the SOH of lithium-ion batteries, and integrates the merits of CNN and BiLSTM. In the proposed CNN-BiLSTM-AM model, the convolution and pooling operations of the CNN layer are utilized to extract the features of the battery time series data, while the BiLSTM depth model is used to collect the forward and reverse dependencies of the CNN incoming data, which further emphasizes the correlation of the time series data and capturing long-term dependencies. In addition, the time series data associated with SOH are weighted by AM resulting in an accurate SOH prediction for lithium-ion batteries.
The remainder of this paper is organized as follows. The used basic theoretical knowledge is described in Section 2. Dataset description and data preprocessing for lithium-ion batteries SOH prediction are presented in Section 3. In Section 4, the proposed CNN-BiLSTM-AM model is described, while Section 5 presents the experimental settings. Based on a NASA dataset, the CNN-BiLSTM-AM model is used to predict the SOH of lithium-ion batteries in Section 6. Lastly, we summarize and discuss briefly possible future directions for this paper in Section 7.

2. Preliminaries

This section will briefly introduce the basic theoretical knowledge of CNN, BiLSTM, and AM used in the CNN-BiLSTM-AM model presented in this paper.

2.1. CNN

CNN has an exceptional ability to capture features of spatial data, and it has played an instrumental role in the recent development of deep learning. It comprises three main types of layers: the convolutional layer, the pooling layer, and the fully connected layer. Its output is as follows:
y t = tanh ( W t X t + b t )
where X t and y t are the input and output, respectively; tanh is the activation function; W t and b t represent the weight and bias, respectively.
A prototypical CNN unit is shown in Figure 1. The convolutional layer extracts local features by the size of the filter, and the features extracted by the pooling layer selection, which reduces the sophistication of the network parameters and structure, while the fully connected layer is a neural layer with an activation function that maps the relationship between input and output in a non-linear way. Since the convolution operations use the same set of weights, this reduces the number of parameters in CNN and solves the problem of overfitting. As a consequence, CNN is extensively used to predict the time series. Nevertheless, the increased sensitivity to sparse data is a drawback of CNN, and CNN is likely to be restricted to cases where good data are easily available. Thus, this paper collects the forward and backward dependencies of the data coming from CNN by building a BiLSTM depth model.

2.2. BiLSTM

Since lithium-ion battery data are collected during the charging and discharging cycles, they belong to the time series. RNN is applicable to processing time series, which help RNN process information in an orderly manner. To address the problem of exploding or disappearing gradients in RNN, the network structure of LSTM is proposed, substituting the state unit of classical RNN with the recurrent unit structure of LSTM.
A particular type of RNN model is LSTM. Compared to RNN, LSTM can better handle long-term continuous data. LSTM has three gate controls, i.e., the forget gate, the input gate, and the output gate, respectively. Figure 2 shows a prototype LSTM unit.
The main role of the forgetting gate is to store information about when unit values ought to be forgotten, given by the following equation:
f t = σ ( W f [ y t , h t 1 ] + b f )
where y t represents the input value; h t 1 represents the output value; W f , b f represents the weight and bias, respectively, and σ is the activation function.
The input gate stores the values into a memory unit, which operates as follows:
i t = σ ( W i [ y t , h t 1 ] + b i )
C ˜ t = tanh ( W c [ y t , h t 1 ] + b c )
where W i , W c are weights; tanh is the activation function, and C i ˜ is a one-dimensional matrix with values ranging from 0 to 1.
Combining the output of the forget and input gates, the information as C t is updated by:
C t = f t C t 1 + i t C ˜ t
The output gate controls the reading of the value of the memory unit.
o t = σ ( W o [ y t , h t 1 ] + b o )
where W o , b o are the weight and bias of the output gate, respectively, and o t is the output of the LSTM. The hidden state at time step t is updated in the following manner:
h t = o t tanh ( C t )
A BiLSTM consisting of a two-layer LSTM is shown in Figure 3, where the predicted system state is referred to a sequence of outputs from the bidirectional incoming LSTM layer. The predicted results are merged and assigned to the next LSTM layer; after the second LSTM layer, the ultimate prediction is determined by forward and backward propagation together. The BiLSTM depth model can better collect the bidirectional dependency of data from CNN than the LSTM model. Therefore, the model proposed in this paper is chosen as BiLSTM to enhance the accuracy of SOH prediction for lithium-ion batteries.

2.3. AM

Recently, scholars have applied AM to neural networks based on the concerns of the human brain AM and achieved excellent prediction results. In neural networks, each feature has a different impact on the outcome, but usually only a group of features determines the output. The main mechanism of AM is to follow the learning based on the attention level of the individual features in the series, and to integrate the features according to this attention level. To tackle the problem of attention distraction, this paper introduces AM, which sets weights for each feature according to its impact on the result. Figure 4 is a schematic diagram of the structure of the AM.
The expressions for the calculation of AM are shown in (8)–(10).
u t = tanh ( W w h t + b w )
a t = s o f t max ( u t T , u w )
z = a t h t
where W w is first randomly initialized and then determined through the network training process; u w is weight; b w represents bias; a t represents the weight of each attribute; z represents the prediction result after weighted summation.

3. Dataset Description and Data Preprocessing

3.1. Dataset Description

To train and test the proposed model, B0005, B0006, and B0018 of the NASA PCoE battery dataset are selected in this paper [35]. Charge, discharge, and impedance operation of three lithium-ion batteries is carried out at room temperature (24 °C). To start with, there is a charging process in which each battery at a constant current of 1.5 A until it reaches a voltage of 4.2 V. This is followed by charging in a constant voltage mode until the charging current drops to 20 mA. Secondly, there is a discharging process in which each battery is discharged under a constant current of 2 A until each battery’s voltage drops to 2.7 V, 2.5 V, and 2.5 V, respectively. Finally, there is an impedance process using electrochemical impedance spectra swept from 0.1 Hz to 5 kHz. The information of batteries B0005, B0006, and B0018 are displayed in Table 1.
As can be observed in Figure 5, the three batteries gradually decrease in capacity through time and are accompanied by rebound in capacity during the degradation process. All three batteries are subjected to charge and discharge cycles, and once the batteries have dropped 30% of their nominal capacity, the end-of-life (EOL) point is reached, that is, from 2 Ah to 1.4 Ah.

3.2. Data Preprocessing

The most intuitive manifestation of battery degradation is the decay in capacity, which is predominantly related to the SOH of the battery. SOH is defined by capacity and given by the following equation [36]:
S O H = C a c t u a l C n o m × 100 %
where C a c t u a l and C n o m represent the actual and nominal capacities, respectively.
Lithium-ion battery time series data for predicting SOH and the data preprocessing include data cleaning and normalization.
For better prediction accuracy and performance of deep learning models, experimental data need to be handled. To begin with, the data are cleaned by removing outliers and missing values, which are evaluated by moving averages or intermediate values, which cause the battery data to demonstrate periodic degradation characteristics. The battery specifications and data collection conditions have been summarized in Table 1. Data preprocessing assures that there are no erroneous values that could confound the model, as well as also being periodically averaged to avoid short-term fluctuations.
Data normalization is commonly applied in depth modelling algorithms where it is appropriate to improve the convergence of the model and the accuracy of the prediction. Normalization will be performed by the minimum–maximum method, where the data are scaled between 0 and 1. This is described by the following equation.
x n = x x min x max x min
where x n represents the processed data; x represents the original data; x max , x min represent the maximum and minimum values of the original data, respectively.

4. Methods

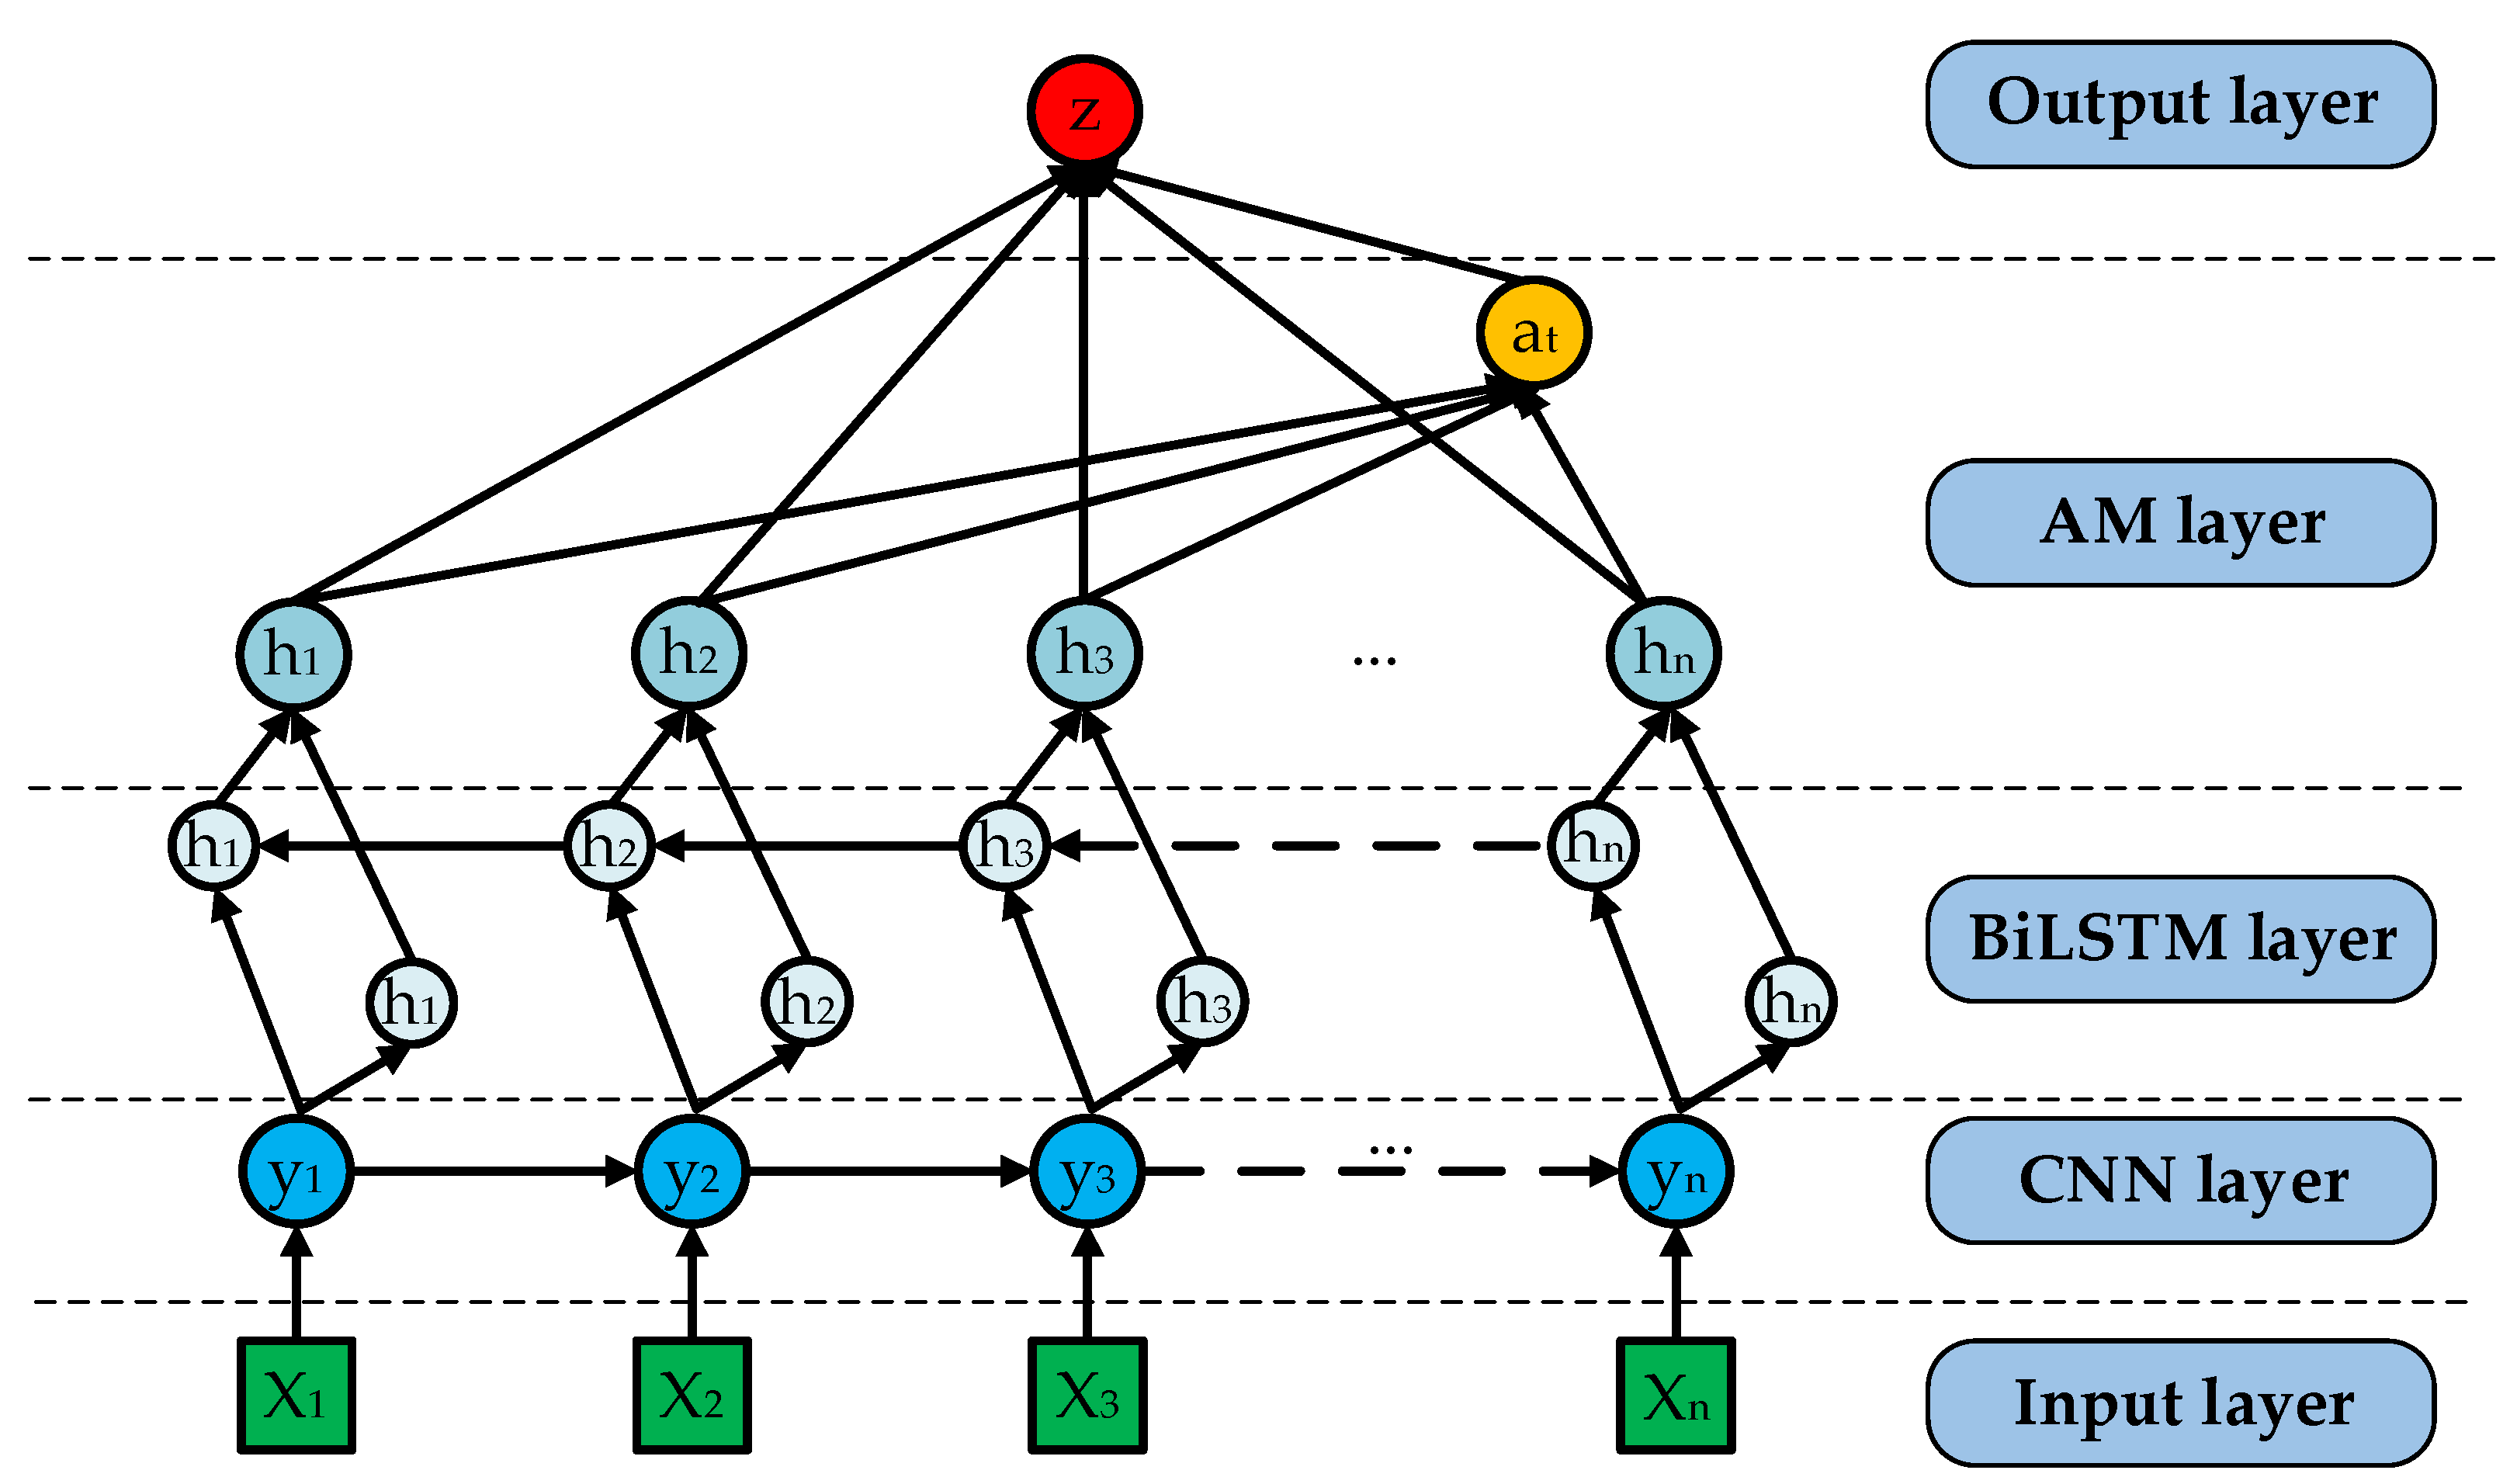
4.1. CNN-BiLSTM-AM Model

In this paper, the CNN-BiLSTM-AM model is proposed, which combines the characteristics and merits of CNN, BiLSTM, and AM to predict the SOH of lithium-ion batteries.
The model structure of CNN-BiLSTM-AM is presented in Figure 6, which primarily composed of the input layer, CNN layer, BiLSTM layer, AM layer, and output layer.
The model structure of CNN-BiLSTM-AM is described in detail as follows.
(1)
Input layer: Firstly, HIs that can characterize the capacity during the charging and discharging process of the lithium-ion battery dataset are extracted, and those that are highly correlated with the capacity are selected as indirect HI; the indirect HI is preprocessed with the data, the processed dataset is divided, and the HI of the training set is used as the input of CNN.
(2)
CNN layer: Including innovative concepts such as shared weight and local perceptual fields means CNN has unique benefits in processing battery datasets. In this paper, we use the convolution and pooling operations from the battery time series data to extract features.
(3)
BiLSTM layer: The BiLSTM depth model is built, which is made up of forwarding and inverse LSTM. In comparison with the LSTM, the BiLSTM can extract time series in both directions and better collect the forward and reverse dependencies of the data coming from the CNN.
(4)
AM layer: AM has been introduced into the hybrid model with the objective of enhancing the accuracy of the prediction model. AM assigns that each feature has a weight, further emphasizing the correlation between the data, which raises the accuracy of the prediction model.
(5)
Output layer: The weighted summed prediction results from the AM layer are output and then the testing set is fed into the trained model for prediction to generate SOH prediction results.

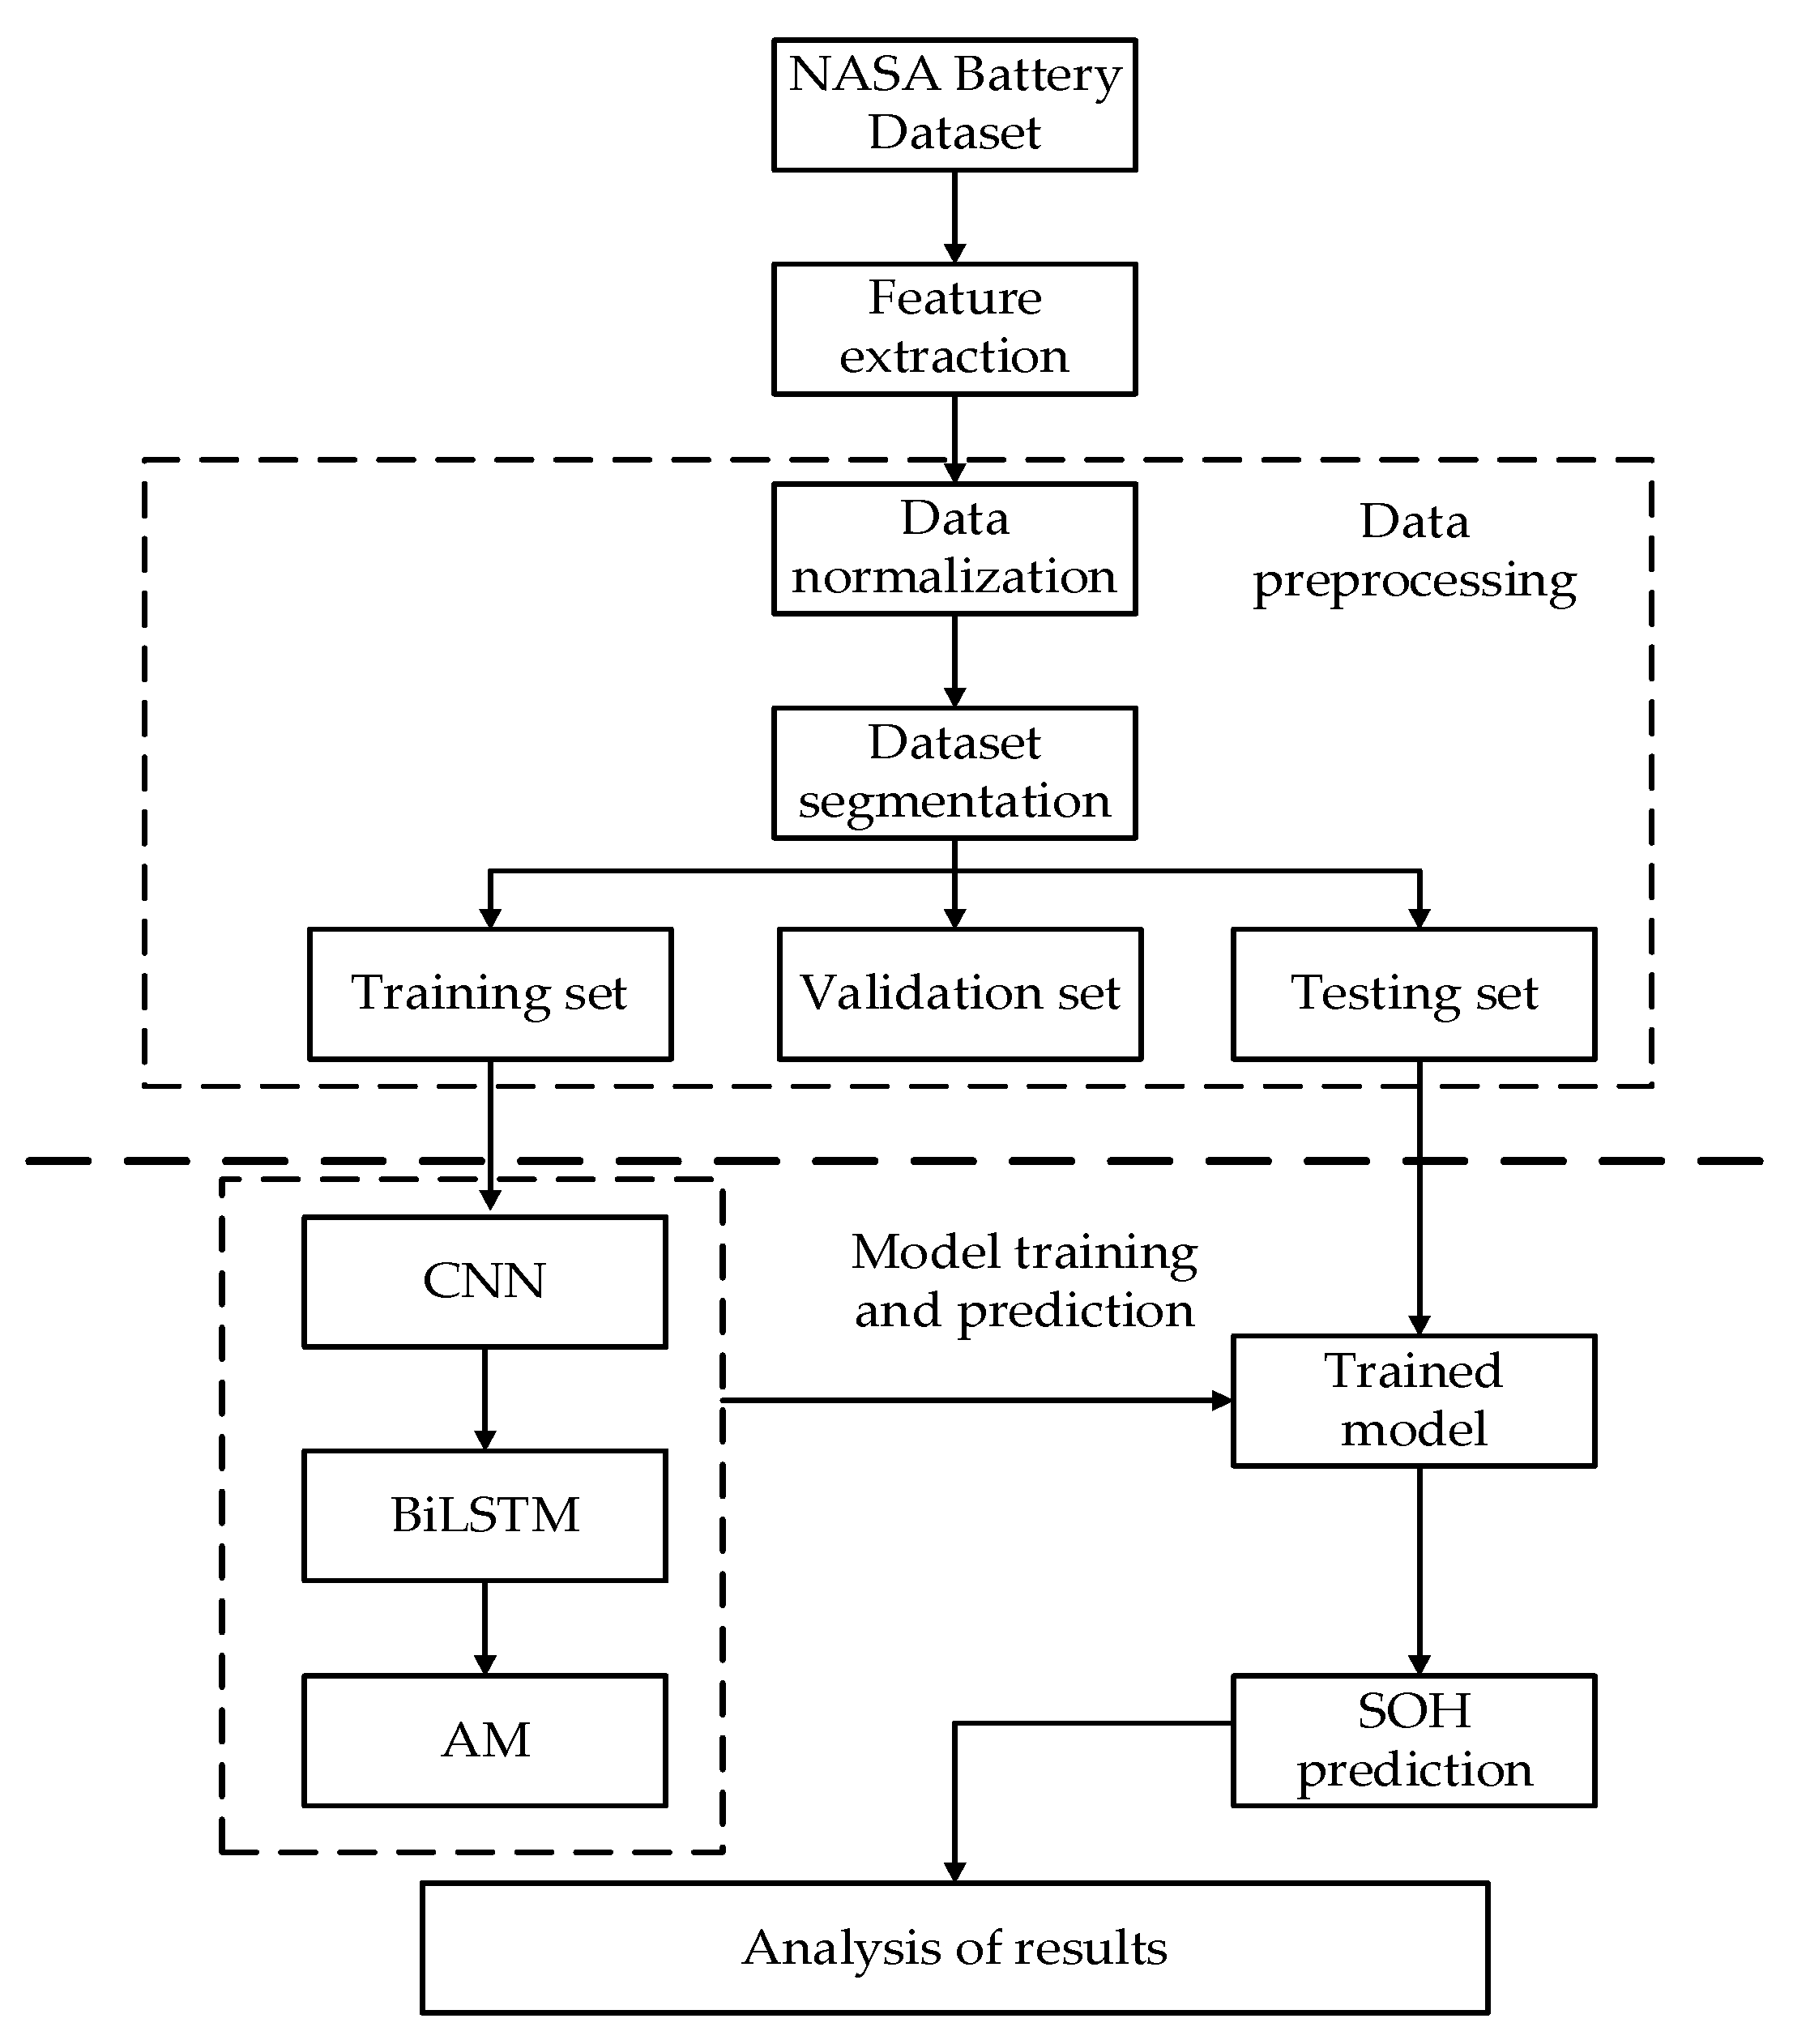
4.2. Prediction Procedure Based on CNN-BiLSTM-AM Model

Flow chart of SOH prediction based on CNN-BiLSTM-AM model is in Figure 7, from which one can see that the prediction procedure of SOH is comprised of the following five steps.
  • Step 1. Feature Extraction: Initially, indirect HIs that reflect battery capacity degeneration are extracted by considering the charge and discharge voltage, current, and temperature curves of lithium-ion batteries, and those that are highly correlated with capacity are selected as indirect HIs.
  • Step 2. Data Preprocessing: The extracted HI is normalized as well as followed by segmentation of the dataset.
  • Step 3. Build the model and Train: The convolution and pooling operations of the CNN layer are used to extract features, and the bidirectional dependencies of the data coming from CNN are collected by the BiLSTM depth model, followed by the time series data related to SOH weighted by AM, so as to build the CNN-BiLSTM-AM model, and the hyperparameters of the model are determined using the grid search method during the model training process to derive the optimal model.
  • Step 4. Model Prediction: The testing set is fed into the trained model for prediction, resulting in SOH prediction results.
  • Step 5. Analysis of Results: Lastly, to further verify the validity of the proposed model, three comparison models of CNN, BiLSTM, and CNN-BiLSTM are designed, and the SOH prediction model is quantitatively evaluated using error evaluation metrics.

5. Experimental Settings

5.1. Experimental Equipment and Model Parameter Settings

The experimental environment utilized in this paper has been described as follows. Hardware environment: Intel (R) Core (TM) i5-6300HQ CPU @ 2.30 GHz 2.30 GHz, 8 GB RAM, 64-bit operating system. The model is implemented in Python 3.7 using Keras.
In this paper, three datasets are used for the SOH prediction of lithium-ion batteries. The datasets are divided into training set, validation set, and testing set. The training set serves to train the model, validation set to adjust the parameters, and testing set for assessing the performance of the model. The details of the division are presented in Table 2.
A number of appropriate hyperparameters need to be selected in the model to guarantee the accuracy of the model predictions. Model performance is frequently validated using grid search and cross-validation to obtain optimum parameters. The K values for cross-validation may impact how sensitive they are to changes in the training set, hence affecting the hyperparameter results. The grid search method will be applied to determine the hyperparameters. The parameters are set as in Table 3.
In CNN convolutional model, too few convolutional and pooling layers will contribute to the inadequate extraction of critical local information, while too many will result in a longer run time and extraction of too much invalid information. When the batch size is too large, the optimization of the loss function and gradient descent is detrimental and can cause large errors. If the batch size is too small, the time consumption of the neural network may be greatly extended, and eventually, the dropout layer is inserted to prevent overfitting and boost the training speed.

5.2. Performance Evaluation Indicators

Three error evaluation metrics are used in this paper, i.e., Root Mean Square Error (RMSE), Mean Absolute Error (MAE), and Mean Absolute Percentage Error (MAPE), which are presented to provide a quantitative assessment of the accuracy of the proposed SOH prediction model and defined as:
R M S E = 1 N i = 1 N ( y i y ^ i ) 2
M A E = 1 N i = 1 N | y i y ^ i |
M A P E = 1 N i = 1 N | y i y ^ i y i | × 100 %
where y i is the real SOH value and y ^ i denotes the SOH predicted value. Specifically, for indicators such as RMSE, MAE, and MAPE, the closer they approached zero, the more accurate the prediction.

6. Experiment and Result Analysis of SOH Prediction

6.1. HI Extraction

We have successfully extracted the capacity degradation data of a group of three lithium-ion batteries of the same type from the NASA PCoE public dataset. By analyzing charge and discharge characteristics of the B0005 battery in the NASA dataset, as an illustration, it is demonstrated in Figure 8.
In Figure 8a, the charging process is constant voltage charging, so we have analyzed the discharging process. From Figure 8b, the voltage variation of the B0005 battery at different cycles in the discharging process, it is clear that there is rich degradation information in the voltage between 3.4 V and 3.8 V. In order to avoid information redundancy, the Time Interval of an Equal Discharging Voltage Difference (TIEDVD) is chosen as the time difference corresponding to 3.4–3.8 V, and the 150th cycle is taken as an illustration.
On this basis, we have extracted four HIs: the time at which the discharge voltage reaches its minimum point, the maximum gradient of the voltage curve in the initial stage of the discharge process, the discharge power, and the time it takes for the temperature to reach the peak value during the discharge process. Table 4 presents the results of the Pearson correlation analysis of HI and capacity of B0005, from which it can be noticed that TIEDVD has the highest correlation with the capacity of lithium-ion battery.
Figure 9 presents a qualitative analysis of SOH and TIEDVD, from which one can see that TIEDVD follows the same trend as that of SOH, and the rebound part can be followed better. As a result, TIEDVD works as HI to predict the SOH of lithium-ion batteries.

6.2. Results and Analysis of SOH Prediction

To demonstrate the effectiveness of the proposed CNN-BiLSTM-AM model, three models, i.e., CNN model, BiLSTM model, CNN-BiLSTM model, are designed to make a comparison with the CNN-BiLSTM-AM model for different prediction Starting Points (SPs) in this subsection, and the CNN model, BiLSTM model, CNN-BiLSTM model, and CNN-BiLSTM-AM model are represented as M1, M2, M3, and M4, respectively.
Firstly, the B0005 battery is selected for prediction at SP = 70%, and the prediction results of the B0005 battery are presented in Figure 10. It is evident from Figure 10 that the M1 model for the B0005 battery shows the largest error, of which the M2 and M3 models are the next largest. With the best prediction performance of the M4 model for trend degradation and capacity rebound, and the predicted values being closest to the real SOH value, the validity of the CNN-BiLSTM-AM model introduced in this paper is verified.
A setup of SOH predictions for the same battery at different SPs has been carried out to demonstrate further the accuracy of the presented model (M4). The prediction results of SOH for the B0005 battery at different SPs are shown in Figure 11. The BiLSTM model in the M4 model collects the bidirectional dependence of the incoming CNN data, AM further emphasizes the correlation between the serial data by weighting, and the SP = 90% follows the same pattern of variation. In addition, the prediction results of M4 are similar to the real SOH values at different SPs, and more accurate predictions are obtained, especially for the capacity reversion. As the SPs increase, the prediction results become more and more accurate. Furthermore, Figure 11 presents that the error of the prediction results for SP = 70%, SP = 80%, and SP = 90% are smaller, which further proves the high accuracy of the CNN-BiLSTM-AM model.
RMSE, MAE, and MAPE have been adopted as error evaluation metrics to quantitatively assess the accuracy of the CNN-BiLSTM-AM prediction model. Table 5 illustrates the prediction results of SOH based on different models for batteries B0005, B0006, and B0018 with different SPs. In Table 5, the smallest RMSE, MAE, and MAPE are 0.00487, 0.00307, and 0.420%, respectively, corresponding to the M4 model for the B0005 battery at SP = 90%; the largest RMSE, MAE, and MAPE are 0.0153, 0.0121, and 1.60%, respectively, corresponding to the M1 model for the B0018 battery at SP = 90%. While the magnitude of the capacity rebound portion of the B0018 battery is larger, the M4 model is also accurately validated. The error of the M4 model for all three batteries are lower than the comparison models, with RMSE lower than 0.0120, MAE lower than 0.007, and MAPE lower than 0.9%. According to the results, the M4 model has the highest accuracy and the lowest prediction error.
To investigate the effect of EOL on prediction error, we take B0005 as an example, where the EOLs are selected 70%, 75%, and 80% respectively, and the dataset has been repartitioned. The prediction results are presented in Figure 12 and Table 6, from which one can see that the largest RMSE, MAE, and MAPE are 0.00737, 0.00382, and 0.496%, respectively, corresponding to the M4 model for B0005 batteries with EOL = 70%; the smallest RMSE, MAE, and MAPE are 0.00621, 0.00432, and 0.343%, respectively, corresponding to the M4 model for EOL = 80%. Thus, the prediction error becomes higher when the EOL is set as the smaller percent of the health indicator, which is particularly evident in MAPE.

7. Conclusions

Considering the security and dependability of lithium-ion batteries in real-world applications, a hybrid model based on CNN, BiLSTM, and AM is advanced to predict the SOH of lithium-ion batteries in this paper. In the CNN-BiLSTM-AM model, CNN is utilized to extract the features of the battery time series, BiLSTM to collect the bidirectional relationships, and AM to assign weights to achieve accurate SOH estimation of lithium-ion batteries. The prediction results of SOH by investigating different batteries with different SPs demonstrate that the proposed CNN-BiLSTM-AM model outperforms the CNN model, BiLSTM model, and CNN-BiLSTM model, with RMSE lower than 0.0120, MAE lower than 0.007, and MAPE lower than 0.9%, which can more accurately predict SOH for lithium-ion batteries.
The further works can be considered as follows: (1) SOH and RUL prediction for lithium-ion batteries considering practical applications; (2) Application of the latest machine learning techniques in the prediction of SOH and RUL for lithium-ion battery, such as various variants and improvements of the transformer; (3) Ways and ideas to combine the physical–chemical laws of lithium batteries and artificial intelligence technologies.

Author Contributions

Conceptualization, methodology, software, validation, formal analysis, investigation, writing—original draft preparation, visualization, Y.T.; conceptualization, methodology, validation, investigation, writing—review and editing, supervision, project administration, funding acquisition, J.W.; methodology, validation, investigation, Y.Y.; conceptualization, formal analysis, Y.S.; supervision, project administration, funding acquisition, J.Z. All authors have read and agreed to the published version of the manuscript.

Funding

This work was supported by the National Natural Science Foundation of China under Grant 72071183, and the Research Project Supported by Shanxi Scholarship Council of China under Grant 2020-114.

Data Availability Statement

Not applicable.

Acknowledgments

In particular, thanks to the NASA Ames Center of Excellence Diagnostic Center for providing the experimental data.

Conflicts of Interest

The authors declare no conflict of interest.

References

  1. Rajaeifar, M.A.; Ghadimi, P.; Raugei, M.; Wu, Y.; Heidrich, O. Challenges and recent developments in supply and value chains of electric vehicle batteries: A sustainability perspective. Resour. Conserv. Recycl. 2022, 180, 106144. [Google Scholar] [CrossRef]
  2. Xiong, R.; Li, L.; Tian, J. Towards a smarter battery management system: A critical review on battery state of health monitoring methods. J. Power Sources 2018, 405, 18–29. [Google Scholar] [CrossRef]
  3. Shen, M.; Gae, Q. A review on battery management system from the modeling efforts to its multiapplication and integration. Int. J. Energy Res. 2019, 43, 5042–5075. [Google Scholar] [CrossRef]
  4. Shen, P.; Ouyang, M.; Lu, L.; Li, J.; Feng, X. The co-estimation of state of charge, state of health, and state of function for lithium-ion batteries in electric vehicles. IEEE Trans. Veh. Technol. 2017, 67, 92–103. [Google Scholar] [CrossRef]
  5. Lai, X.; Gao, W. A comparative study of global optimization methods for parameter identification of different equivalent circuit models for Li-ion batteries. Electrochim. Acta 2019, 295, 1057–1066. [Google Scholar] [CrossRef]
  6. Wang, Y.; Gao, G.; Li, X.; Chen, Z. A fractional-order model-based state estimation approach for lithium-ion battery and ultra-capacitor hybrid power source system considering load trajectory. J. Power Sources 2020, 449, 227543. [Google Scholar] [CrossRef]
  7. Cheng, G.; Wang, X.; He, Y. Remaining useful life and state of health prediction for lithium batteries based on empirical mode decomposition and a long and short memory neural network. Energy 2021, 232, 121022. [Google Scholar] [CrossRef]
  8. Rechkemmer, S.; Zang, X. Empirical Li-ion aging model derived from single particle model. J. Energy Storage 2019, 21, 773–786. [Google Scholar] [CrossRef]
  9. Li, K.; Wang, Y.; Chen, Z. A comparative study of battery state-of-health estimation based on empirical mode decomposition and neural network. J. Energy Storage 2022, 54, 105333. [Google Scholar] [CrossRef]
  10. Geng, Z.; Wang, S.; Lacey, M.J.; Brandell, D.; Thiringer, T. Bridging physics-based and equivalent circuit models for lithium-ion batteries. Electrochim. Acta 2021, 372, 137829. [Google Scholar] [CrossRef]
  11. Xu, N.; Xie, Y.; Liu, Q.; Yue, F.; Zhao, D. A Data-Driven Approach to State of Health Estimation and Prediction for a Lithium-Ion Battery Pack of Electric Buses Based on Real-World Data. Sensors 2022, 22, 5762. [Google Scholar] [CrossRef] [PubMed]
  12. Ng, M.F.; Zhao, J.; Yan, Q.; Conduit, G.J.; Seh, Z.W. Predicting the state of charge and health of batteries using data-driven machine learning. Nat. Mach. Intell. 2020, 2, 161–170. [Google Scholar] [CrossRef] [Green Version]
  13. Alipour, M.; Tavallaey, S. Improved Battery Cycle Life Prediction Using a Hybrid Data-Driven Model Incorporating Linear Support Vector Regression and Gaussian. ChemPhysChem 2022, 23, e202100829. [Google Scholar] [CrossRef] [PubMed]
  14. Li, X.; Wang, Z. Prognostic health condition for lithium battery using the partial incremental capacity and Gaussian process regression. J. Power Sources 2019, 421, 56–67. [Google Scholar] [CrossRef]
  15. Li, Y.; Abdel-Monem, M. A quick on-line state of health estimation method for Li-ion battery with incremental capacity curves processed by Gaussian filter. J. Power Sources 2018, 373, 40–53. [Google Scholar] [CrossRef]
  16. Ströbel, M.; Pross-Brakhage, J.; Kopp, M.; Birke, K.P. Impedance Based Temperature Estimation of Lithium Ion Cells Using Artificial Neural Networks. Batteries 2021, 7, 85. [Google Scholar] [CrossRef]
  17. Wu, B.; Han, S.; Shin, K.G.; Lu, W. Application of artificial neural networks in design of lithium-ion batteries. J. Power Sources 2018, 395, 128–136. [Google Scholar] [CrossRef]
  18. Dai, H.; Zhao, G.; Lin, M.; Wu, J.; Zheng, G. A novel estimation method for the state of health of lithium-ion battery using prior knowledge-based neural network and Markov chain. IEEE Trans. Ind. Electron. 2019, 66, 7706–7716. [Google Scholar] [CrossRef]
  19. Yang, Y.; Wen, J.; Shi, Y.; Zeng, J. State of Health Prediction of Lithium-Ion Batteries Based on the Discharge Voltage and Temperature. Electronics 2021, 10, 1497. [Google Scholar] [CrossRef]
  20. Feng, X.; Weng, C.; He, X.; Han, X.; Lu, L.; Ren, D.; Ouyang, M. Online state-of-health estimation for li-ion battery using partial charging segment based on support vector machine. IEEE Trans. Veh. Technol. 2019, 68, 8583–8592. [Google Scholar] [CrossRef]
  21. Jia, J.; Liang, J.; Shi, Y.; Wen, J.; Pang, X.; Zeng, J. SOH and RUL Prediction of Lithium-Ion Batteries Based on Gaussian Process Regression with Indirect Health Indicators. Energies 2020, 13, 375. [Google Scholar] [CrossRef] [Green Version]
  22. Yang, D.; Zhang, X.; Pan, R.; Wang, Y.; Chen, Z. A novel Gaussian process regression model for state-of-health estimation of lithium-ion battery using charging curve. J. Power Sources 2018, 384, 387–395. [Google Scholar] [CrossRef]
  23. Kheirkhah-Rad, E.; Moeini-Aghtaie, M. A novel data-driven SOH prediction model for lithium-ion batteries. In Proceedings of the 2021 31st Australasian Universities Power Engineering Conference (AUPEC), Perth, Australia, 26–30 September 2021; pp. 1–6. [Google Scholar] [CrossRef]
  24. Tan, Y.; Zhao, G. Transfer Learning With Long Short-Term Memory Network for State-of-Health Prediction of Lithium-Ion Batteries. IEEE Trans. Ind. Electron. 2020, 67, 8723–8731. [Google Scholar] [CrossRef]
  25. Khumprom, P.; Yodo, N. Data-driven Prognostic Model of Li-ion Battery with Deep Learning Algorithm. In Proceedings of the 2019 Annual Reliability and Maintainability Symposium (RAMS), Orlando, FL, USA, 28–31 January 2019; pp. 1–6. [Google Scholar] [CrossRef]
  26. Chaoui, H.; Ibe-Ekeocha, C.C. State of Charge and State of Health Estimation for Lithium Batteries Using Recurrent Neural Networks. IEEE Trans. Veh. Technol. 2017, 66, 8773–8783. [Google Scholar] [CrossRef]
  27. Chen, Z.; Song, X.; Xiao, R.; Shen, J.; Xia, X. State of Health Estimation for Lithium-Ion Battery Based on Long Short Term Memory Networks. In Proceedings of the 2018 Joint International Conference on Energy, Ecology and Environment (ICEEE) and International Conference on Electric and Intelligent Vehicles (ICEIV), Melbourne, Australia, 21–25 November 2018; pp. 1–6. [Google Scholar] [CrossRef]
  28. Bezha, M.; Nanahara, T.; Nagaoka, N. Development of Fast SoH Estimation of Li-Ion Battery Pack/Modules Using Multi Series-Parallel based ANN Structure. In Proceedings of the 2021 IEEE 12th Energy Conversion Congress & Exposition-Asia (ECCE-Asia), Singapore, 24–27 May 2021; pp. 1719–1724. [Google Scholar] [CrossRef]
  29. Qu, J.T.; Liu, F.; Ma, Y.X.; Fan, J.M. A Neural-Network-Based Method for RUL Prediction and SOH Monitoring of Lithium-Ion Battery. IEEE Access 2019, 7, 87178–87191. [Google Scholar] [CrossRef]
  30. Cai, W.; Wang, Y.; Ma, J.; Jin, Q. CAN: Effective cross features by global attention mechanism and neural network for ad click prediction. Tsinghua Sci. Technol. 2022, 27, 186–195. [Google Scholar] [CrossRef]
  31. He, M.; Xue, X.; Zhang., X.; Zhou., C. A Bike-sharing Demand Predicting Model with Integrating Temporal Convolutional Network and Self-Attention. In Proceedings of the International Conference on Electronic Information Engineering and Computer Science (EIECS), Changchun, China, 23–26 September 2021; pp. 278–281. [Google Scholar] [CrossRef]
  32. Feng, A.; Zhang, X.; Song, X. Unrestricted Attention May Not Be All You Need–Masked Attention Mechanism Focuses Better on Relevant Parts in Aspect-Based Sentiment Analysis. IEEE Access 2022, 10, 8518–8528. [Google Scholar] [CrossRef]
  33. Liu, D.; Liu, J.; Luo, Y.; He, Q.; Lei, D. MGATMDA: Predicting microbe-disease associations via multi-component graph attention network. In IEEE/ACM Transactions on Computational Biology and Bioinformatics; IEEE: Piscataway, NJ, USA, 2021; p. 29. [Google Scholar] [CrossRef]
  34. Zhu, Y.; Zhao, C.; Guo, H.; Wang, J.; Zhao, X.; Lu, H. Attention CoupleNet: Fully Convolutional Attention Coupling Network for Object Detection. IEEE Trans. Image Process. 2018, 28, 113–126. [Google Scholar] [CrossRef]
  35. Saha, B.; Goebel, K. Battery Data Set. Available online: http://ti.arc.nasa.gov/tech/dash/pcoe/prognostic-data-repository/ (accessed on 18 February 2020).
  36. El-Dalahmeh, M.; Al-Greer, M.; El-Dalahmeh, M.; Short, M. Time-Frequency Image Analysis and Transfer Learning for Capacity Prediction of Lithium-Ion Batteries. Energies 2020, 13, 5447. [Google Scholar] [CrossRef]
Figure 1. Prototypical CNN unit.
Batteries 08 00155 g001
Figure 2. Recurrent unit structure of LSTM network.
Batteries 08 00155 g002
Figure 3. Recurrent unit structure of BiLSTM networks.
Batteries 08 00155 g003
Figure 4. Structure diagram of AM.
Batteries 08 00155 g004
Figure 5. Capacity degradation curve of lithium-ion batteries.
Batteries 08 00155 g005
Figure 6. Structure diagram of CNN-BiLSTM-AM.
Batteries 08 00155 g006
Figure 7. Flow chart of SOH prediction based on CNN-BiLSTM-AM model.
Batteries 08 00155 g007
Figure 8. B0005 charge and discharge curves at different cycles. (a) Charge voltage curve; (b) Discharge voltage curve; (c) Charge temperature curve; (d) Discharge temperature curve.
Batteries 08 00155 g008aBatteries 08 00155 g008b
Figure 9. Qualitative analysis of SOH and TIEDVD.
Batteries 08 00155 g009
Figure 10. Different models of SOH prediction results for B0005.
Batteries 08 00155 g010
Figure 11. SOH prediction results for B0005 at different SPs. (a) SP = 80%; (b) SP = 90%.
Batteries 08 00155 g011
Figure 12. Different EOLs of SOH prediction results for B0005.
Batteries 08 00155 g012
Table 1. NASA dataset lithium-ion battery information.
BatteryNumber of ChargesNumber of
Discharges
Number of
Impedances
Actual Life
Expectancy
B0005170168278124
B0006170168278108
B00181341325396
Table 2. Dataset segmentation.
DatasetTraining SetValidation SetTesting Set
B0005(70%) 5037(30%) 37
(80%) 7425(20%) 25
(90%) 9912(10%) 13
B0006(70%) 4332(30%) 33
(80%) 6522(20%) 21
(90%) 8611(10%) 11
B0018(70%) 3829(30%) 29
(80%) 5819(20%) 19
(90%) 7710(10%) 9
Table 3. Parameter setting.
ParameterSetting Value
OptimizerAdam
Loss functionMSE
Activation functionRELU
Filter size10
Batch size16
Epochs1000
Dropout rate0.200
Learning rate0.001
Number of neurons160
Table 4. Correlation analysis of HI and capacity of B0005.
HIPearson
TIEDVD0.9972
Time at which the discharge voltage reaches its minimum point0.9928
Maximum gradient of the voltage curve in the initial stage of the discharge process0.8050
Discharge power0.9132
Time it takes for the temperature to reach the peak value during the discharge process0.9886
Table 5. Prediction results of SOH based on different models for batteries B0005, B0006, and B0018 with different SPs.
BatteryPrediction SPModelRMSEMAEMAPE (%)
B000587 (70%)M10.008930.005650.738
M20.008670.005400.702
M30.007940.005310.692
M40.007370.003820.496
99 (80%)M10.008630.006610.886
M20.006200.004320.582
M30.005950.004320.581
M40.004810.003160.425
111 (90%)M10.008130.006330.825
M20.006000.004090.558
M30.005980.004080.558
M40.004870.003070.420
B000675 (70%)M10.01510.01011.49
M20.01330.008381.24
M30.01330.008461.25
M40.01140.004850.709
87 (80%)M10.01340.008641.28
M20.01290.008121.21
M30.01170.007791.15
M40.01050.004910.727
97 (90%)M10.009140.007081.11
M20.008450.006170.963
M30.007590.005670.883
M40.005720.003610.561
B001867 (70%)M10.01450.01101.44
M20.01390.009971.30
M30.01380.01181.421
M40.01080.006120.797
77 (80%)M10.01510.01191.56
M20.01330.009811.29
M30.01410.01091.44
M40.01090.006230.619
87 (90%)M10.01530.01211.60
M20.01410.01091.45
M30.01500.01211.60
M40.01120.006270.828
Table 6. Prediction results of SOH based on the M4 model for the B0005 battery with different EOLs.
EOLPrediction SPRMSEMAEMAPE (%)
70%87 (70%)0.007370.003820.496
99 (80%)0.004810.003160.425
111 (90%)0.004870.003070.420
75%69 (70%)0.006600.004650.364
79 (80%)0.006650.004540.355
89 (90%)0.007400.003830.499
80%52 (70%)0.006210.004320.343
60 (80%)0.006270.004350.343
67 (90%)0.006540.004570.357
Publisher’s Note: MDPI stays neutral with regard to jurisdictional claims in published maps and institutional affiliations.

