1. Introduction
The performance of lithium ion batteries (LIBs) is strongly dependent on the cell temperature, particularly with regard to battery aging and safety issues. With low temperatures there is a risk of lithium plating due to reduced reaction kinetics, which results in decreased lithium availability. However, operating LIBs at a high temperature can cause a rise in undesirable side reactions that cause rapid degradation, including capacity and power loss [
1]. Furthermore, there is a risk of material decomposition which can trigger a so-called thermal runaway and may lead to self-ignition and even an explosion [
2]. High temperature issues are caused by cell-internal heat generation, and low temperature operation is generated due to environmental temperatures.
There are various temperature indication methods in existence. Raijmakers et al. provided a broad overview on various temperature indication methods for LIBs [
3]. The most common approach uses a conventional temperature sensor, such as a thermocouple or thermistor, placed on the housing of the cell. However, the core temperature varies widely from the surface temperature in cases of heavy loading, and the temperature rise can only be detected with a time-shift or requires extensive thermal models [
4,
5,
6]. Moreover, the accuracy varies with thermal contact and the position of the temperature sensor. In addition, in most cases not every cell is equipped with a sensor, and therefore the pack design needs to be considered to detect feasible hot spots [
7]. Thus, a thermal runaway can only be detected stochastically [
2]. By placing temperature sensors internally, these problems can be avoided. This might lead to an increase in costs, more complexity for manufacturers and possible negative effects in terms of battery life [
1,
8].
The impedance based methods have gained substantial interest because of their characteristic of measuring the average internal temperature without using internal or external hardware [
9]. Therefore, the method is also known as sensorless temperature measurement.
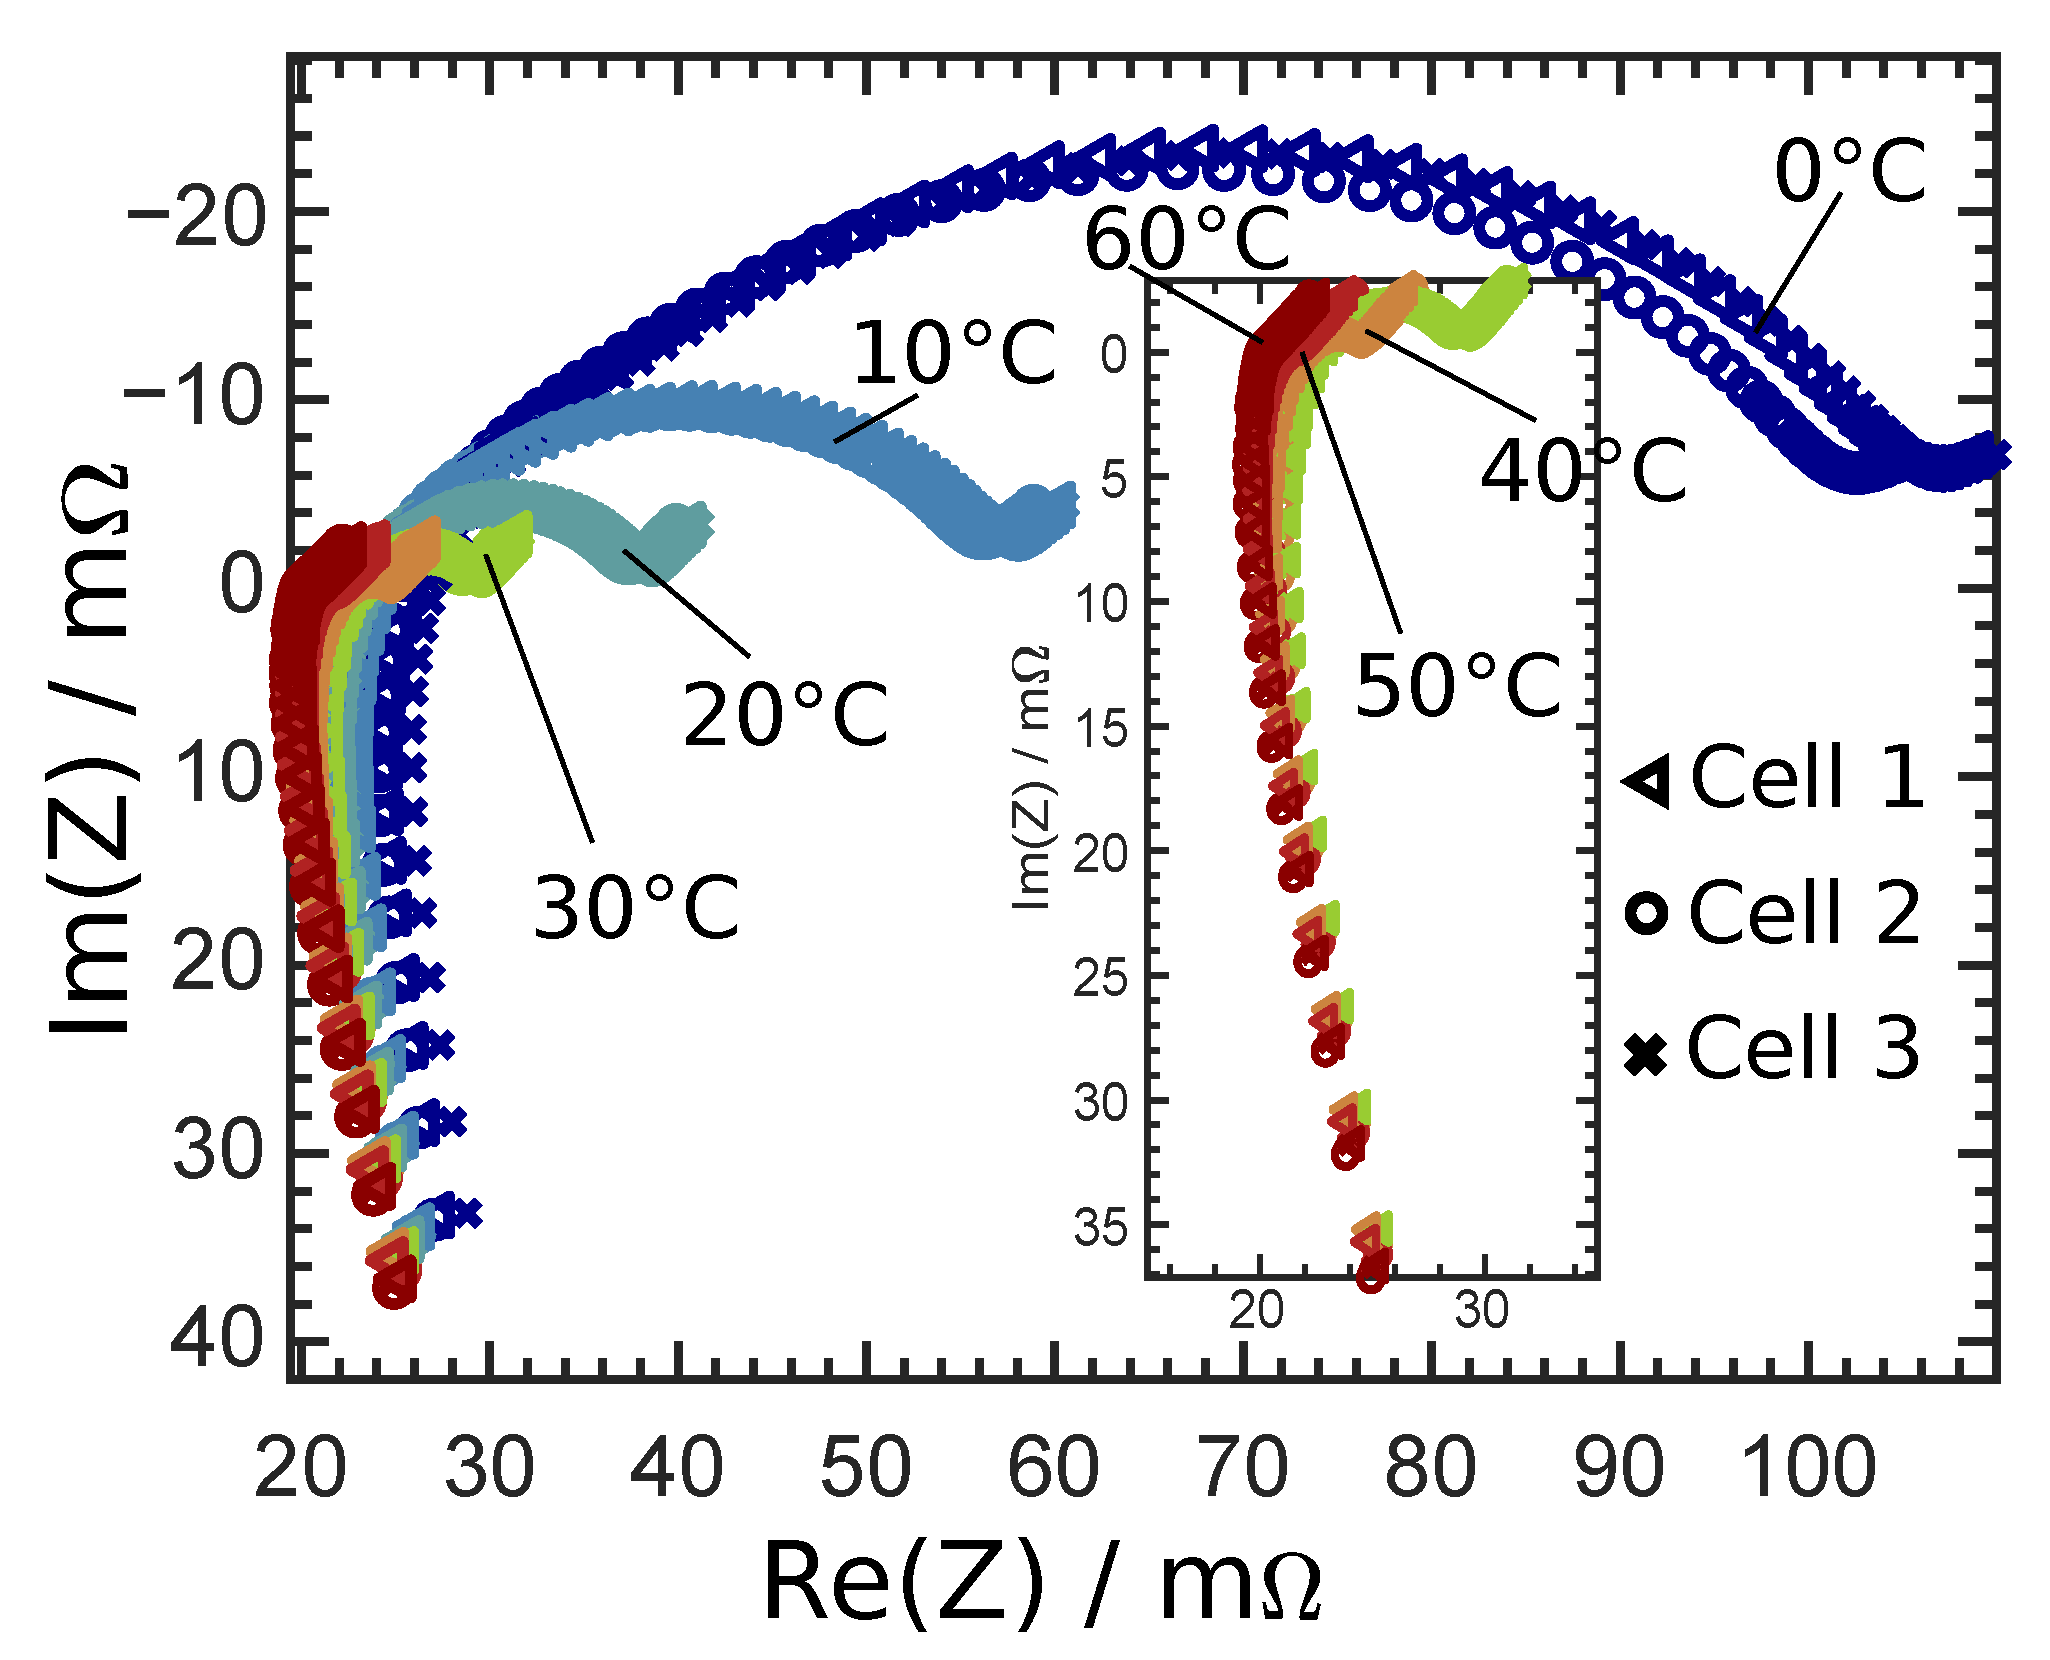
Figure 1 clarifies the temperature’s strong dependency on the battery’s characteristic impedance response. Additionally, with increased temperature, a significant reduction in impedance response can be observed. Such measurements were conducted by the authors. EIS measurements were performed on Samsung INR18650-15L cells at different temperatures. Details about the experimental process are described in
Section 2.1.
The impedance can also be detected in other battery states, such as the state of health with respect to nominal capacity
, SoHC) and the state of charge (SoC); therefore, those other states can be crucial input variables for battery management systems [
3,
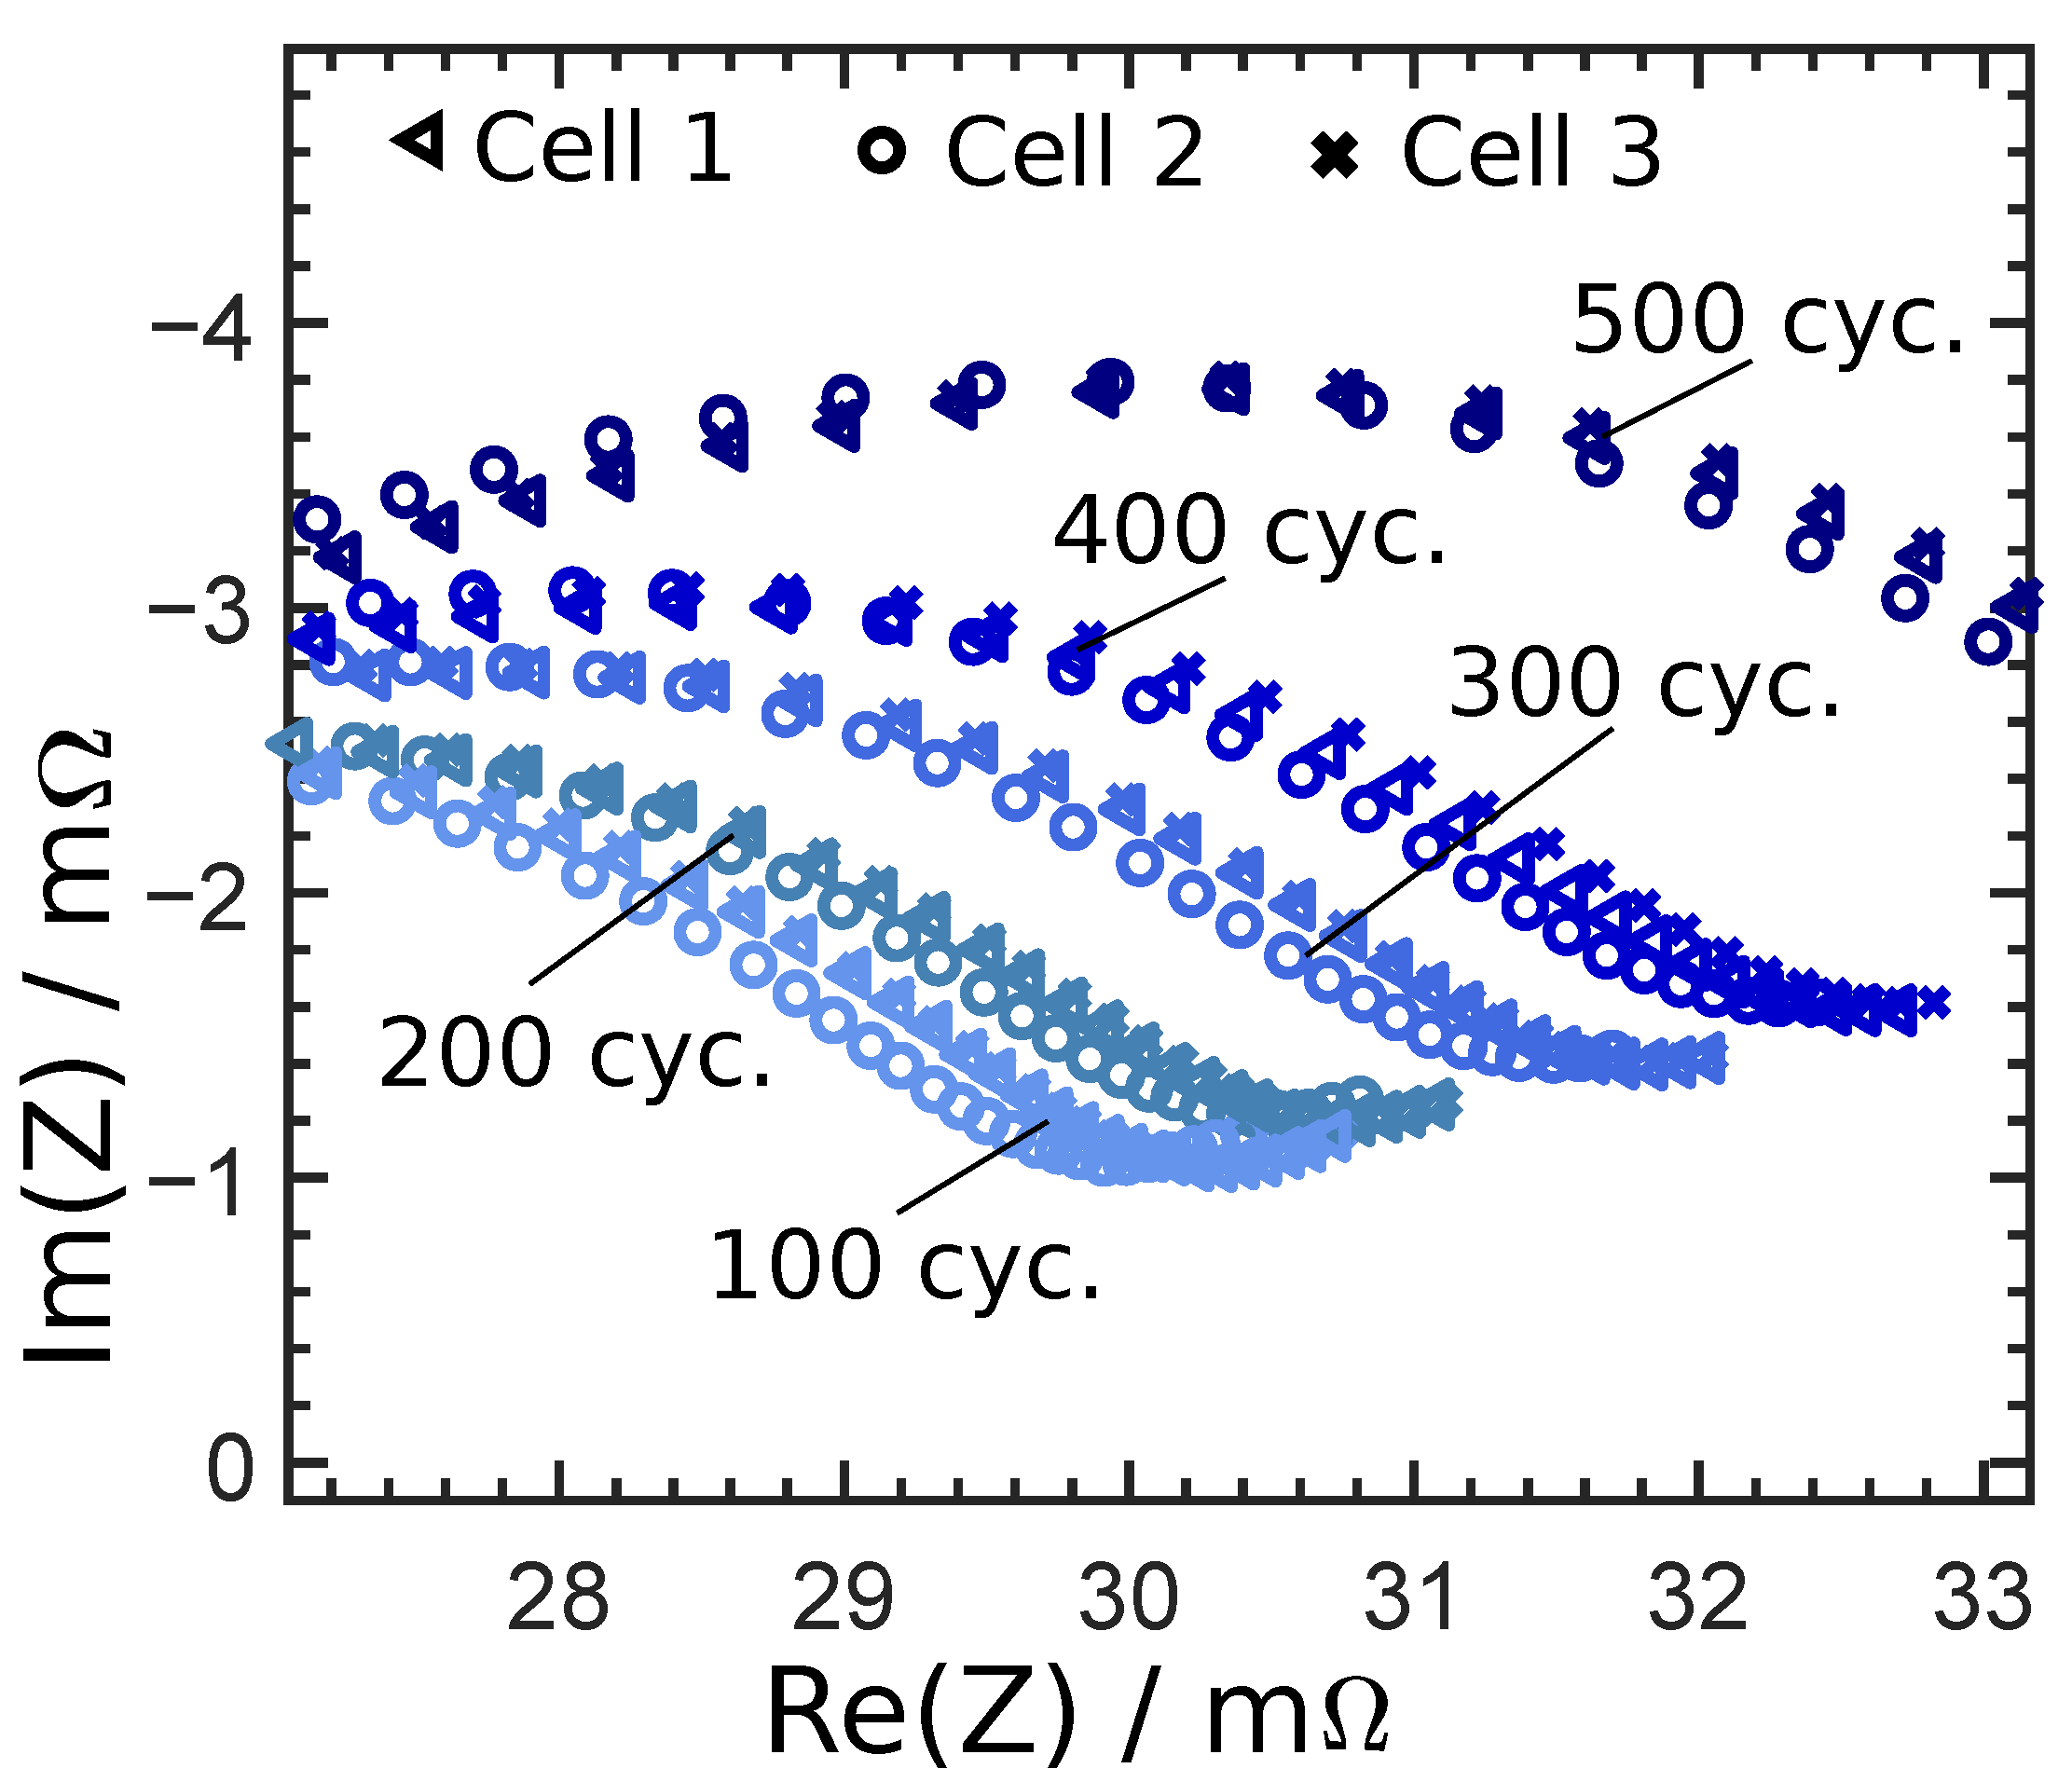
10]. In
Figure 2 the progression of the impedance for different cycles and three different cells are presented, and it points out the continuous increase in impedance with over the life-cycle. Details about the experimental process are described in
Section 2.1. However, it is important to distinguish the various influence factors from each other and find the optimal basis for predictions [
11,
12,
13,
14].
Srinivasan et al. were the first to find the relation between impedance at a specific frequency and the temperature—more precisely, the phase shift at a frequency that is associated with the solid electrolyte interface [
12]. Contrarily, Schmidt et al. made use of the real part of the impedance measurement at higher frequencies, because the time constant has a significantly lower level of correlation with the SoC, which enables improved temperature estimation at unknown SoCs [
11]. Similarly, Richardson et al. analyzed the influence of internal thermal gradients on the impedance. It can be shown that this technique estimates the volume-average temperature and is therefore able to detect internal hotspots without any time delays [
8].
Most publications in this field either show a correlation between a measurable value (e.g., impedance) and the state of interest (e.g., SoC or temperature), or present the state estimation results for a single cell. The state estimation of a number of cells of the same cell type is more complicated due to the existence of variations among individual cells. In this case it is crucial to select the required input parameters. Several studies have raised concerns regarding the question of finding the optimum input variable for determining the temperature. Beelen et al. compared some of these approaches and performed a sensitivity analysis to optimize the prediction accuracy [
15]. In the case of an unknown SoC, the achieved average bias was
K with an average standard deviation of
K. The study highlights the importance of selecting the appropriate input parameters for temperature determination.
This study investigates an approach using ANNs, which are promising for handling multidimensional feature problems. The procedure can be automated and can be easily transferred to other cell chemistries. There are only a few studies available which present data based temperature estimation methods using artificial neural networks. Feng et al. combined the advantages of physical models with artificial neural networks to enhance the performance for estimating the SoC and temperature [
16]. Hasan et al. estimated cell temperature based on a nonlinear, autoregressive exogenous artificial neural network and time series data, namely, current and ambient temperature for a battery container [
17]. However, there are a number of studies that present ANN based methods for estimating the SoC and SoH [
18,
19,
20,
21]. Khumprom et al. confirmed ANNs’ ability to approximate a nonlinear system by comparing a deep ANN against other machine learning algorithms for SoH prediction; the former could either match or outweigh the other algorithms’ performances [
22]. Furthermore, some researchers have used impedance data in combination with ANNs. Messing et al. used impedance data for equivalent circuit parameterization and input data for the ANN [
23]. However most approaches use methods which require a lot of computational effort due to the need for solving partial differential equations and the fitting of physical models or time series.
For this study, we chose an approach using impedance data from directly measurable indicators (voltage, current, time) as input data and linking impedance based temperature estimation with ANNs. The implied advantage is that error-prone parameterization may be dispensed with. Since it is necessary to monitor the voltage of a lithium ion cell constantly, it should be possible to perform a four-point measurement on each cell by using an AC current source in the battery system to create the EIS spectra. Our main focus lies in demonstrating the technical feasibility of this concept. In contrast to many other publications, the state estimation was not performed for a single cell but for a number of cells. We show that it is possible to train an ANN with data from a number of cells to estimate the temperatures of other cells of the same cell type. An advantage of the EIS-ANN method is that once the ANN is trained, the temperature estimation is completed within milliseconds since there is no need to solve partial differential equations. In addition, a perspective is given on the possibility of utilizing this method of impedance based state estimation using ANNs to estimate the SoC and the SoHC.
In
Section 2, we describe the data acquisition and the architecture of the ANN. In
Section 3 we present the results of the temperature, SoC and SoHC estimations and discuss the limitations of the ANN method.
2. Materials and Methods
Lithium ion cells were set to well defined states, where SoHC, SoC and temperature parameters were varied. For each state, an electrochemical impedance measurement (EIS) was performed; every EIS spectrum is related to a defined state. To simulate dynamic working conditions, the EIS measurements were performed as soon as the SoC was adjusted, without relaxation. Since it was not possible to perform EIS measurements for every possible combination of SoHC, SoC and temperature, different series of measurements were performed; each series mainly focused on one state, e.g., temperature. These series of measurements are described in the following subsections. The EIS datasets were separated into a training dataset and a test dataset. The training dataset was used to train the ANN. In the first step, the ANN was trained by using the EIS spectra as input and the related data of the cell states as target values. After the training process, the ANN was evaluated with the test data set. The ANN needed to estimate the related state by itself, and at last the estimated states were compared with the measured states to evaluate the estimation quality.
2.1. Electrochemical Impedance Spectroscopy
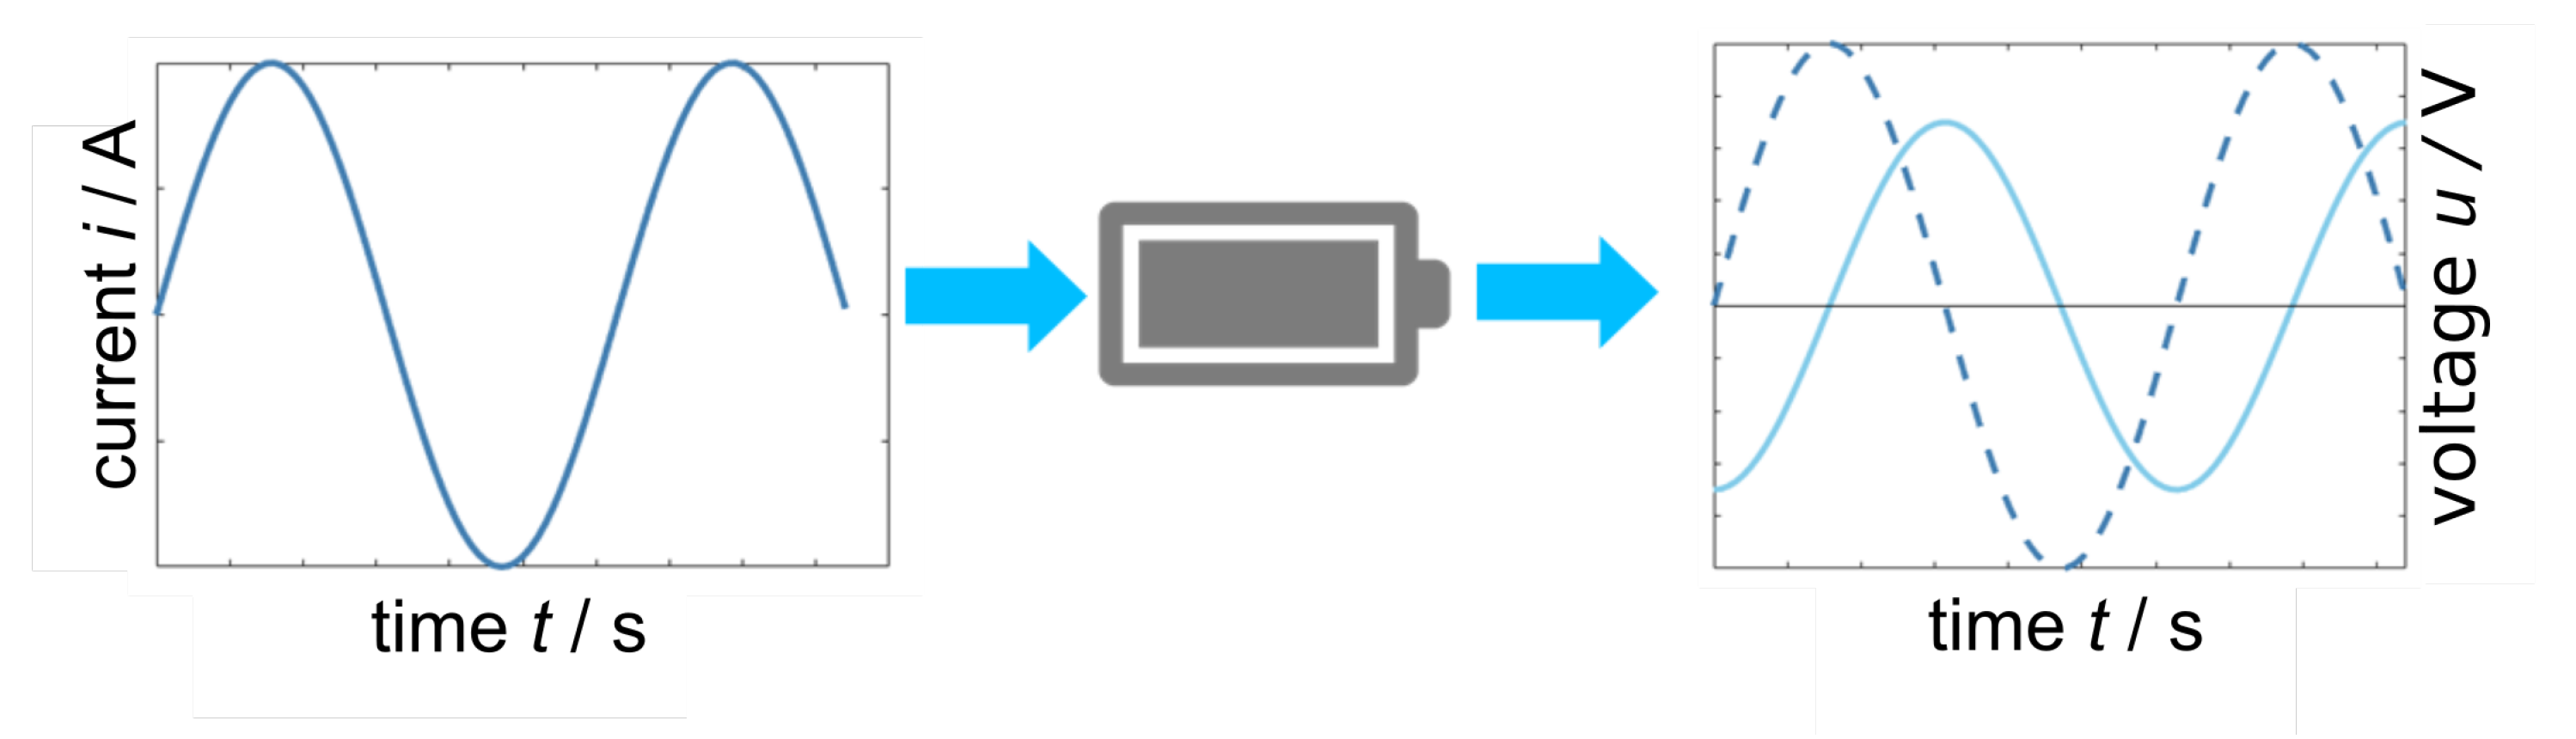
EIS involves a non-destructive technique for characterizing electrochemical systems by applying a sinusoidal excitation and measuring the corresponding response, as shown in
Figure 3.
The impedance was calculated using the complex voltage, complex current and the phase shift between those values:
and from the complex impedance equation, the real part
R and the imaginary part
were calculated. Applying AC currents at different frequencies (usually between 10 kHz and 10 mHz) creates an electrochemical impedance spectrum. The results of an EIS measurement are usually plotted in a Nyquist plot, as shown in
Figure 4.
In order to test the performance in different loading conditions and guarantee charge conservation, the galvanostatic mode was chosen. All EIS measurements were performed using a Gamry reference 3000 AE potentiostat multiplexed on a Basytec CTS. Each internal process can be allocated a characteristic time constant. Therefore, the operating frequency range was varied between 1 Hz and 10 kHz with 15 frequencies per decade (61 frequencies in total). Moreover, the frequency band is limited to the change of charge while running a possibly superimposed current. As a compromise, the AC current was set to a C-rate of 1/10 C for all measurements, in order to guarantee linearity while achieving a good noise-to-signal ratio. The temperature was controlled by a Memmert ICP 110 thermal chamber ( K). The SoC adjustment was performed by charging/discharging with constant current/constant voltage (CC/CV) (current limit: C/30). The selected voltage corresponds to the open circuit potential. For measurements with superimposed DC current during the EIS measurements, the SoC was set to be 5% higher than the SoC of interest by CC/CV. From there, the cell was discharged by CC with the same value of current, which was used for the superimposed EIS measurement. After reaching the target SoC, the EIS measurement was performed without relaxation, to simulate dynamic working conditions.
To make sure that the presented results can be generalized, cells of different types, such as cylindrical high power and prismatic high energy cells, were investigated. To evaluate the impact of the cell to cell variance, at least nine cells per cell type were measured using the same load. The investigated cell types are shown in
Table 1.
2.1.1. Temperature Estimation
Investigations were performed on the Samsung INR18650-15L1 1500 mAh lithium ion cells. Therefore, 36 cells at different SoHCs (SoHC = state of health regarding actual capacity to nominal capacity
) were used. The cells were aged by cycling (at
C, constant current charge at 2C, discharge at 3C) using a PEC ACT0550. More detailed information about the SoHC of all 36 cells is shown in
Table 2.
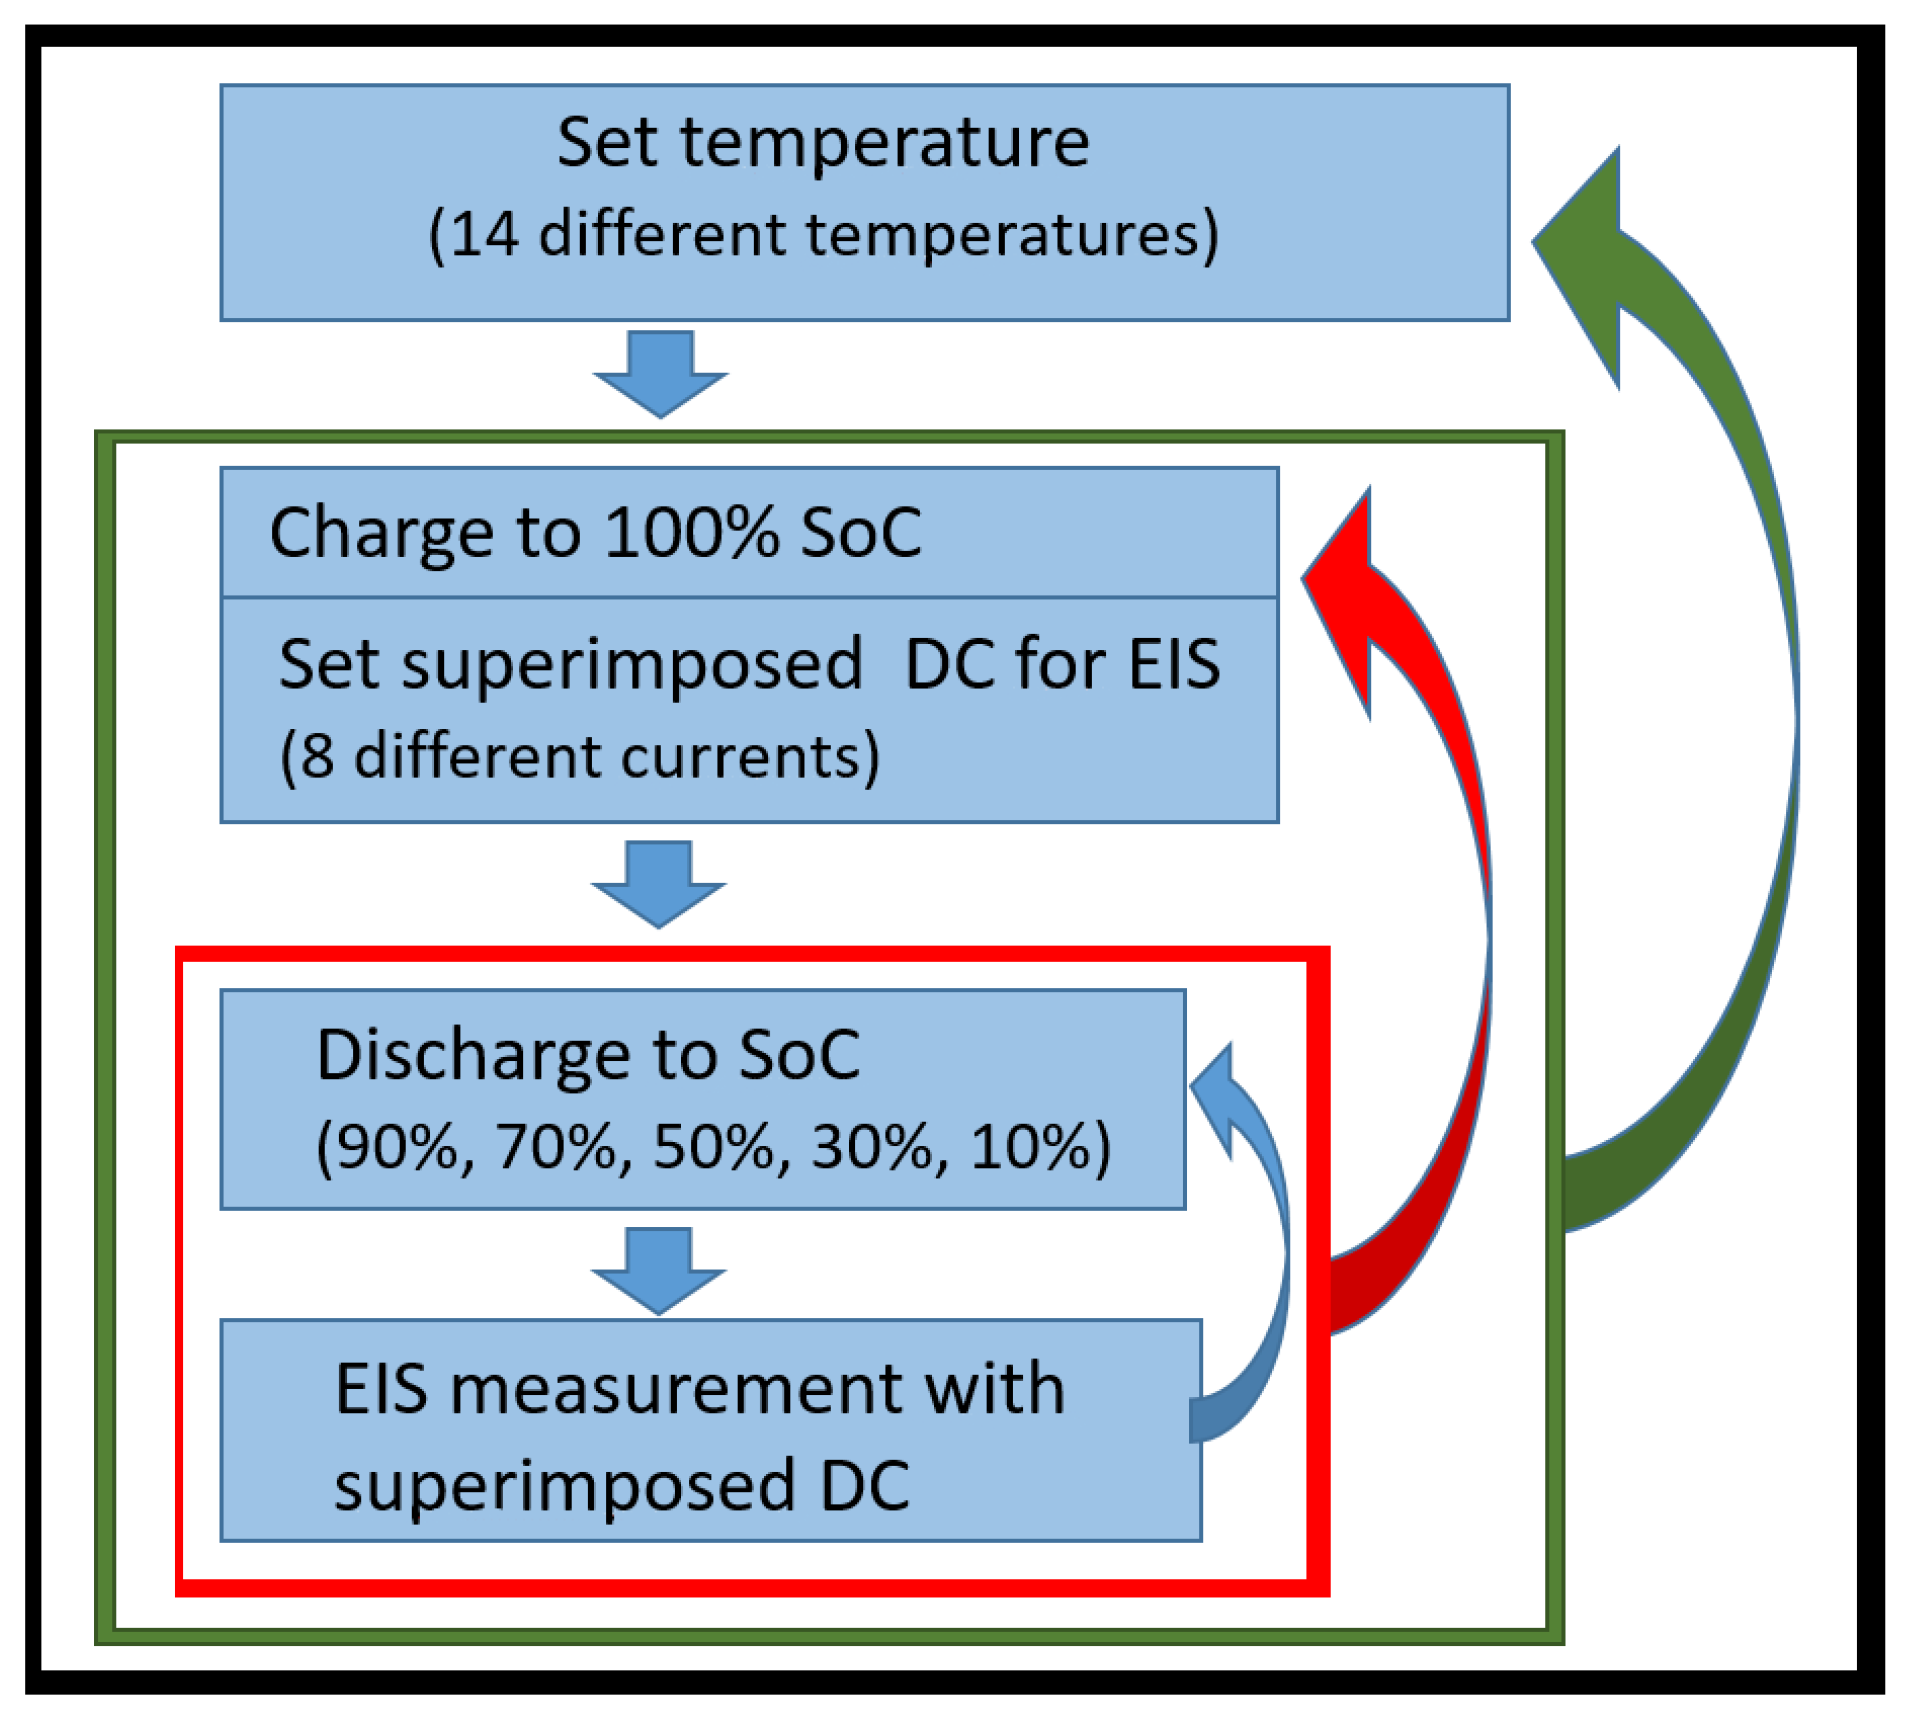
Figure 5 shows the measurement procedure. EIS measurements were performed at 14 temperatures (
T in
C: 10, 15, 20, 25, 30, 35, 40, 45, 50, 52, 54, 56, 58, 60), with 5 different SoCs for each temperature (SoC: 90%, 70%, 50%, 30%, 10%).
For each temperature and SoC state, EIS measurements were performed with 8 different superimposed DC-currents (C-rate: 0C, −1/4C, −1/2C, −3/4C, −1C, −3/2C, −7/8C, +1C). For the training and testing process, a multi-dimensional dataset was created by performing more than 20,000 EIS-measurements at different states. A relaxation time of 1 hour was used after changing the temperature to ensure that the cells were at the same temperature as the thermal chamber. To simulate a real application, there was no relaxation time between charging/discharging and EIS measurements.
A shorter series of measurements for the temperature estimation were created on the Panasonic NCA 103450 (9 cells SoHC = 100%, mAh, prismatic high energy) and on the Sony US18650VTC6 (9 cells SoHC = 100%, mAh, cylindrical high energy). The temperature was varied from 10 to 50 C in 5 K steps. For each temperature, the SoC was varied from 10% to 90% in steps of 20%. For each temperature setting and SoC state, EIS measurements were performed with 4 different superimposed DC-currents (C-rate: 0C, −1/4C, −1/2C, −1C).
2.1.2. State of Charge Estimation
The SoC estimation was performed for all cell types shown in
Table 1. The SoHC of every cell was nearly 100%. EIS measurements were performed at 4 different temperatures (20, 25, 30, and 35
C). To take the charging/discharging history (hysteresis) of the cells into account, the cells were discharged in steps from 95% to 5% (in total 36 SoCs: 95%, 92%, 90%, 87%, 85%, 82%, …, 5%) and then went through the same SoCs for charging (again 36 SoCs). During the EIS measurement, there was no DC applied, but only an AC of C/10.
2.1.3. State of Health Estimation
The SoHC estimation with respect to total capacity (SoHC =
) was performed only for the Samsung INR18650-15L1 cells. To generate the training data, three lithium ion cells were aged by cycling (at
C, constant current: charge at 2C, discharge at 3C, 1400 cycles) using a Basytec CTS. After every hundredth cycle, the capacity was determined (charge constant current C/10 constant voltage C/20, discharge constant current C/10) and EIS measurement was performed (at 25
C, at 70% SoC, 0C DC-current). The data of the investigated cells are described in
Section 2.1.1 (at 25
C, at 70% SoC, 0C DC-current).
2.2. Artificial Neural Network Architecture
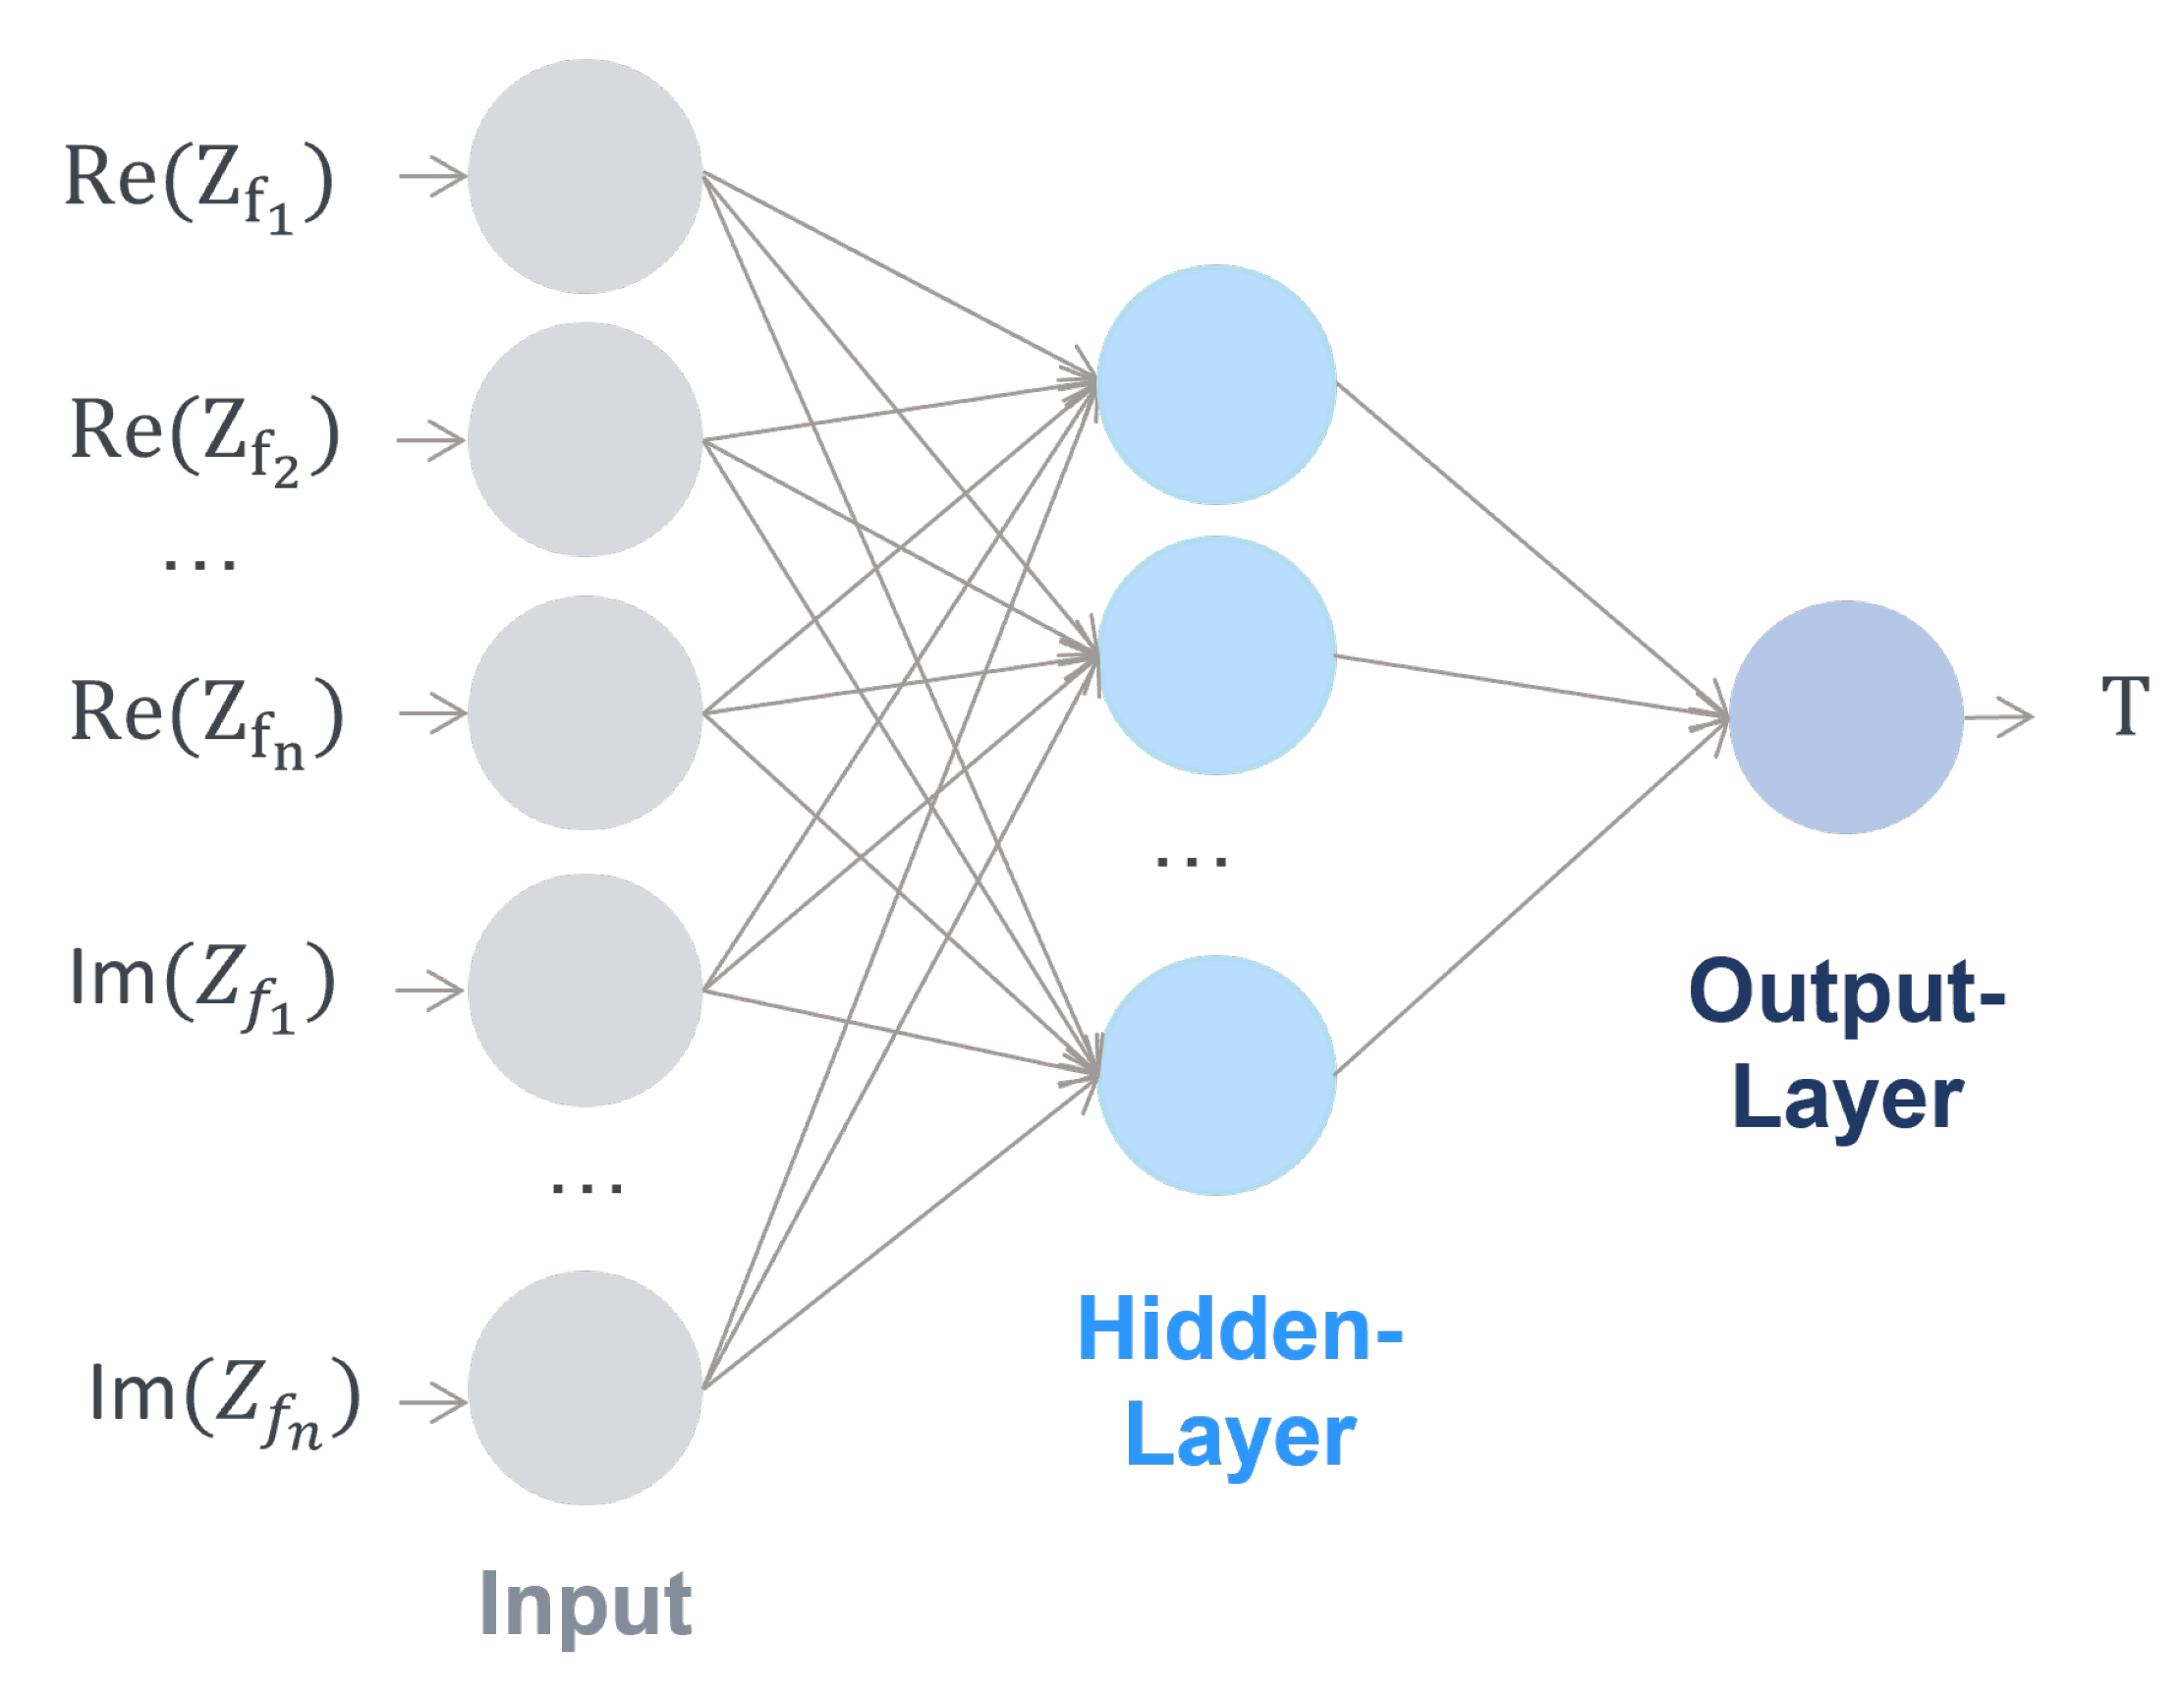
The ANN used in this study is based on the MATLAB NN toolbox. The architecture consists of a feed forward architecture with a single output depending on the state of interest (temperature, SoHC, SoC), as shown in
Figure 6 .
The used ANN is subcategorized into three main layers: input layer, hidden layer and output layer. Each neuron is connected with a neuron at the following layer in the forward direction. In the context of this work, the number of hidden layers was limited to a single layer. When the number of hidden layers used is more than one, the network is a deep neural network. Within the layer, the number of neurons was varied. In order to determine the optimal number of neurons, a grid search approach was used, where the number of neurons was continually increased until the prediction accuracy was no longer improving without restricting the generalization ability. The number of neurons within the hidden layer is presented in the discussion for each investigated case separately. In the hidden layers, a hyperbolic tangent sigmoid transfer function is used, which is given by:
As an input parameter, the real or imaginary portion of the EIS measurements with respect to the frequency domain was used. The training dataset was selected in such a way that the generalization of the battery cell variance can be verified and validated. The bias values and weights were updated according to two different optimization strategies: Bayesian regularization backpropagation optimization (BRBP) and Levenberg–Marquardt backpropagation optimization (LMBP). The prediction accuracy was assessed using the root mean square error and the coefficient of determination. The code was developed based on ANN toolbox.
3. Results
The following discussion shows the results of the state estimations of the temperature, SoC and SoHC predictions. Note that the test dataset was separated from the training dataset before training the neural network in order to ensure that the test data were completely unknown to the ANN.
3.1. Temperature Estimation
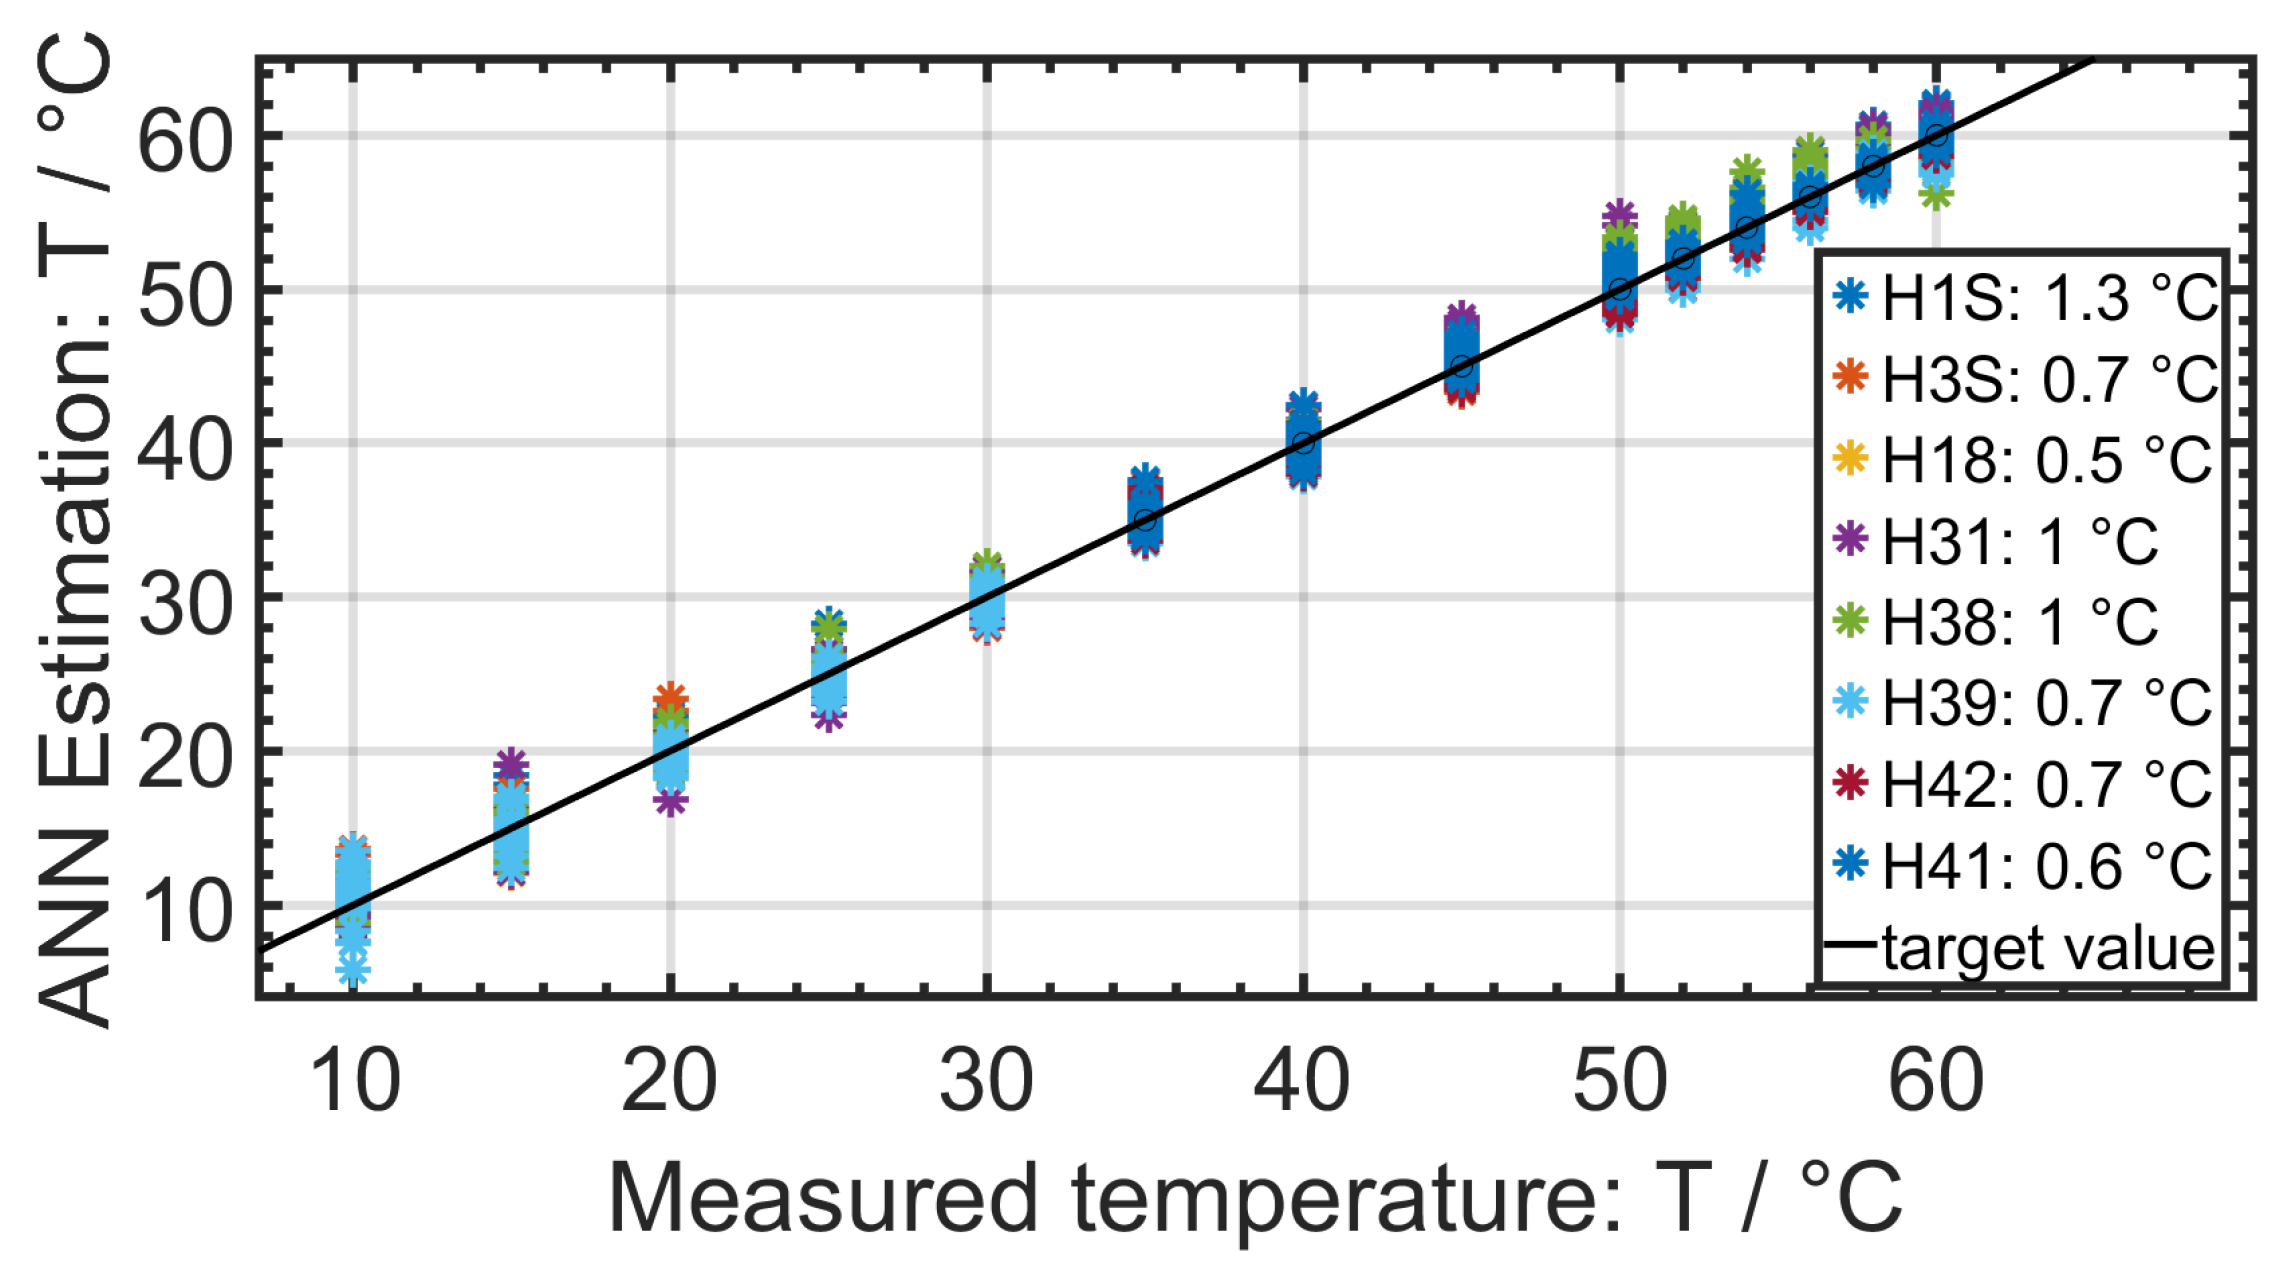
Figure 7 presents more than 4000 temperature estimations by the neural network for the EIS data of eight Samsung INR18650 15L1 cells at five different SoCs, eight superimposed DC currents during the EIS measurements and different SoHCs. The SoHC of each cell is shown in
Table 2. For each investigated SoHC, two cells were selected for testing. By including various DC currents, SoHCs and SoCs, the realistic performance of a cell was simulated. The overall root mean square error (RMSE) was less than 1 K. The maximum RMSE for a single temperature estimation was about 5 K.
Only the real part of the impedance was used as an input parameter, since the influence of the temperature was much greater on the real part than on the imaginary part, as shown in
Figure 1. A combination of real and imaginary parts and only using imaginary part as input were investigated. However, as expected, the temperature estimation became more inaccurate when using the imaginary part. For the presented results, the actual SoHCs, the SoCs and the applied DC current during the EIS measurement were used as input parameters. The ANN was able to estimate the cell temperature without additional input parameters. However, the time required to train the ANN increased significantly, and the overall RMSE increased to 1.5 K. During the measurements, there were no temperature sensors attached to the cells. The temperature was taken directly from the thermal chamber. The self heating effect in Samsung 18650-15L cells by applying DC current was not taken into account for the state estimation. When using temperature sensors within the cells, center measurements showed that the temperature difference between the center and the surface was less than 2 K. For our proof of concept study, this temperature discrepancy was assumed to be negligible, since every measurement was performed in the same way. The results show that in general the ANN was able to estimate the temperature from a corresponding EIS spectrum.
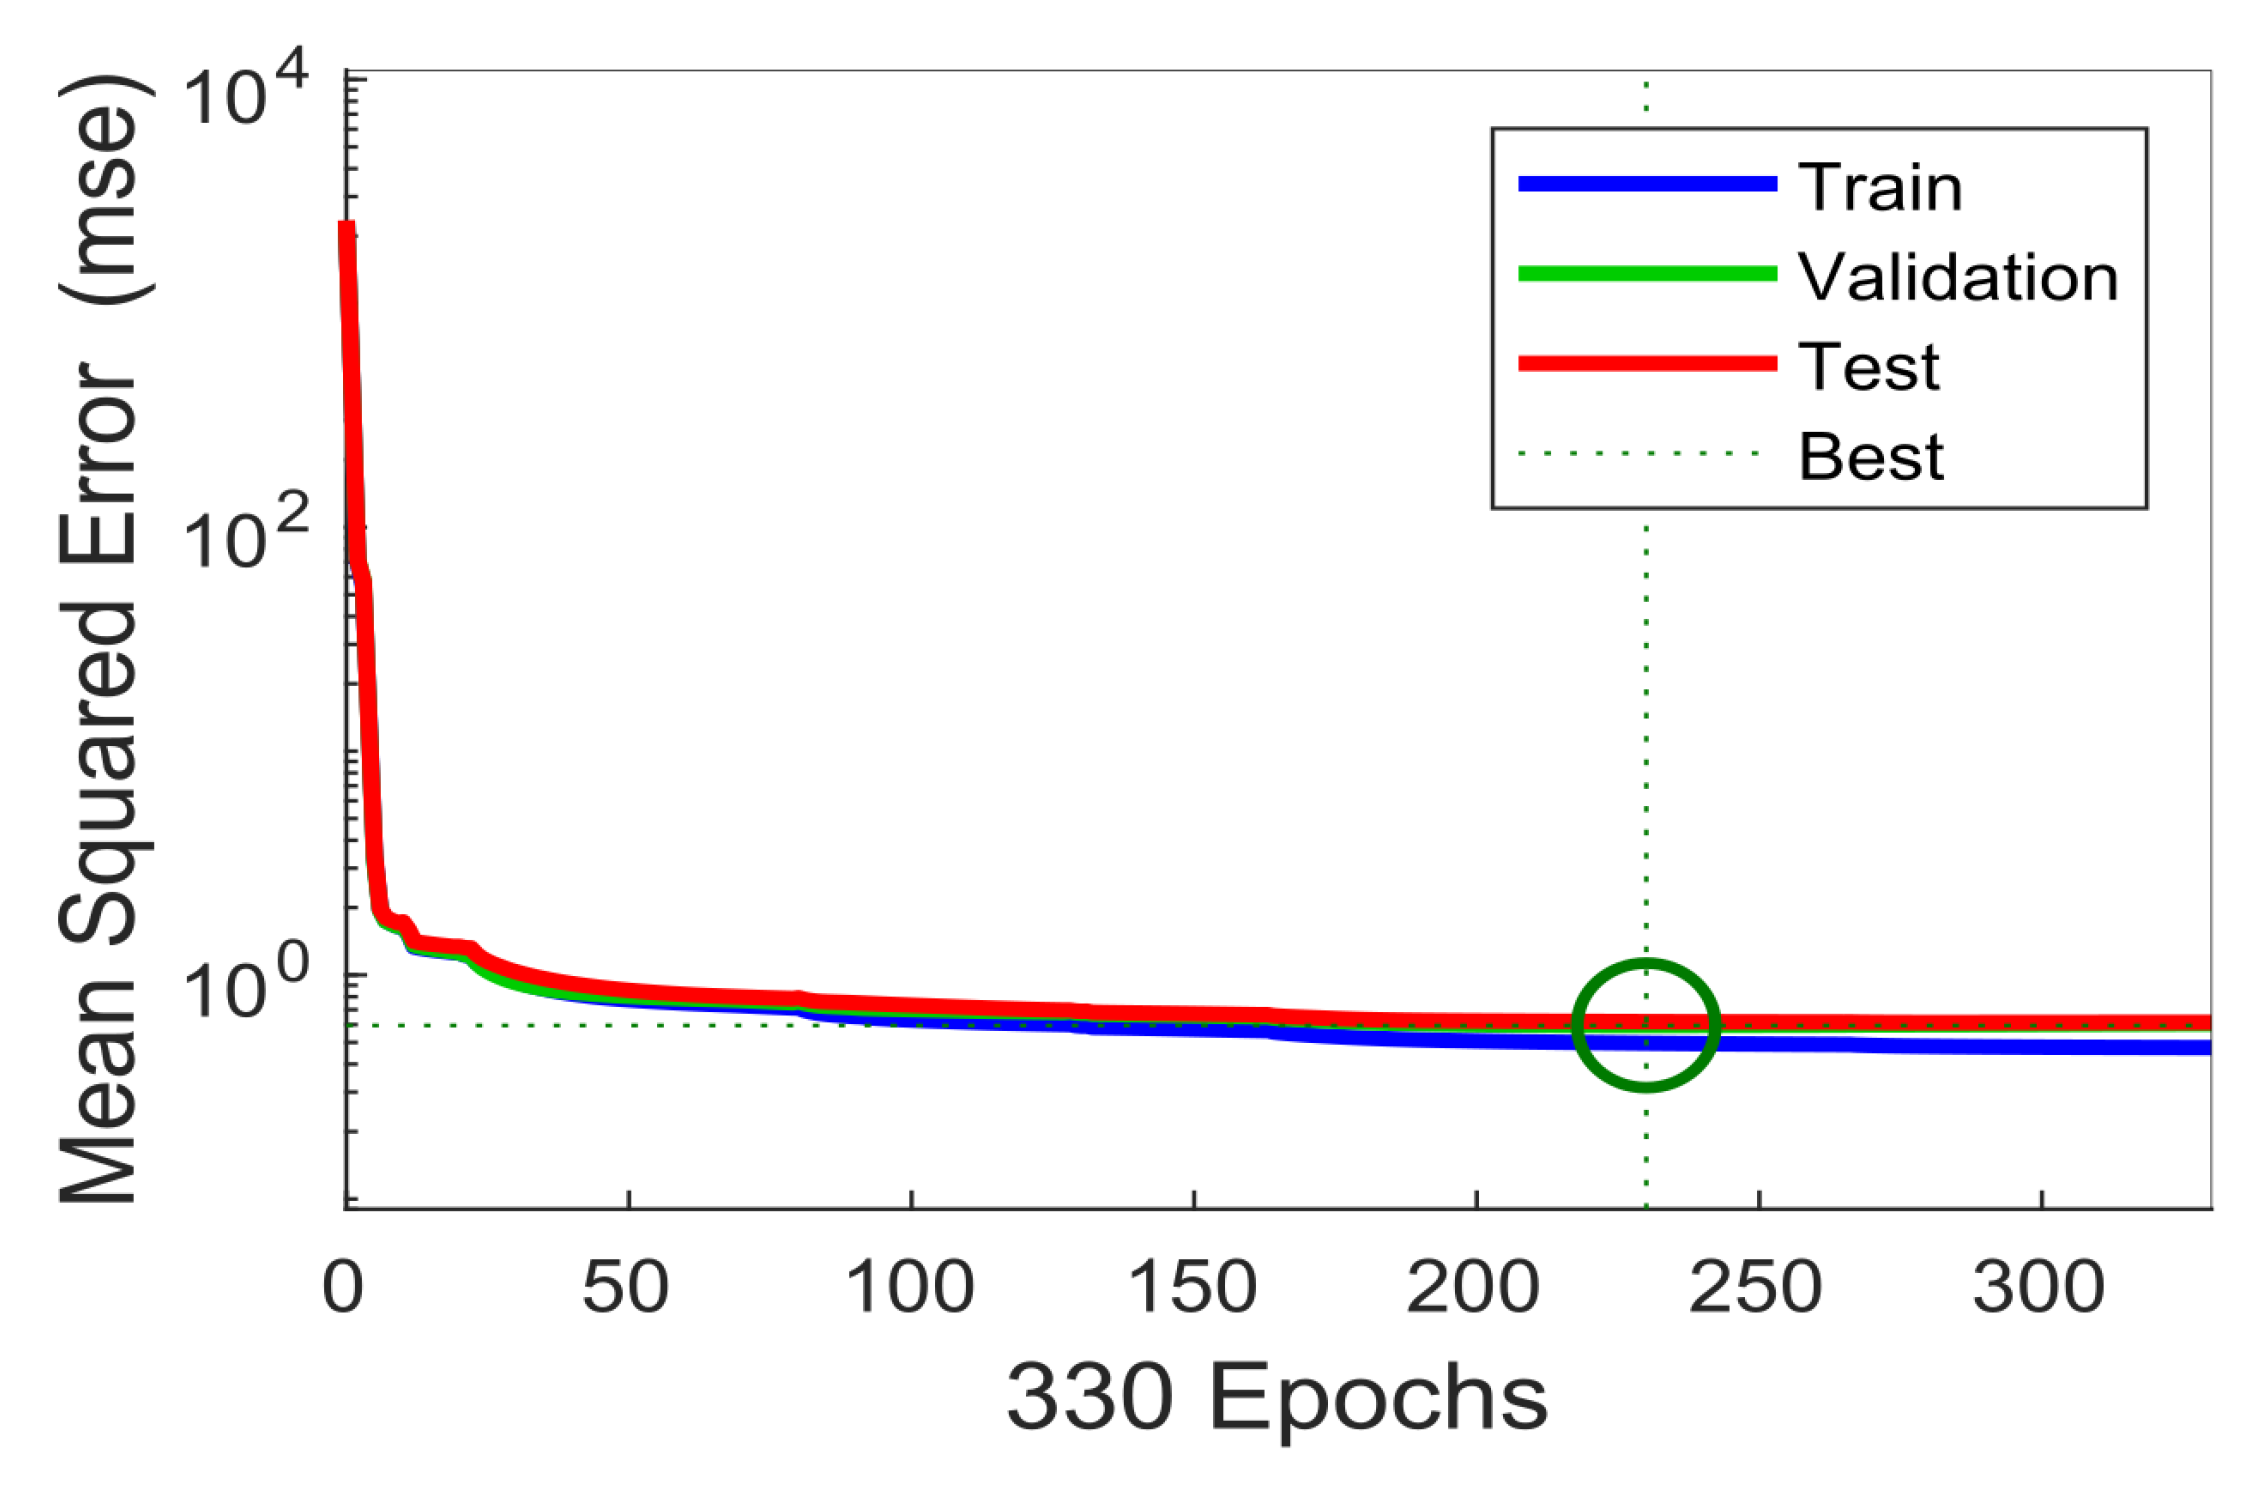
Figure 8 shows the evolution of the ANN during training. After 230 epochs, the RMSE reached its lowest value and was stabilized. The RMSE evolution was used to find a suitable configuration of the ANN. For the presented results, only one hidden layer consisting of 11 neurons within the hidden layer was used in a Bayesian regularization-backpropagation neural network. Using more than 11 neurons in the hidden layer had a tendency to overfit.
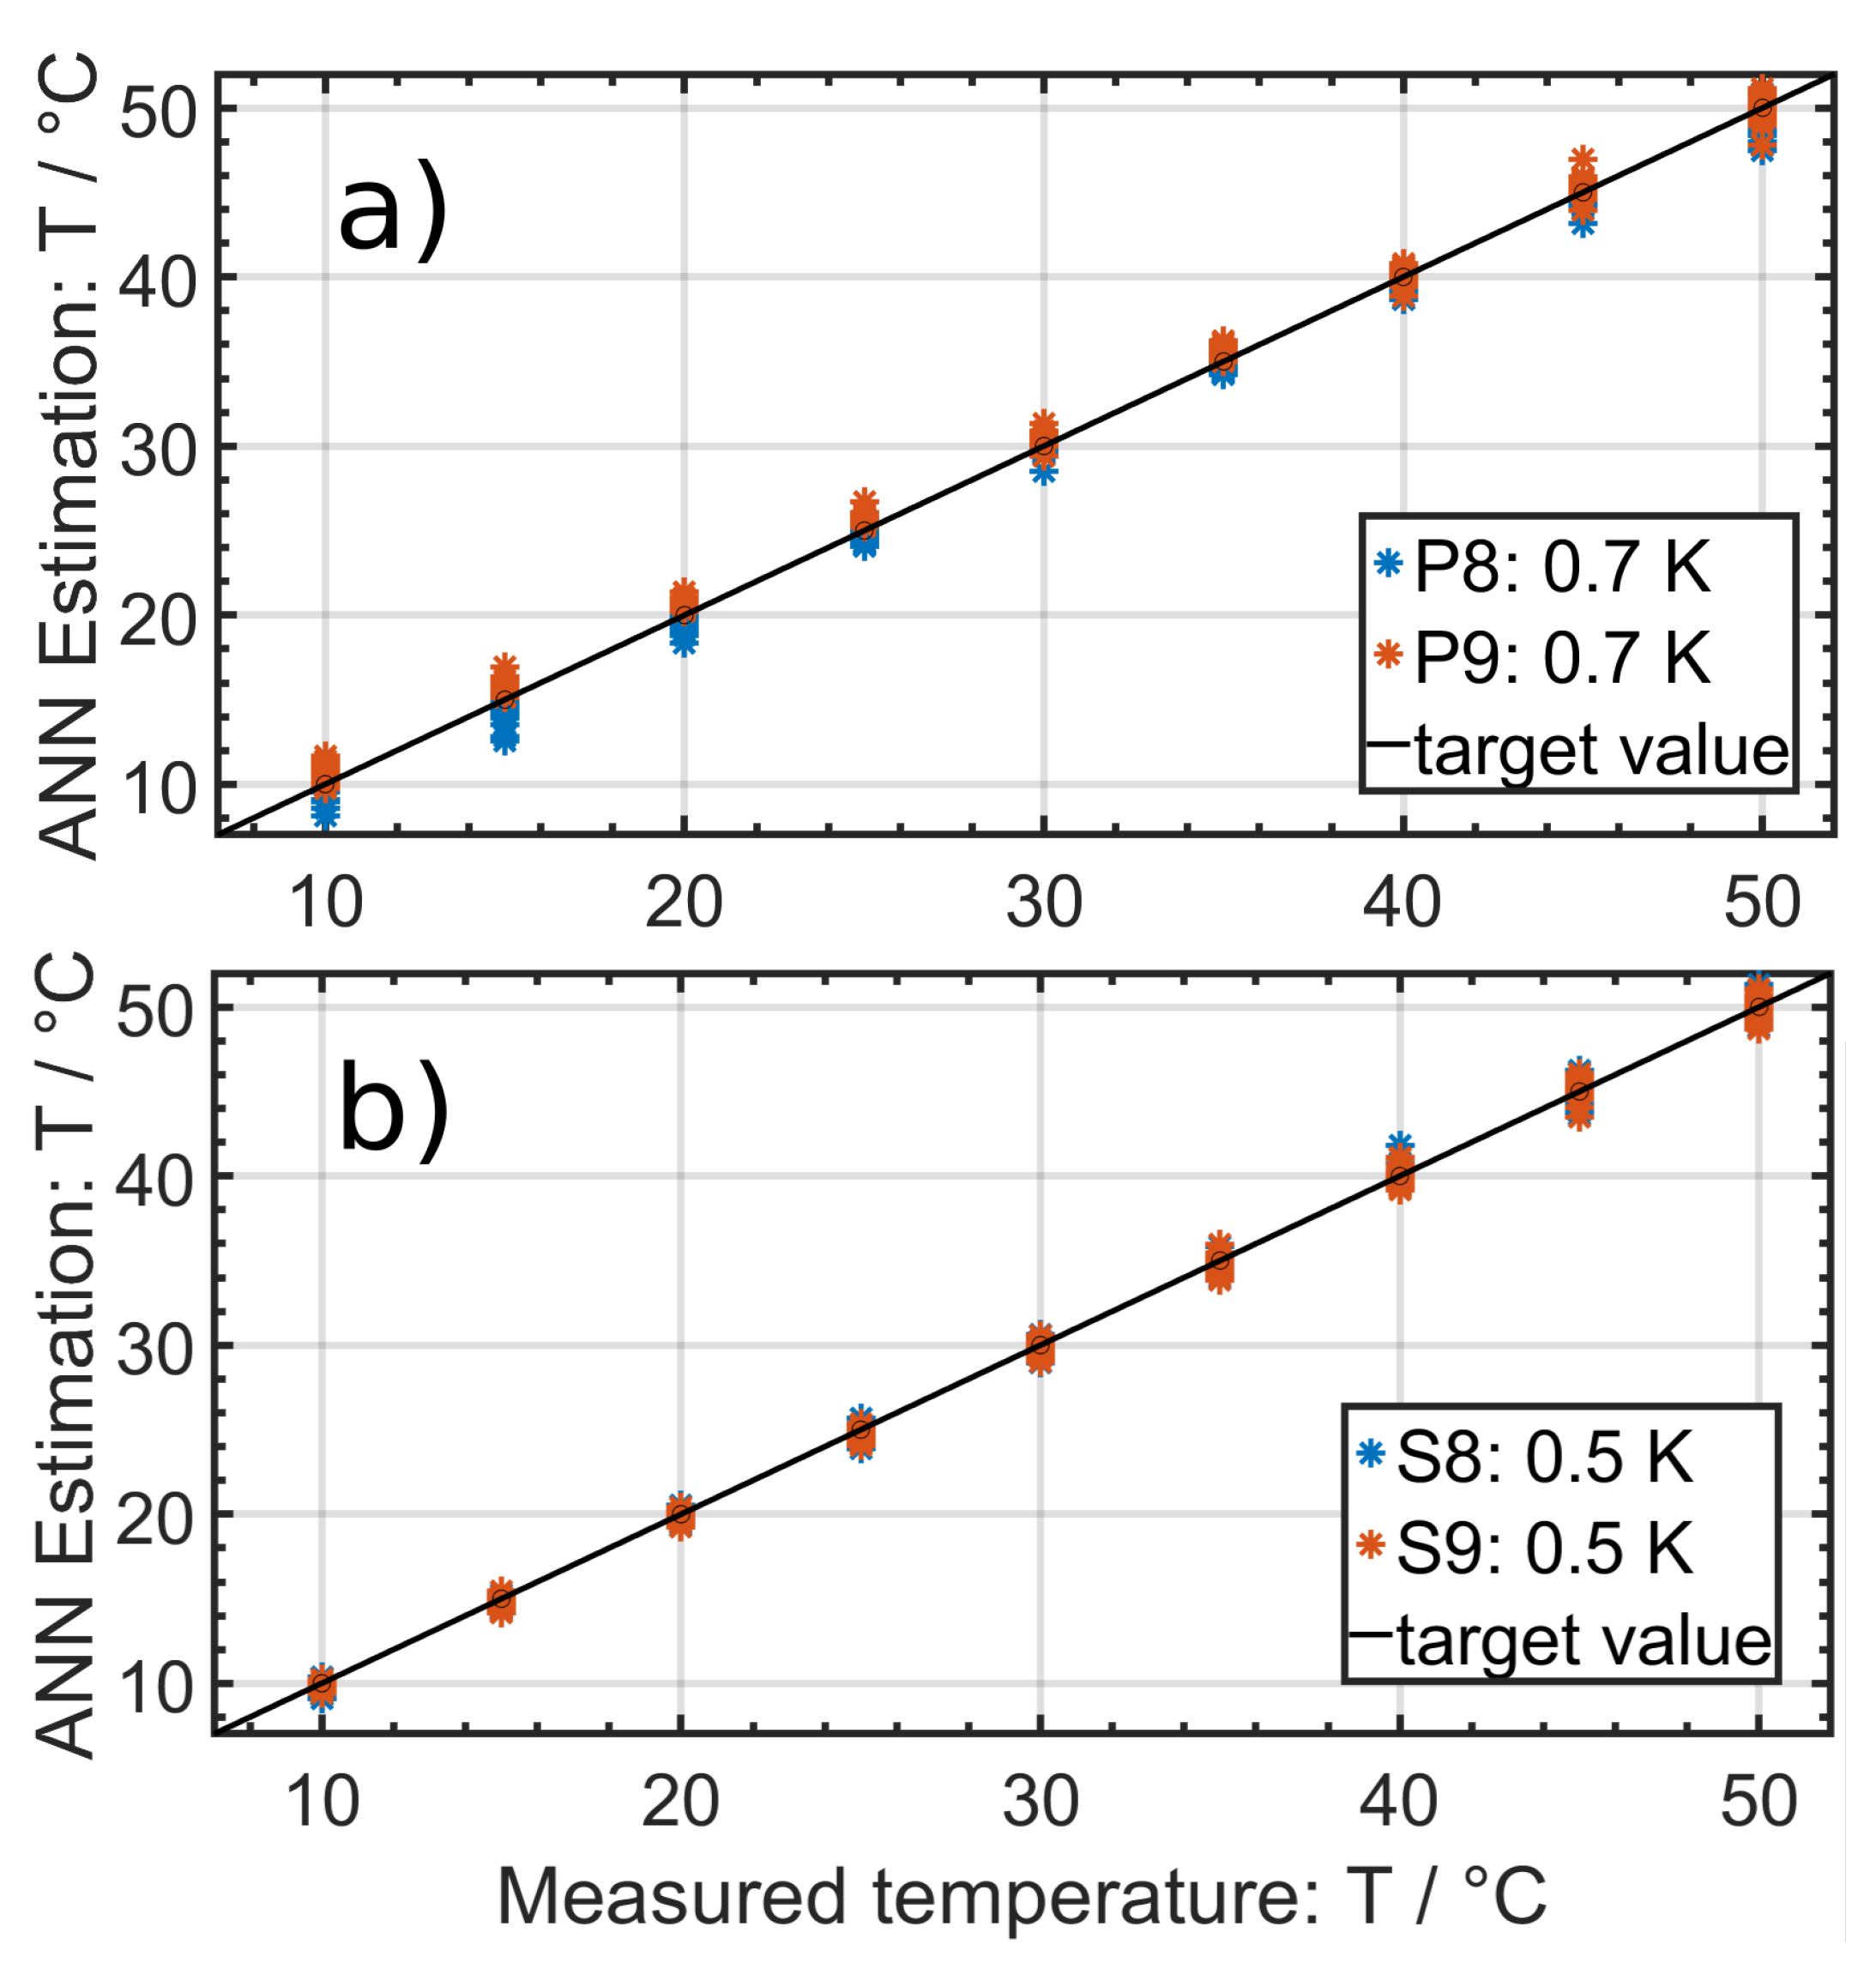
Additional investigations were performed on prismatic Panasonic NCA 103450 high energy cells and cylindrical Sony US18650VTC6 high energy cells to show that the presented method is independent of cell geometry and cell type (high energy/high power).
Figure 9a presents the results for the Panasonic NCA 103450 cells with an overall RMSE of 0.7 K, and
Figure 9b shows the results for the Sony VTC6 cells with an overall RMSE of 0.5 K. Each figure shows 360 temperature estimations at different SoCs and different applied superimposed DC currents. For both cells, a Bayesian regularization-backpropagation neural network with one hidden layer consisting of five neurons was used. As input parameters, both the real and the imaginary parts of the impedance were fed to the ANN; the information about SoHC, applied DC current and SoC were restrained.
The SoHC of every Sony and Panasonic cell was about 100%. The temperature estimations for different SoHCs were performed only for the Samsung cells.
Nevertheless, we showed that the temperature estimation by an ANN using EIS data can be realized for different cell types. However, it is necessary to create an individual ANN for each cell type with individual hyperparameters. To finally generalize this method, more cells with different aging profiles and higher DC currents need to be investigated. Due to the self heating effect of the cells through high currents, temperature sensors should be installed within the cells to measure the exact temperature in real time.
The superimposed DC current affects the EIS spectrum, especially at low temperatures. Therefore, the presented ANN method is a powerful tool, especially at high temperatures where the influence of the DC current is reduced. This makes it perfectly suitable for real-life applications. In comparison to other sensorless temperature estimation methods, the main advantages are that there is no need for storing time series data, and that the computational effort is reduced, since there is no need to solve complicated equations, such as partial differential equations. It is suitable for different cell types, and it also takes a superimposed DC current and actual SoHC into account.
The use of EIS data greatly improved the estimation accuracy. Various internal processes in the lithium ion cell show different temperature dependencies. These processes can be allocated to various frequency domains measured via EIS [
24]. For some electrochemical processes in lithium ion cells, the influence of the temperature predominates over the influence of the cell to cell variance. The estimation accuracy can be further improved by adding impedance data at various frequency domains in addition to the cell resistance.
3.2. State of Charge Estimation
The state estimation methodology using EIS data and ANN was investigated for the estimation of the SoC.
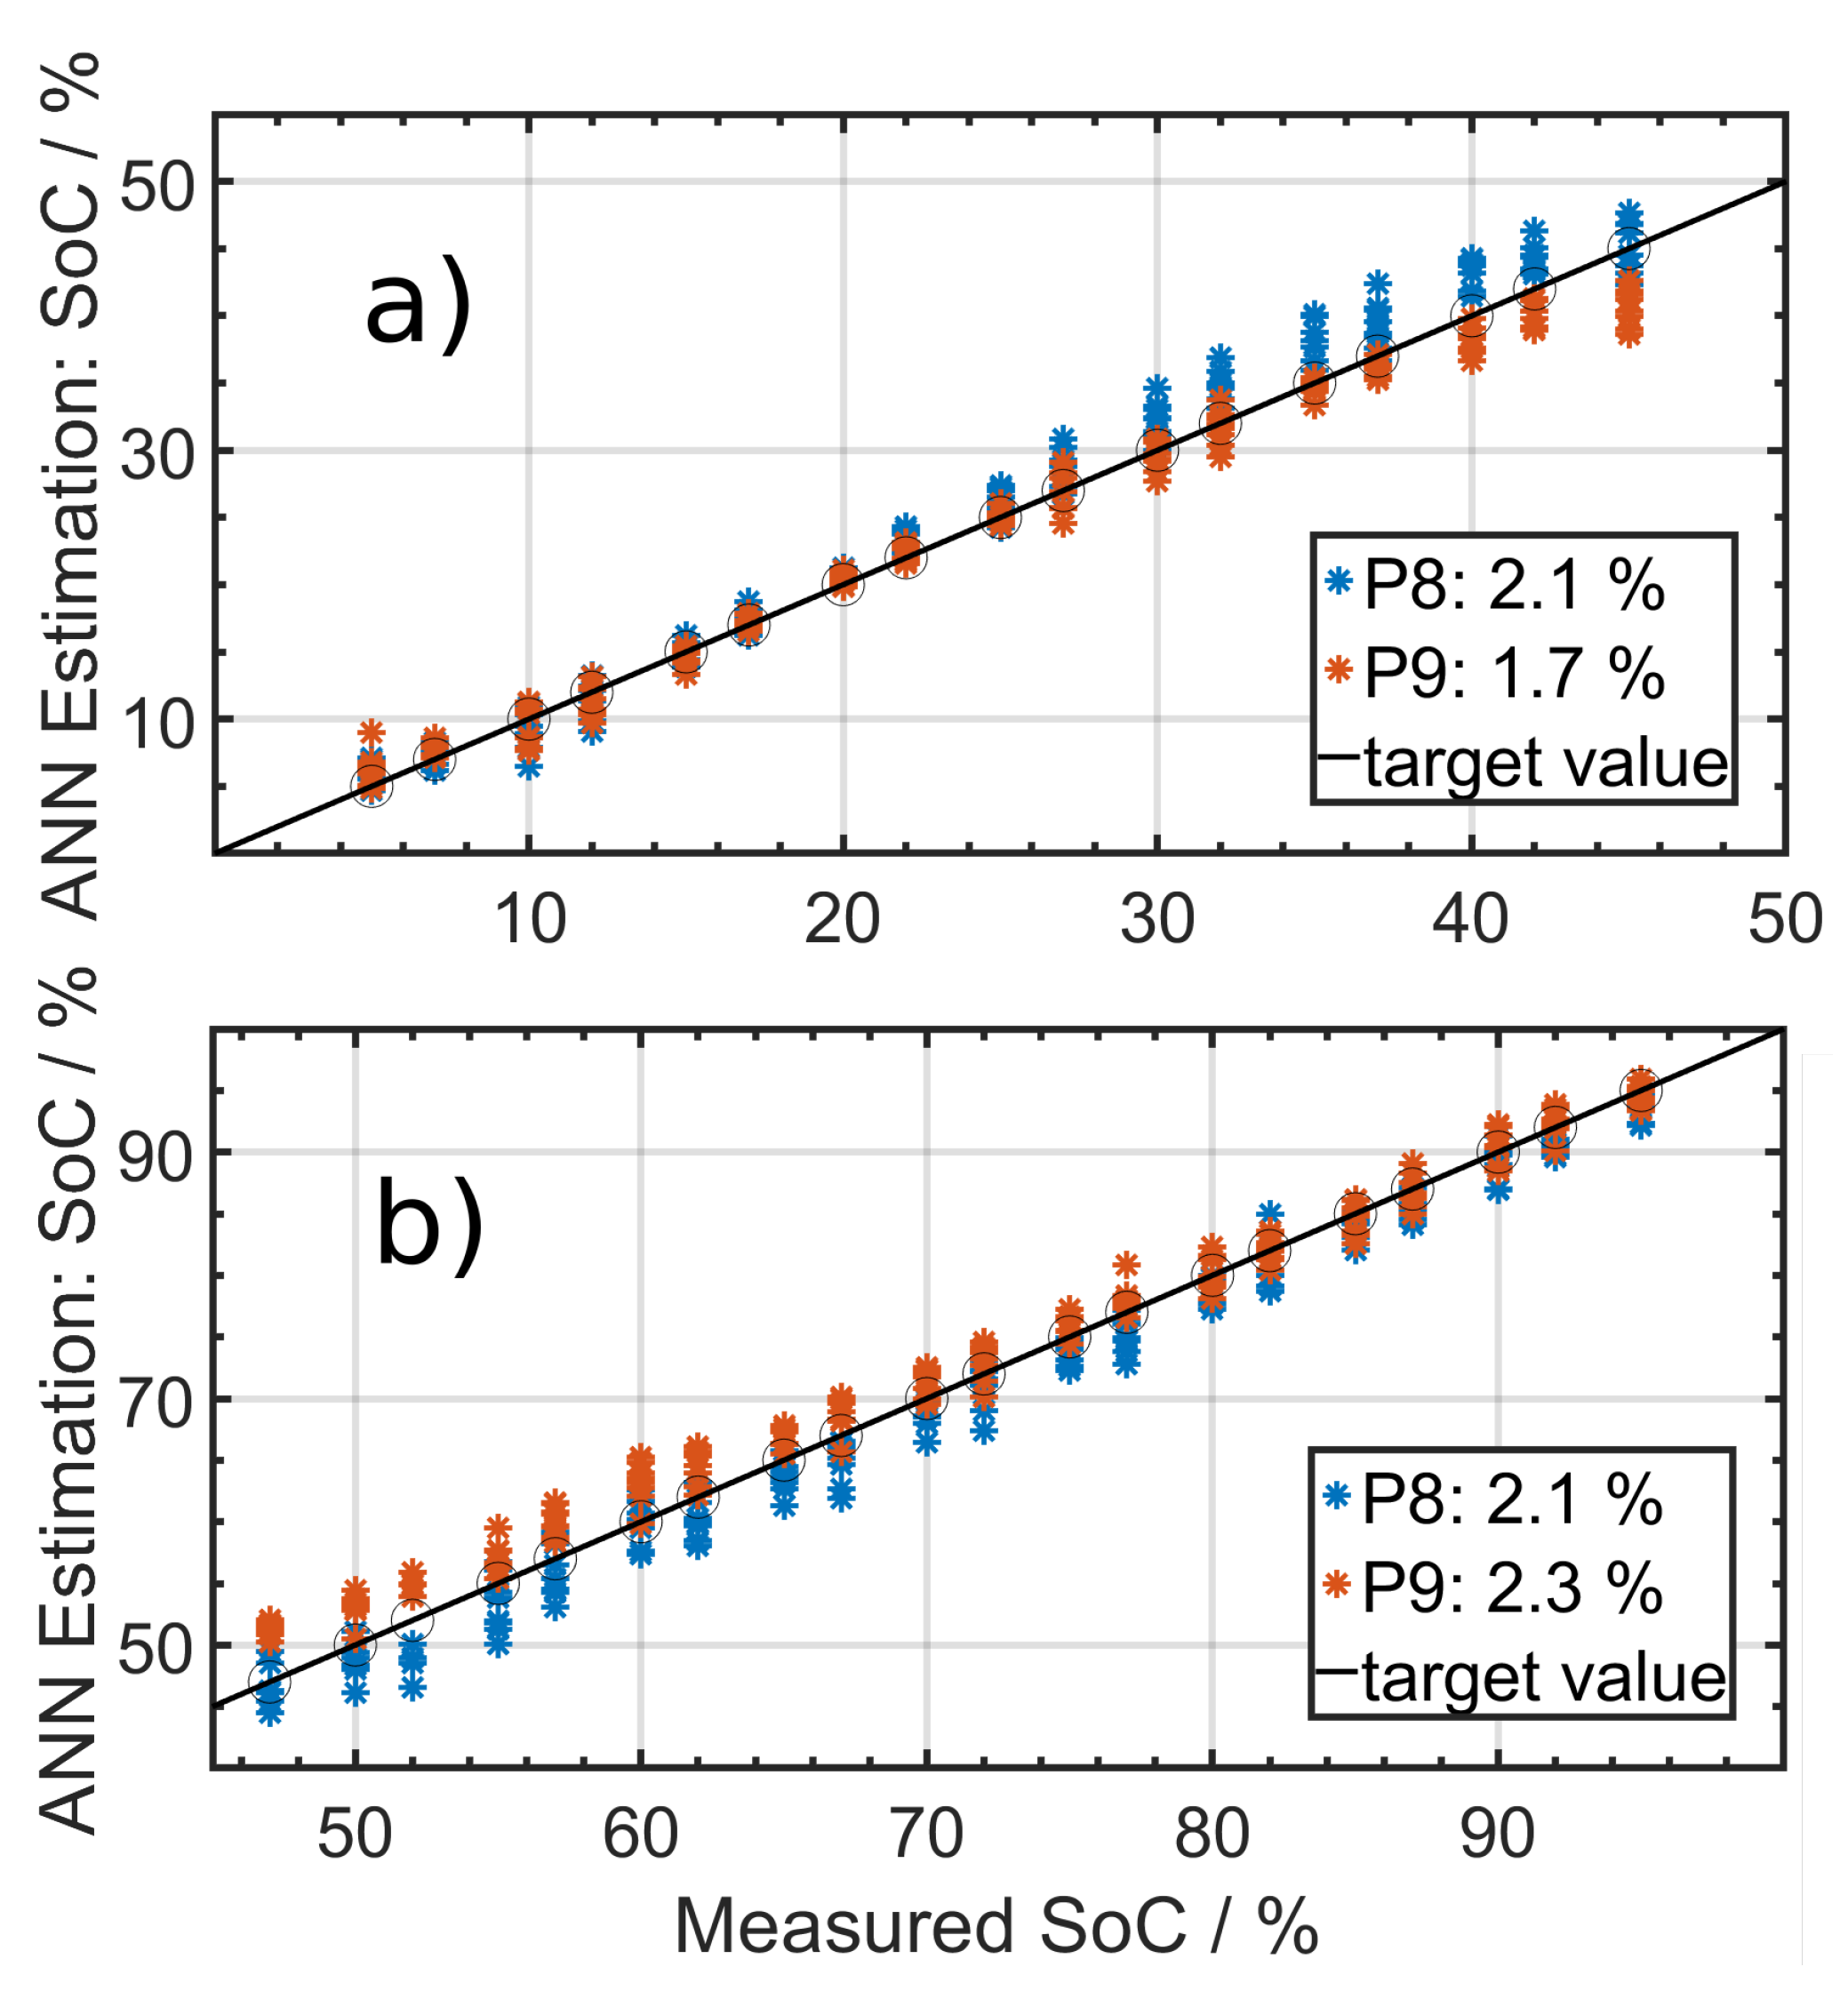
Figure 6 shows the results for the Panasonic NCA 103450 cells. Since the influence of the SoC on the impedance varies, it was necessary to split the SoC into area 1 from 5% to 45%, as shown in
Figure 10a, for which the RMSE was 1.9%; and area 2 from 48% to 95%, as shown in
Figure 10b, for which the RMSE was 2.2%. In both cases, a Bayesian regularization-backpropagation neural network with one hidden layer consisting of four neurons was used. For the lower SoCs, only the imaginary part was used as input parameter, and at higher SoCs the real and the imaginary parts were used. Using only one network for the whole SoC area increased the RMSE significantly.
The RMSE shows higher deviations in the mid SoC range (30–70%), where the EIS data mostly overlap. This makes it harder for the ANN to distinguish SoCs.
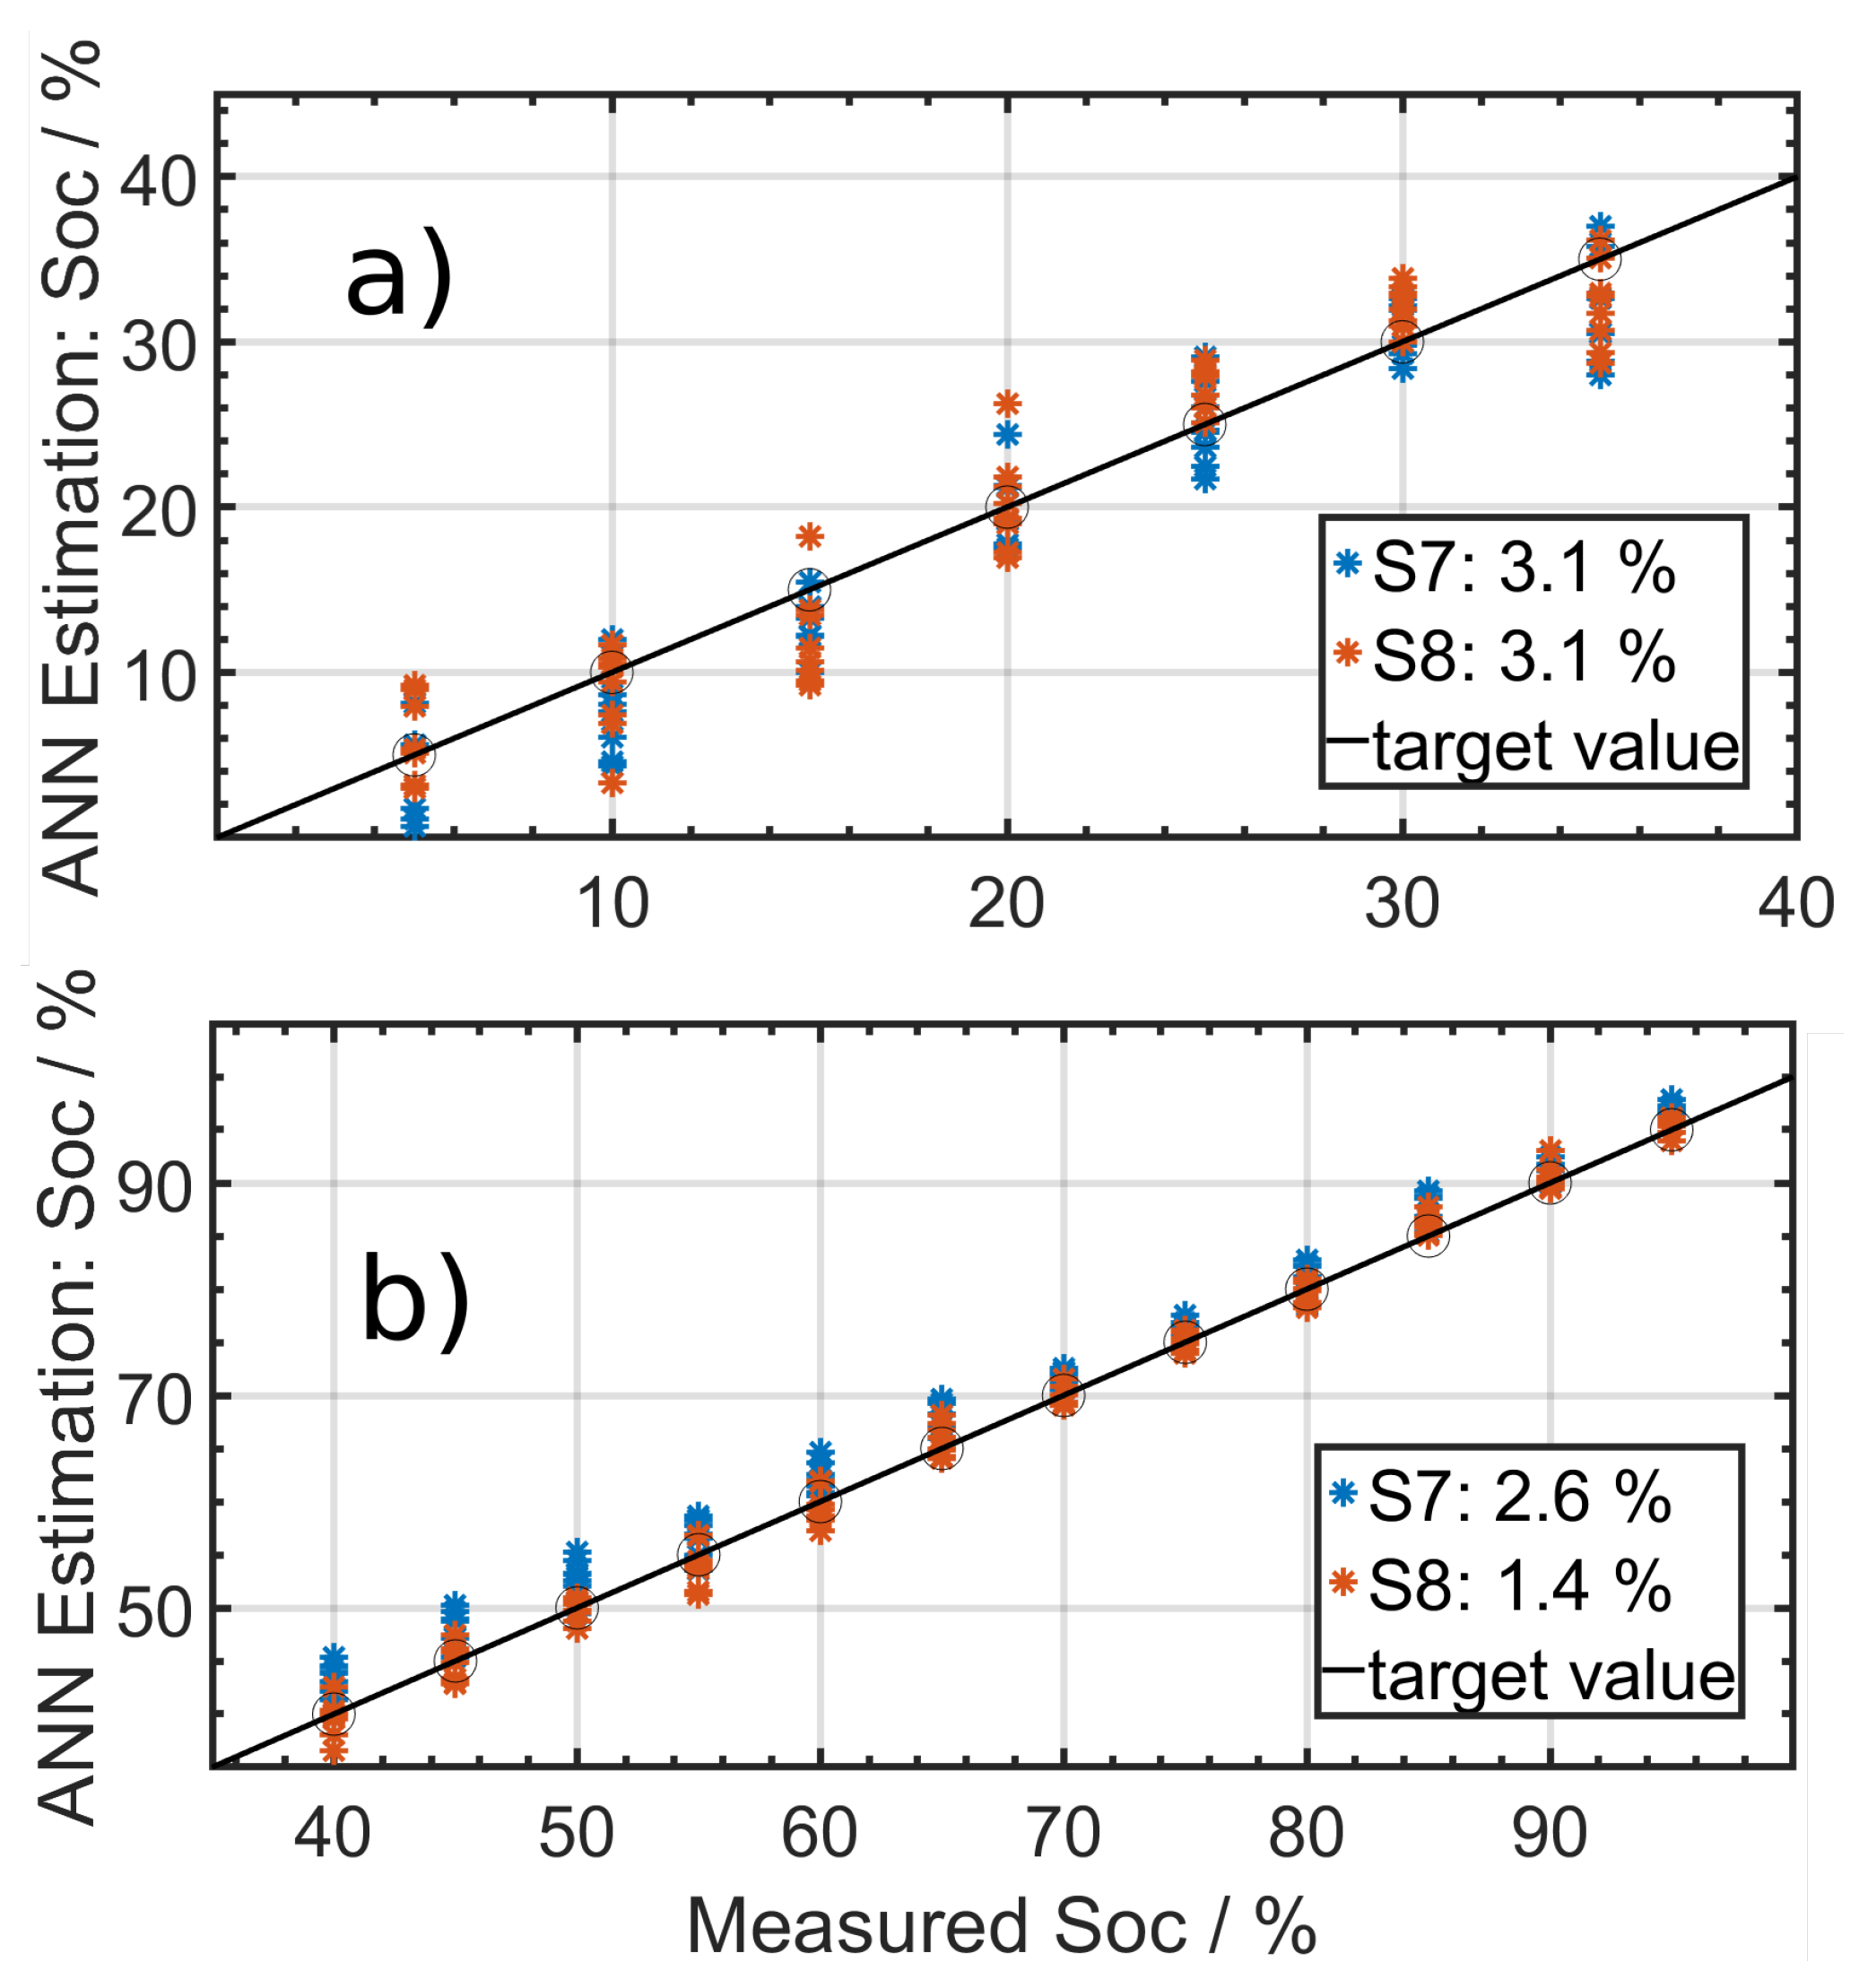
For the Sony VTC6 cells it was also necessary to split the SoC in two areas. For the lower SoCs from 5% to 35% the RMSE was 3.1%, as shown in
Figure 11a.
Figure 11b presents the results from 40% to 95% with an overall RMSE of 2%. In both cases a Levenberg–Marquardt backpropagation artificial neural network with one hidden layer and five neurons was used. Only the real part of the impedance was used as an input parameter.
The RMSE was increased for the estimation of lower SoCs because the impedance varies only slightly with low SoC.
The SoC estimation for the Samsung 15L cells is not shown, since the best overall RMSE was about 8%, with a maximum estimation discrepancy up to 20%, which is not sufficient for any application. This was caused by the influence of the SoC on the impedance spectra being in the same order of magnitude as the influence of the cell to cell variance. The presented results for the SoC estimation clearly show that it is necessary to create an individual ANN for each cell type. If there is a clear dependency between the SoC and the EIS spectra and only a little cell to cell variance, the signal to noise ratio is big enough to allow the state estimation, as shown for the Panasonic NCA 103450 cells.
In general, SoC estimation is much more complex than temperature estimation. The reason is the behavior of the EIS spectra depends on the state. As shown in
Figure 1, an increase in temperature causes a decrease in impedance. The SoC dependency of the EIS spectra varies among different cell types. For some cell types, an increase in SoC causes a decrease in the value of impedance at a low SoC or an increase in value at a high SoC. For such a case, several ANNs for different SoC ranges are required.
The advantages of this method compared to other methods are, again, the little computational effort, since no partial differential equations to be solved and no error-prone parameterization needs to be performed. Furthermore, there is no need for storing and handling time series data. The utilizable capacity of a cell depends strongly on the cell temperature. Therefore, the SoC varies with the temperature. The SoC was calculated by the ANN using an EIS spectrum that is characteristic of the measured state.
3.3. State of Health Estimation
Another interesting application is the estimation of the SoHC with respect to the capacity (SoHC). Therefore, three cells were aged and characterized (EIS and capacity) and used to train the ANN. The cells which were aged and used for the investigation of the temperature estimation were characterized afterwards and used to test the SoHC estimation.
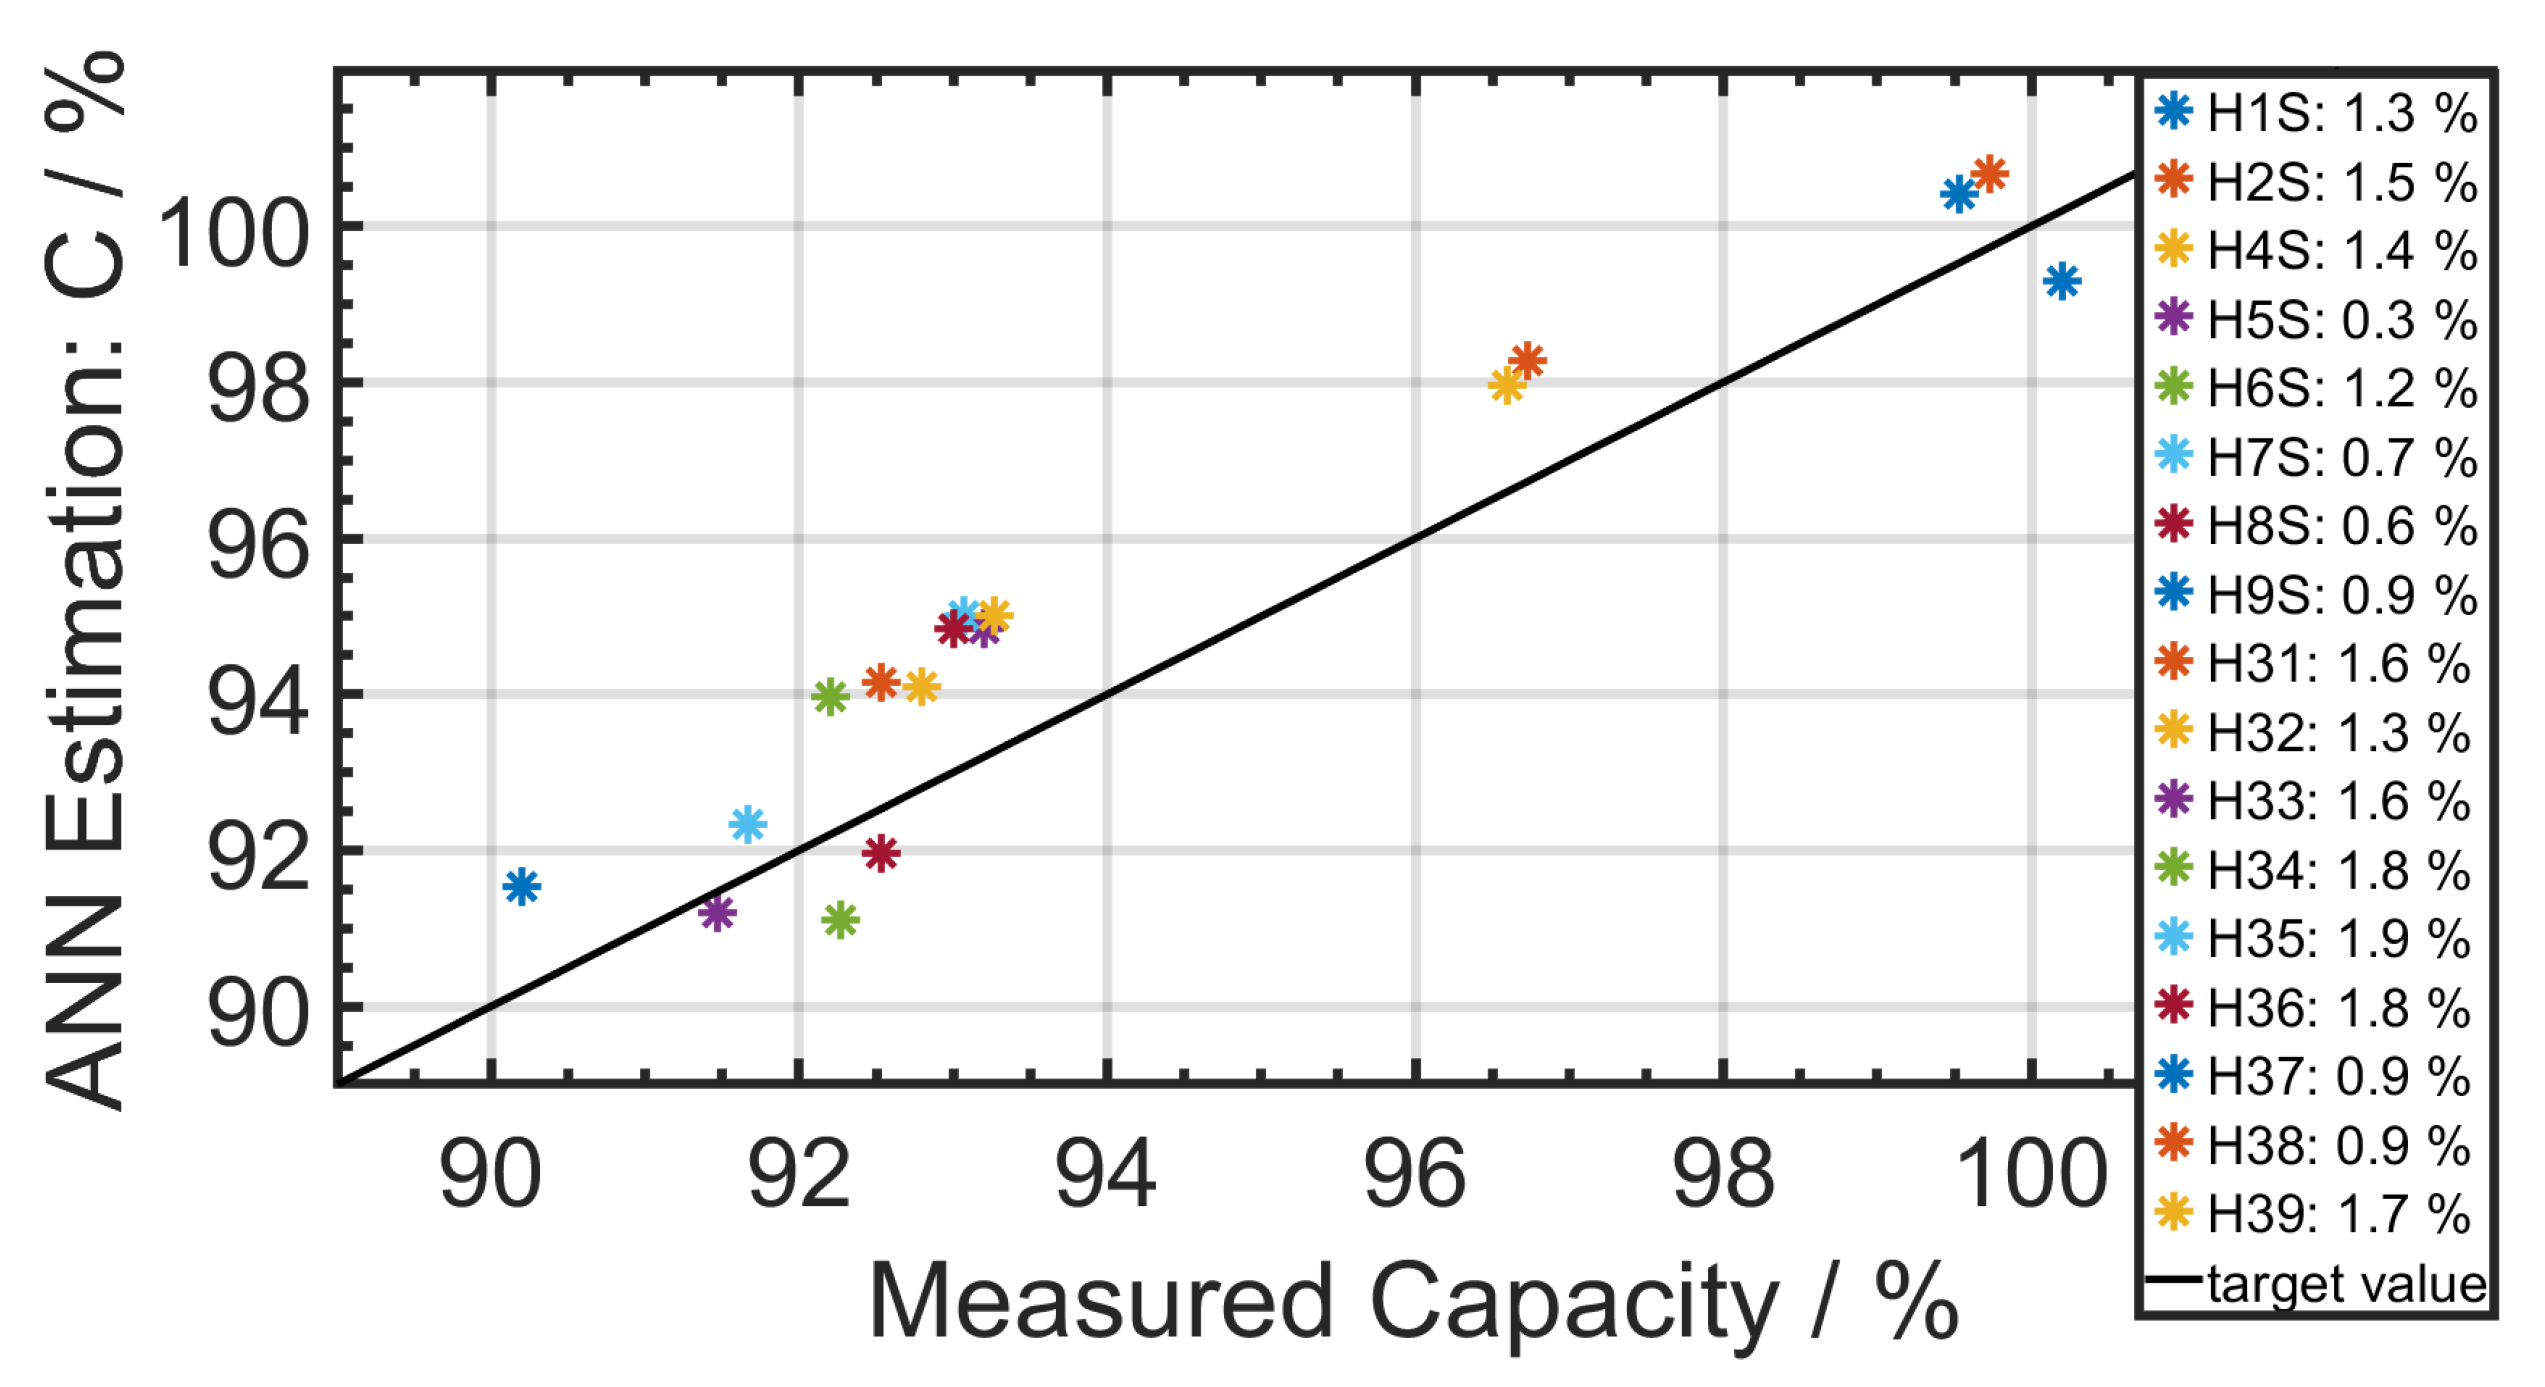
Figure 12 shows the estimated cell SoHC and the measured SoHC. The RMSE for every SoHC estimation was below 2%.
A Bayesian regularization-backpropagation neural network with one hidden layer consisting of four neurons was used. Both the real and the imaginary part of the impedance were used as input parameters. We were unable to estimate the SoHC at the very beginning of life because the shape and the value of the EIS spectrum varies strongly for the first cycles. The impedance spectrum first decreases and than increases. After a number of cycles, stabilization of impedance growth was achieved, as shown in
Figure 2. Only the data of cells which performed 100 or more cycles were used. Since the cells that were used to collect the training data were characterized only for 1400 cycles, data from cells with more cycles could not be used for testing, because the ANN is not able to extrapolate. The aging profiles of the cells that were used to collect training data and the cells for the test data were partially comparable. After aging, the testing cells experienced further aging during measurements at different temperatures and currents. Nevertheless, to generalize this system it will be necessary to investigate the presented state estimation method with data from different aging profiles. The advantage of the SoHC estimation method compared to other algorithms is the ability to estimate the total utilizable capacity from an EIS spectrum within a few seconds. Unlike the current pulse method where only one data point is determined, the impedance spectrum offers many data points belonging to a single state. That increases the estimation accuracy and reduces other influences, such as that of contact resistances.
3.4. Further Discussion
We have developed a sensorless ANN-method based on EIS data to estimate the temperature of a lithium ion cell. The temperature estimation was performed with different SoCs, SoHCs and discharge currents. Furthermore, we have given a perspective on the possibility of using the presented method to estimate the SoC and the SoHC. One of the biggest advantages of the presented method is that a well-known ANN with a very simple architecture which requires little computational effort is able to estimate the cell temperature successfully. This fact makes it even more interesting and practical for industrial applications. The ANN was trained within minutes for each system. The time needed to train the ANN depends on the availability of supplementary input data, such as SOC, SOH or applied DC current. Once the ANN is trained, the calculations for the state estimation by the ANN are performed within milliseconds. The EIS measurement from 1 Hz to 10 kHz was performed in less than 1 min. However, we predict that the measurement time could be reduced to milliseconds by selecting suitable frequencies. The calculations for the state estimation by the ANN were performed in less than a second.
Further, we showed that the presented model is independent of the cell geometry by investigating cylindrical and prismatic cells. The focus of this study lay in the investigation of 18,650 lithium ion cells. To generalize the presented method, we will investigate larger cells with higher capacity in future work. Furthermore, we will use temperature sensors in the cell core for data acquisition and investigate connected cells in battery modules. Due to its data-driven nature, we suggest that it is possible to adapt the model to every other cell chemistry, as long as there is a strong correlation between the EIS spectrum and the investigated state. We were able to achieve reasonable results with LFP cells. As our data-driven model is easily applicable to other systems, it is attractive for practical applications, since cell manufacturers usually do not reveal exact cell chemistry.
4. Conclusions
In this work we presented a sensorless method for predicting the temperatures of lithium ion cells that uses ANNs which take electrochemical impedance spectra as input data. Investigation were performed on Samsung INR18650-15L1, Sony US18650VTC6 and Panasonic NCA 103450 cells. To simulate real applications, the SoC was varied; a superimposed DC current during the EIS measurement was applied; and for every cell type at least nine cells were investigated to include the cell to cell variance. In addition, Samsung 15L cells with different SoHCs were investigated. The RMSE for all temperature estimations were around 1 K, which makes the presented method attractive for practical applications. SoC estimation was also investigated likewise. For the Sony VTC6 and the Panasonic NCA 103450 cells, the RMSE was about 3%. Different cell temperatures during the EIS measurement were taken into account. The SoC estimation for the Samsung 15L cells was not successful, with an RMSE of above 8%. In this case the influence of the SoC on the impedance spectrum was of the same order of magnitude as the influence of the cell to cell variance. Therefore, for the SoC estimation, it is necessary to investigate each cell system individually for its applicability. At last, the ANN was applied to estimate the SoHCs of Samsung 15L cells. Since the estimation errors for all cells were below 2%, this seams to be a feasible use of the method as well. However further investigations on cells with different aging profiles are necessary to give a definitive evaluation of the suitability. Its advantages compared to other temperature estimation methods are that there is no need to fit a battery model to the data, and no differential equation needs to be solved. Furthermore, the ANN needs only a single EIS spectrum to estimate the cell temperature. There is no need for handling time series data. The presented prediction method seems to be a promising way to estimate the inner cell temperature with high accuracy in a short time period, as little effort regarding measurements and calculations is required. Further work is suggested to investigate the ability of the neural network to estimating the temperatures of cells within electrical circuits. Furthermore, a reduction in the number of input parameters will be investigated to improve this method by reducing and simplifying the computational effort and the measurement time.


