1. Introduction
Lithium-ion batteries are nowadays part of most storage applications such as e-mobility, grid service or even power tools or mobiles. Especially providers offering applications with expected lifetimes ranging from 10 to 20 years have a high demand for long lasting cells. Mostly, these cells, used, e.g., for e-mobility, are in operation only a short period and rest for most of the time in, e.g., Europe at rather low temperatures. Thus, the aging rate is mostly low and is therefore a challenge to be predicted via capacity tests, where the values are superimposed with reversible effects caused by anode overhang [
1,
2,
3], polarization [
4] and increased internal resistance [
5,
6]. Thus, usual tests are not performed for temperatures below 20 °C or the results are hard to be interpreted [
2,
5,
6,
7,
8,
9]. Exceptions are found in the works of Naumann et al. [
10], Schmitt et al. [
11] and Wu et al. [
12] where tests down to 0 °C are performed with superimposed significant influence of the anode overhang and the temperature during a check-up. The outcome is very questionable, as most of the influence will be originated from anode overhang, the heating up during reference tests at room temperature or by the check-up itself.
Additionally, higher temperatures, occurring during operation and/or hot days, induce significant aging of the cells. Therefore, a dependence of the aging rate on the temperature and the cell potential needs to be assessed with a fine resolution, as reported by Rumberg et al. [
13], Hoog et al. [
14] or Bouchima et al. [
15] in 3D representations (T vs. SOC/V vs. capacity losses). It is apparent that the effort for classical check-up tests is high in terms of necessary test cells, test channels, temperature chambers and test duration.
An alternative approach to evaluate faster the aging rate at various conditions is the high precision coulometry (HPC) [
16,
17]. Using this method, however, leads to comparable high capital costs, and the state-of-charge (SOC) is changing throughout the test, so that reversible effects caused by, e.g., the anode overhang [
18] have to be considered by additional models. Therefore, high precision coulometry is more suitable for the estimation of the cyclic aging rather than calendar aging.
A promising candidate for calendar aging tests is the float current analysis. For this method, the steady-state current in a potentiostatic phase is evaluated after polarization and anode overhang effects are balanced out. Moreover, the float current is independent of the internal resistance: On the one hand, the measured currents are very low and with this the overpotential by increase of internal resistance in the order of some µV. On the other hand, the constant voltage charge is limited by the self-discharge occurring [
19]. To summarize, the float current is the constant self-discharge after transient-effects are compensated.
A correlation of float currents to capacity loss rate is, up to now, reported only for LiFePO
4-graphite cells [
19]. In this publication, the float current tests wereperformed at 3.6V (100% SOC). Assuming that capacity loss is caused by solid electrolyte interphase (SEI) formation [
20], as is typically the case, intercalated active lithium-ions from the graphite are passivated in the SEI. As the slope of the open circuit potentials of the graphite potential is hardly zero, the existence of float currents cannot be explained directly by passivating lithium on the anode. A potential explanation is given in the publication by a parallel self-discharging shuttle reaction between the anode and the cathode triggered by SEI formation. Deshpande et al. [
21] proposed additional side reaction by electrolyte decomposition at the graphite anode leading to a shuttle reaction at room temperature. Self-discharge was also investigated by Zilberman et al. [
22] by evaluating open circuit voltages over time that correlate to loss of active lithium in 18650 cells. They associated the self-discharge currents in µA range with coupled side reactions of the anode and cathode and excluded internal shorts as the self-discharge follows the Arrhenius law. At very high cell potentials beyond the safe operational potential limits, the cathodic side reactions are dominating, and CO
2 formation was reported by Xiong et al. [
23,
24] or not-specified parasitic reactions from 4.2 to 4.6 V by Zeng et al. [
25].
Theoretically, the overpotential during the potentiostatic float current measurement could trigger a reaction and is not existing during open circuit storage. For SOC of about 75% at 25 °C and about 90% at 60 °C, Deutschen et al. [
26] showed self-discharge losses during open circuit storage that stabilize after long measurement. The equivalent float current calculated from the constant loss by self-discharge neglecting the transient part is in the order of 0.5%/100 days and 5.0%/100 days and fits to results reported in the literature [
3] for comparable chemistries excluding anode overhang effect. This is in accordance to the findings of Zilberman et al. [
22].
In this contribution, we present a fast parameterization of the calendar aging rate as a function of the cell potential and the temperature for five 18650 NCA/graphite cells. The resolution at low temperatures is highlighted within 0–10 °C. Finally, the path dependence of float currents is discussed. The data are correlated for each cell separately by comparing capacity losses rate and float current. The aging and the float current are further discussed by the active material losses obtained from differential voltage analysis. Moreover, the trend temperature dependence over SOC for all five cells is evaluated by means of the Arrhenius law. The cell-to-cell variation during calendar aging is beyond the scope of this publication and is expected to be comparatively low, especially for lower SOCs, as shown in many publications before [
3,
5,
9,
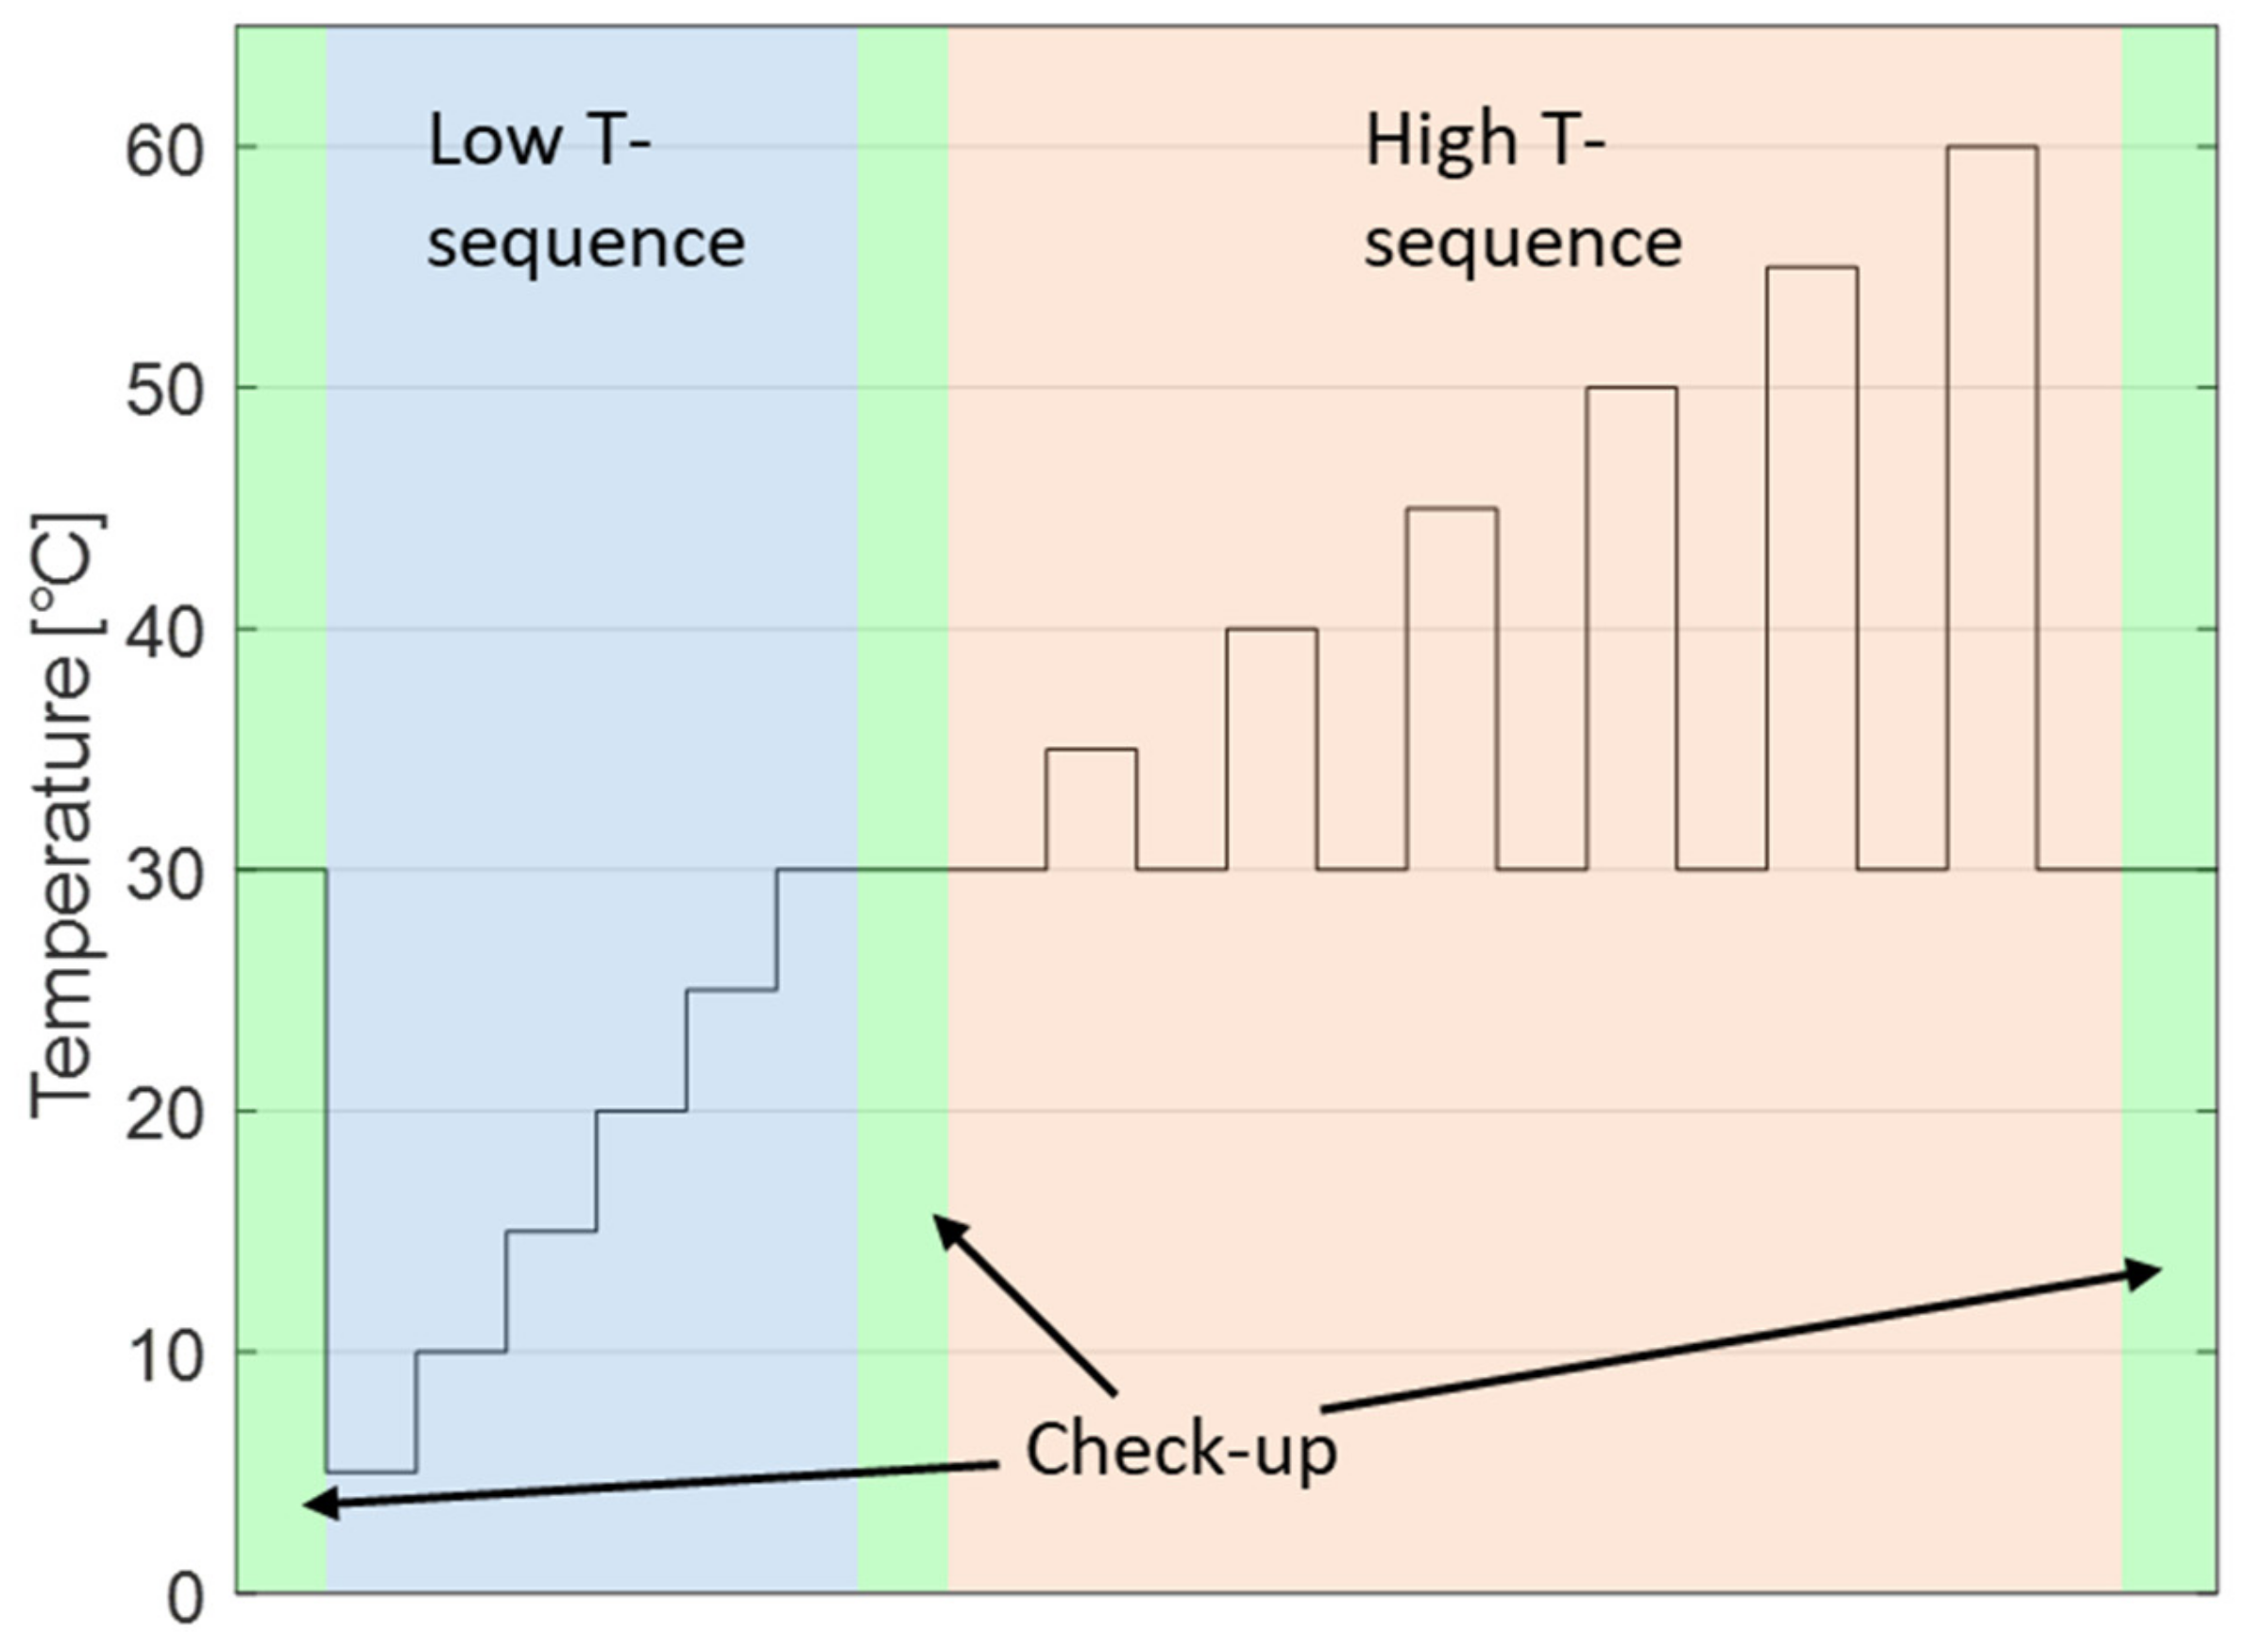
27]. The test strategy including a low temperature and a high temperature sequence is presented in
Section 2. Then, at first, the check-ups are evaluated with standard methods in
Section 3.1, followed by the float current analysis in
Section 3.2,
Section 3.3,
Section 3.4. In
Section 3.5, results of both methods are compared with each other. Finally, in
Section 3.6, the hysteresis and reproducibility at 30 °C is discussed.
3. Results and Discussion
At first, the test results of the standard check-up routine are evaluated at different aging states by capacity loss, internal resistance change and differential voltage analysis. This is followed by the float current analysis measurement strategy and evaluation. Thereafter, the capacity and the float current test results are compared to each other qualitatively and quantitatively. In the final section, the absolute values at 30 °C in dependence of the previous temperature is presented.
3.1. Check-Up Results
3.1.1. Capacity Loss and Pulse Resistance
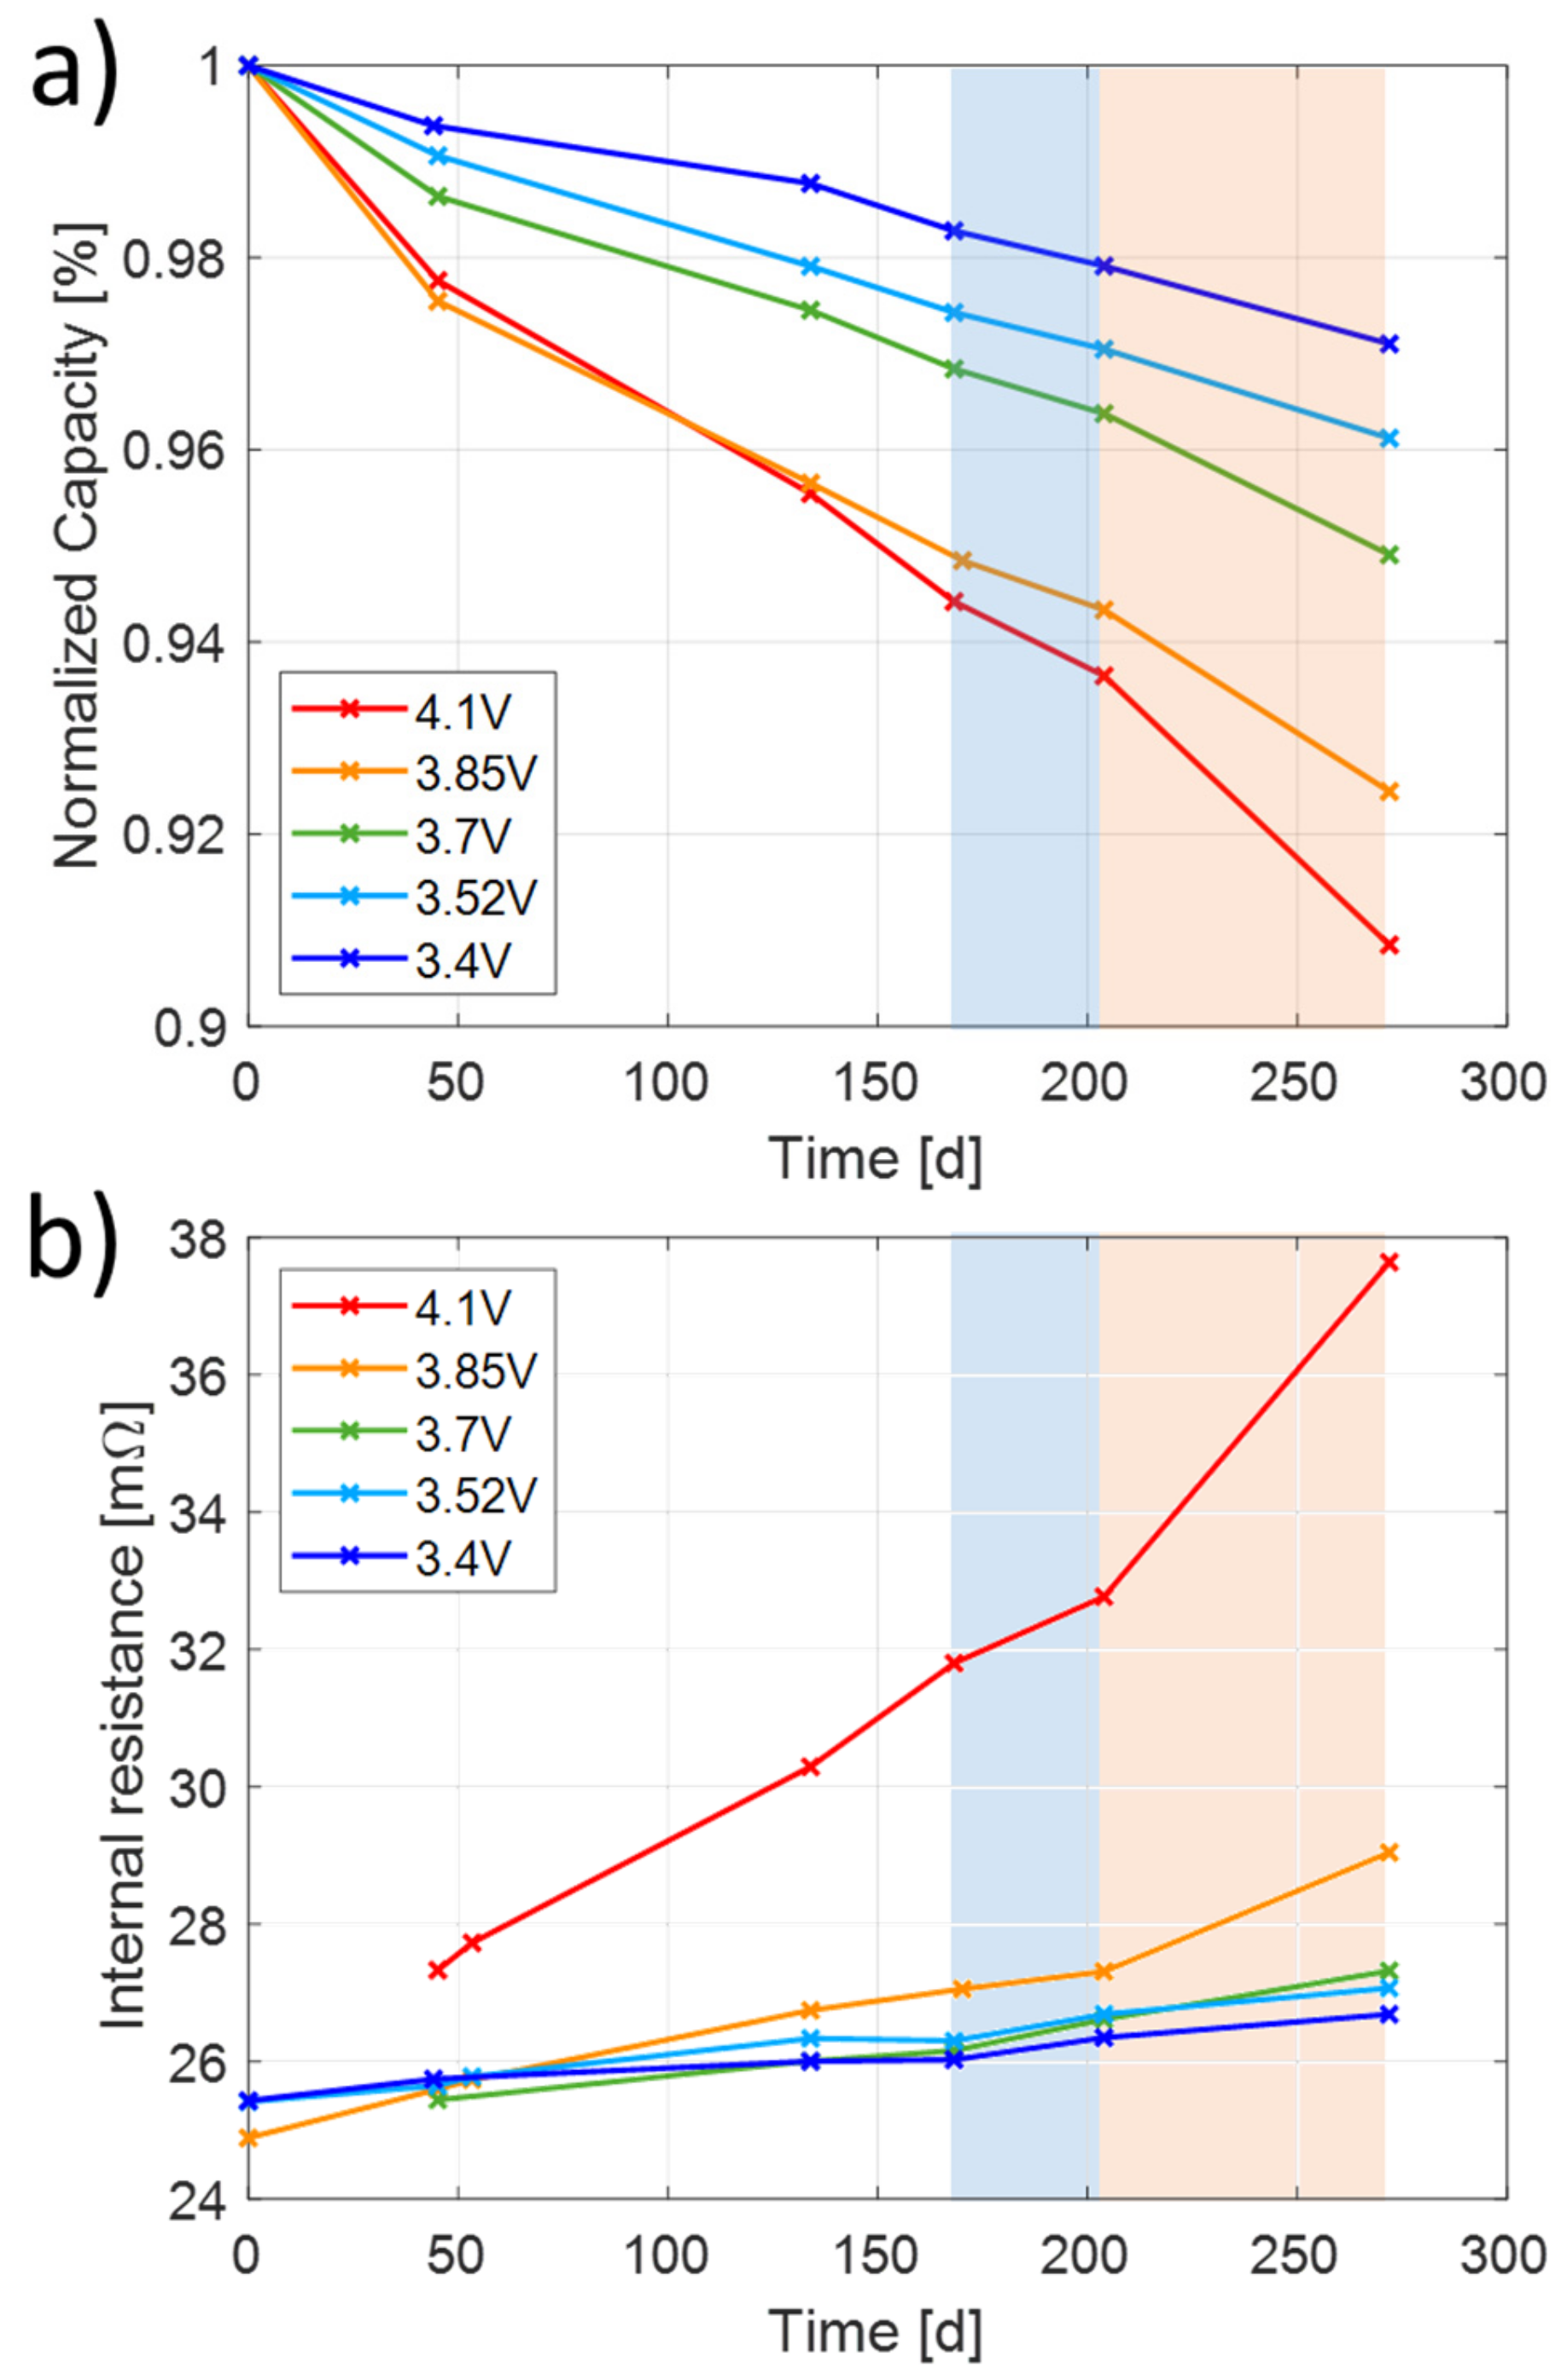
The capacity loss over the time evaluated from the standard check-up procedure for all cells is depicted in
Figure 2a. The initial phase until 165 days is slightly distorted due to problems with the test bench, and repeated and uncompleted check-ups are neglected. However, in the first 50 days, a clear effect from the anode overhang is visible. Potentials during tests close to the delivery voltage 3.52 V follow a rather linear trend in the beginning as no potential difference in the anode causes lithium-ion transport from or to the anode overhang. With increasing test potentials, there is an increasing initial drop before the linear phase starts. After 165 days, the anode overhang effect is concluded and the irreversible capacity loss, determined by the slope, increases with cell potential and is higher in the high temperature sequence (red) compared to the low temperature sequence (blue).
Figure 2b shows the development of the internal resistance over the time, evaluated from the pulse tests measured at 3.7 V. The results are comparable to the pulse tests performed at 4.2 V (not shown here). The internal resistance rises over calendar aging for all cells. While the resistance rise rate remains similar for the cells, kept at voltages up to 3.7 V, a small slope increase for the cell at 3.85 V and a significantly higher slope increase for 4.1 V cell are apparent. Unfortunately, in the first check-up for 4.1 V, the pulse test was erroneous and could not be evaluated.
As shown by Baghdadi et al. [
29] for LiNi
0.
8Co
0.
15Al
0.
05O
2/graphite, the capacity loss and the resistance increase more strongly with higher cell potentials and higher temperatures. This impact is most severe at higher potentials.
3.1.2. Differential Voltage Analysis (DVA)
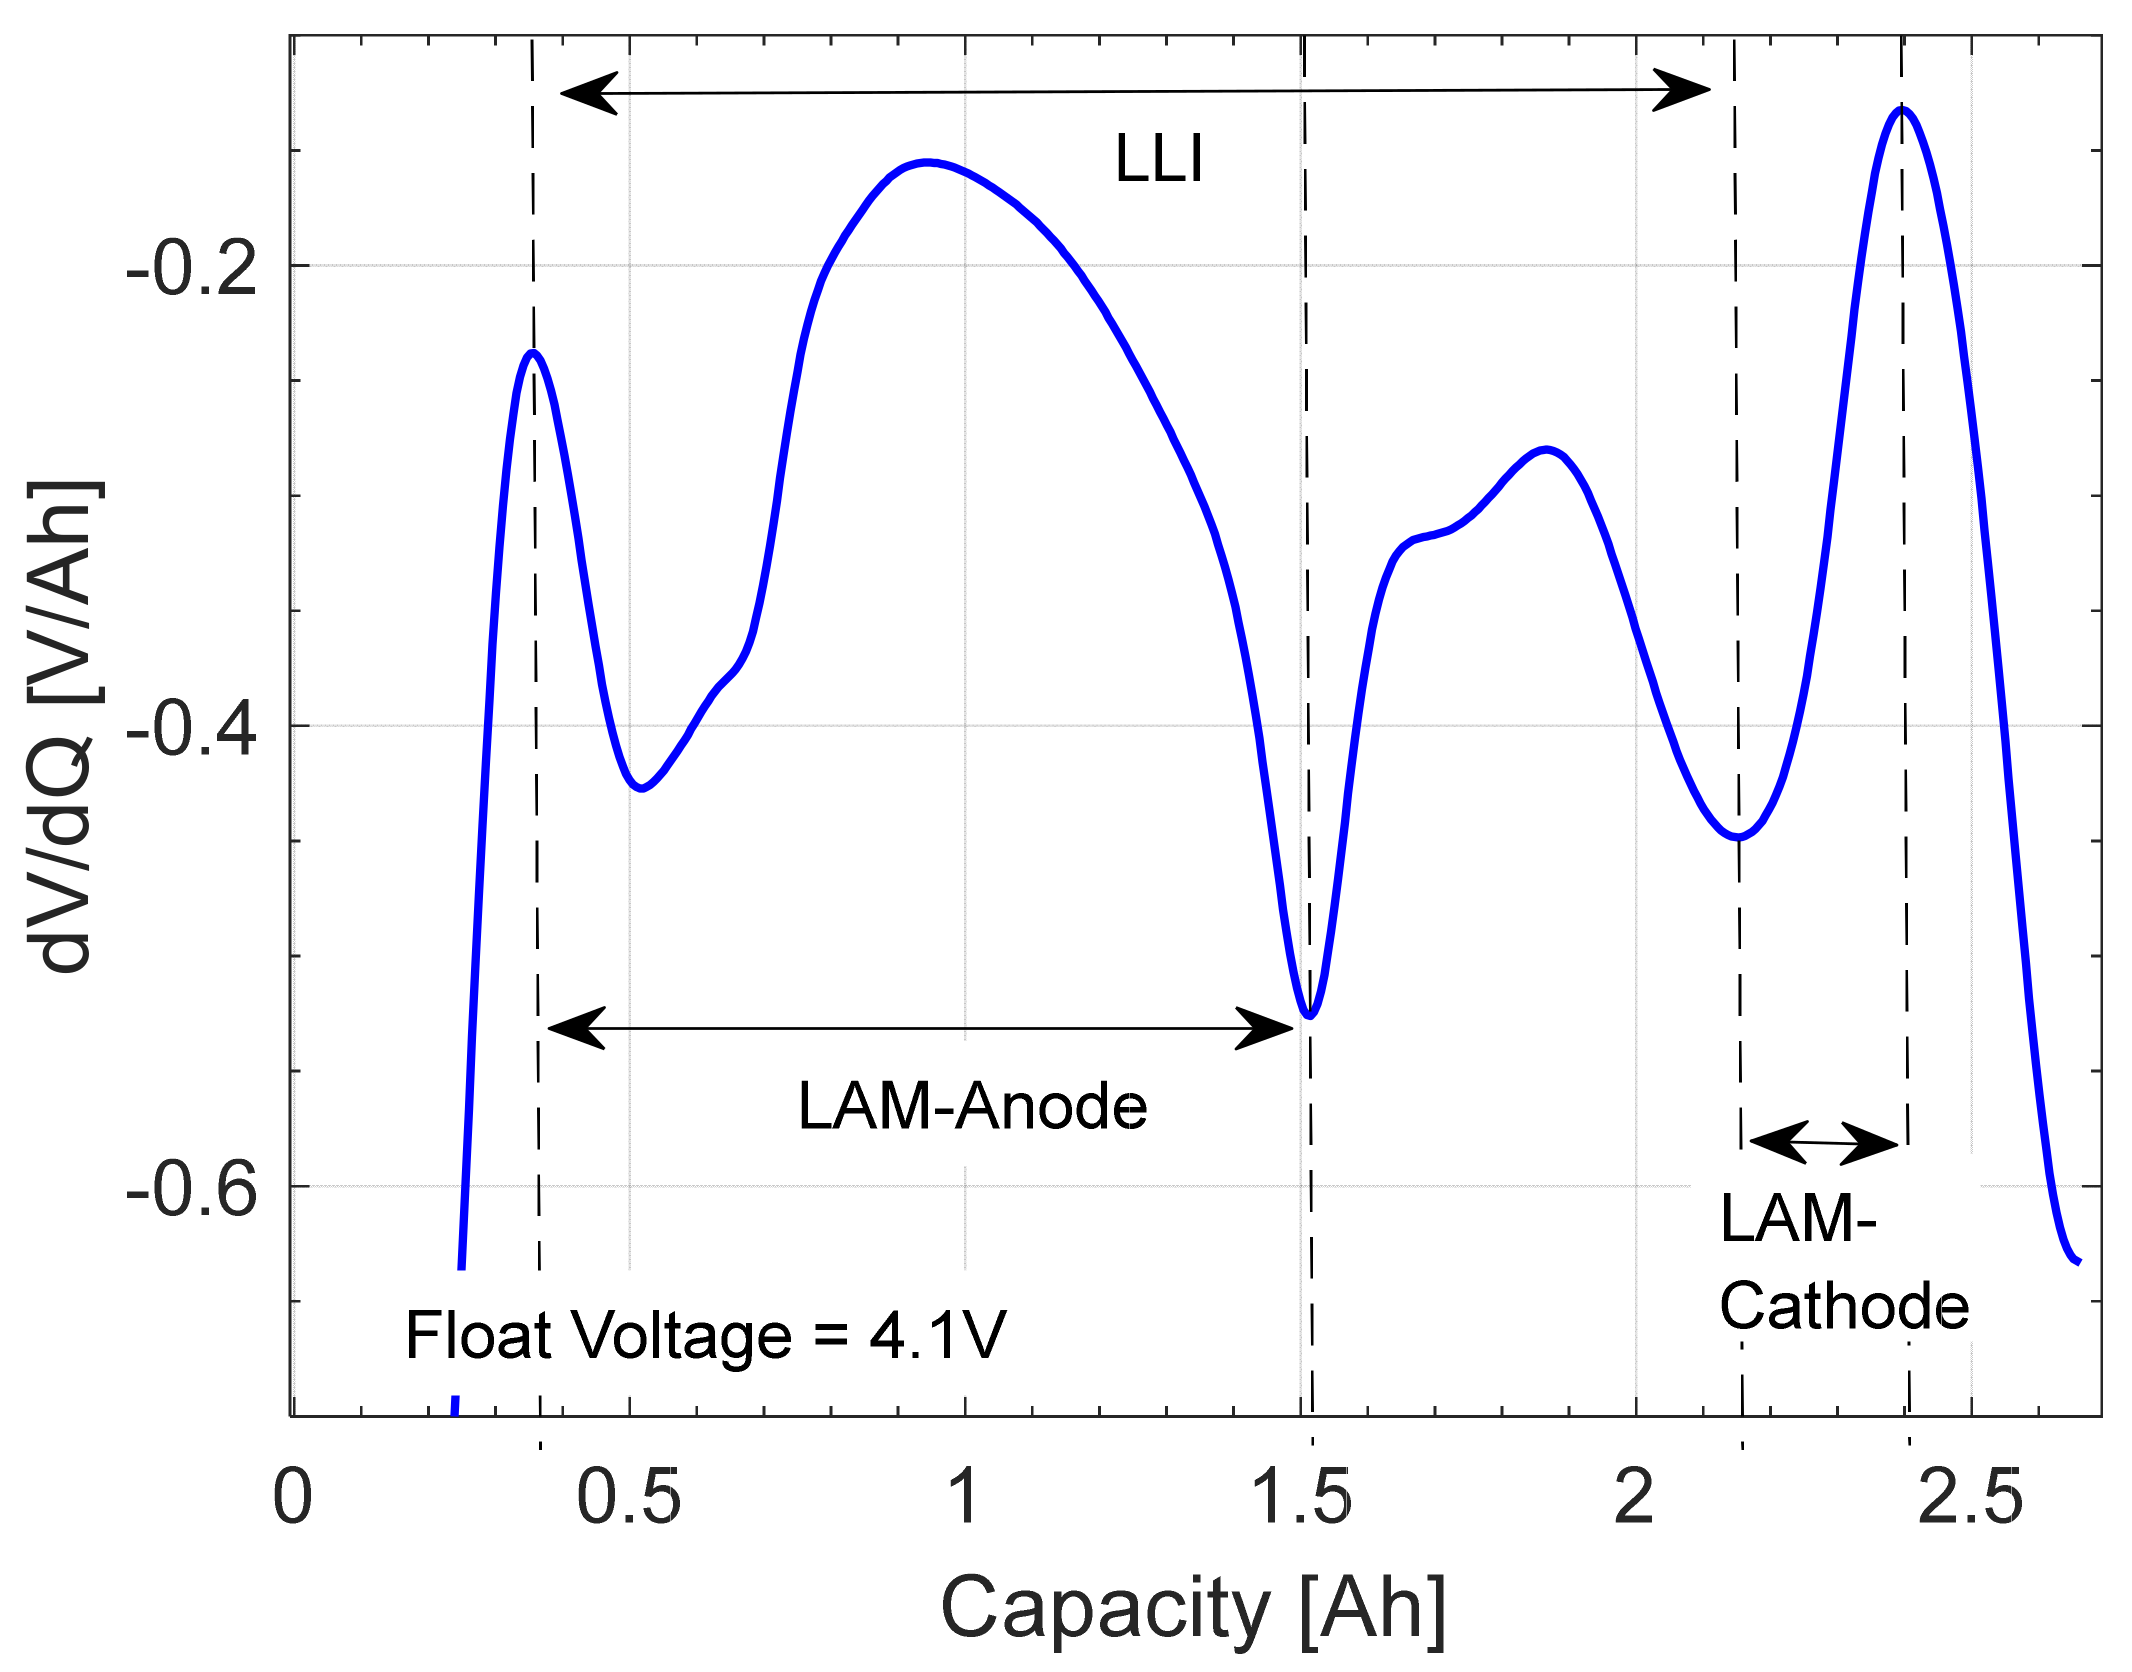
For the electrode specific characterization of the aging, the differential voltage analysis of a charging sequence at 0.1 C is performed analogously to that in [
30,
31]. The DVA pattern of the studied cell shows four characteristic features (
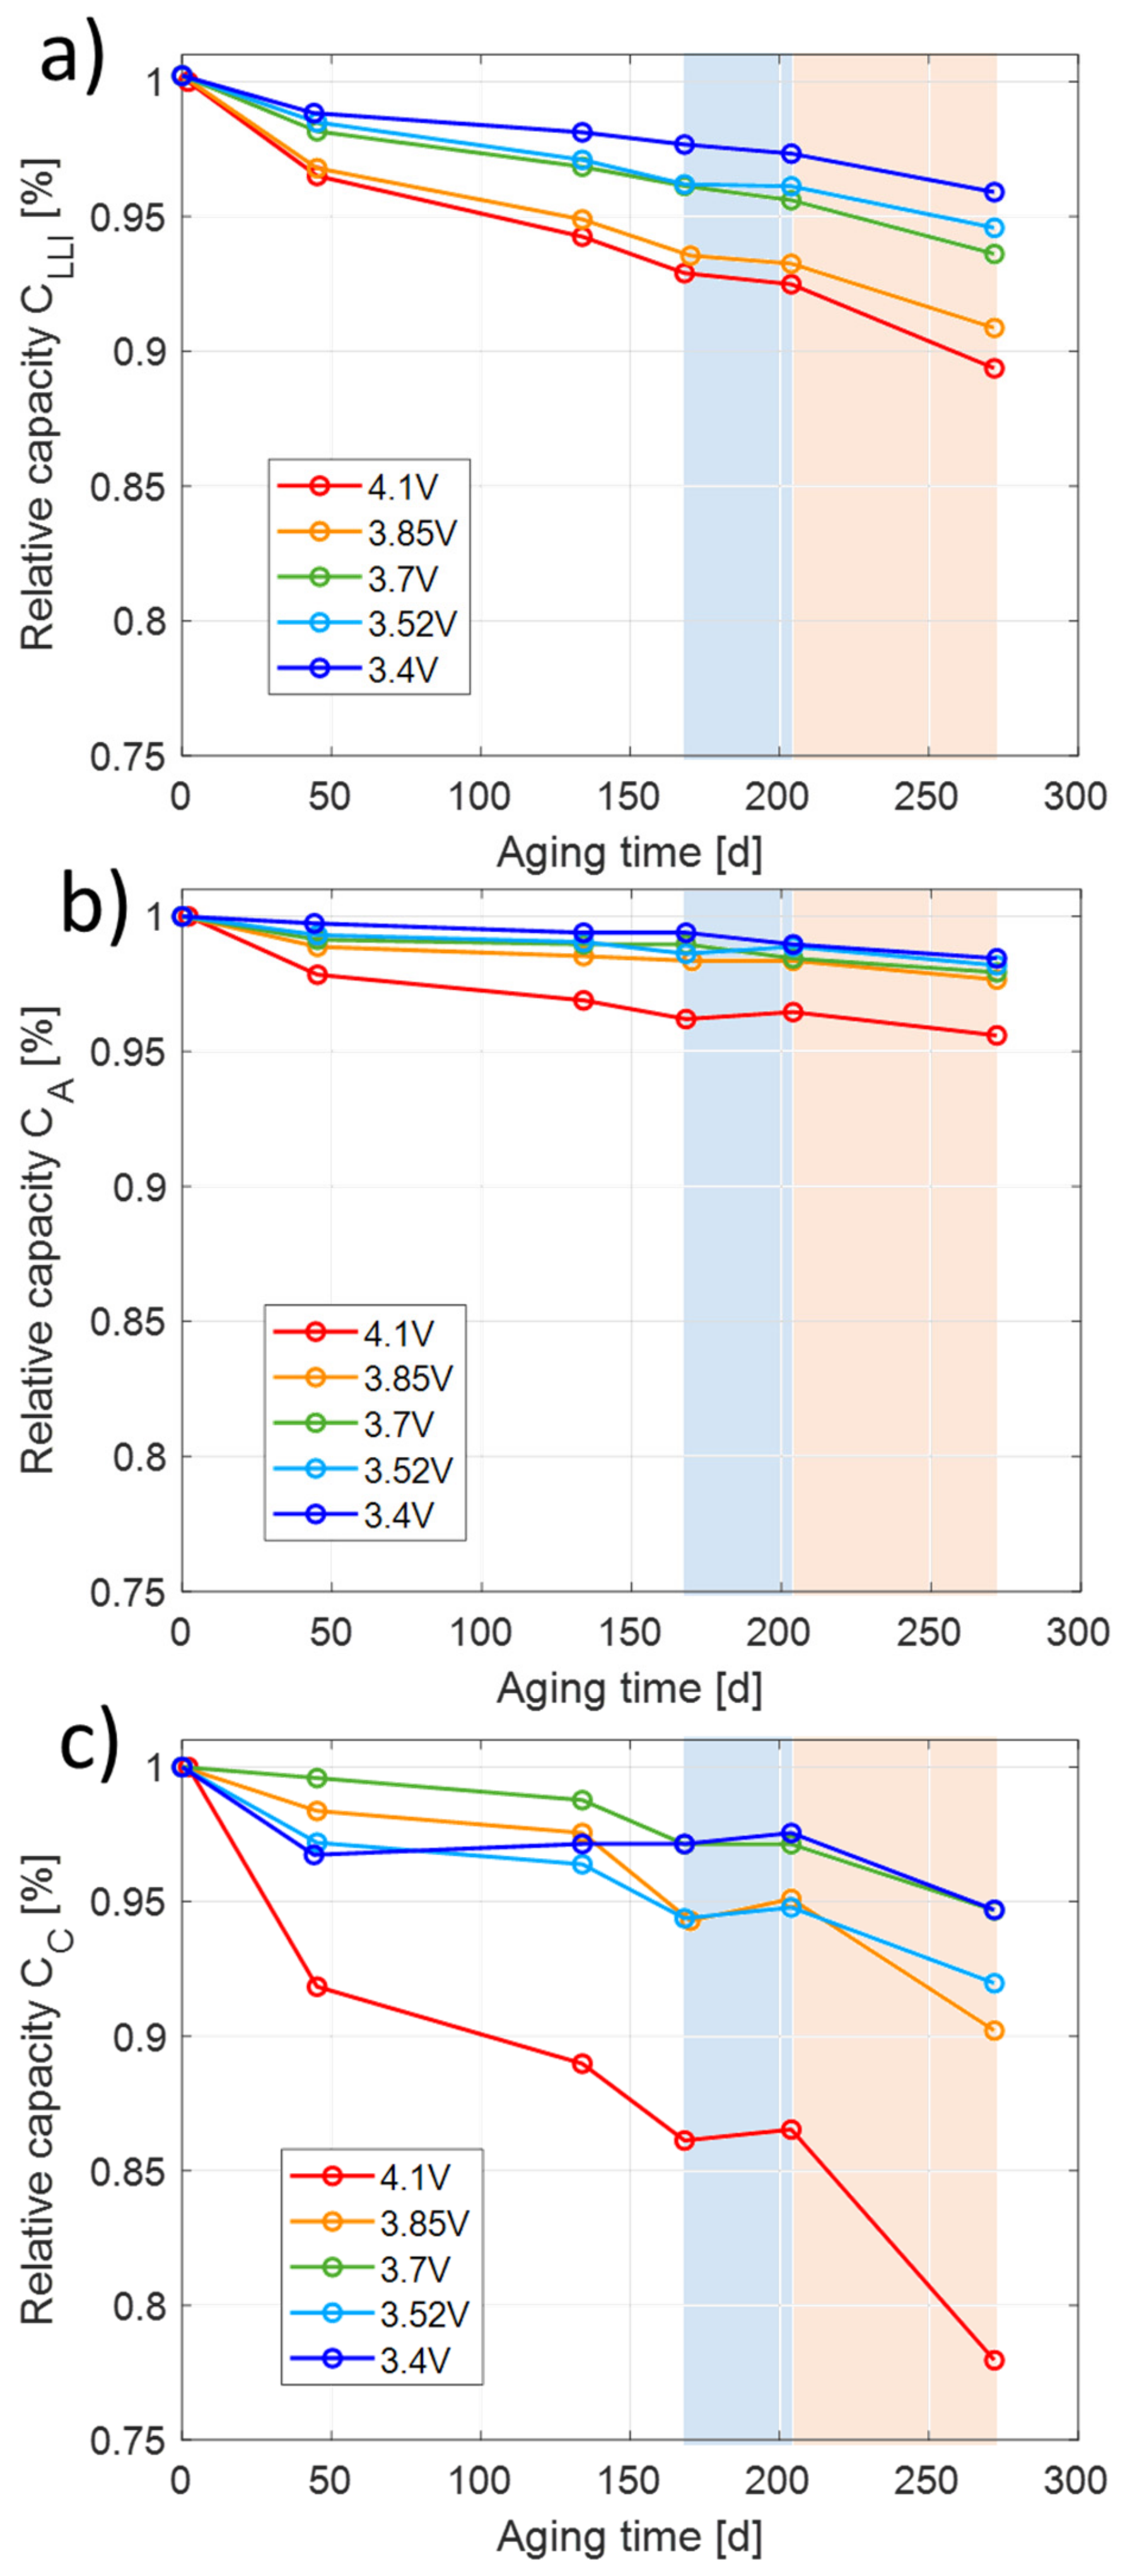
Figure 3): two belong to the cathode and two to the anode. Fitting the distances between these characteristics relative to the initial curve, the percentage losses of anode and cathode active material and slippage between anode and cathode can be calculated. These values are obtained using a self-written Matlab-model by fitting shifted and stretched half-cell curves of the anode and the cathode to the full cell curve. The degradation caused by loss of active lithium (loss of lithium inventory LLI), quantified by slippage between anode and cathode curves, is given in
Figure 4a.
Figure 4b shows the losses assigned to the anode (LAM-Anode), while
Figure 4c shows the loss assigned to the cathode (LAM-Cathode). The trend of LLI is comparable to capacity loss in
Figure 2a. In the low temperature sequence, the small increase in
Figure 4a,b is below the resolution of the DVA evaluation method, so that it can be considered that there is no significant loss of active material on the anode and cathode. During the high temperature sequence, mainly the cathode active material is aging, while the anode active material is hardly aging. The loss of cathode active material increases with cell potential. Keil et al. [
27], who also investigated NCA/graphite, reported mainly LLI losses and only small losses of active material at 25–55 °C. Only for SOC above 80% additional aging at the cathode by electrolyte decomposition is found by end-point slippage. For NCA, micro cracks were reported by Lang et al. [
32], enhancing SEI formation. In the low temperature sequence, only SEI formation is observed, while, in the high temperature sequence, the cathode degrades significantly, too.
Only LLI losses such as SEI formation are directly associated to loss of extractable capacity. Moderate losses of anode and cathode active materials do not necessarily lead to capacity fade as both electrodes are initially oversized in capacity and as this oversize is further increased by LLI loss over aging. However, if the deactivated active material encapsulates active lithium, this will lead to capacity fade but will appear as LLI losses and therefore cannot be separated from SEI formation on the anode. Thus, the contribution of loss of cathode active material on capacity fade is limited and not fully determinable by DVA.
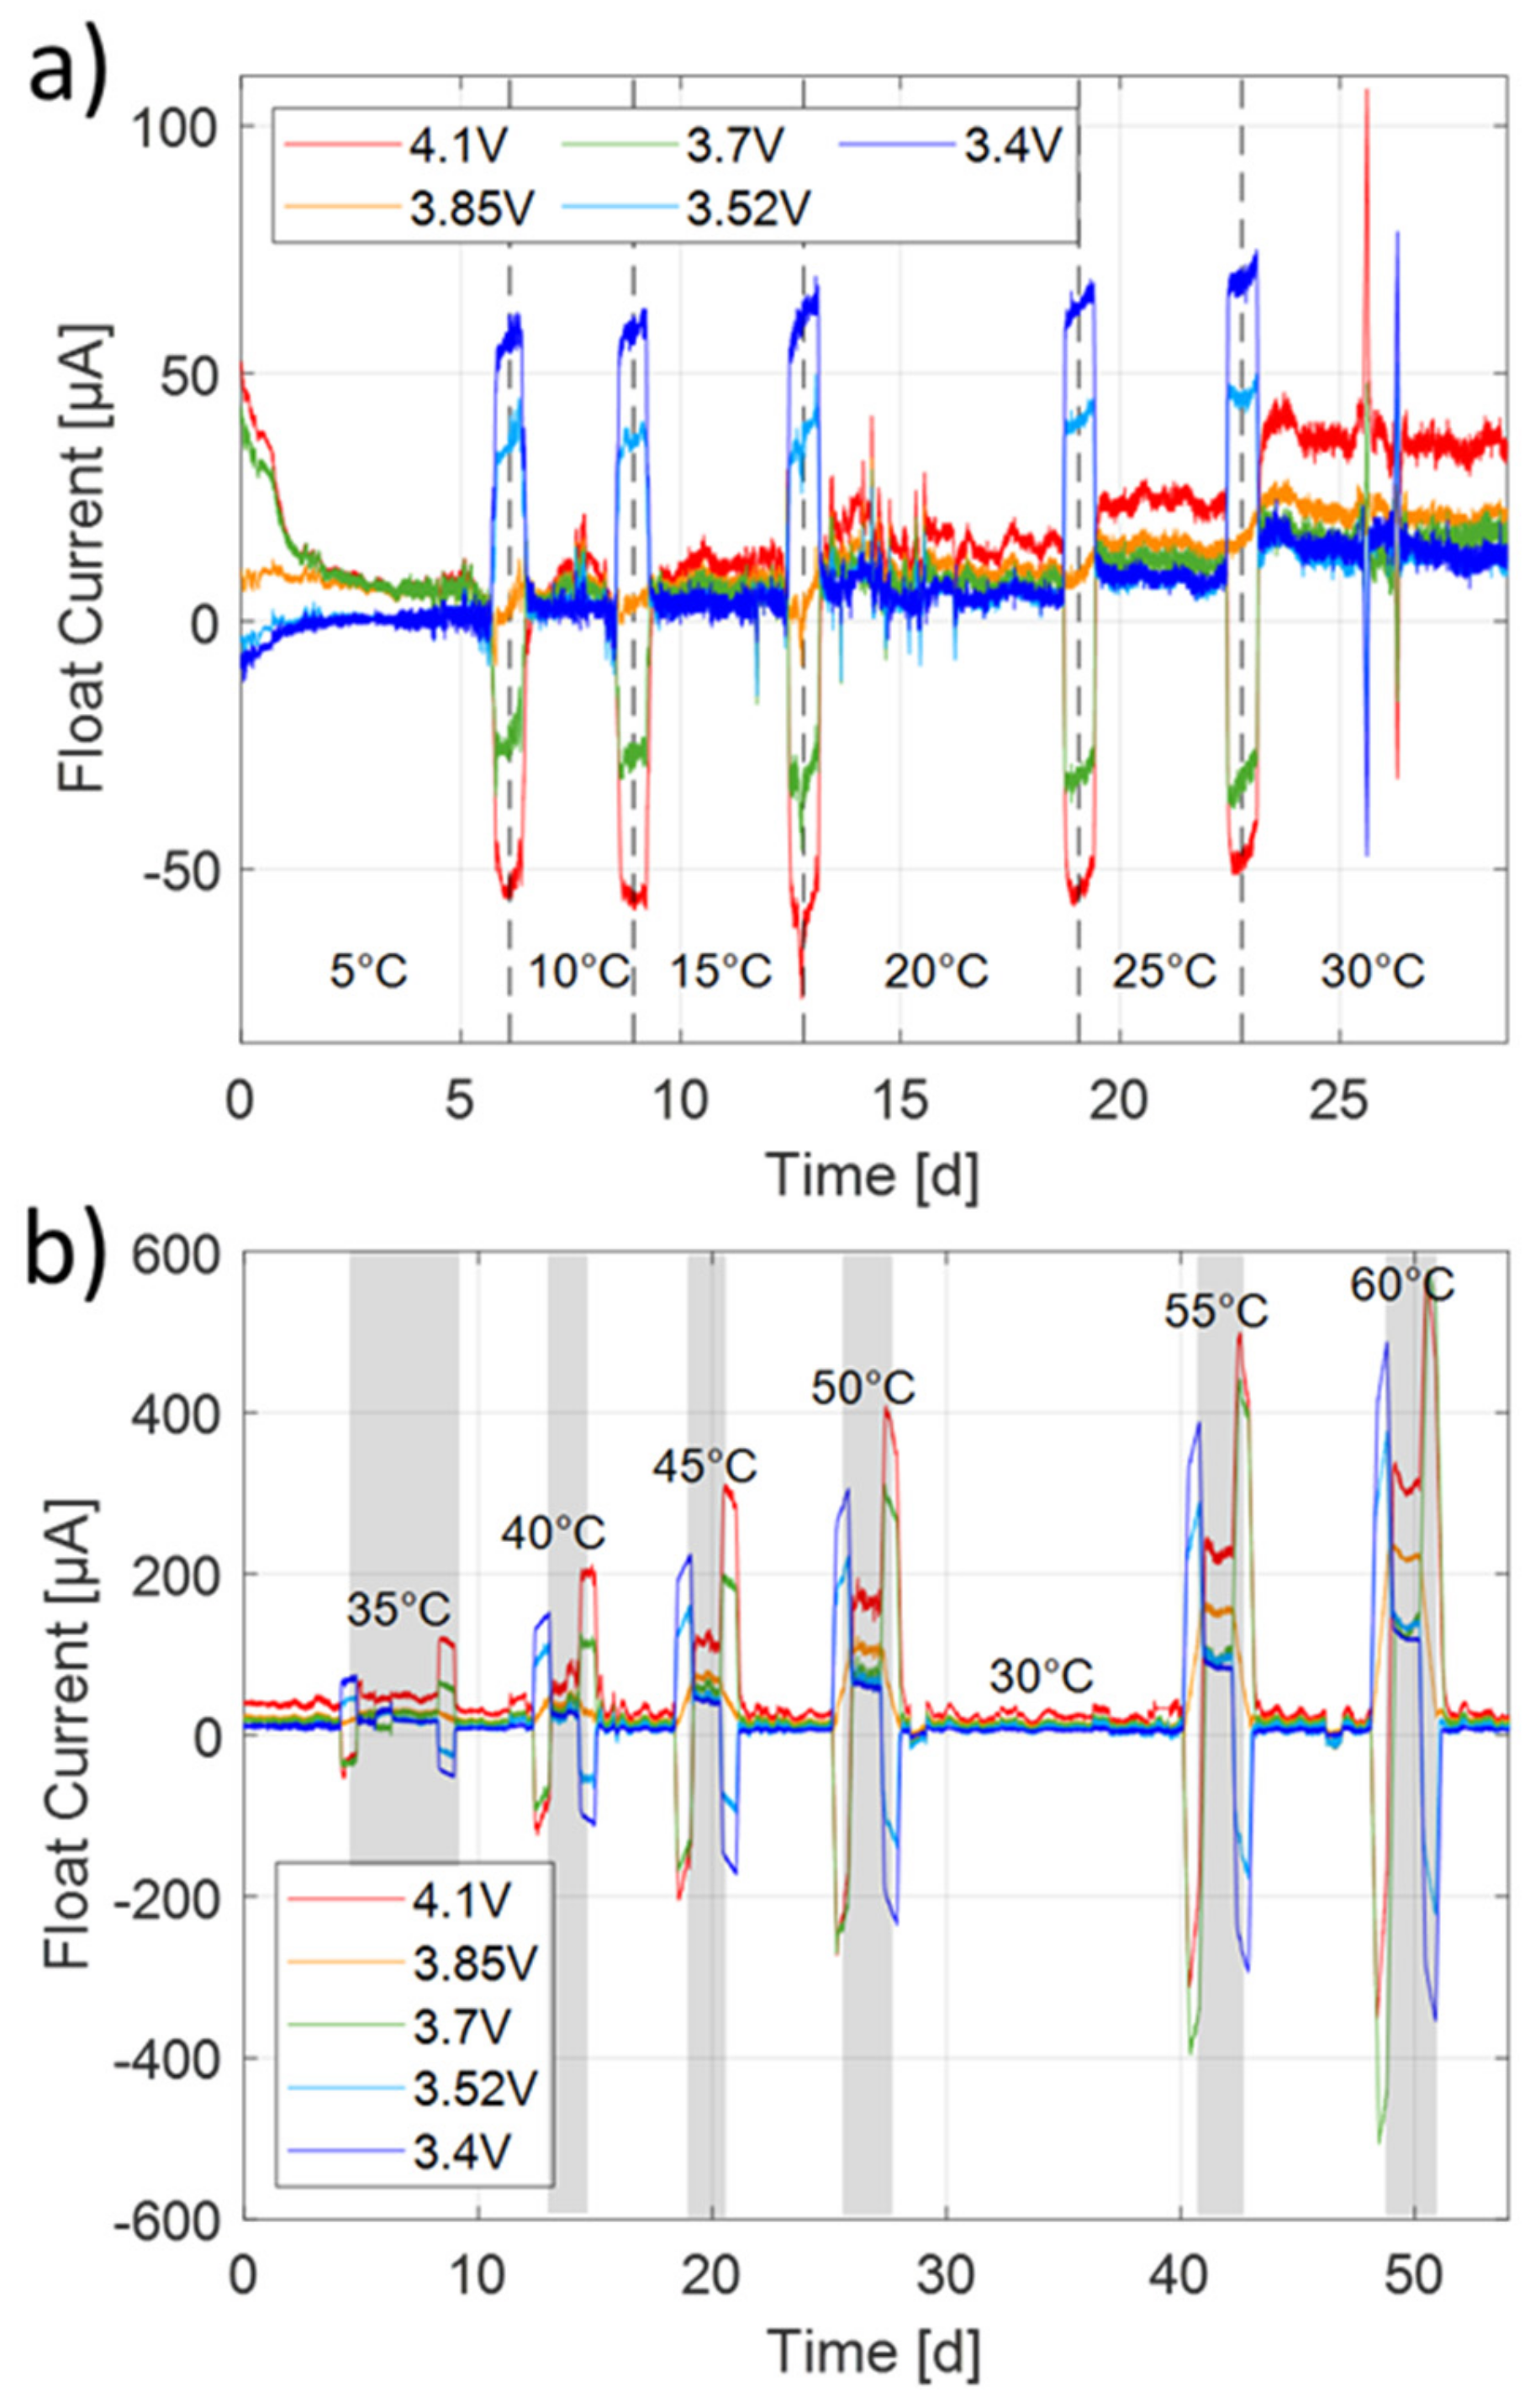
3.2. Float Currents
The float currents calculated from the derivative of the float capacity are shown in
Figure 5a for the low and in
Figure 5b for the high temperature sequence. After derivation, the float capacity is filtered with a 2000-sample-wide moving average window. The float current increases with cell potential at a given temperature and with temperature at a given potential, as is the case in
Figure 2a for capacity loss. For a more distinct view, the float currents are determined and plotted in the following sections. Between two temperature steps, the influence of the entropy effect [
33] becomes visible as the open circuit potential is shifting by some mV, leading to a float current peak. The sign depends on whether the temperature increased or decreased and on the intensity on the entropy coefficient. The evaluation of the float currents follows in the next sections.
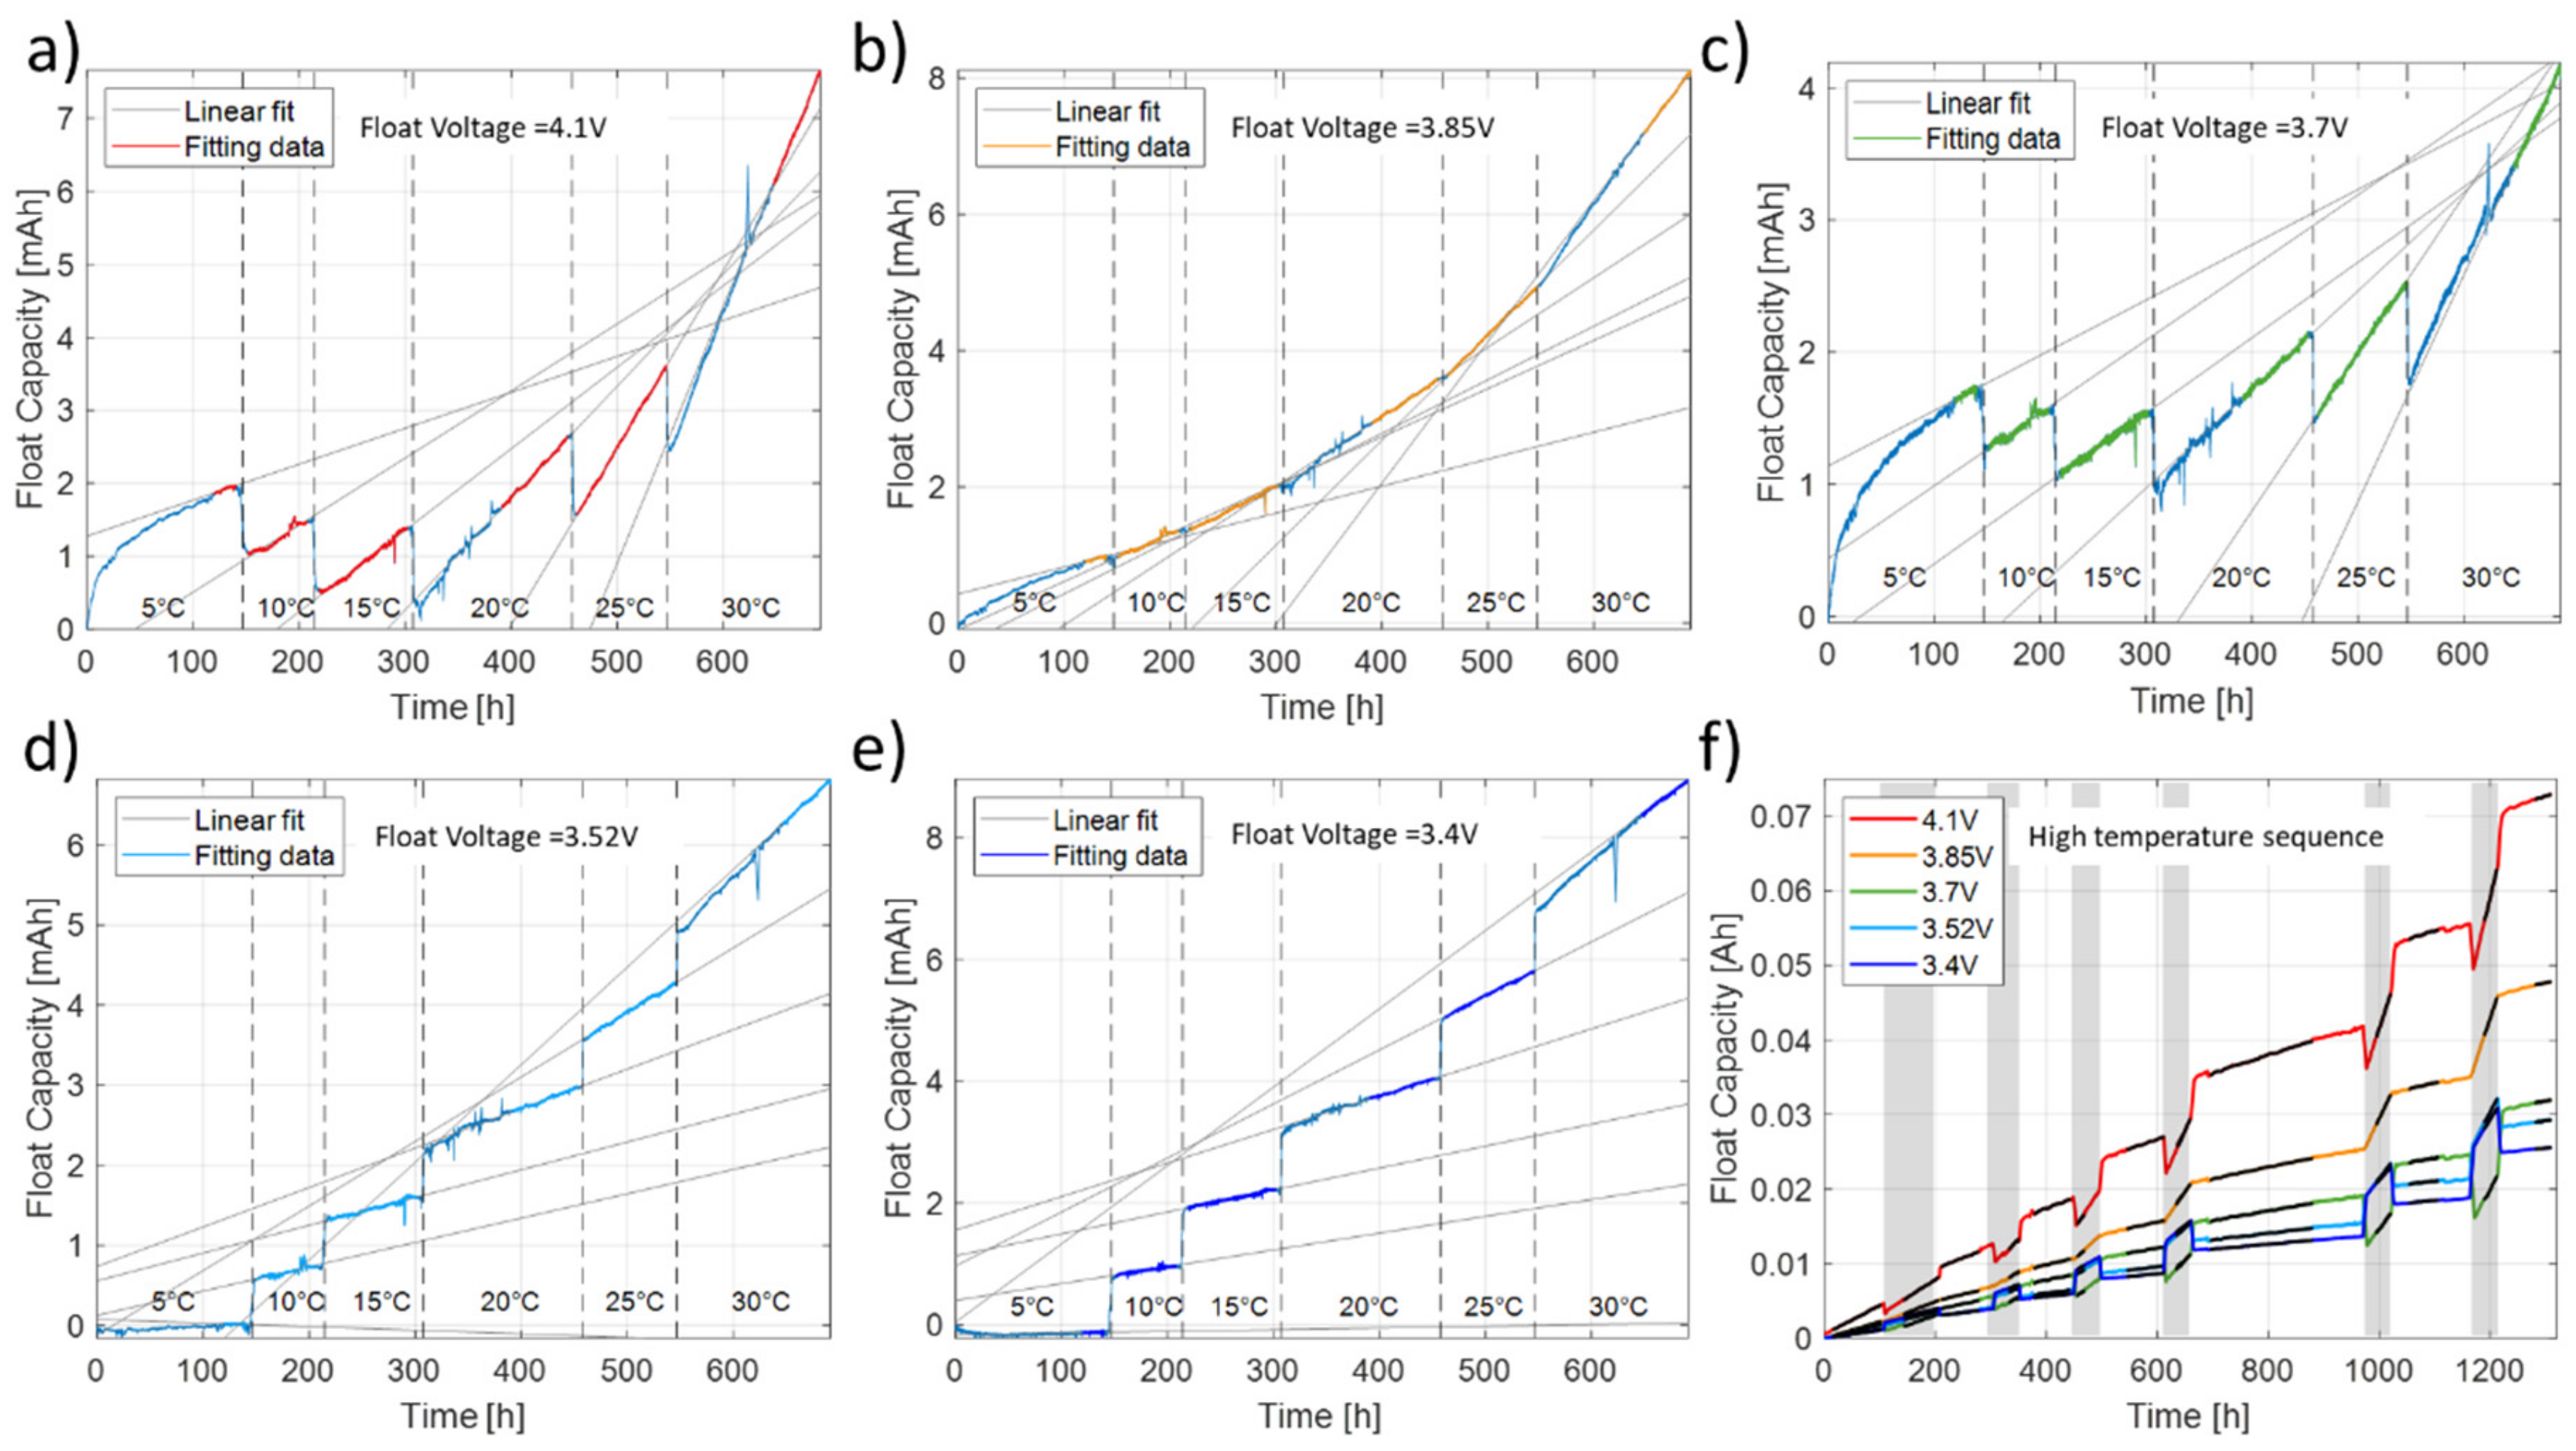
3.3. Float Currents Fitting Strategy
For the determination of the float current at a specific temperature, a linear fit is applied to the float capacity after the linear slope has stabilized. The results for the different float potentials of the low temperature sequence are given in
Figure 6a–e and for the high temperature sequence in
Figure 6f. Exemplarily, Cell 1 aged at 4.1 V in the temperature range from 5 to 30 °C is discussed (
Figure 6a). The blue curve represents the measured capacity of the float current. The steady-state float current is superimposed mainly by two measurement artifacts.
On the one side, there are the entropy caused effects at the temperature jumps >5 K leading to temporal higher or lower currents depending on the cell potential. The entropy coefficient is positive for 3.52 Vand 3.4 V, negative for 3.7 Vand 4.1 V and shows hardly any influence for 3.85 V. On the other side, within a temperature step, with a low temperature variation, a coherent fluctuation with the same sign over all tested cells is observed. They are linked to fluctuations in voltage output of the test station correlating to temperature fluctuation in the test container of typical ±2 K. In both cases, the accumulated voltage output is not supposed to change the average output of the float capacity as it is fitted. Therefore, a fit routine is performed over several days after the float capacity has stabilized.
After each temperature step in
Figure 6a, the float capacity is reduced due to entropy effects as the open circuit voltage rises. Only in the first step from 30 to 5 °C is the trend inverse and the time to reach a stable current is significantly longer. This is explainable by the higher temperature drop and slow equalization processes at 5 °C due to, e.g., anode overhang effect. The red colored part is used for linear fit. Transient parts and noisy parts as described before are not used for the fitting.
The error of the determined float current is ±1 µA due to precision of the cycler. Additionally, the error of the evaluation method by linear fit is estimated to be an additional ±1 µA. For higher currents, short measurement times and noisy temperatures, the error is assumed to increase. Only positive float capacities are observed, so that errors cannot lead to negative float currents.
Due to local and time-related temperature variations in the climate chamber of ±1.5 K, the cell temperature is used instead of the set point temperature of the chamber. For evaluation, at least one day is fitted to exclude night and day temperature changes and the initial part is neglected in the first 10 h or when the float capacity is approaching a linear trend.
The influence of a previous check-up changes the SOC in the anode overhang or the active anode leading to small but long-lasting compensation currents, influencing the float current with superimposed positive currents for higher SOC and negative currents for lower SOC (not shown here). Therefore, the float current after a checkup is evaluated after more than 11 days.
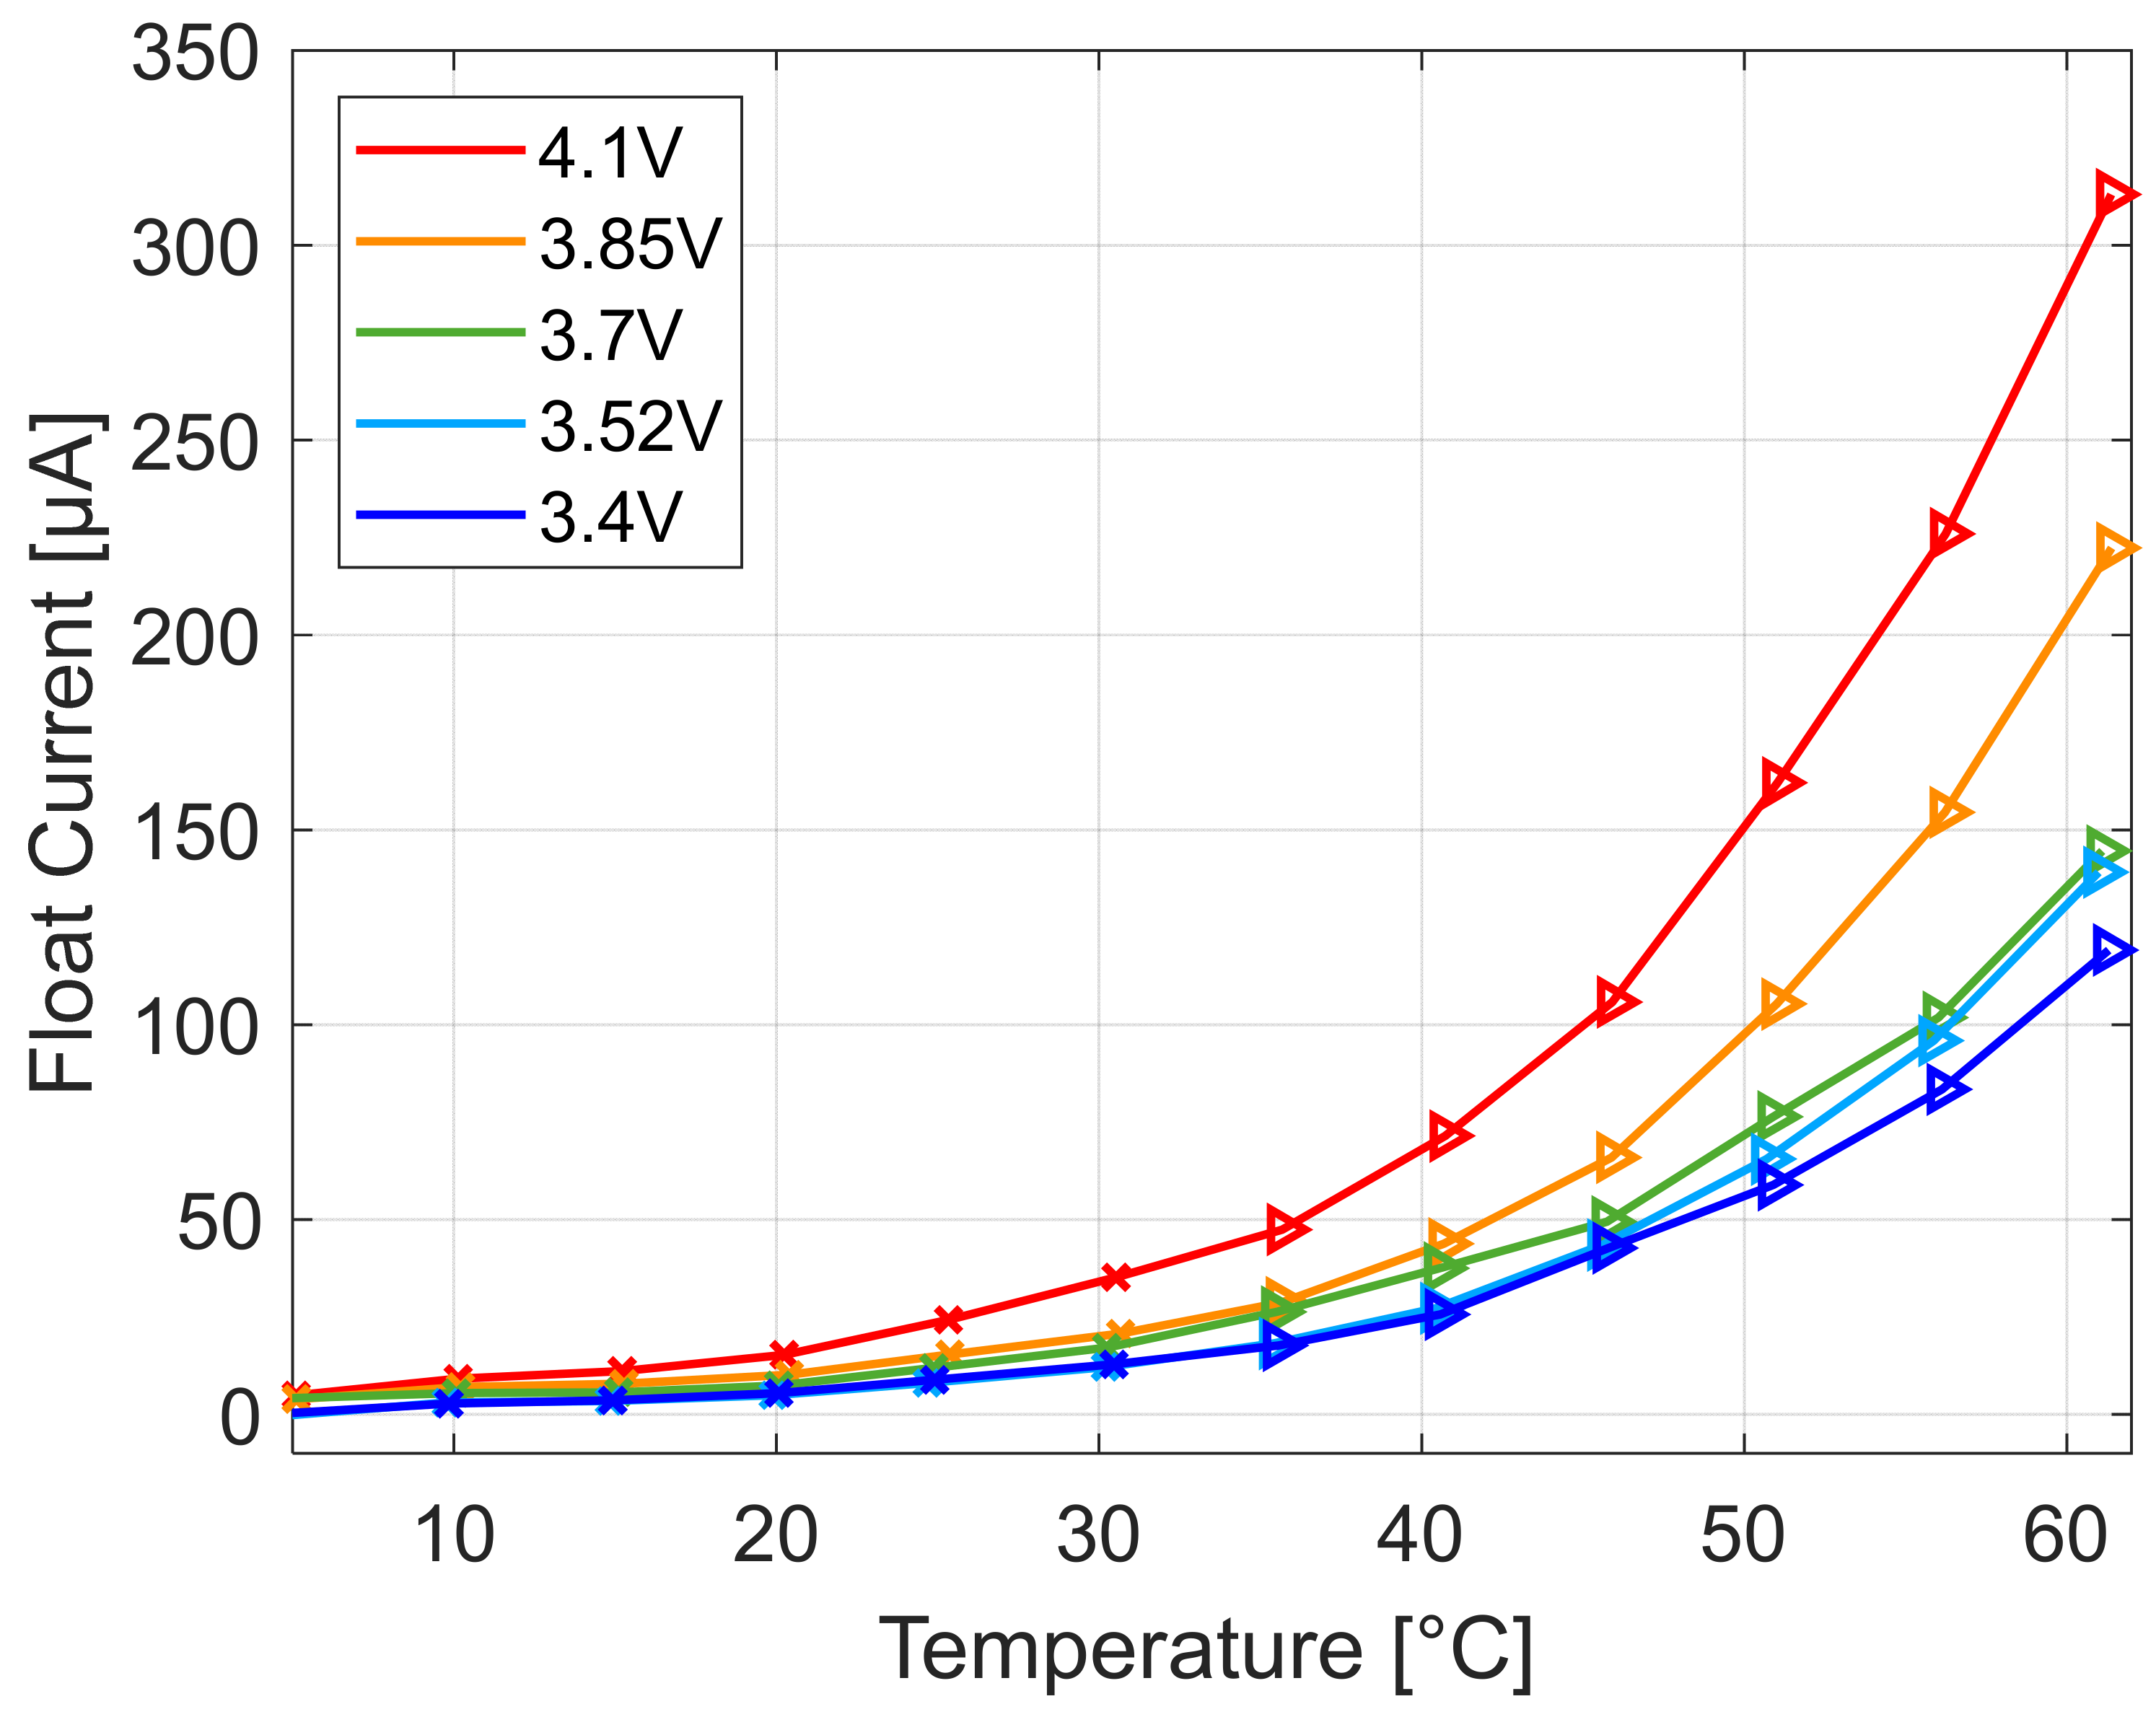
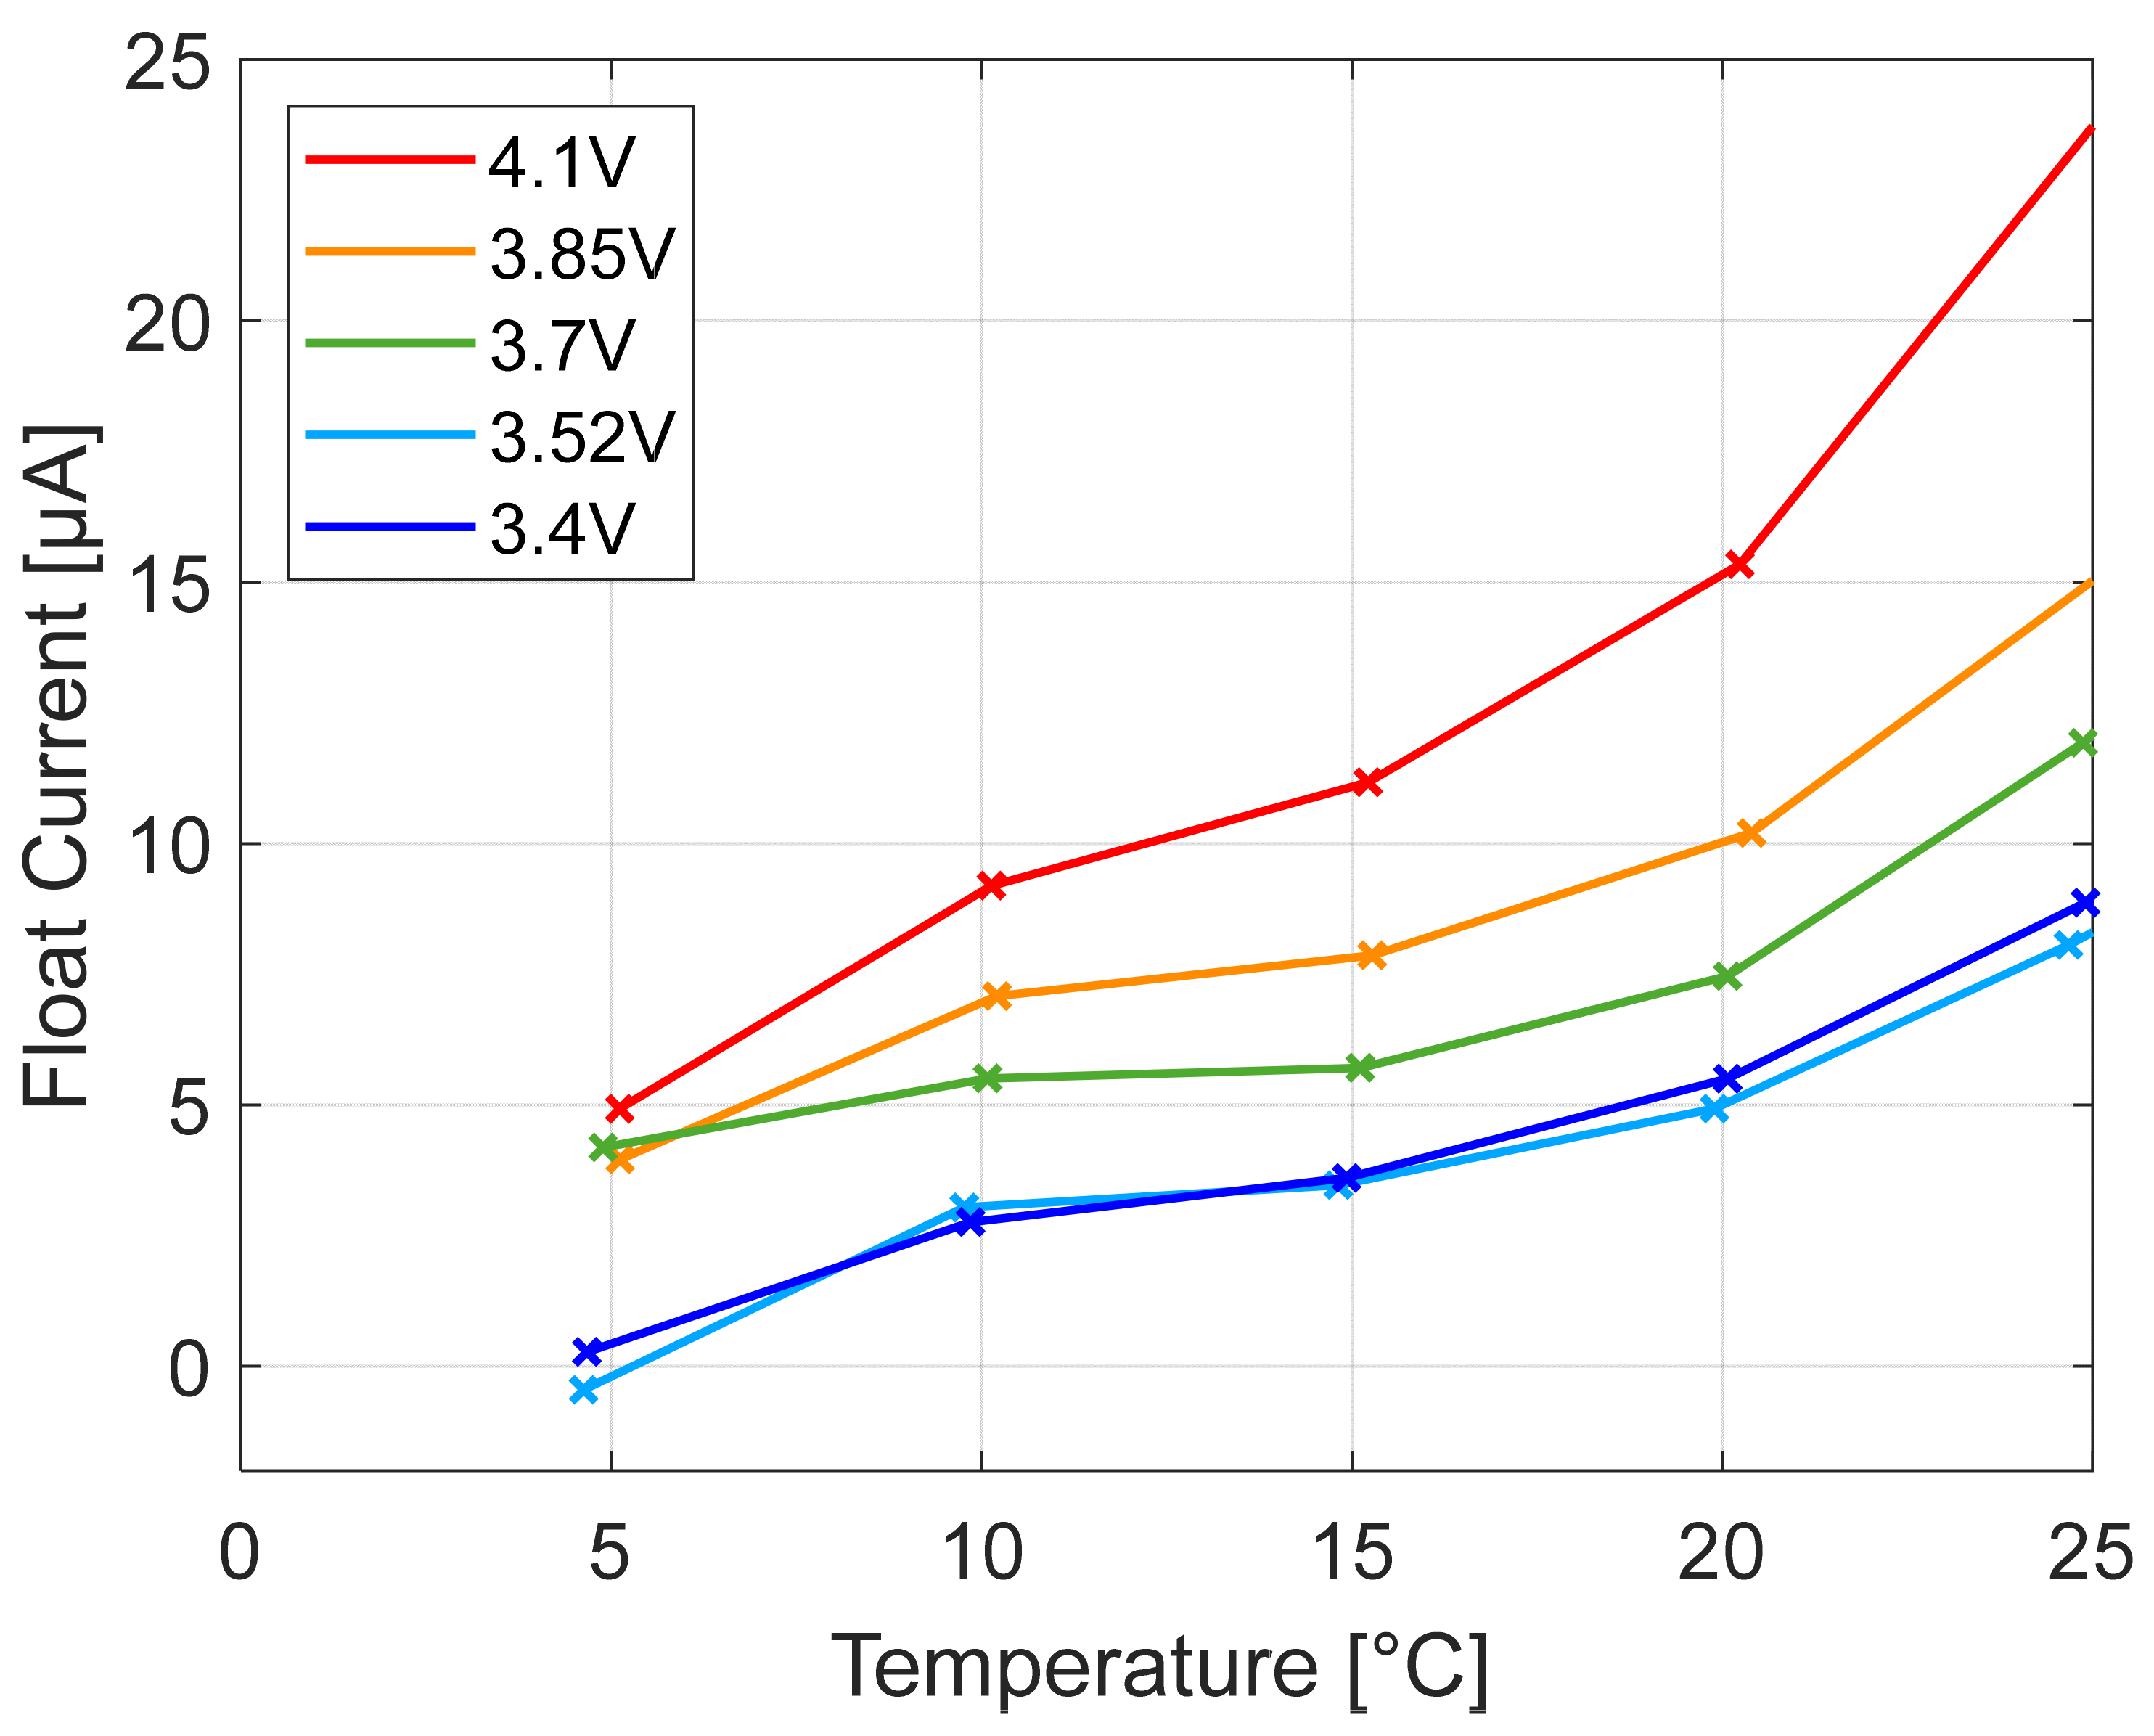
3.4. Float Current Evaluation
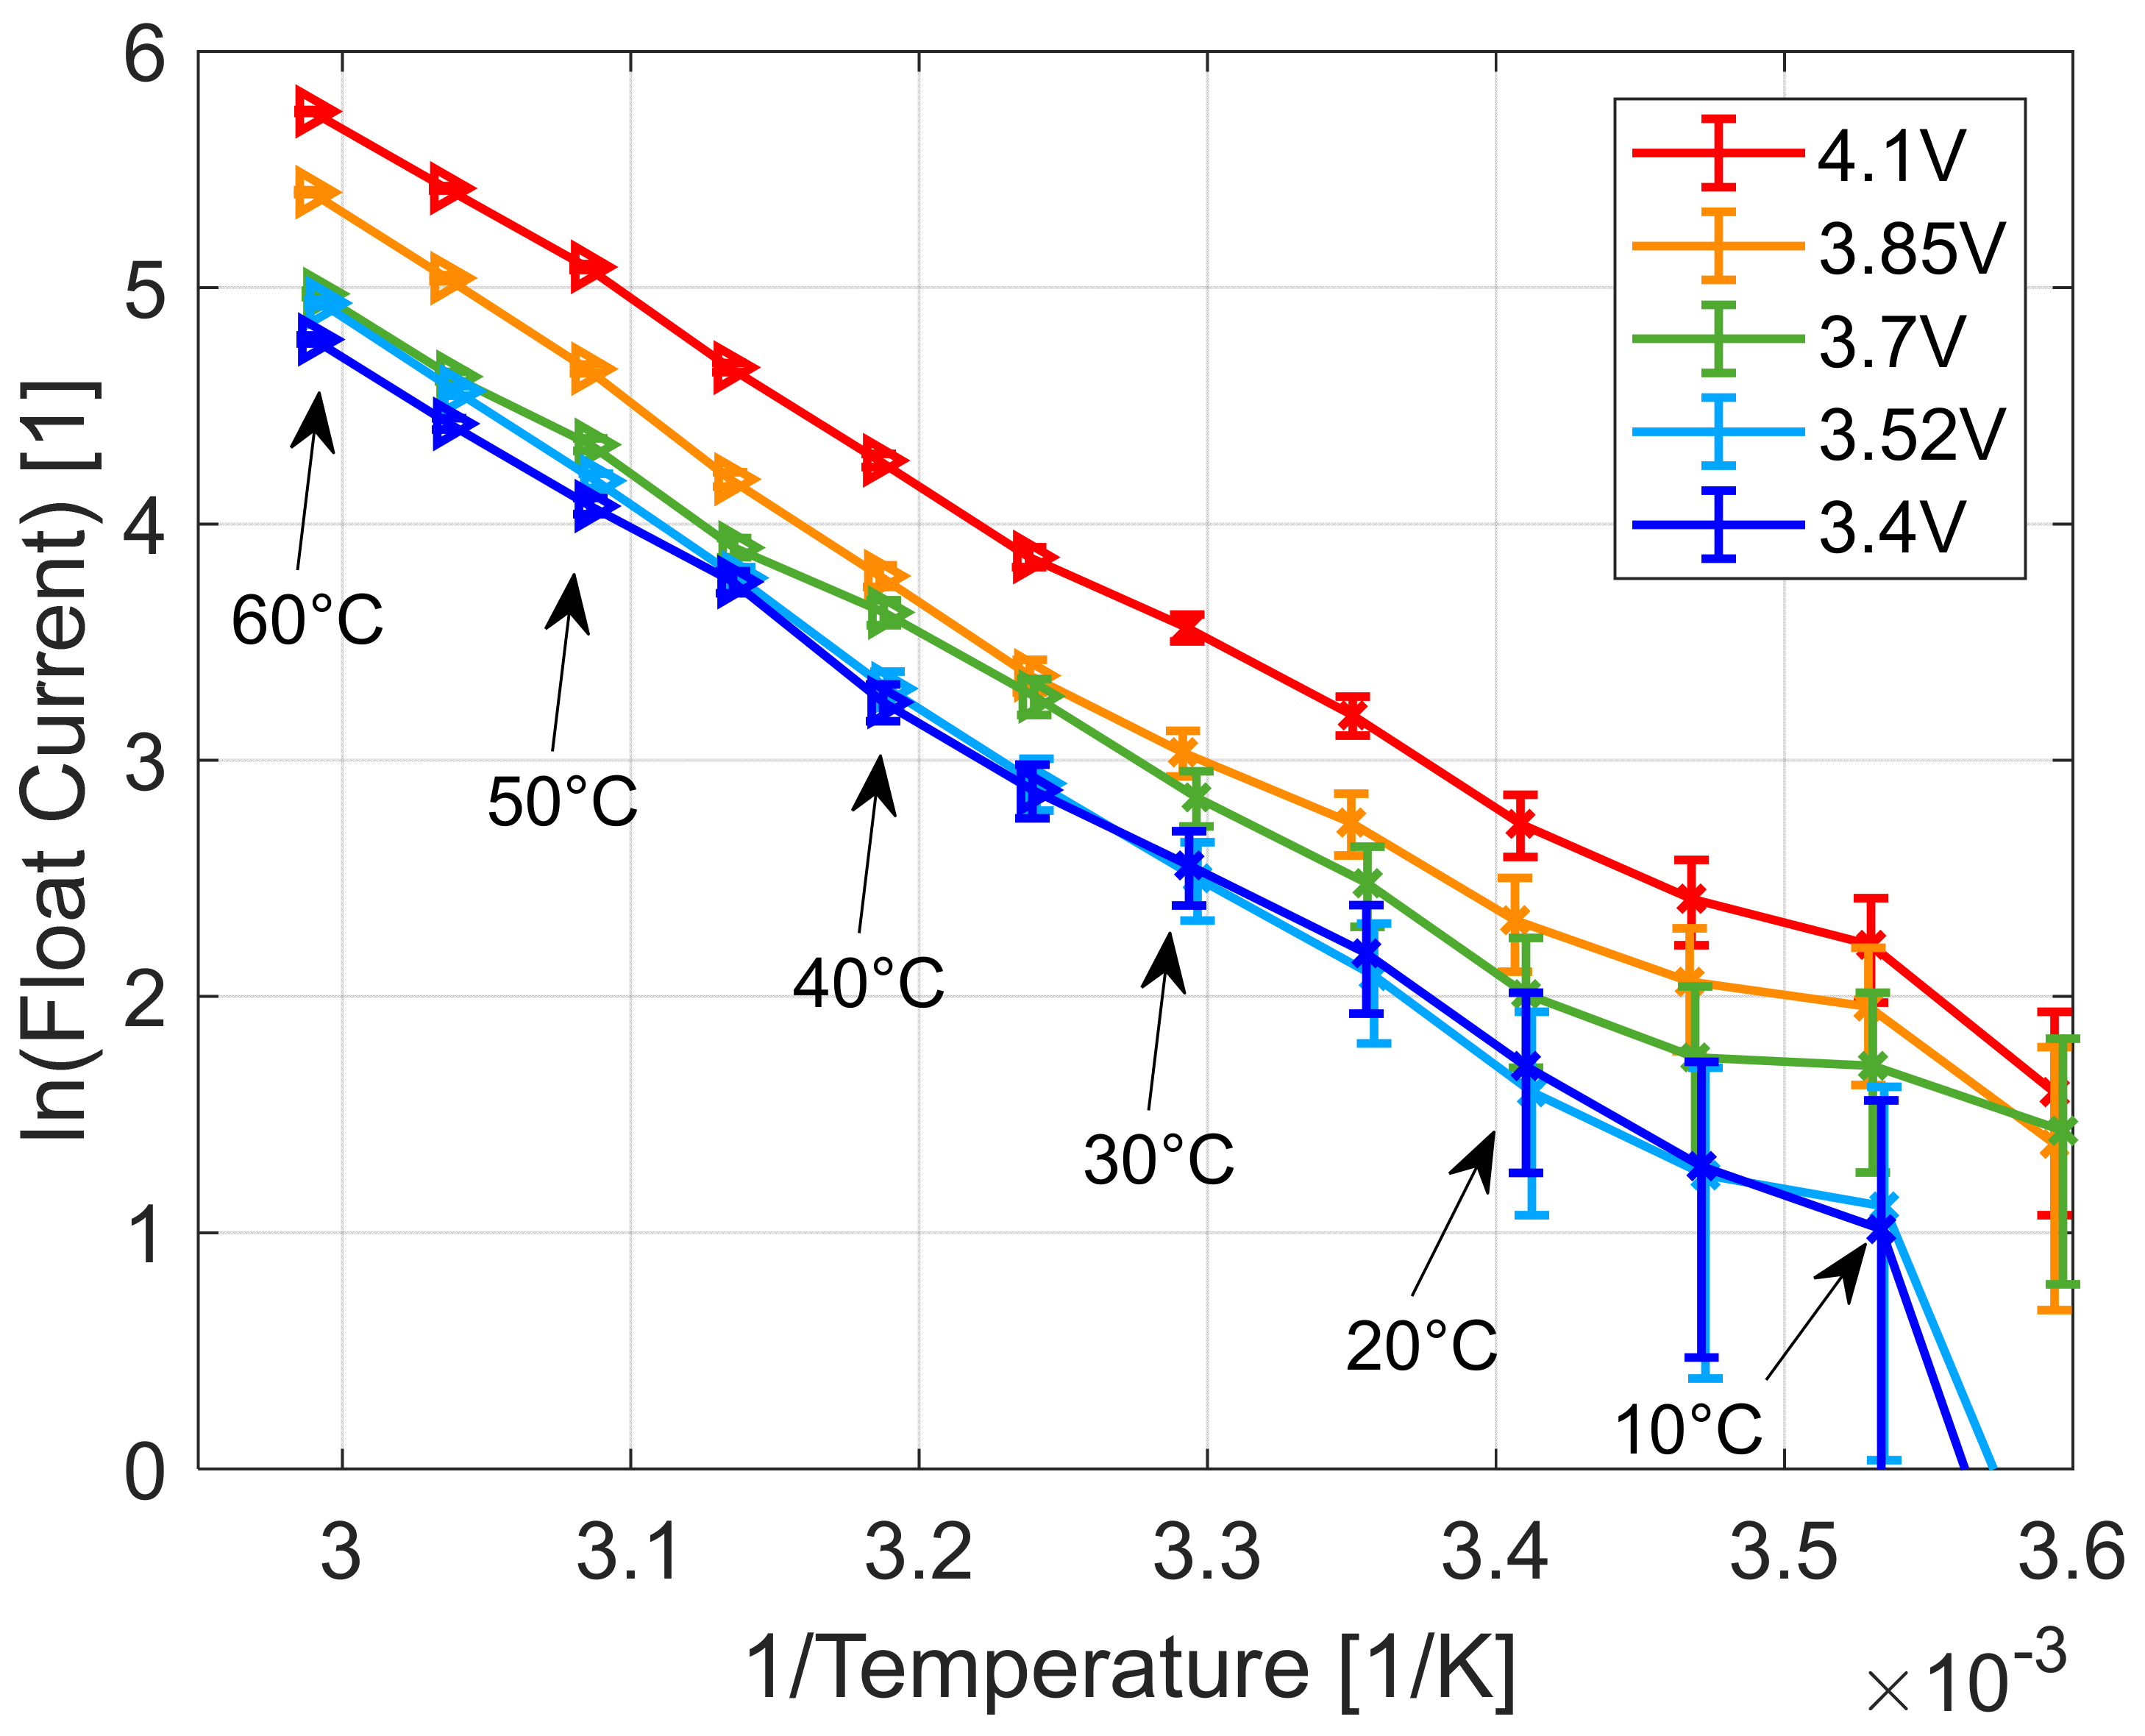
At first, the dependence of the cell potential over the temperature is evaluated.
Figure 7 depicts the entire temperature range from 5 to 60 °C. The float current increases smoothly with higher cell potential and higher cell temperature.
Figure 8 shows only the low temperature behavior of the float current analysis in the range of 0 to 25 °C. Although the results at 5 °C are less trustworthy as the steady-state of the float current was not reached, we can deduce that this method is able to measure capacity fade rates for this 18650 cell down to about 0 °C at potentials greater than 3.7 V. For lower potentials, we assume the limit to be at about 5 °C. For larger cells with higher capacity and active surface, even lower temperatures will be measurable with the accuracy of the here used test bench.
The relation at a given cell potential in
Figure 7 follows an e-function of an electrochemical reaction.
R is the universal gas constant and
is the activation energy. The according representation is the Arrhenius plot given in
Figure 9 Here, one can observe that at 5 °C the cells were not yet in a steady-state so they appear as a clear outlier. For each measurement point, the method-specific estimated error is added with error bars.
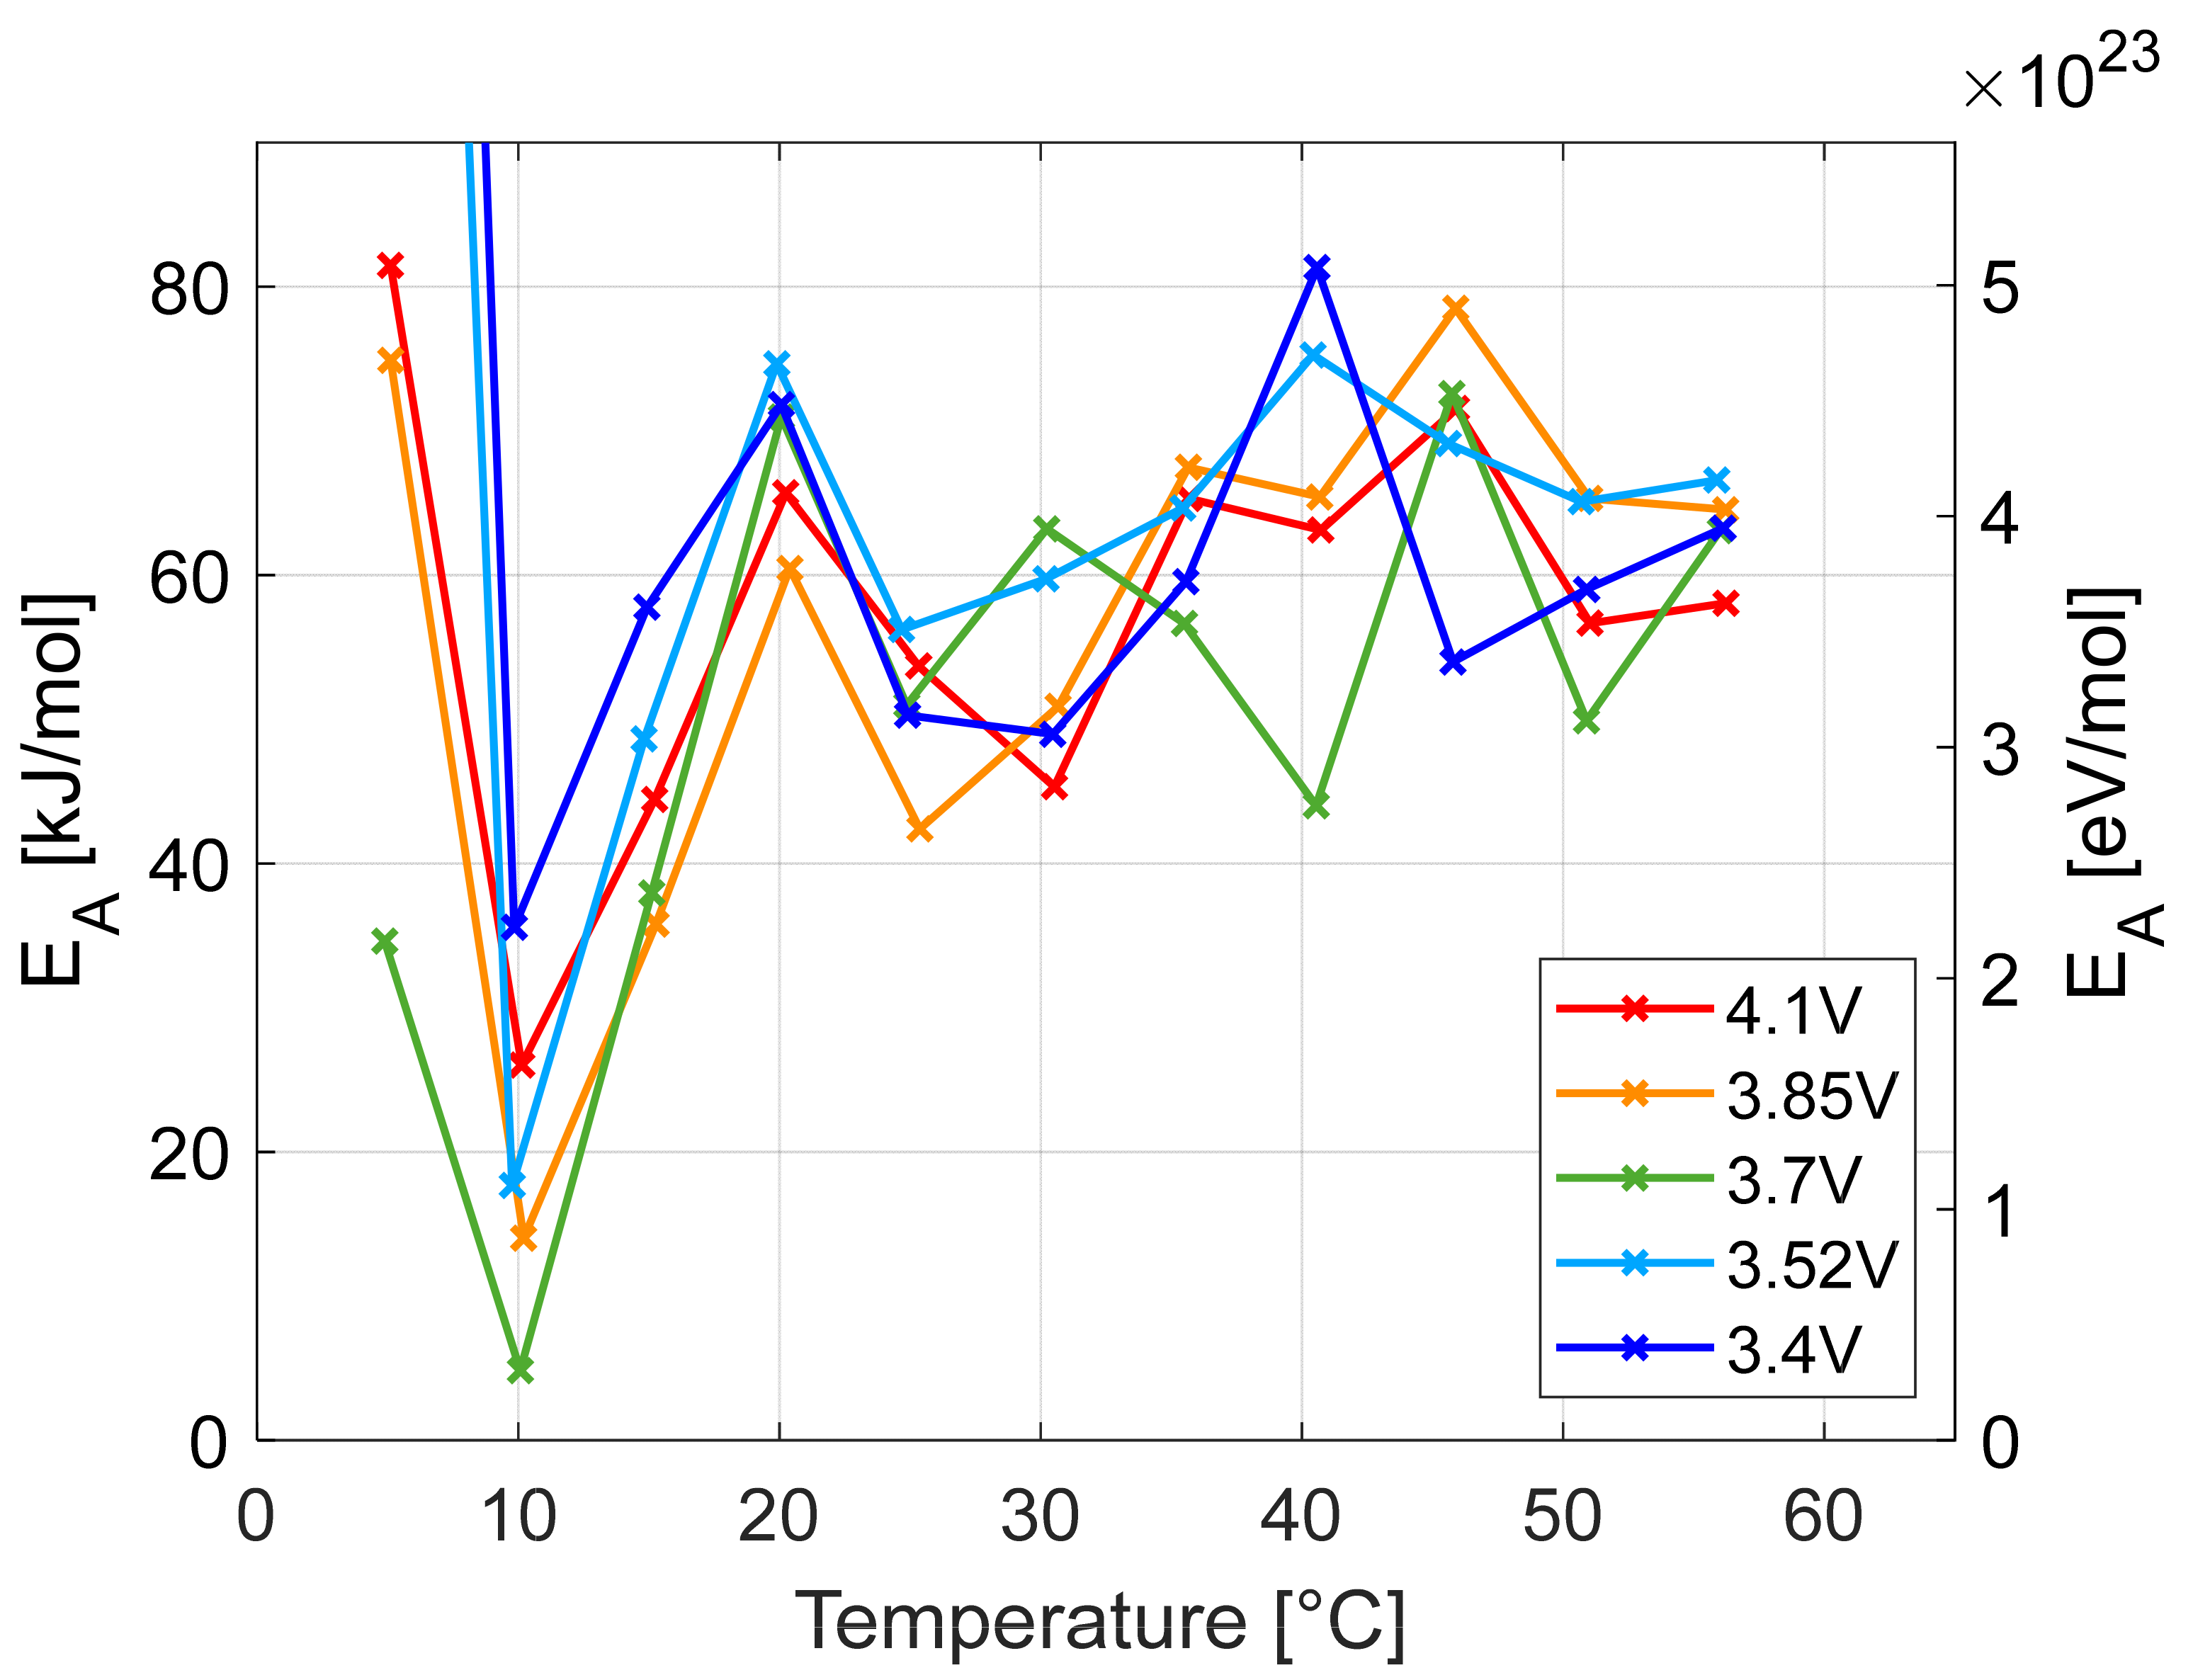
The activation energy
is calculated from the slope of the Arrhenius representation by
and is shown in
Figure 10 over temperature for five voltages. The activation energy is not constant and varies within 30–90 kJ/mol (0.31–0.94 eV) with an average value of ~60 kJ/mol (0.62 eV). In the review by Waldmann et al. [
34], the regime for de-solvation and moving lithium-ions into the graphite lattice is measured as 0.3–0.7 eV. This fits the results of an earlier paper performing float current tests by Lewerenz et al. [
3] with 64.5 kJ/mol (0.67 eV) for LiMn
1/3Ni
1/3Co
1/3O
2/graphite cells. The trends are nearly the same for all test potentials but do not sort according to cell potential. Higher variation is observable at lower temperatures and SOC, but the errors are also higher for these test conditions.
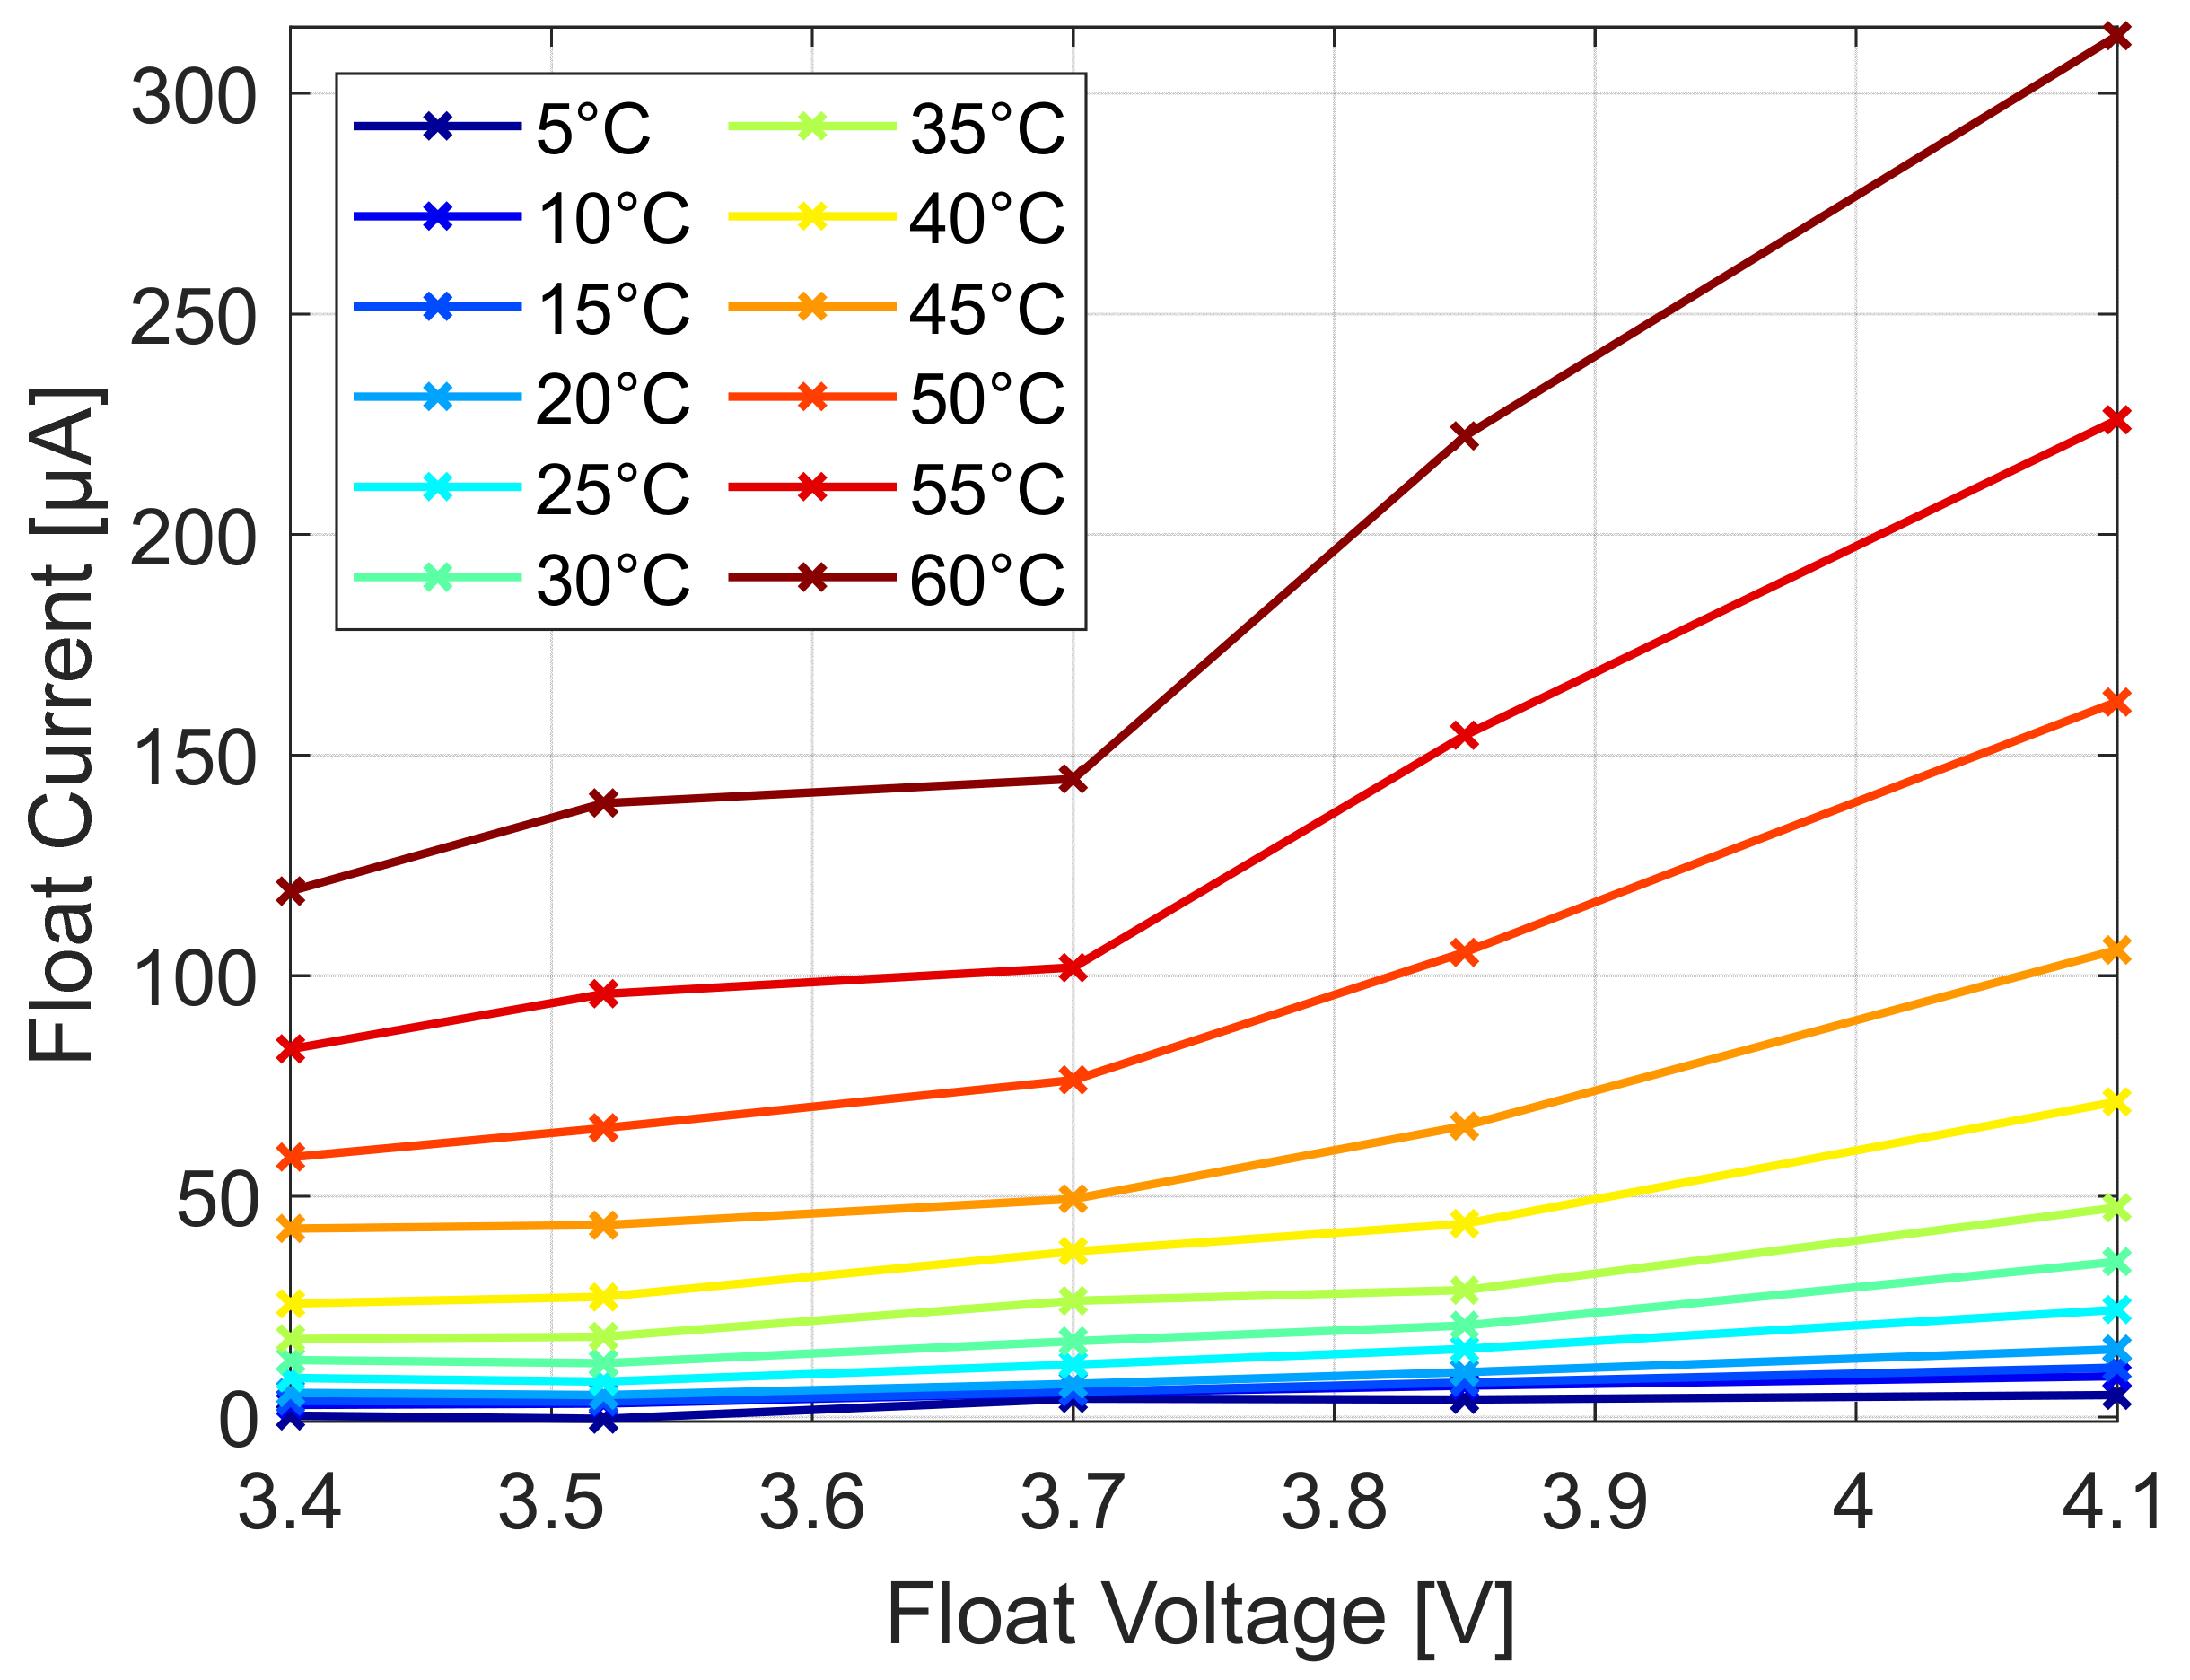
A representation of the float current over the cell voltage for different setpoint temperatures is given in
Figure 11 The float current increases with temperature and with cell voltage but the increase over the cell potential is not smooth but increases in at least two different slopes. The cell potential at the transition between these parts shifts to lower potential with increasing temperature. Therefore, the optimum maximum voltage to reduce strong aging at a given temperature can be determined to guarantee long life.
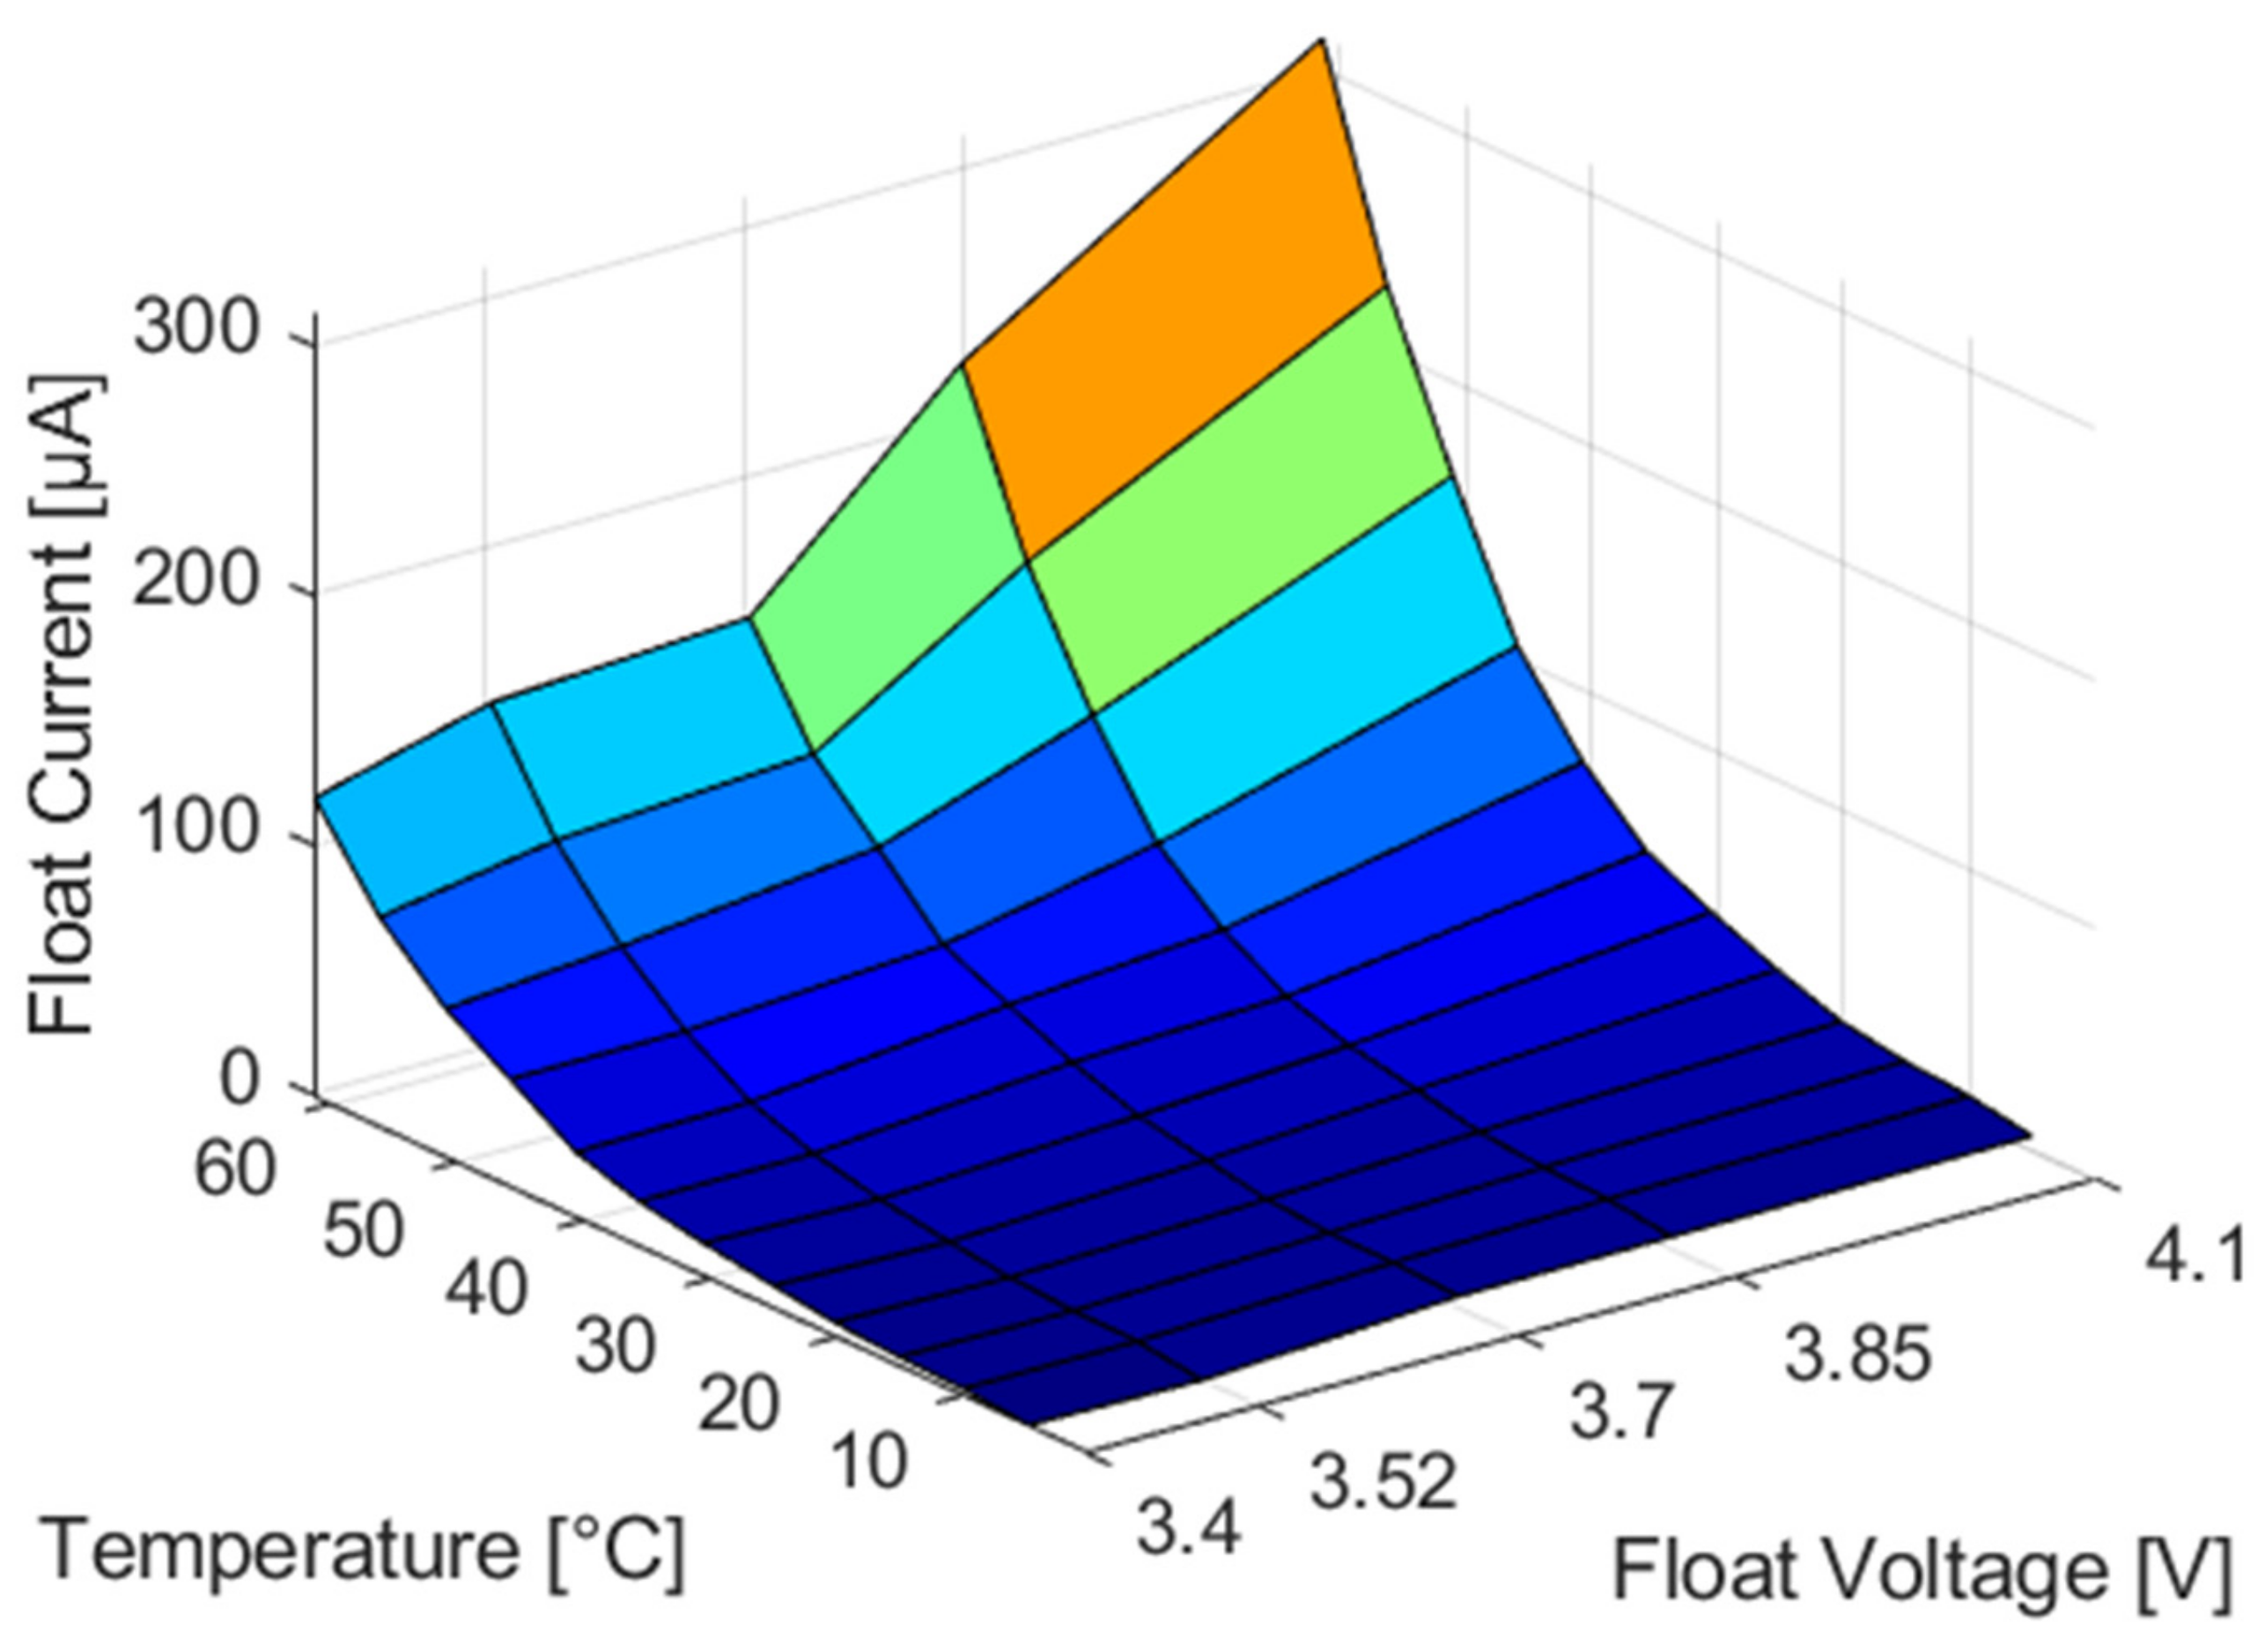
The results in
Figure 7 and
Figure 11 are merged in a 3D plot in
Figure 12. The float current pattern has comparable trend to the expected capacity loss representations for Li(Ni
xMn
yCo
z)O
2/graphite [
35] and Li(Ni
6Mn
2Co
2)O
2/graphite [
13] with the difference that they did not include the anode overhang effect leading to a graphite pattern over cell potential. However, with float currents, the anode overhang effect is excluded. At low temperatures, the aging is independent of the float voltage, while, at high temperatures, even cells with a low potential suffer from strong degradation. As expected, we obtained the highest float currents at high temperatures and high cell potentials.
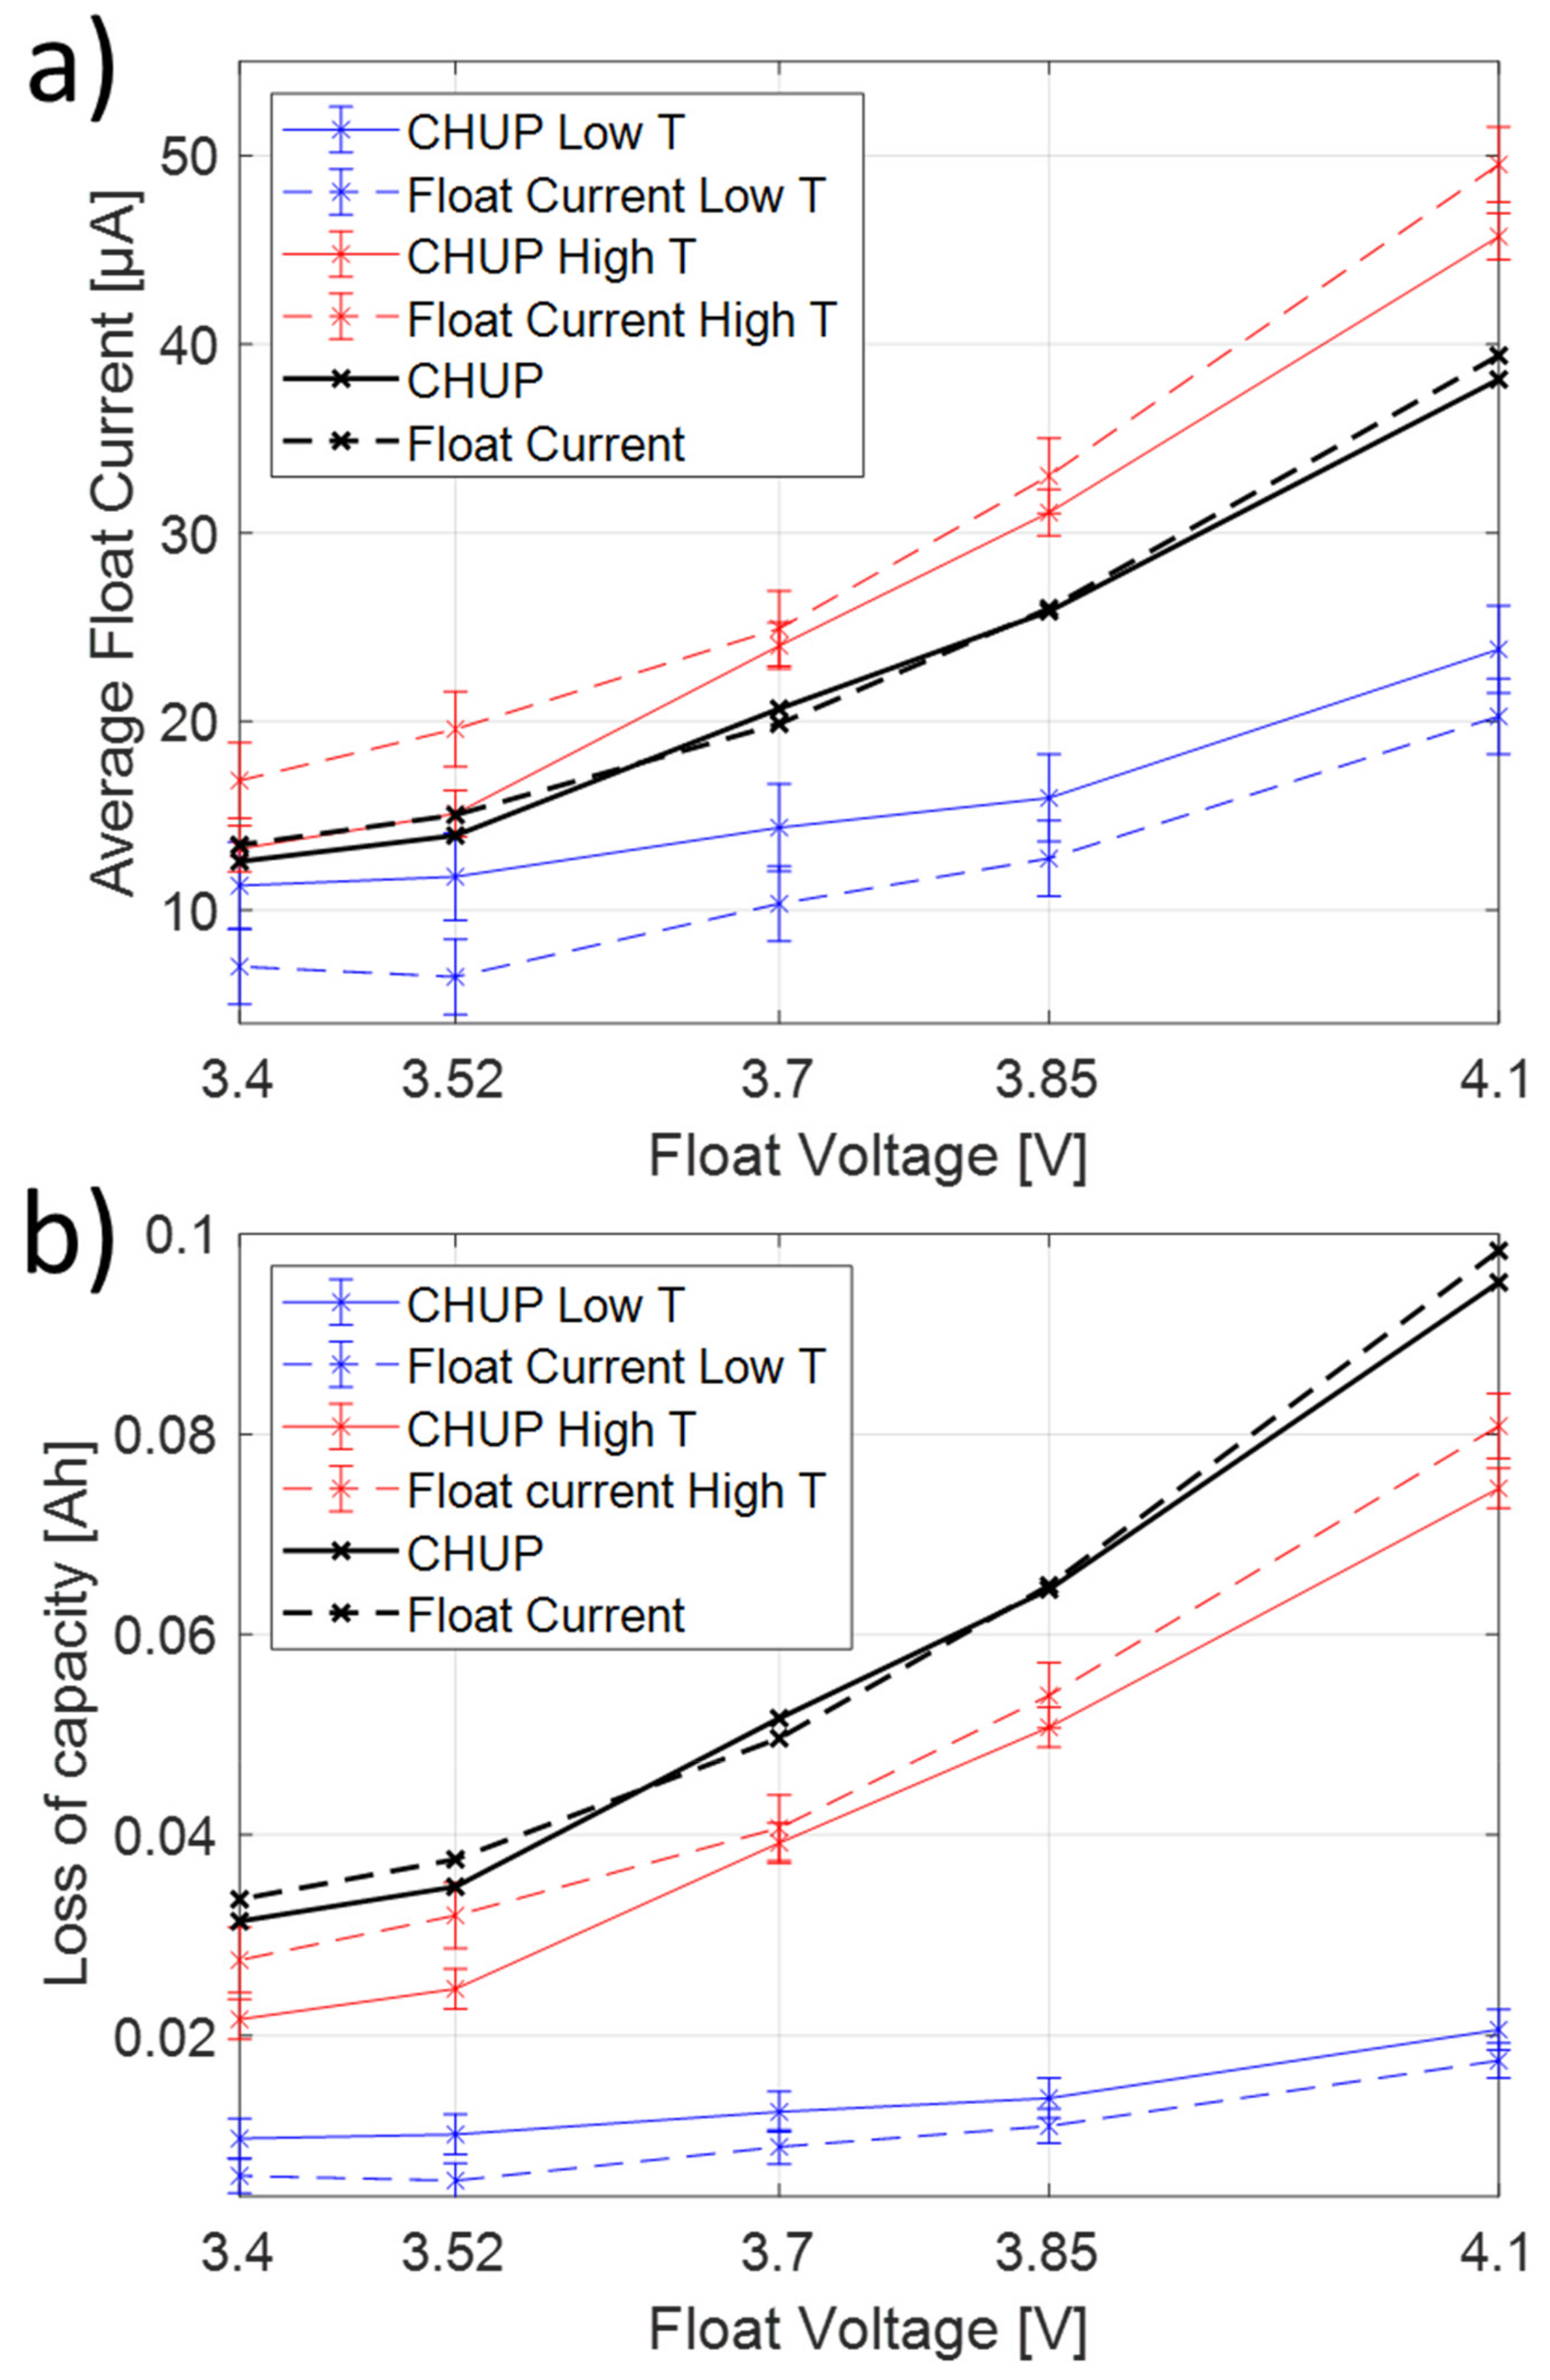
3.5. Float Current and Capacity Loss at 30 °C
At 30 °C reference temperature, a comparison between capacity loss via capacity test and float current is evaluated for the low and high temperature cycles. Therefore, the difference of the extractable capacity
before and after the temperature cycle is compared to the accumulated capacity during floating
calculated by the sum of the products of current
and its duration
in each constant temperature phase i.
Figure 13 presents the results for the low (blue) and high temperature sequence (red) and the combination of both (black). In
Figure 13a the average float current and in
Figure 13b the corresponding capacity loss in the period is given. The error of the float current is assumed to be ±2 µA and for the check-up to be ±2 mAh.
There is a high correlation for both temperature sequences between capacity test results and float currents, and all curves show increasing losses with cell potential. For the low temperature sequence, for all values, the float currents are lower than for the check-up; for high temperatures, this is vice versa. The difference in capacity loss of both methods is in the low temperature cycle, with 3–5 mAh, corresponding to 0.1–0.2%, rather small. In the high temperature cycle, the difference is, with 2–7 mAh (0.1–0.3%), slightly stronger, especially for low and high float voltages. Considering both temperature sequences (black curves), the differences between the capacity losses obtained by both methods become even lower.
Thus, it can be concluded that the observed trends show a high correlation and that the absolute values are comparable considering the estimated error and that the offset is opposite for low and high temperature sequence. The lifetime can be predicted by integration of the float current until, e.g., 80% remaining capacity is reached. In this case, anode overhang effect is neglected. Repeating both temperature cycles continuously, the predicted lifetime ranges from 4.4 years at 3.4 V (13 µA) to 1.5 years at 4.1 V (38.5 µA).
The key question is still to name the root cause for the float current and why it is linked to capacity fade as shown before. The DVA results show mainly LLI losses and for the high temperature cycle additional cathode material losses that increase with cell potential. However, in
Figure 13, we observe a difference between low and high temperature cycles by an offset but without dependence of cell potential. As the measured float current is higher than the capacity loss, we suggest that the cathode aging leads to a higher float current but not to a capacity loss in the same way as visible in
Figure 13 by the offset. The main contribution to float current is assumed to originate from SEI formation during aging. How SEI formation triggers a self-discharge reaction that is recharged by a float current will be the scope of future publications.
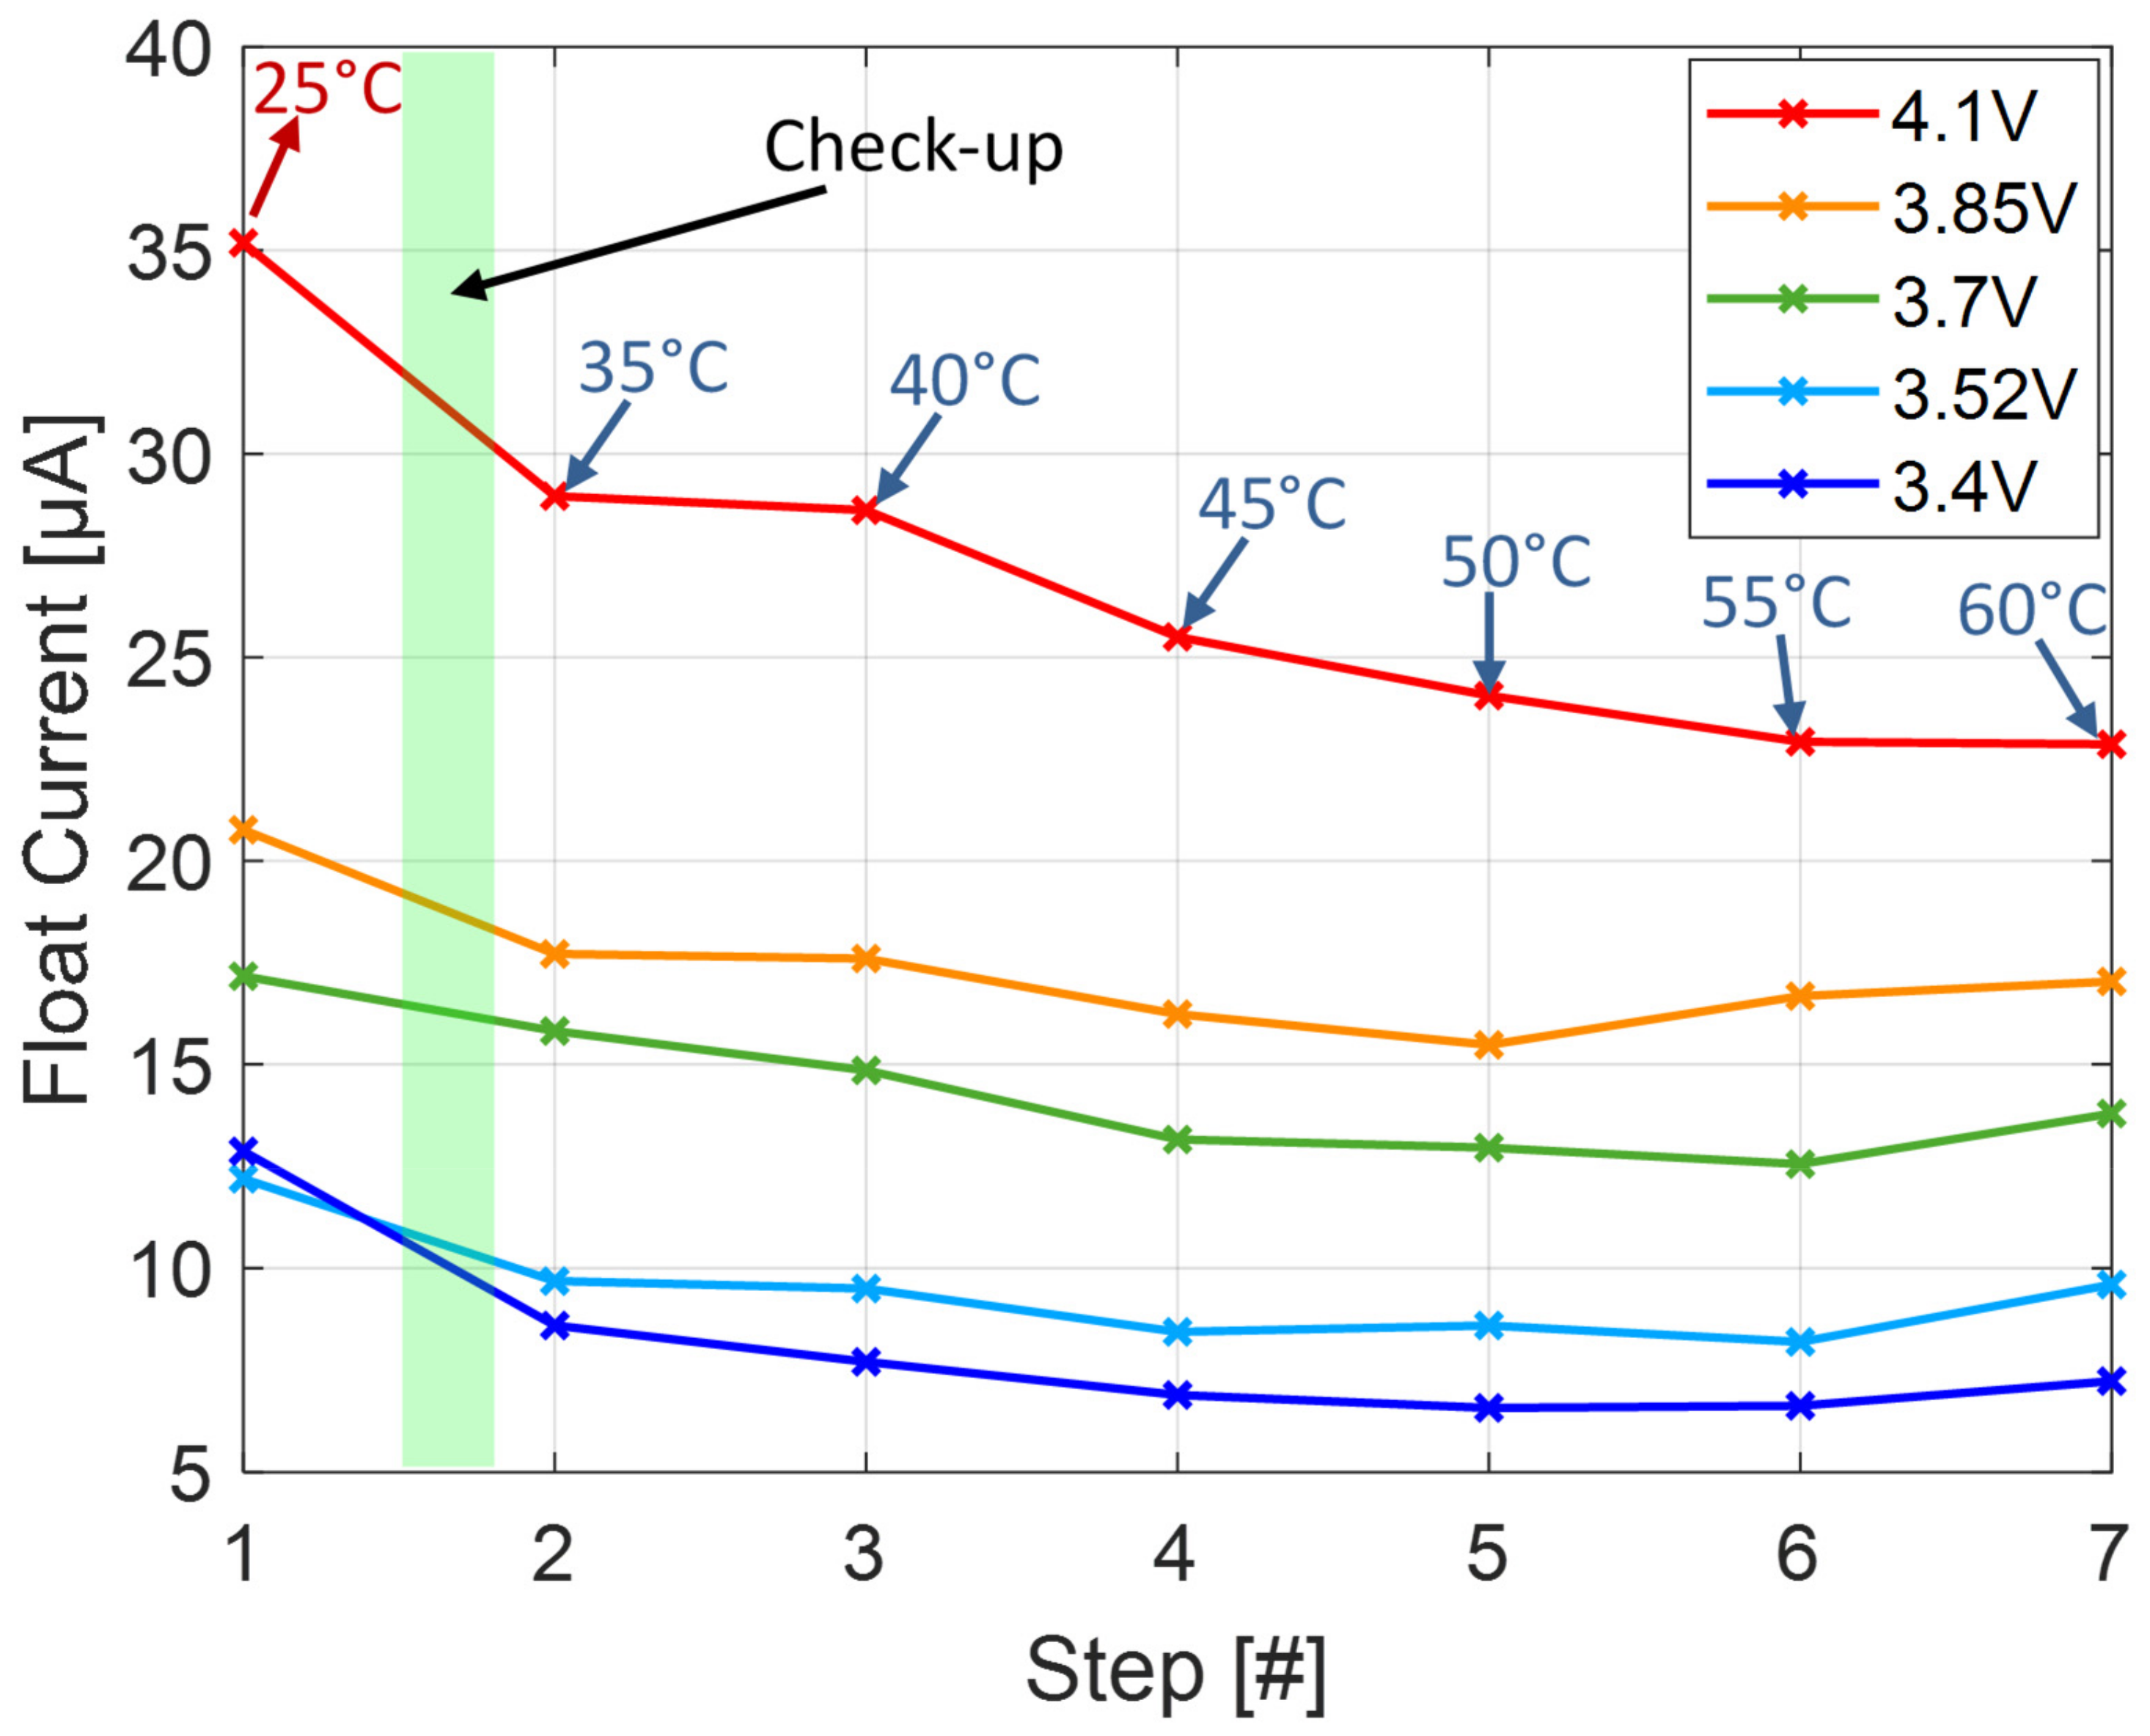
3.6. Reproducibility of Float Currents at 30 °C
Finally, we check the reproducibility of the float current by path dependence at the reference temperature of 30 °C (see
Figure 14). The reference value at 30 °C is measured before and after the low temperature sequence and after each temperature increase within the high temperature sequence. In the following, all these measurements are compared to each other.
The float current is decreasing with aging and/or increasing temperature drop. The drop is higher for higher float voltage. This can be caused by a hysteresis effect according to temperature step and sign, as reported by Zilberman [
33], and/or by reducing active surface due to aging at higher temperatures.
A decreasing active surface would reduce the float current in the same percentage, leading to significant deviations in the Arrhenius representation, which is not the observable towards higher temperatures. A constant offset of 10 µA for 4.1 V and 2–5 µA for all other float potentials would be hardly visible for higher temperatures in
Figure 7 due to the already high float currents. As the results in
Figure 7 were obtained after raising the temperature, the hysteresis theory is favored by the authors. However, more tests have to be conducted in the future to understand this phenomenon with more distinction.


