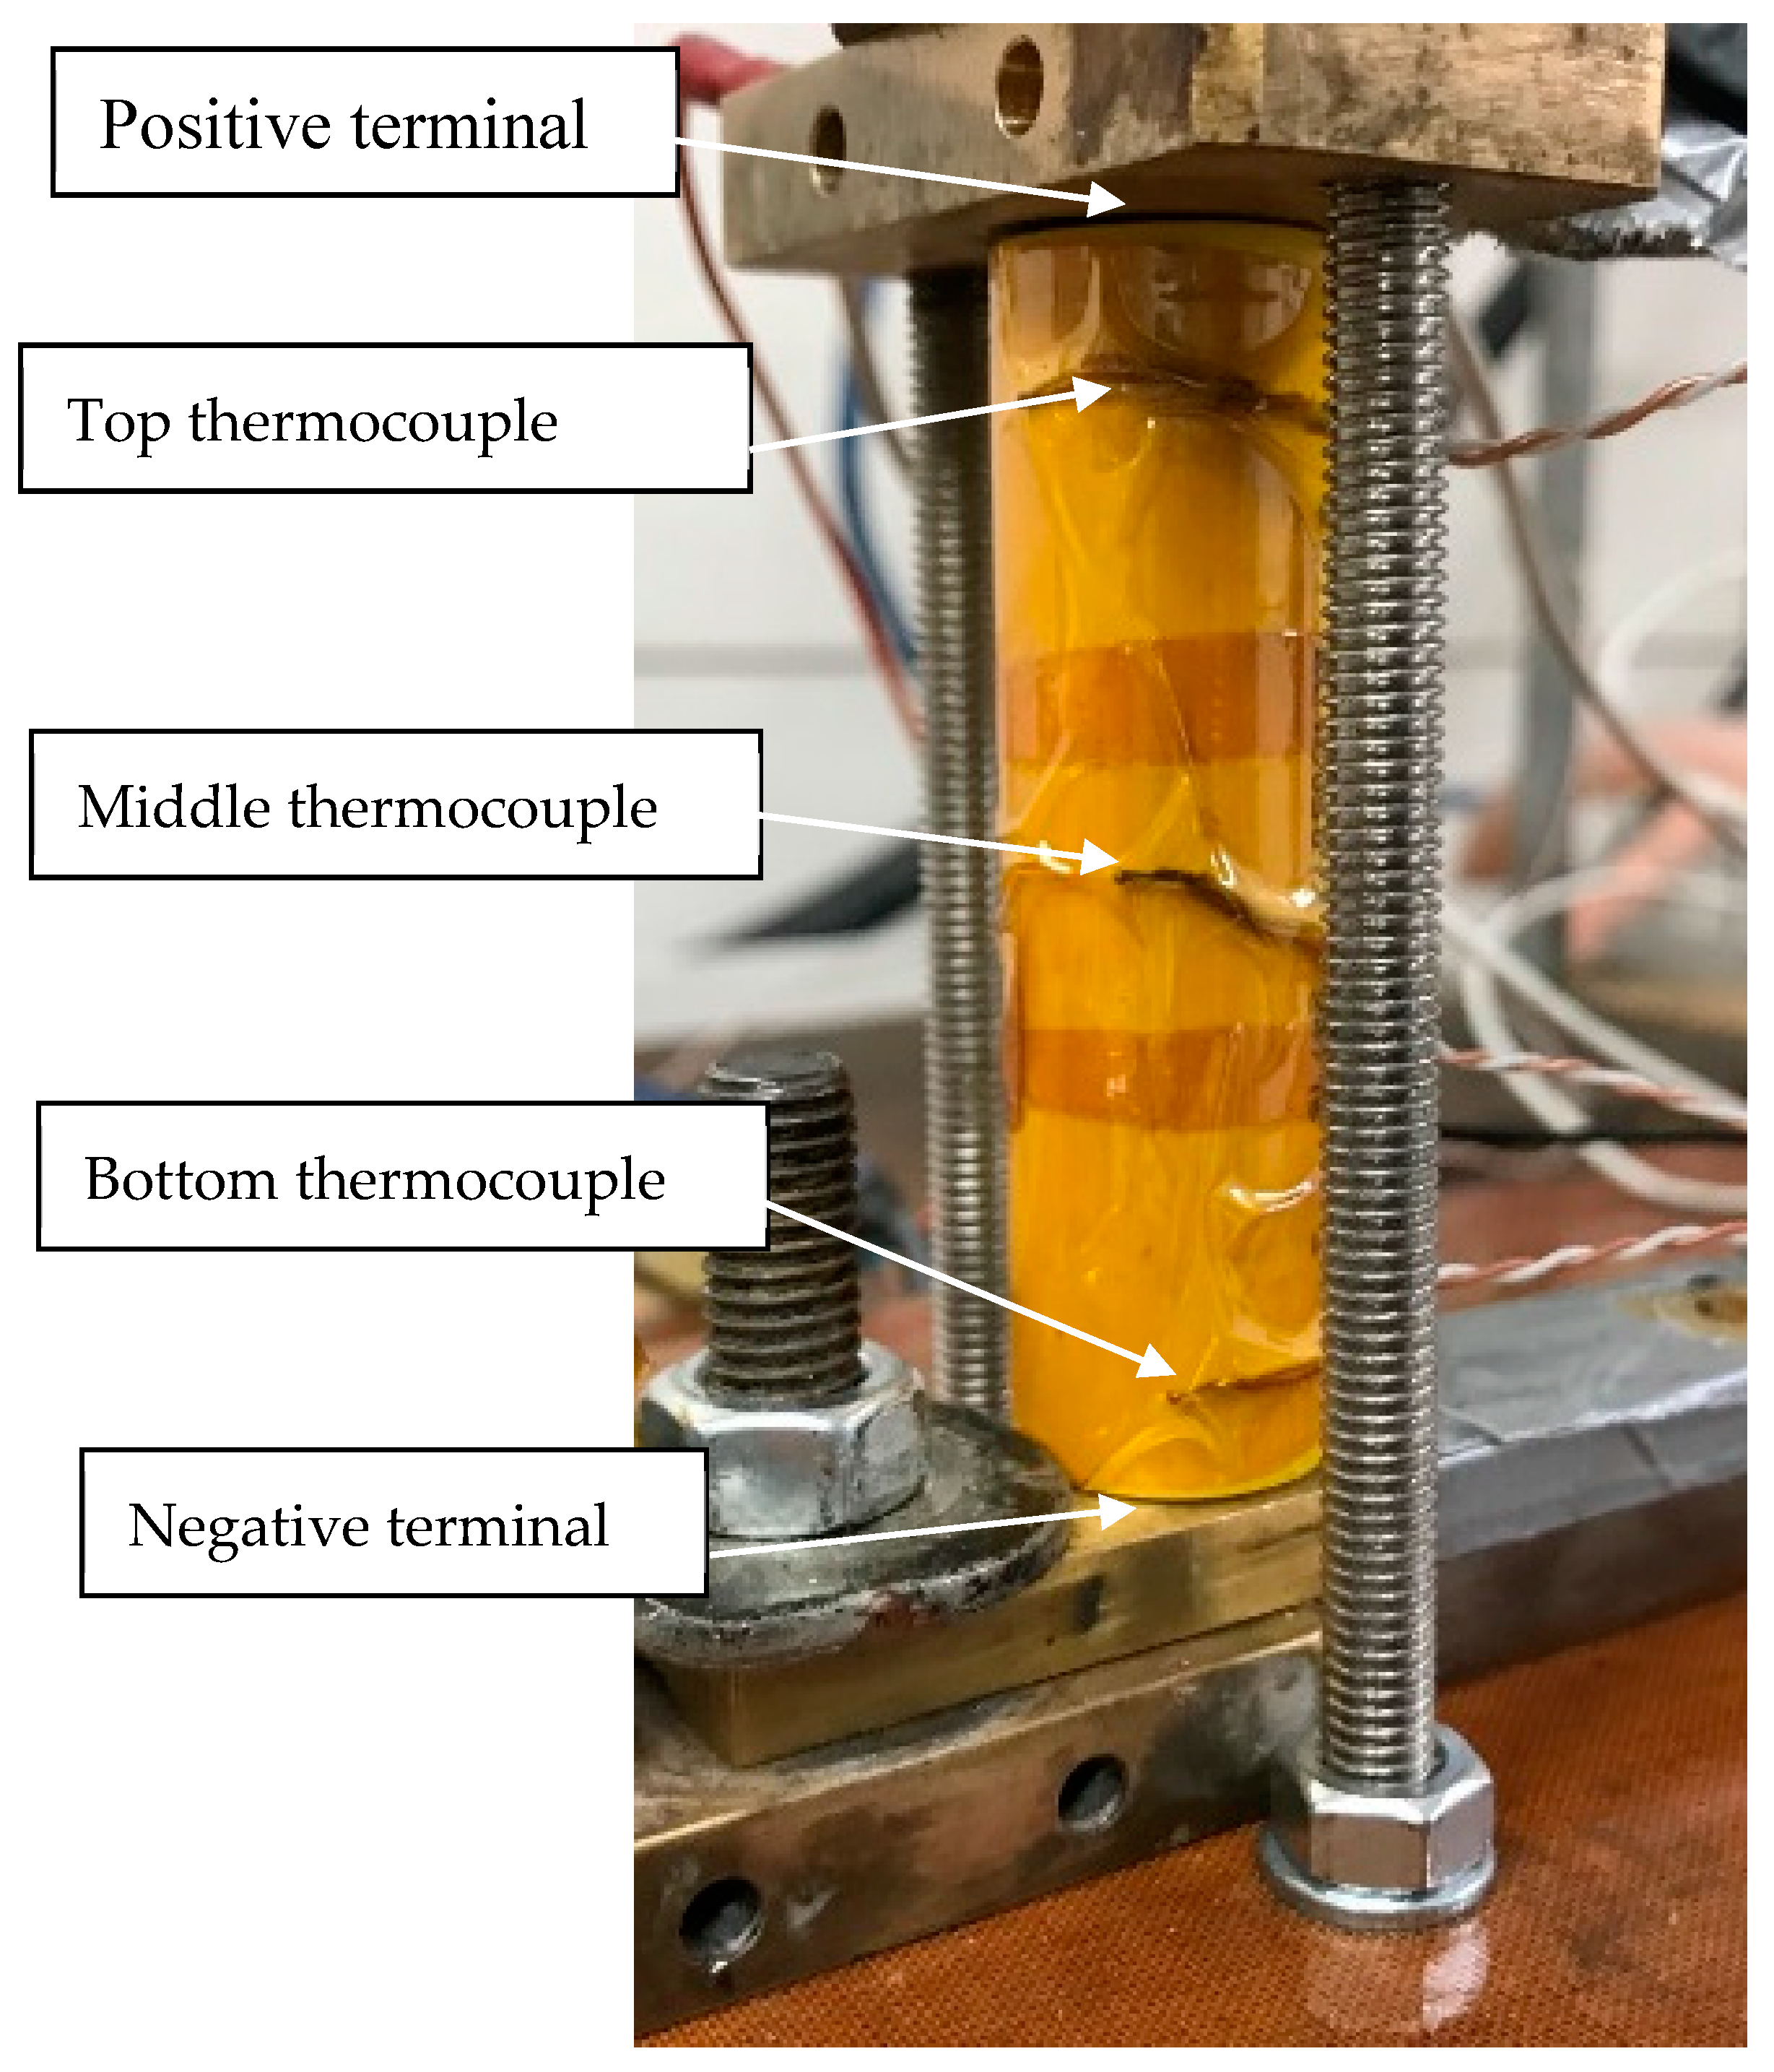
2.1. Cell Testing and Characterisation
2.1.1. Cell Failure Test
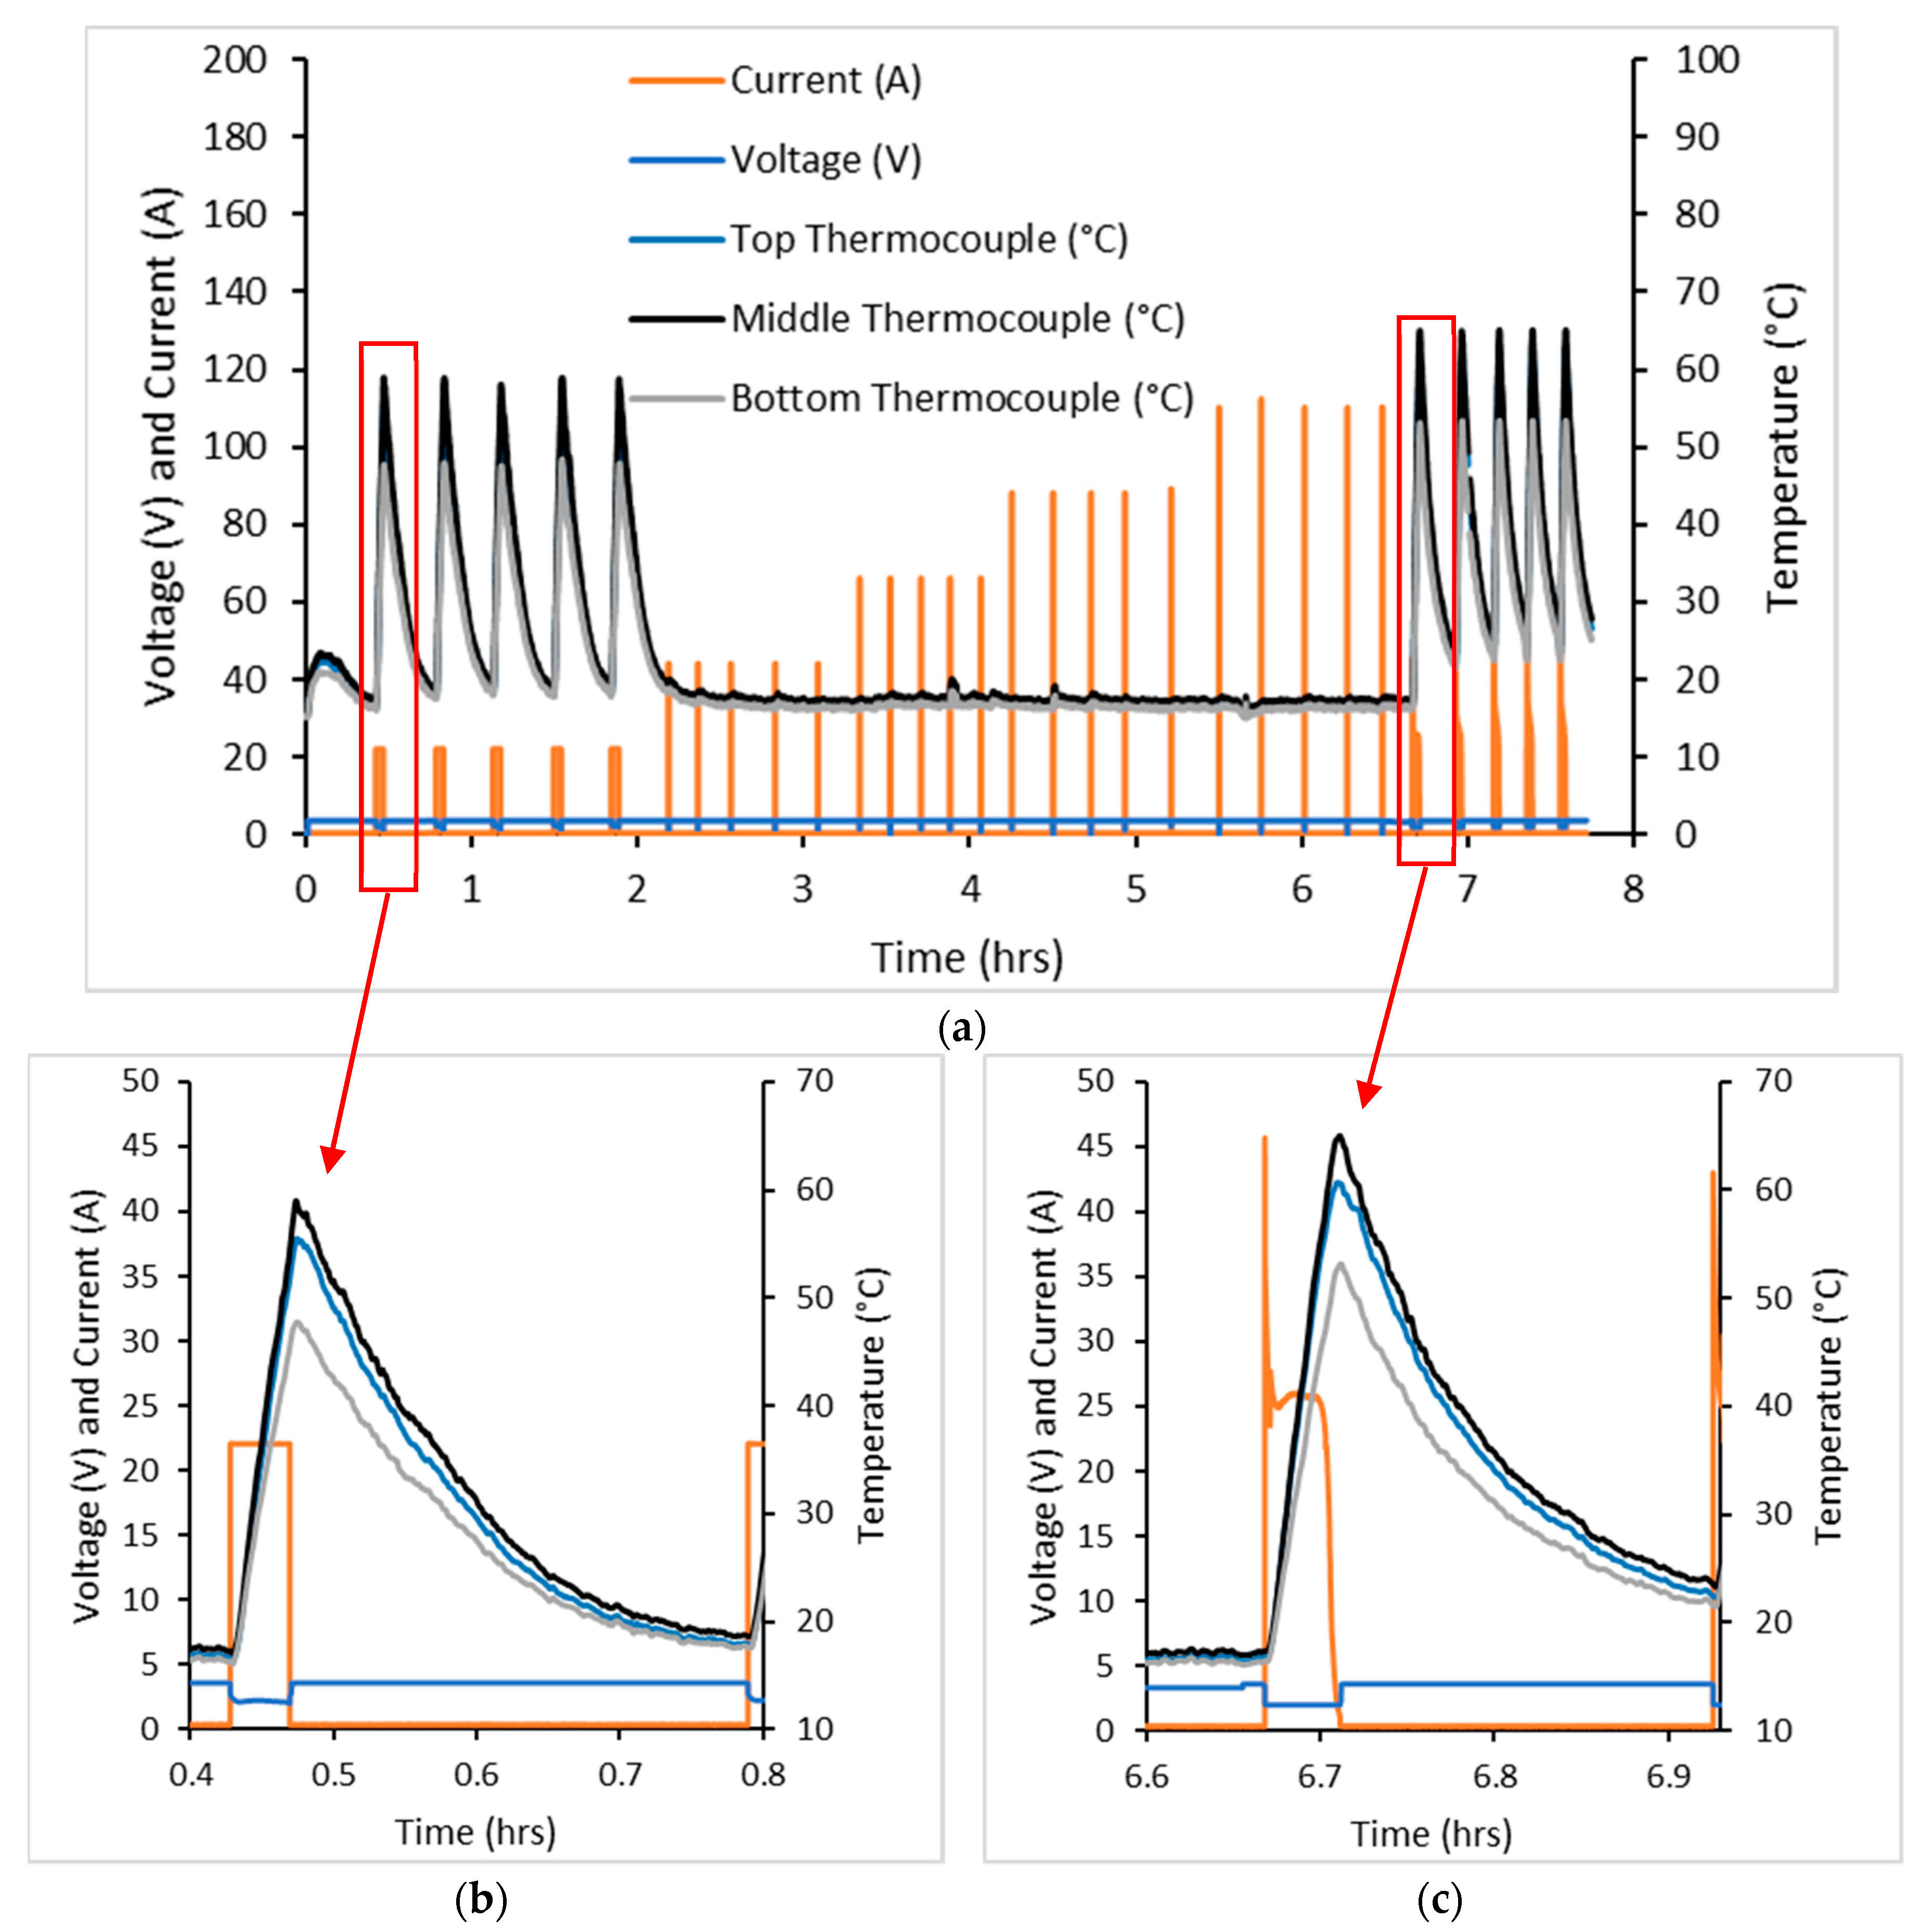
Three cells were tested in the cell failure test with typical data shown by
Figure 1. Due to the equipment capabilities, currents were only able to be logged for the discharge process. Cell surface temperatures were logged for the entire process.
For this test, 20 C constant current (CC) and constant voltage (CV) were applied to charge the cell followed by 20 C CC discharge. This charge and discharge cycle was applied five times and increased by 20 C a further five times until 100 C was applied. The final five cycles involved 20 C CC and CV charge followed by CV discharge.
Cell temperatures rose by approximately 35 °C during the first five cycles of the test, but with further current increases they only rose by 2 °C. This was due to the testing equipment registering maximum and minimum voltages rapidly, such that the current was only applied for a short period of time, resulting in minimal change in cell temperature. The final CV discharge steps resulted in a cell temperature change of 40 °C higher than the CC discharge steps. Despite this testing regime, the cell did not undergo thermal runaway nor fail catastrophically.
Temperatures were logged at three locations on the outside surface of the cell during cell failure testing. This included the top (positive end), the middle and the bottom of the cell (negative end). The temperature of the cell increased markedly in discharge, with the middle of the cell increasing the most out of the three thermocouples. There was a 10 min pause after charging but no pause after discharge, so that charging of the cell took place as soon as the minimum operating voltage was achieved. As can be seen, temperatures of the cell increased after the discharge was stopped. This is likely to be due to:
Further temperature increases were experienced from discharge followed by charge
Temperature increases are only from discharge, with the latter being possible as a result of the heat taking some time to dissipate out of the cell.
The cell failure test showed that the maximum current that the cell could still function and safely withstand was 20 C. This current was applied in the high rate cycling test.
2.1.2. High Rate Cycling Test
Three cells were subjected to high rate cycling tests involving applying currents of 20 C CC followed by CV in charge and 20 C CC discharge for a total of 500 cycles.
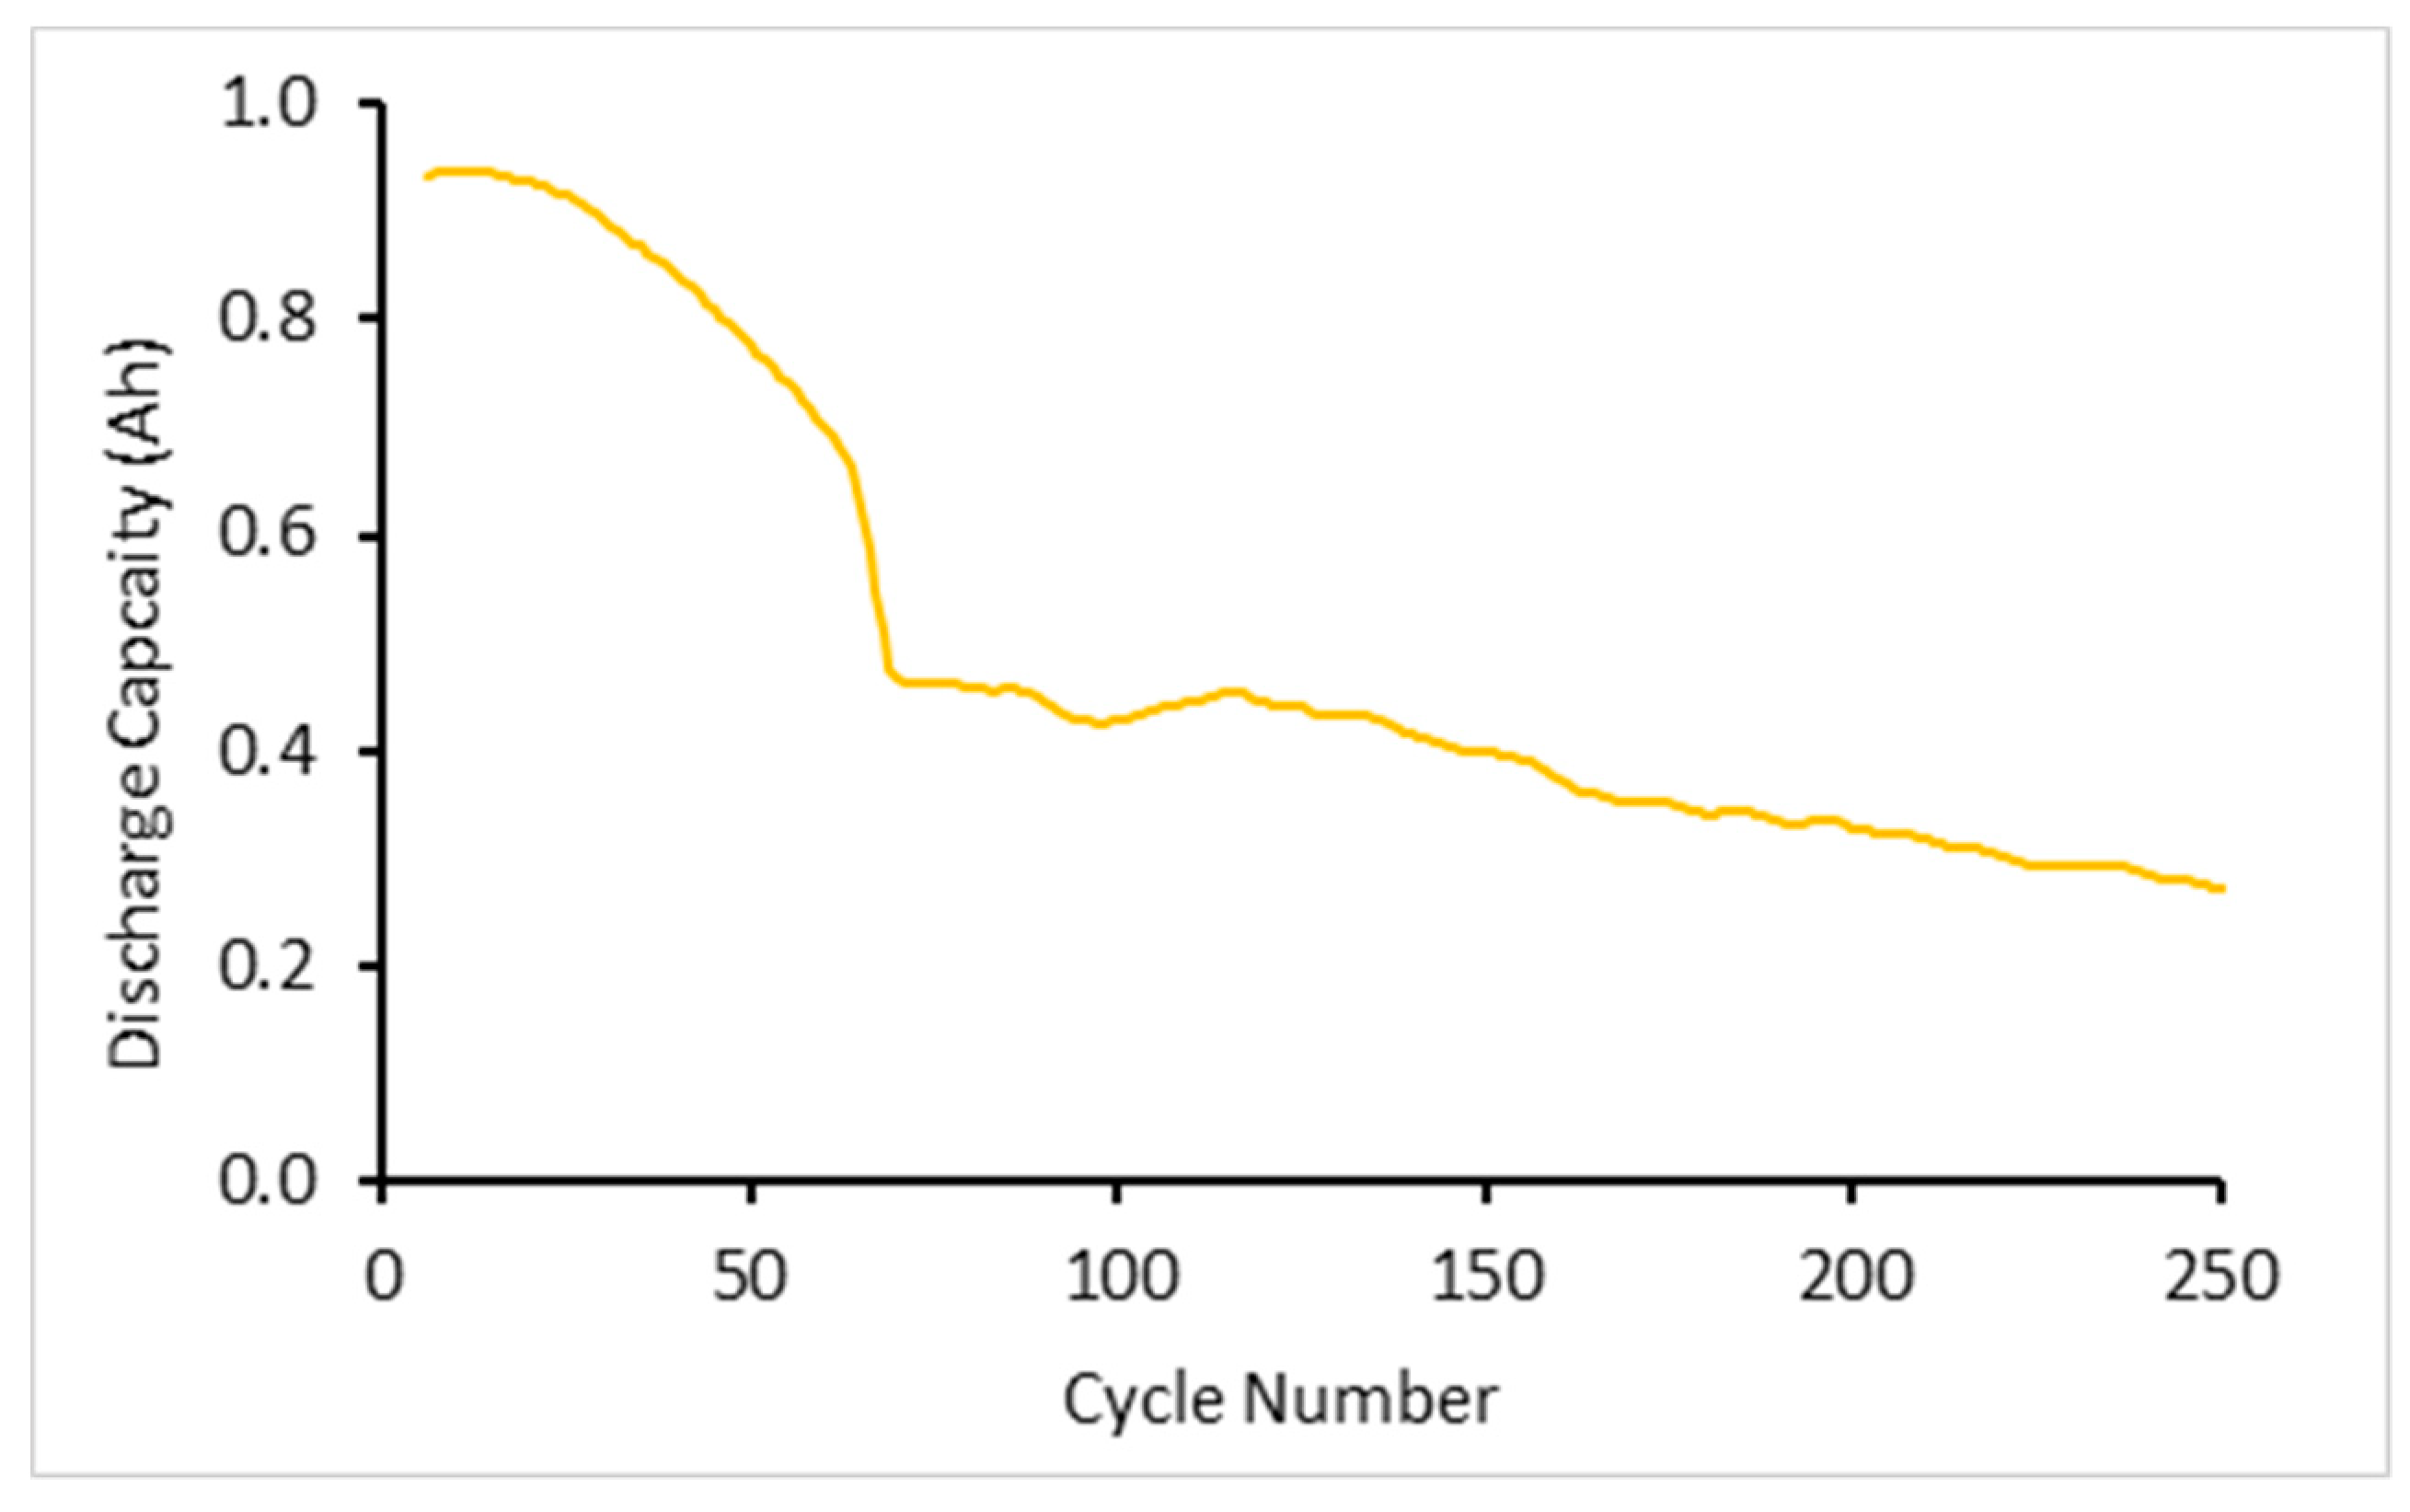
Figure 2 shows the average discharge capacity for the first 250 cycles. The discharge capacity rapidly declines in the first 60 cycles. This is likely to be due to the onset of deformation within the jellyroll as well as the formation of plating. Neither of these effects are reversible nor observed in the subsequent analysis. Furthermore, the average capacity of the cells under 20 C cycling conditions for both charge and discharge was shown to decrease by 13.6% due to testing with these currents, explaining the initial and continual drop from manufacturer stated 1.1 Ah.
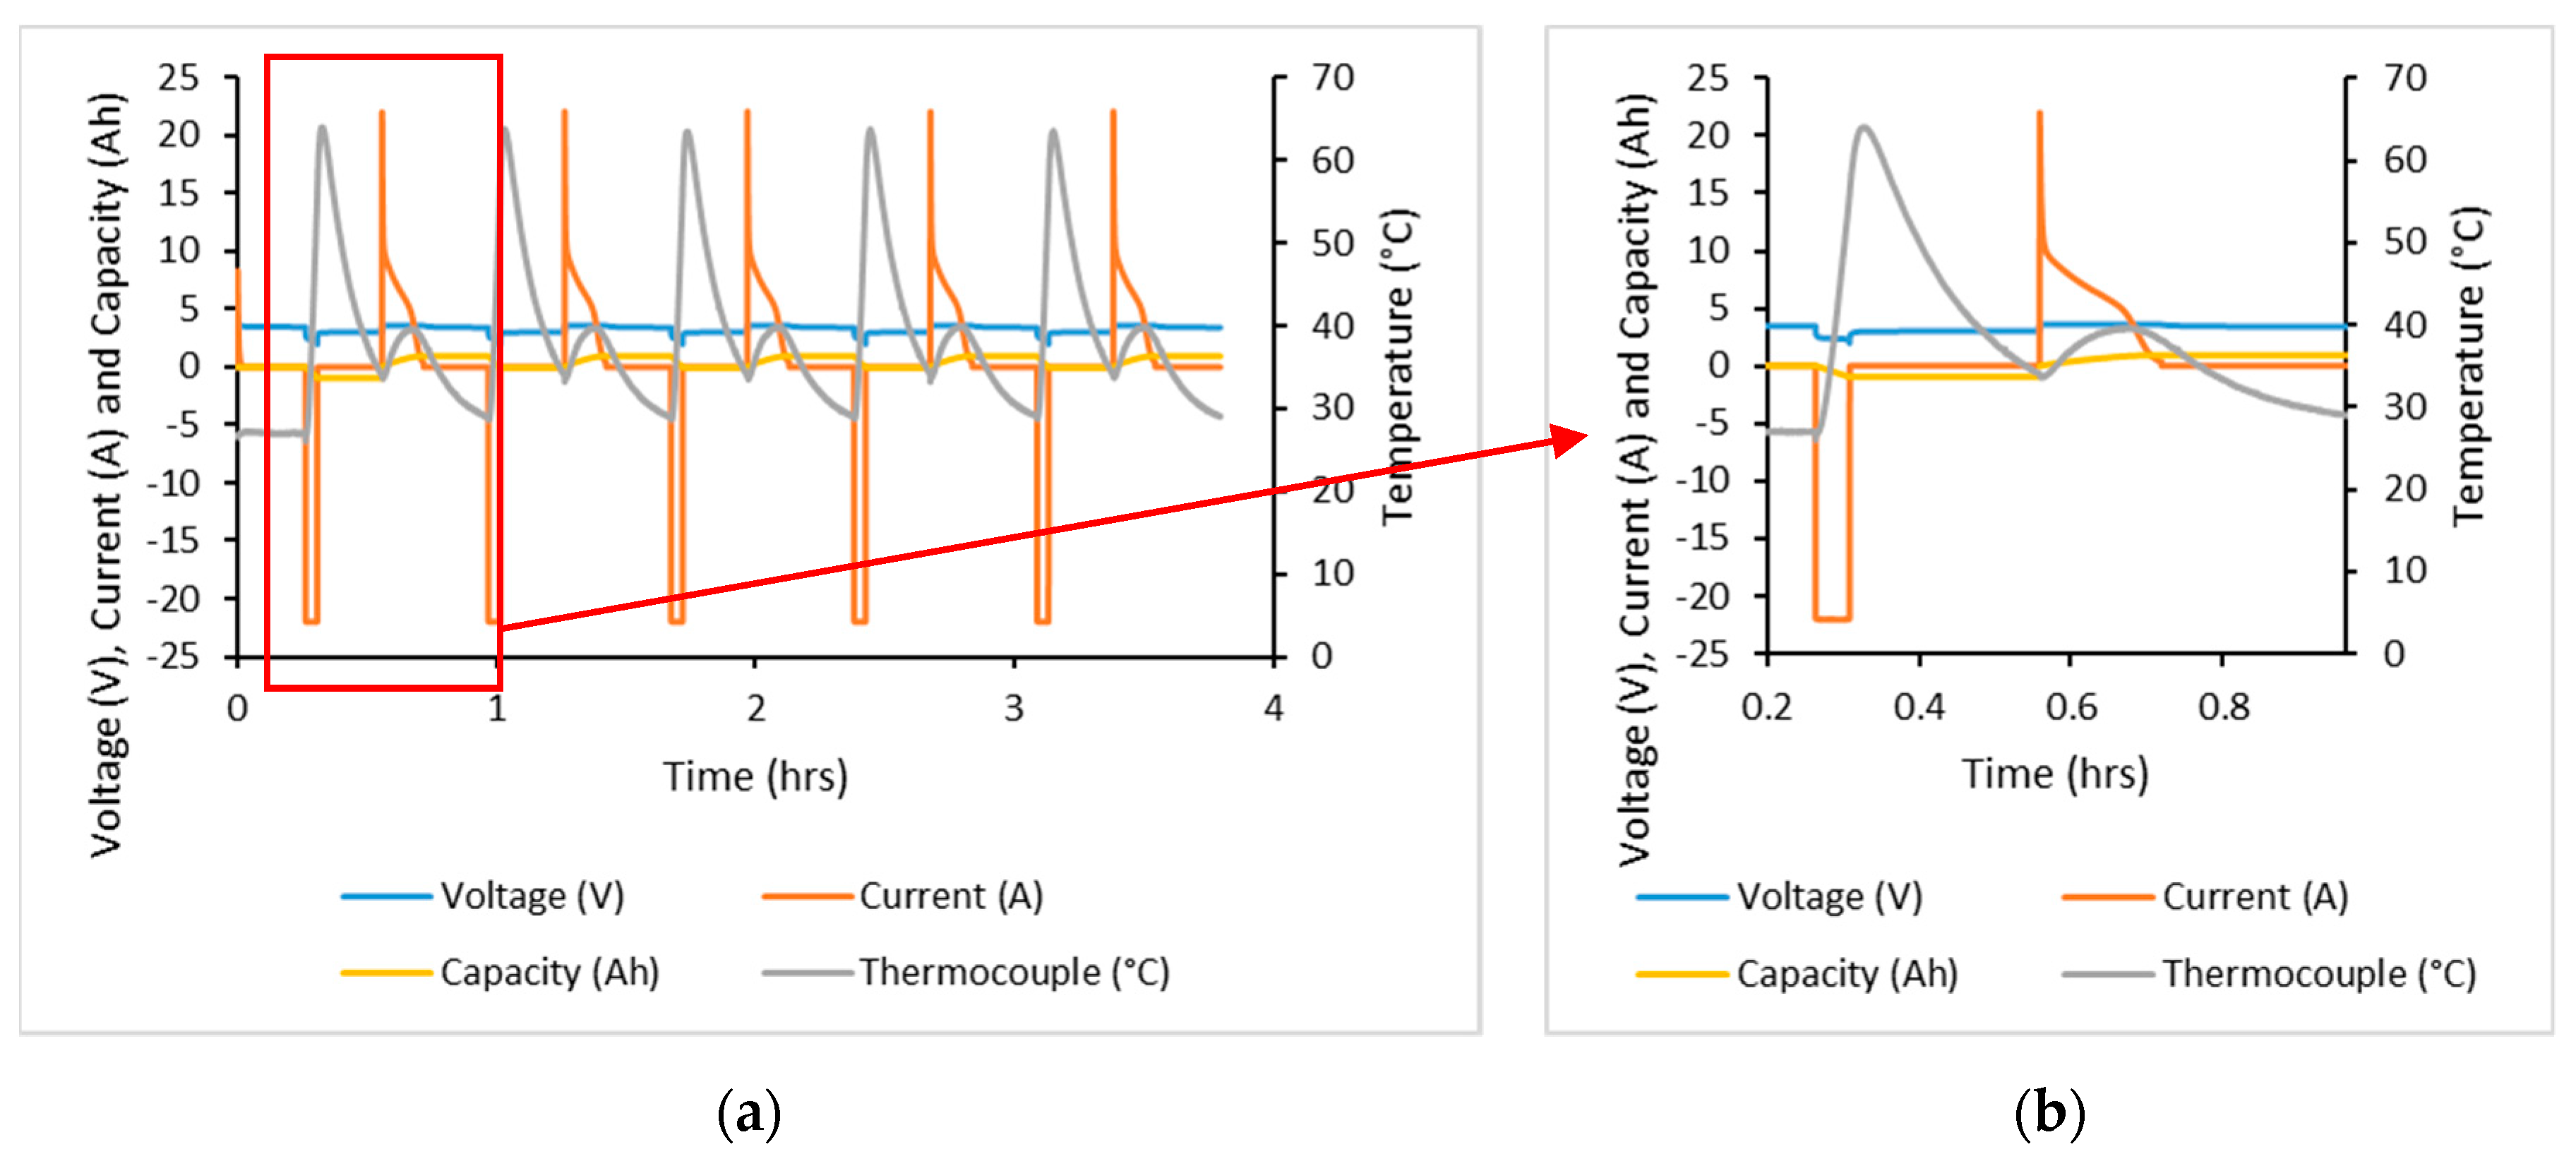
A thermocouple was attached to the cell surface at the middle of the cell, giving temperature profiles as shown by
Figure 3. With a 15 min pause after both charging and discharging in this test, the temperature profile of these two events could be viewed separately. Discharging resulted in the largest increase in temperature with a change in temperature of 34.7 °C. Charging resulted in a change in temperature of 5.6 °C, though temperatures were consistent throughout cycling. Furthermore, the manufacturer’s datasheet specified that the maximum cell temperature was 85 °C at the cell surface; testing did not achieve this temperature.
Other studies have shown less temperature difference between charge and discharge [
11]. At 5 C the outside cell temperatures from charge and discharge events have been shown to be 25.2 °C and 25.1 °C, respectively. For high rates, such as 20 C, it is believed there is a reconfiguration of the components (such as the heat generated) of total heat produced leading to a larger gap between the charge and discharge temperatures. In order to practically use currents at a rate of 20 C the discharge event would require more cooling than the charge event.
Additionally, internal temperatures of a 18,650 cell have been determined in other studies. A 16 C discharge resulted in the centre of the jelly roll to increase the temperature to 32 °C above the cell surface temperature [
12]. Given these values, as well as those determined here, it is expected that the centre of the jelly roll in these samples will be greater than 95.4 °C due to the addition of the cell internal temperature increase and surface temperature increase. It would likely be greater than this since the currents applied here were higher which would have further increased the internal temperatures. This temperature is known to be above the electrolyte flash point as well as being sufficient to initiate solid electrolyte interphase (SEI) decomposition [
13].
Temperature increases from cycling resulted in a linear increase in the external cell temperature; this was the case for both tests undertaken here. Other studies have shown that the heat generation for discharge is linear for similar high C rates [
11]. Additionally, the heat generation is mostly stored within the cell [
14]. This is the case because the cell does not have time to dissipate the heat generated to the outside surroundings, and so to operate cells under these conditions would require forced convection cooling.
On the other hand, a 15 min pause after charge and discharge using 20 C currents allowed the cell to cool to 6.8 °C and 1.9 °C above ambient levels for discharge and charge, respectively. Natural convection cooling requires longer than 15 min to achieve cooling of the cell to ambient temperature.
The currents applied in the high rate cycling test was above the manufacturers specification by a factor of 1.38 times in discharge and 4.4 times in charge. The temperature at the cell surfaces were, however, below specification by 23.5 °C.
2.2. Computed Tomography (CT) Scans
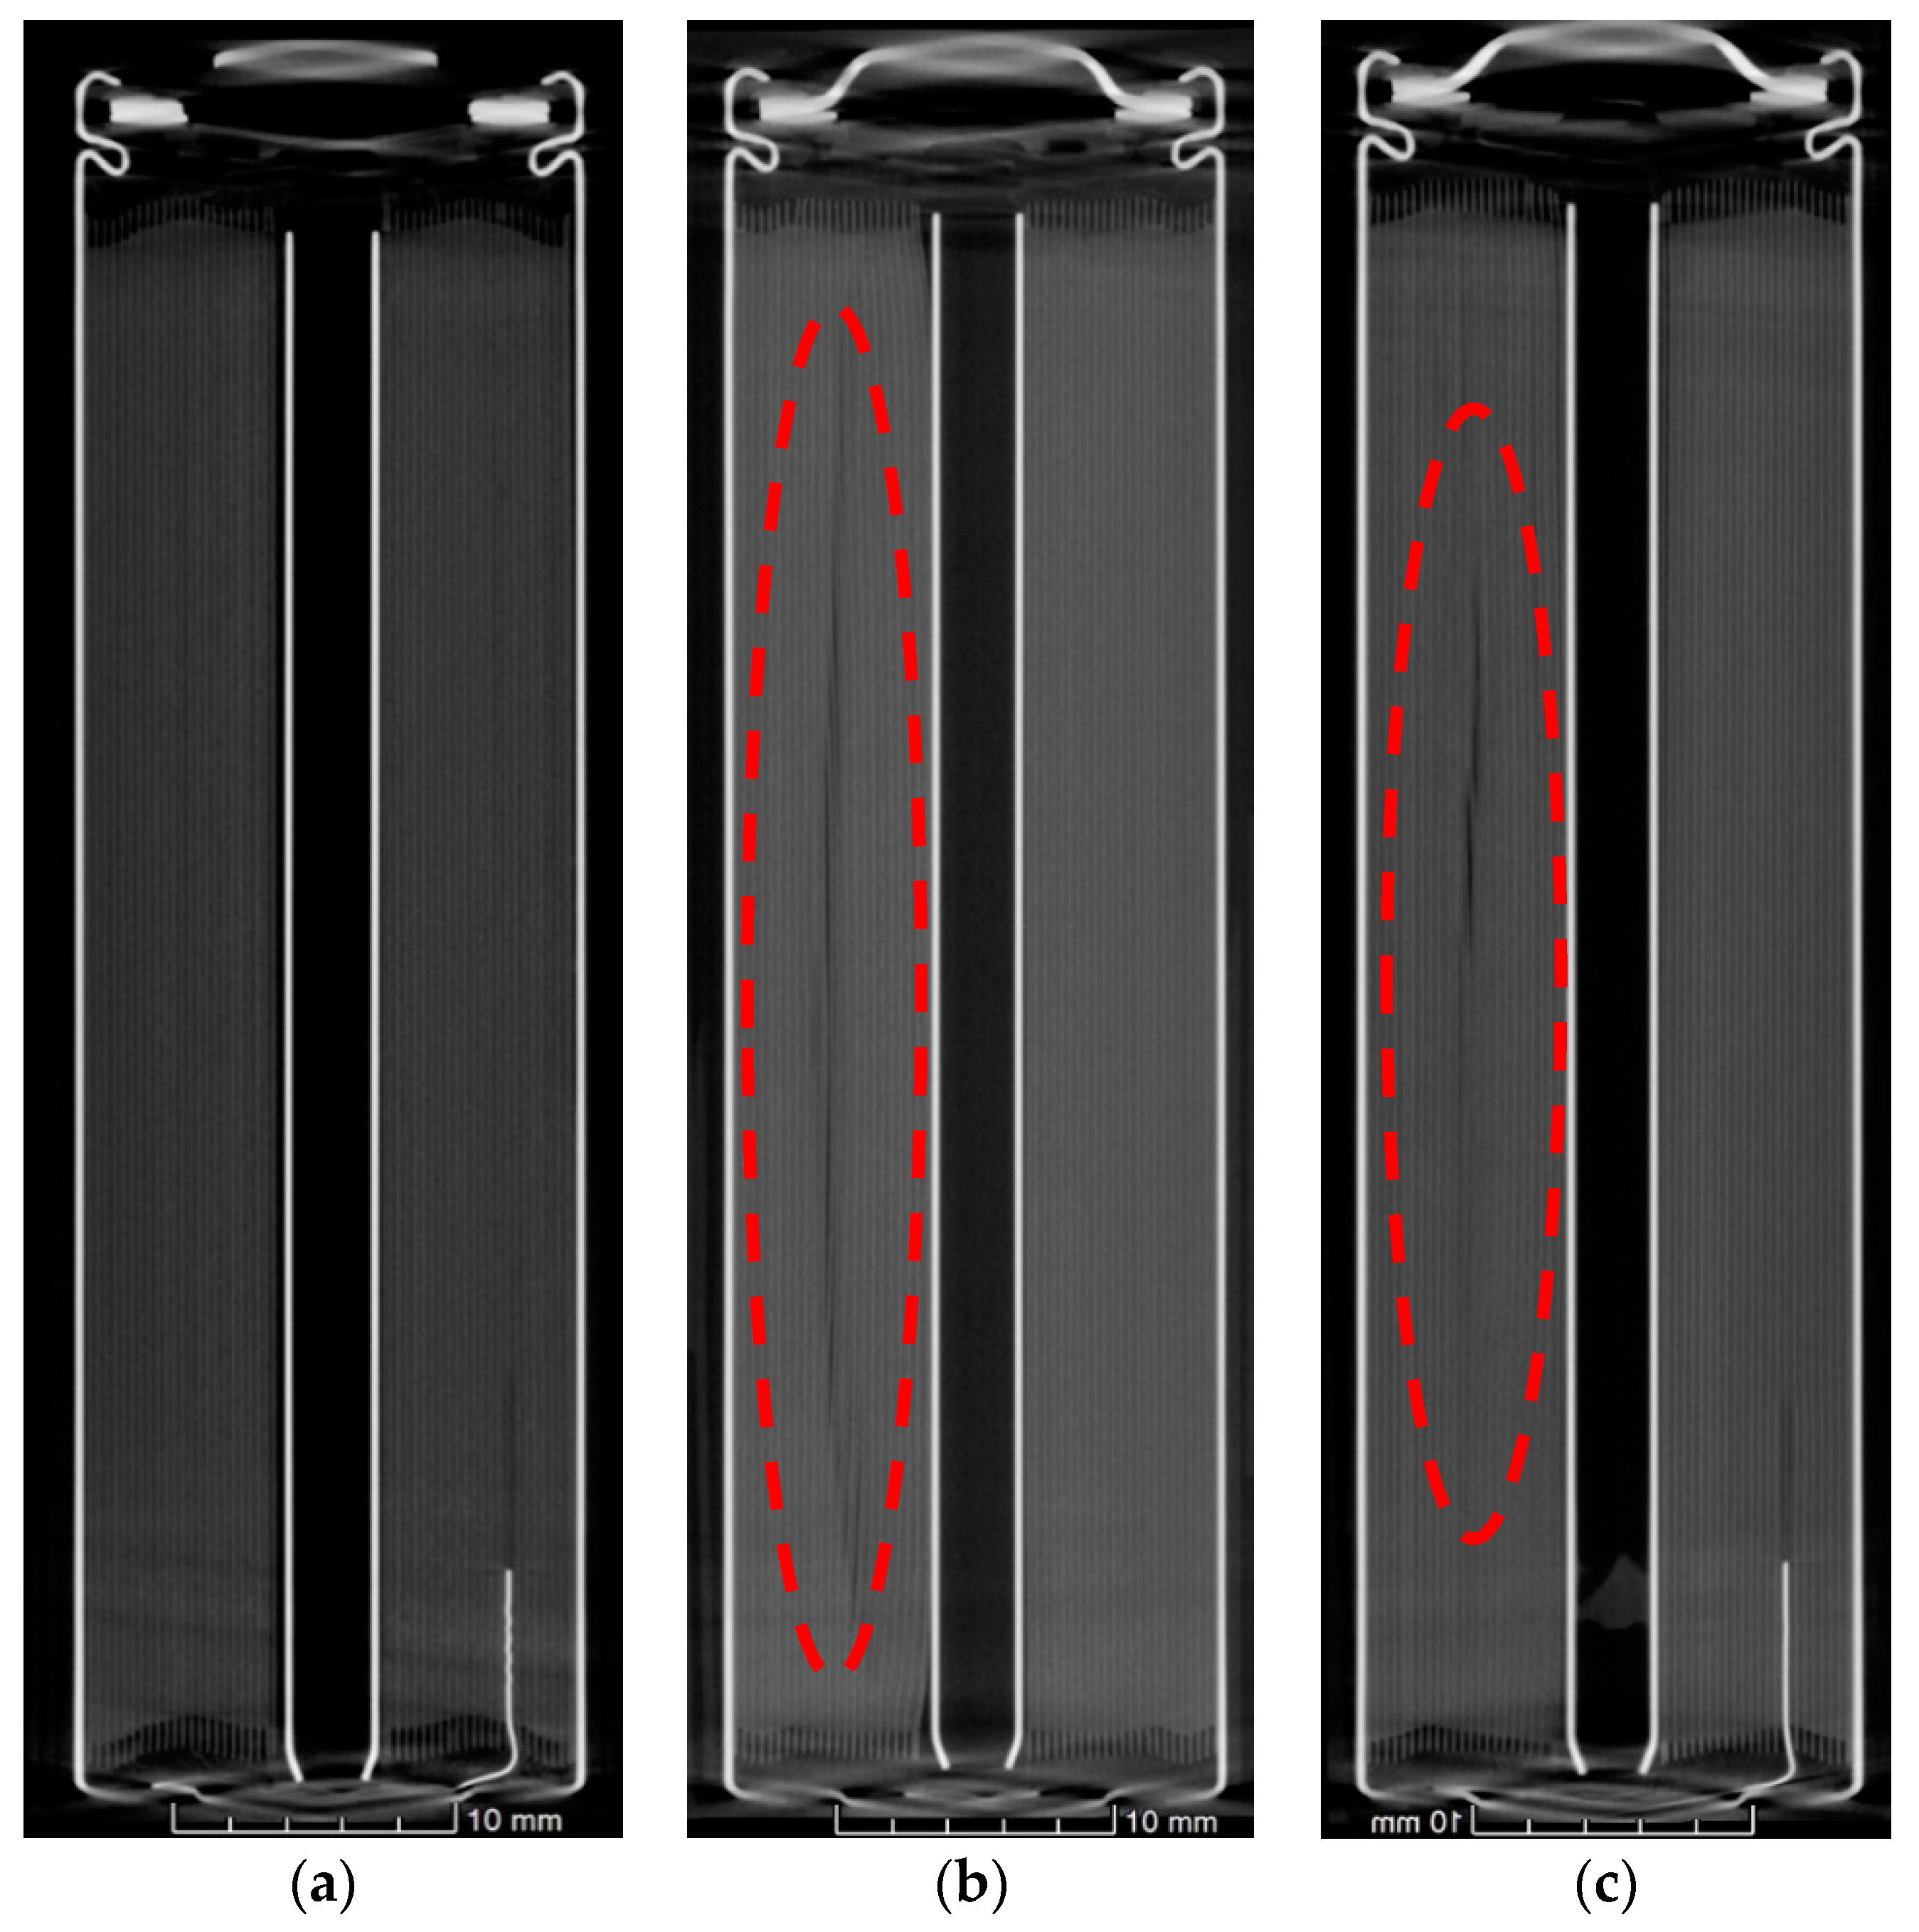
As received, cell failure test and high rate cycled cells were analysed using X-ray computed tomography in a frontal and axial planes. In CT scanning, materials with higher atomic number appear brighter, and therefore the anode (copper) substrate is clearly identified. Moreover, areas of space (voids) appear dark within the battery.
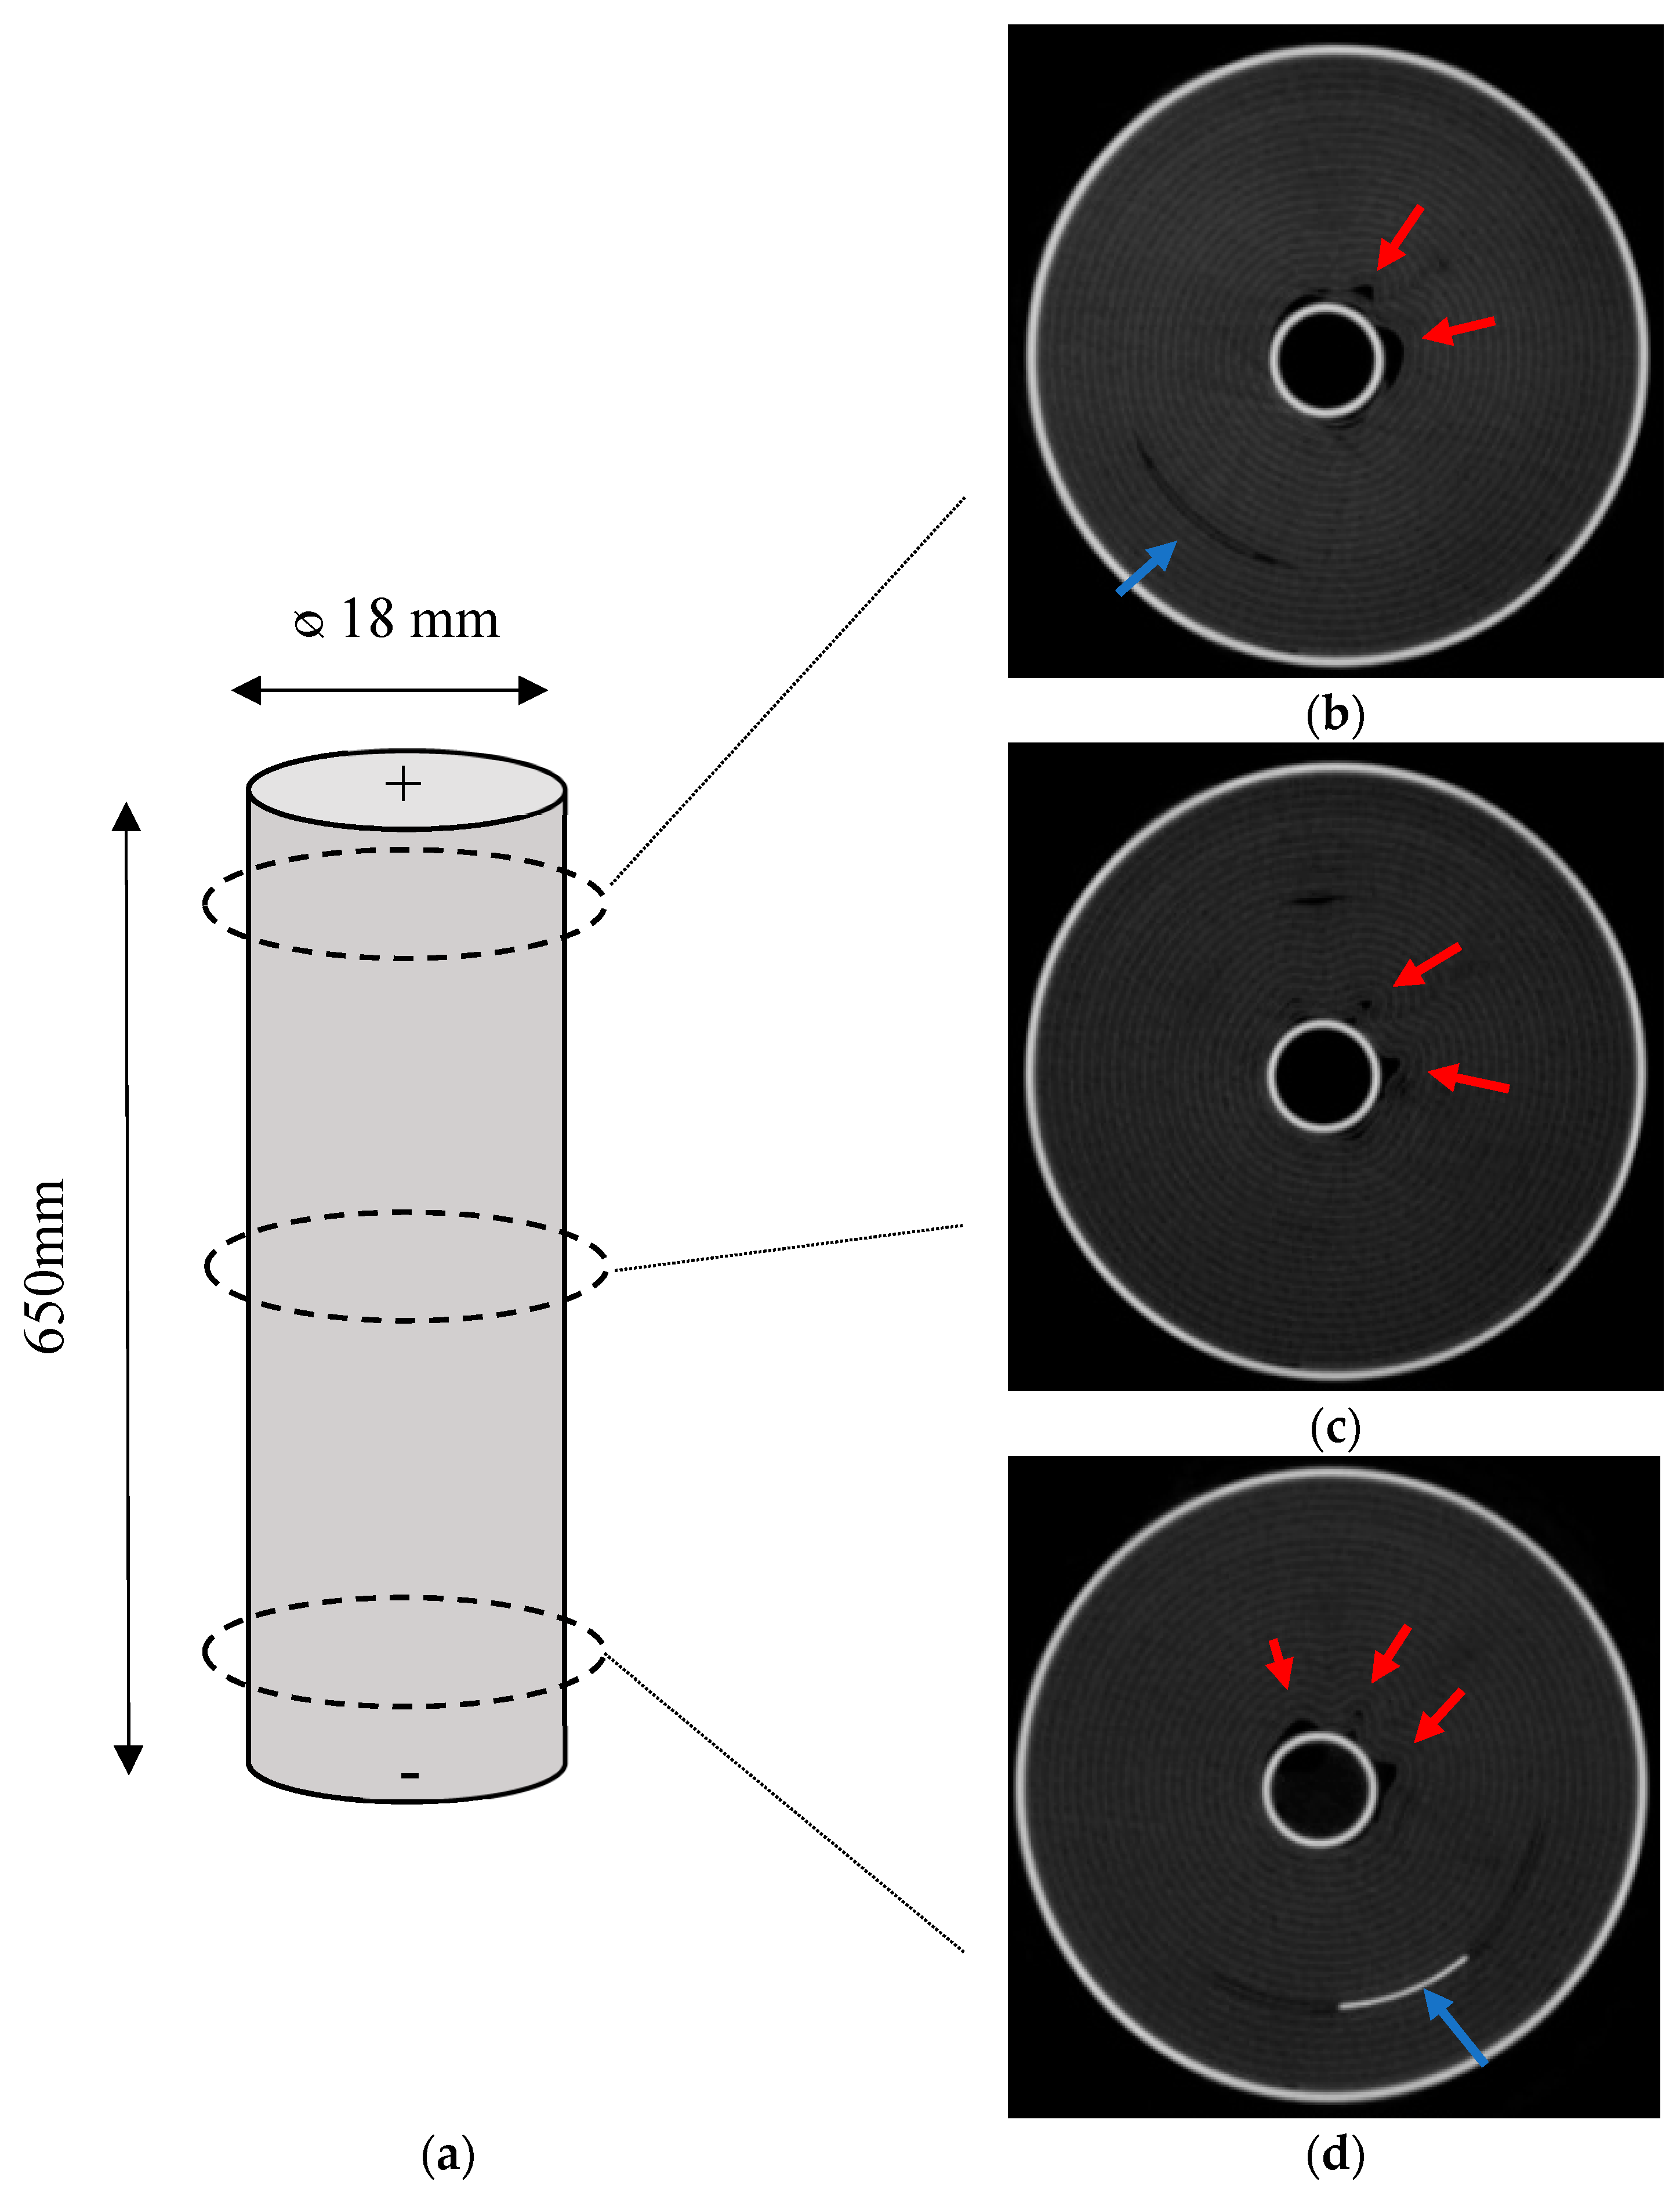
Figure 4 shows the axial X-ray computed tomography scans of the cells. In the as-received cell, it was shown that the jelly roll was wound around a centre pin or mandrel in a uniform manner. Deformation was observed in some of the layers of the jelly roll of the aged samples. This was most pronounced with acute kinks at the centre of the jelly roll near the centre pin, where the bend radius is at its most pronounced. These deformations gradually petered out and became more contoured towards the outside of the cell. By the midpoint of the jelly roll the deformation had subsided. In addition, deformation was noted on the opposite side of the cell to the negative tab, an indication that this area has a different stress state to the area adjacent to the tab.
Furthermore, deformation was observed in the frontal scans of the aged samples, which can be seen in
Figure 5. This was noted at the halfway point of the cell–causing a void as a result of some form of applied stress. In contrast to the axial scans, where stresses were experienced emanating from the centre of the cell, these voids appeared at the midpoint of the cell and opposite the negative tab. These appeared step wise between the layers indicating a stress transfer between layers. In this study, the thermocouples showed that the temperatures were greatest at this location on the outside of the cell (refer
Figure 2).
The axial deformation at the top, middle and bottom of the cell is shown by
Figure 6. Deformation around the centre of the cell is noted on all samples. In the case of the top and bottom, deformation is noted as distal to the positive and negative tab.
Permanent deformation is an indication that the tensile strength of the material has been exceeded; since both the anode and cathode are deformed, the stresses applied are greater than the tensile strength of these joints. The joints termed here are (refer
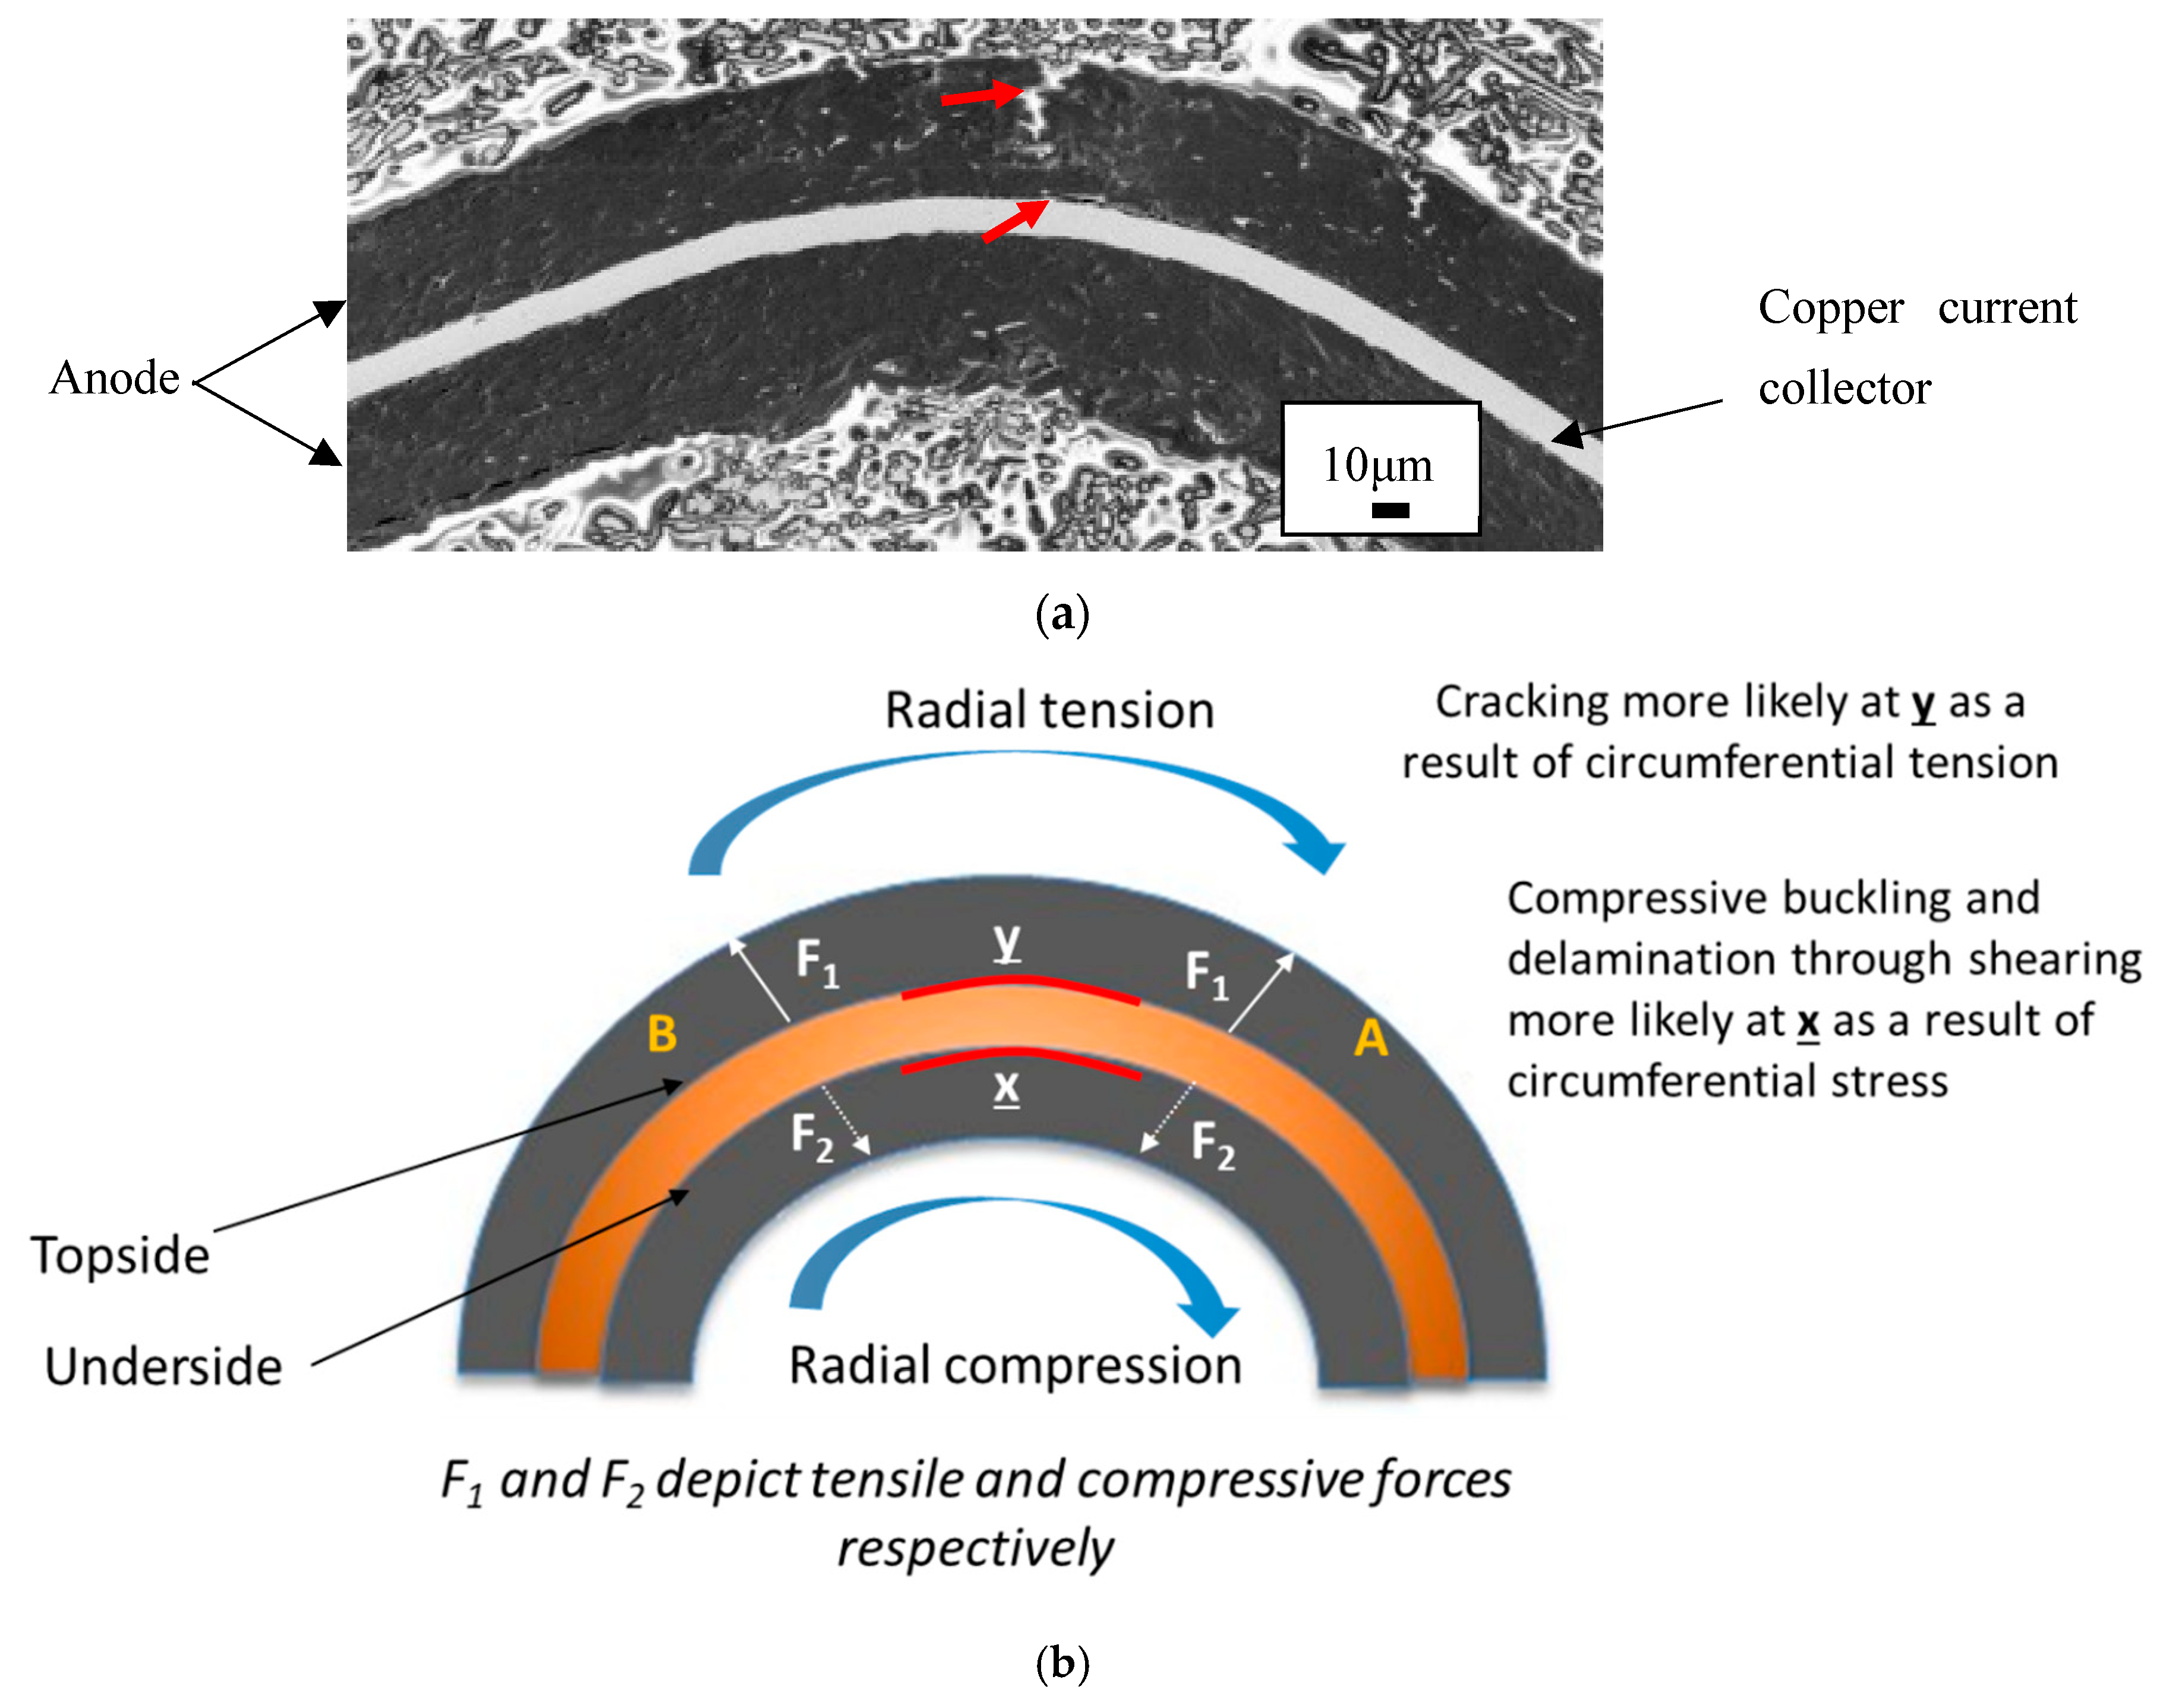
Figure 7a showing cross sectional view):
In parallel, volume changes within electrodes during charging and discharging can drive contact losses in active materials by way of mechanical or electrical disconnection effects. It follows that any loss of such access to the active particles will result in lower potentials upon charging–equating to loss of Li. This will start generating imbalances between the anode and cathode, which can cause the negative electrode to experience increasingly negative potentials. Detrimental behaviour can then follow as the remaining active material will need to accommodate more lithium, but also be exposed to higher current densities–this is a perfect condition for plating to occur.
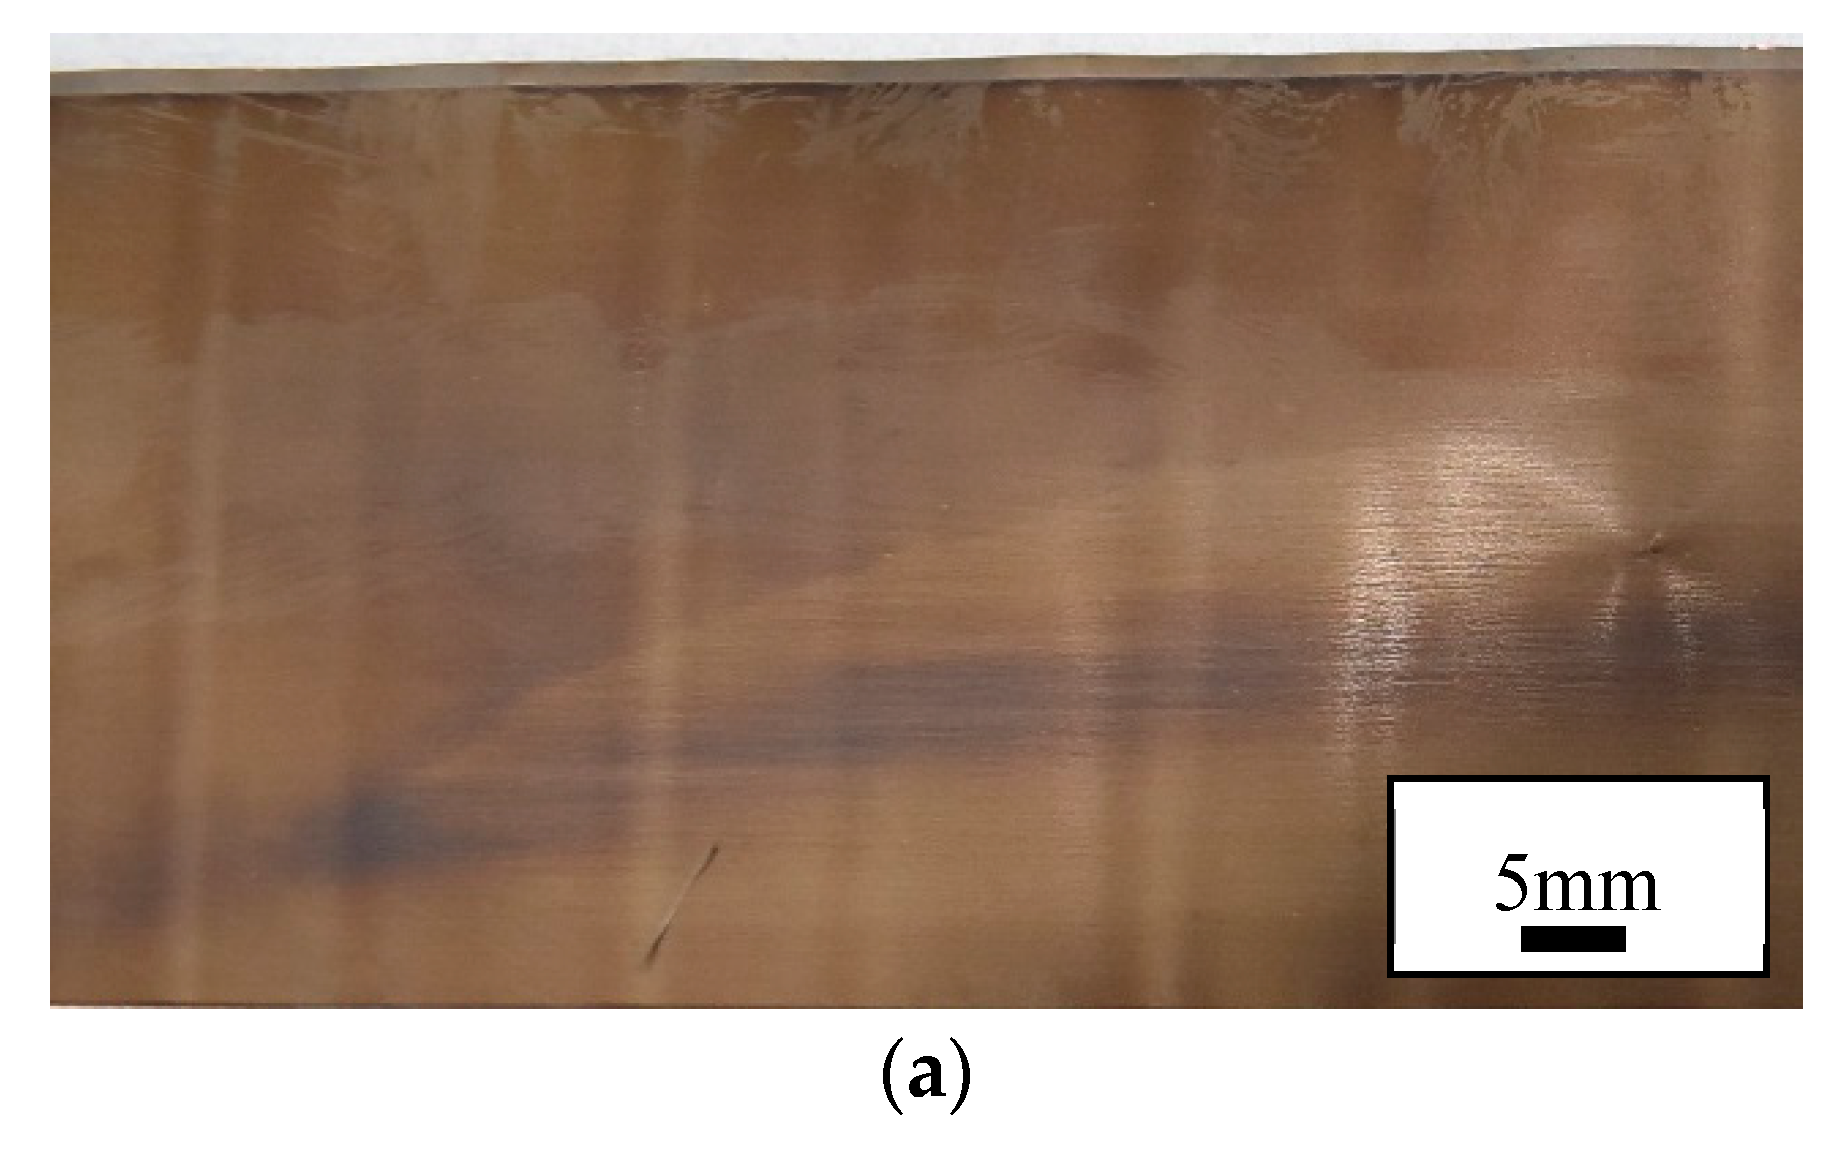
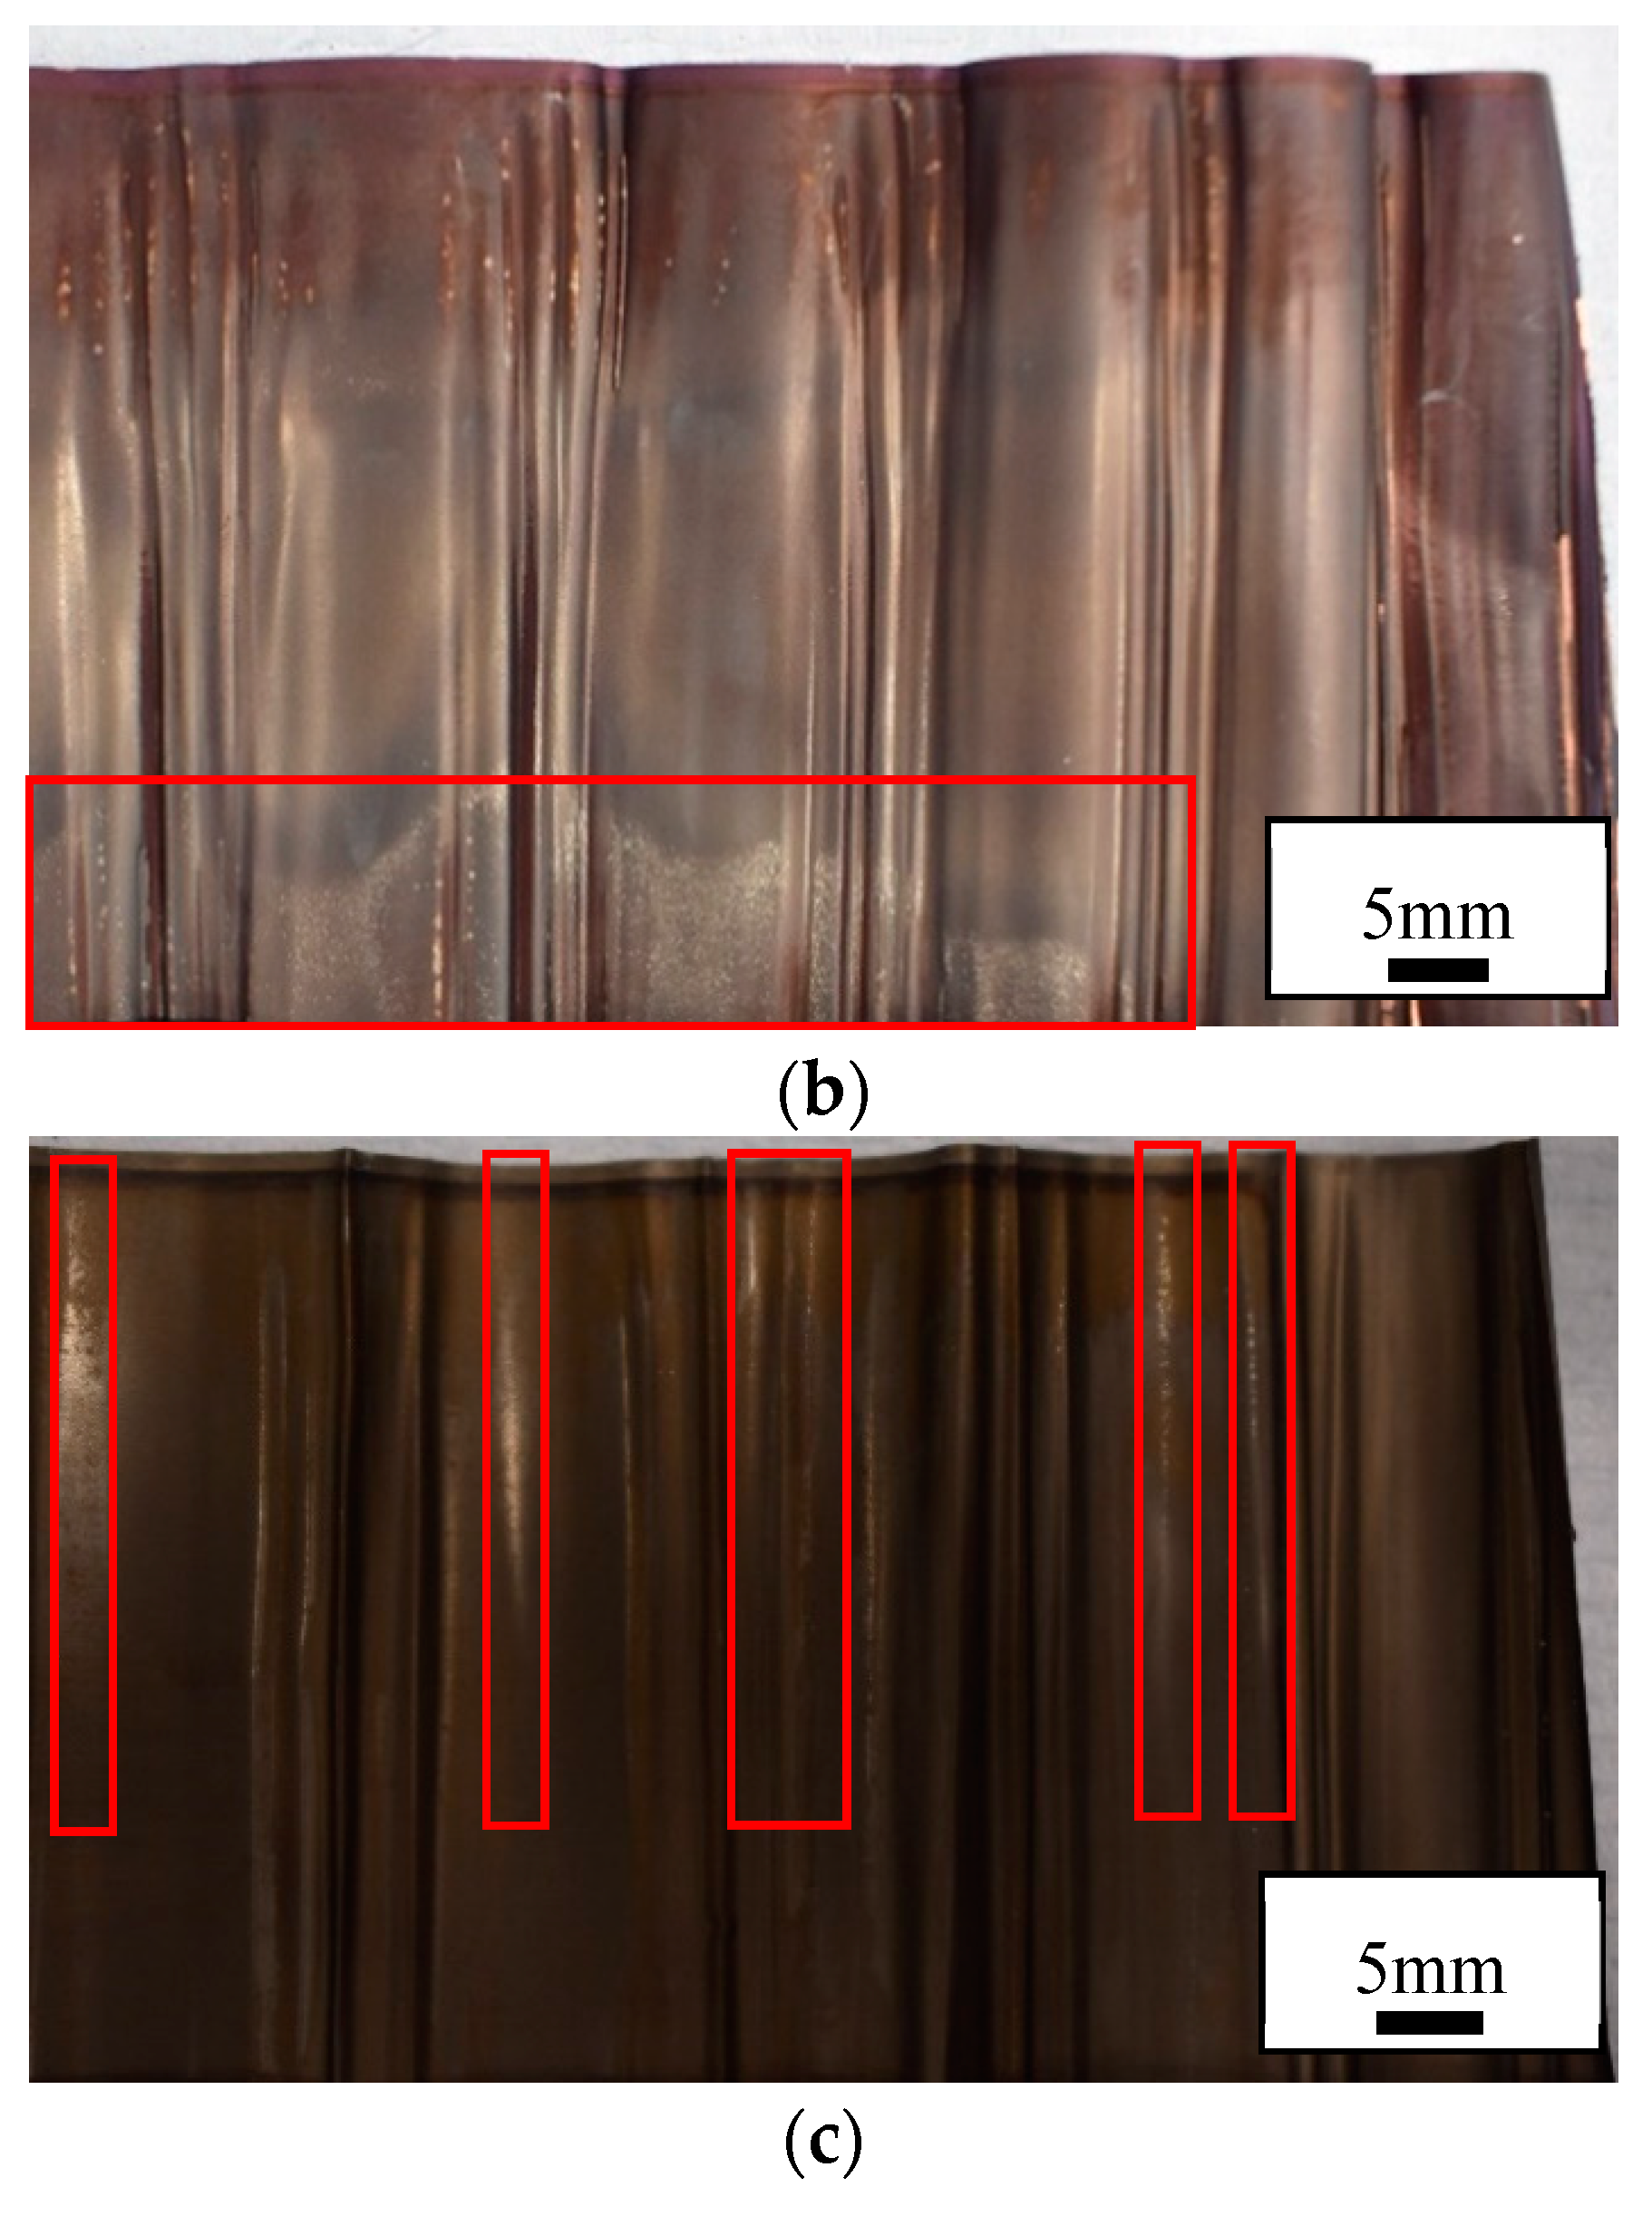
Figure 8 indicates the presence of Li plating in the high rate cycled and failed cells, illustrated by white traces of oxidised lithium. Denser white deposits are observed in the failed cell, corresponding to higher amount of plated lithium. Areas of electrodes that have been subjected to any mechanical damage or contain structural imperfections are prime areas where plating of Li can initiate. Such areas contribute to heterogeneous ageing, a collective of non-uniform degradation events [
15].
When we consider the morphology and format of cylindrical cells, there are compression gradients or variations in stresses from the outer layers of the jelly roll to the inner regions, dictated by the bending radii becoming more pronounced closest to the mandrel. Indeed, it can be observed in
Figure 4, that the greatest deformation is at the centre. With operation time (and resultant temperatures) these residual stresses, which are more pronounced near the centre mandrel become more likely to relieve themselves. This occurs by deforming in localised regions (i.e., the kinks) of the jelly roll around the mandrel. Additionally, the tabs are shown to cause subtle deformation in the electrode and separator layers immediately surrounding them. This creates pockets of spatial variation, which contributes to more macro-heterogeneity within the structure. As the battery ages, the cathode potentials increase due to Li loss. Deeper discharge then also results in Li loss. Capacity balancing of the two electrodes becomes gradually altered until the negative electrode becomes capacity limiting. Given that the graphite potential during operation becomes close to that of Li’s redox potential, plating can easily occur where there exist imbalances.
At the so-called rollover point, where degradation is accelerated more rapidly and it is this heterogeneous ageing that is the key driving force, essentially dominated by:
Loss of localised areas of accessible anode through mechanical or electrical isolation
Li plating in non-uniform and compressed areas.
Propagation of Li-plating, representing a rapid consumption of Li, resulting in more rapid capacity drop.
Self-perpetuating cause-effect chains generated that link plating to compression differences or gradients in microstructures
Homogeneous pressure distribution is challenging to establish in cylindrical cell configurations, which have a gradient of winding pressure. In this respect, circumnavigating non-linear degradation in ageing cells remains a design challenge, especially for applications requiring both extended lifespan and power.
Non-uniform or heterogeneous pressure has been shown to directly affect Li diffusion through the separator and can influence changes in porosity and tortuosity [
15].
The areas described as voids appear to have been formed due to a response of the battery componentry to stress. Material is deformed and displaced in one area to another resulting in voids or gaps due to stresses caused by thermal gradients in testing.
With increased high rate cycling the cell was more deformed as shown both axially and in the frontal scans. This is an indication that more stresses have been experienced in the increasing high rate cycling cell. The source of this stress is believed to be thermal mismatch (expansion and contraction) between the inside and the outside of the cell. Temperatures inside the cell are higher than the surface in both charge [
16] and discharge [
12]. However, given that discharging has shown to heat the cell more than charge, it is thought that this would produce a greater amount of stress and subsequent deformation.
An analogy for this situation has been given towards a hot cylinder cooled rapidly whereby the outside is cooled and inside remains hot such that the outside is in tension and the inside is in compression [
12]. These stresses relieved themselves by causing deformation to the componentry. It is therefore a function of heat dissipation within the cell. This is a holistic view of the component as a (single) solid component; in fact the cell is made up of many layers that are wound together but held between the inner coil and tube. As seen, the layers act separately, however there is some relationship and transfer, such that patterns are transferred between the layers within the jelly roll.
Thermal fatigue is well known to occur in metallic components due to the combination of mechanical constraint and temperature gradients [
17]. These temperature gradients cause thermal expansion or contraction which result in thermal stresses as the component is mechanically constrained. In this situation, the jelly roll is mechanically constrained on the outside (by the can) and the inside (the centre pin).
Similar effects have been seen in another 18,650 cylindrical cells that were exposed to a range of charge and discharge C-rates (up to 16.6 C) which resulted in similar axial deformation patterns [
12]. However, it was shown that with a centre pin, deformation was not observed. These were however lower C-rates than what was undertaken in this study. The presence of a centre pin appears to increase the resistance of the cell to jelly roll deformation.
Modelling [
14] has shown the temperature distribution in the axial direction to be uniform. The deformation however has been shown to be located away from the tabs. Furthermore, modelling has shown the hottest locations of the cell to be the top and bottom of the cell can – no observations towards any effects towards these were seen an indication that these areas are designed sufficiently to withstand temperatures.
2.3. Post Mortem of Jelly Rolls
Complementary to the CT scans, post mortem characterisation was undertaken on the cells whereby the jelly roll was unwound and cross sections were prepared.
Examination of the cathode and anode confirmed that they had both been permanently deformed by testing given that the deformations remained after carefully opening the cell. These effects appeared as kinks in the cathode and anode with peaks and troughs in the joint as shown by
Figure 8. The deformation was consistently observed extending from the top to the bottom of the cell at approximately right angles to the jelly roll. This suggests that similar stresses were experienced along the height of the cell such that the cathode and anode was similarly deformed for the entire length of the cell. In other words, stress is transferred from the centre of the cell to the outside for the entire length of cell.
Deformation was observed with an increasing distance from the centre of the jelly roll; since with every rotation away from the centre, the roll becomes slightly longer, as mentioned elsewhere [
11]. This further validates stress transfer between neighbouring layers whereby the contours of the kinks are transferred to the following layers which, upon opening the jelly roll, are observed at increasing distance from the centre pin.
Reports have shown similar deformations on the same side as the tab [
12,
18]. One has suggested this to be due to geometrical homogeneities in the jelly roll caused by the tab [
18]. Here the deformations were observed on the opposite side of the cell to the tab.
Another report showed that the yield strength of the material in this location had been exceeded [
12]. In this study it was shown that similarly the yield strengths of the joints have been exceeded (more on the stresses on the individual joints is discussed later).
Similar effects have also been observed in pouch cells away from the edges (i.e., where the cell is mechanically confined [
12]). Furthermore, external mechanical loading has shown to cause these deformations from the outside of the cell. This is not similar to the effect shown here, no deformation is visible on the outside of the cell.
Stresses in the joint are described by a beam in pure plastic bending [
19]. The upper surface of the joint is being stretched or in tension whilst the lower surface experiences compression due to load applied to the joint. Furthermore, the strain experienced by the joint (and the componentry) transitions from tension to compression from upper to lower surface. This is illustrated by a cross-section schematic in
Figure 7.
The deformation of the jellyroll is clearly more pronounced for cells continuously cycled with higher current densities. A buckling of the layers can be observed whereby very evident kinks are caused in anode, cathode and separator. The compressive stresses induce the central buckling of layers, and this would be even more pronounced were it not for the presence of the mandrel pin minimising further deformation.
Stress evolution in cylindrical cells is due to expansion and contraction of the electrodes during lithiation/delithiation. With this, temperature gradients evolve during cycling emanating for heat generated from ohmic, active polarisation and exothermic reaction sources. The radial symmetry distribution with higher temperatures in the centre exaggerates the radial and tangential compressive stresses in the core and tangential tensile stresses near the outer layers (which constrains the thermal expansion of the core region).
The stresses experienced on either side of the electrode coating are asymmetrical and will have respective gradients from the outer to the inner layers. This is due to gradual increases in the bending radii of the layers. The jelly roll format could be mathematically represented as an Archimedian spiral [
20] with a general equation shown by Equation (1).
where
r is the distance from the origin,
a and
b are constants and
θ the angle between the line from the centre to the tangent to the spiral.
Microscopy was carried out on samples from post mortem examination.
Figure 7a shows a cross sectional SEM image of a kink in the anode from
Figure 8c. A crack is observed as well as delamination of the coating in two locations, all shown by arrows.
The cracking emanates from the upper surface and has travelled toward (but has not reached) the interface between the anode and copper current collector. This is a result of the tensile forces stretching this surface. The anode coating has delaminated from the copper current collector at the upper surface again from tensile forces at this location.
Delamination of the coatings has been observed in other studies using currents up to 16.6 C [
12]. These currents have been shown to increase temperatures of the cell significantly, such that thermal stresses (and fatigue) are applied to the joints within the cell. This infers that these stresses are above the adhesive strength of the joint such that the coating becomes disbonded from the substrate. The cracking in the anode surface is also evidence that the tensile stresses have been sufficiently high for the coating to fail (or break) cohesively. This cracking can influence charge transfer resistance by permitting greater electrolyte permeation. Cracking in the bulk electroactive material has been observed previously [
12], which has been associated with binder breakdown [
21,
22]. In the samples examined, there were very few cohesive failures in the electrode active material suggesting that the coating effects are a result of the reaction of the joint to stress rather than binder breakdown.
2.4. EIS Electrochemical Impedance Spectroscopy (EIS)
Impedance measurements were performed on three cells during high rate cycle testing. This was carried out at three different states of charge (SOC), and at three stages during the cycle testing; initially and after 250 and 500 cycles. Some illustrative results are shown in
Figure 9, for the spectra recorded at 10% SOC. The data was fitted to the equivalent circuit, also shown in
Figure 9. The curves shown in the figure were calculated using the fitting parameters.
The resistance values calculated during the fitting process are collected in
Table 1. Data to be recorded at 50% SOC and 250 cycles, and resistances could not be obtained. The series resistance R
s increased with cycle number, but the electrochemical resistance R
1 decreased between zero and 250 cycles. Both resistances were relatively insensitive to the state of charge.
The electrochemical resistance R
1, taken at medium and lower frequencies, is likely to be a combination of three or four resistances; charge transfer resistances at the anode and cathode, a film or SEI resistance at the anode, and possibly a film resistance at the cathode [
23]. It can be difficult to resolve the two charge transfer resistances, if they have similar time constants. The film resistance on the anode is often small compared to the charge transfer resistance, particularly at the start of cycling. The cell contains an LFP cathode, and has a relatively complex reaction mechanism. The active particles can convert between LiFePO
4 and FePO
4 sequentially or concurrently [
24]. This depends on the test conditions, and the previous cycling history of the electrode [
25,
26]. If more particles are active during the impedance measurement, then the charge transfer resistance will be reduced. Examination of the anodes after cycling revealed the onset of lithium plating. Lithium metal is likely to have a different charge transfer resistance from graphite, given the completely different reaction mechanism. For lithium, the charge transfer resistance is unlikely to vary with the state of charge of the cell, unlike graphite anodes, where the exchange current density does vary with state of charge.
The post mortem examinations also showed microscopic changes within the electrode structures. Mechanical deformations led to delamination of the coatings, and cracking of particles. The former will increase the series resistance. The latter will increase the surface area available for electron transfer reactions, and hence reduce the charge transfer resistance.
The low frequency tail was fitted using a constant phase element, rather than a Warburg component with a fixed gradient of 45°. This gives two parameters, Z
CPE = 1/(iω)
n P, where n is a power term, and P is a mathematical term which varies according to n. These are collected in
Table 2. If the process is true infinite diffusion, then n = 0.5. However, the values of n were in the range 0.62 to 0.68. The low frequency response of the full cell is a combination of the low frequency response of the two electrodes. This is likely to be solid state diffusion for the graphitic part of the anode. The limiting mechanism for LFP cathodes is usually phase conversion, rather than diffusion [
27]. Lithium ion cells rarely match the idealised Warburg model for infinite diffusion, and typically n > 0.5. There are various possible explanations for this, including non-cylindrical pore geometry [
28] and anomalous diffusion [
29].
