Article

Thermal Mapping of a Lithium Polymer Batteries Pack with FBGs Network

Department of Physics and I3N, University of Aveiro, Campus de Santiago, 3810-193 Aveiro, Portugal
*
Author to whom correspondence should be addressed.
Batteries 2018, 4(4), 67; https://doi.org/10.3390/batteries4040067
Submission received: 17 October 2018 / Revised: 13 November 2018 / Accepted: 21 November 2018 / Published: 7 December 2018
(This article belongs to the Special Issue Thermal and Safety Properties of Materials, Cells and Batteries)

Abstract

:
In this paper, a network of 37 fiber Bragg grating (FBG) sensors is proposed for real-time, in situ, and operando multipoint monitoring of the surface temperature distribution on a pack of three prismatic lithium polymer batteries (LiPBs). Using the network, a spatial and temporal thermal mapping of all pack interfaces was performed. In each interface, nine strategic locations were monitored by considering a three-by-three matrix, corresponding to the LiPBs top, middle and bottom zones. The batteries were subjected to charge and discharge cycles, where the charge was carried out at 1.0 C, whereas the discharge rates were 0.7 C and 1.4 C. The results show that in general, a thermal gradient is recognized from the top to the bottom, but is less prominent in the end-of-charge steps. The results also indicate the presence of hot spots between two of the three batteries, which were located near the positive tab collector. This occurs due to the higher current density of the lithium ions in this area. The presented FBG sensing network can be used to improve the thermal management of batteries by performing a spatiotemporal thermal mapping, as well as by identifying the zones which are more conducive to the possibility of the existence of hot spots, thereby preventing severe consequences such as thermal runaway and promoting their safety. To our knowledge, this is the first time that a spatial and temporal thermal mapping is reported for this specific application using a network of FBG sensors.

1. Introduction

Lithium polymer batteries (LiPBs) are extensively used as rechargeable energy storage systems for a wide range of electronic devices such as smartphones and laptops due to their high specific energy, power densities, nominal voltage, and low self-discharge rates [1,2,3].
Exceeding the limits of current, voltage, or power may result in internal battery damage. Possible thermal runaway, characterized by the faster temperature increase, can also occur if proper precautions are not taken. This is an essential issue, which impacts highly on the global LiPB behavior. Moreover, LiPBs must be prudently electrically and thermally monitored and managed in order to avoid safety and performance issues [4,5,6,7,8]. The internal structure of an LiPB is made up of multiple layers forming a “jelly roll” structure, where each layer consists of the anode, cathode, electrolyte, and polymer film separators. Recent studies have been published using new composite polymer electrolytes for solid-state lithium batteries, not only to improve their thermal stability, but also to allow a wide electrochemical stability window and compatibility with the electrodes. These are the fundamental requirements for the next generation of reliable large-scale energy storage systems and to develop more completely solid devices [9,10,11,12]. Under abnormal conditions, such as temperature exceeding the separators melting point or breakdown of the layered materials, an internal short circuit can occur. The possible hot spots generated by an internal short circuit can ignite thermal runaways leading to a fire or explosion of the batteries [8,13,14]. However, some of these problems would be solved if these technologies were subject to better understanding of the spatiotemporal thermal mapping of the batteries under different and real-time operating conditions, improving the thermal management of all battery systems.
Temperature can affect both the LiPBs lifetime and energy, and therefore, it should be within an optimum range of temperature to ensure better performance and long life, both for use and storage [15,16]. The ability to quantify and evaluate the mechanism of thermal runaway generated during the electrochemical processes that can occur, will create beneficial information regarding their behavior as well as an active tool to promote their safety. The thermal sensing of LiPBs is typically performed using different types of thermocouples in strategic locations [3,14,15,16,17,18,19,20,21,22,23,24], micro-electro-mechanical systems [25], mathematical models [26,27], and resistance temperature sensors [28,29]. Generally, for commercialized battery packs, most of the existing methods use single-point temperature monitoring on the cell surface to represent the overall state of the cell [19].
Recent works showed that fiber Bragg gratings (FBG) are an operative method to realize temperature measurements in lithium batteries. Some of the advantages of using such sensors, when compared to electronic ones, are the ease in multiplexing, fast response, immunity to electromagnetic interference, lower invasiveness, and their small size [30,31,32,33,34,35]. The research and development of a sensor network based on FBGs has attracted significant interest because, by inscribing several FBGs with different grating periods in the same optical fiber, a broad selection of sensors can be manufactured. This allows the user to monitor different positions in the structure with only a single fiber. Only one light source is required and the same interrogation system is employed for different FBGs, effectively decreasing the system cost. Multiple FBG sensors can be readily accommodated and the location of each sensor can be precisely controlled, which is essential to quantitatively distinguishing the temperature of different spots [30,36]. These works reveal that FBGs can be an optimal, low cost, and non-active tool to support and improve LiB thermal management.
In this work, a sensing network of 37 FBGs is proposed for the detection of temporal and spatial variations of temperature at the interfaces of a pack of 3 prismatic LiPBs. A cycling protocol considering the charge at 1.0 C, and different discharge rates, at 0.7 C and 1.4 C, was performed. The temperature measurements are performed in situ and operando.

2. Materials and Methods

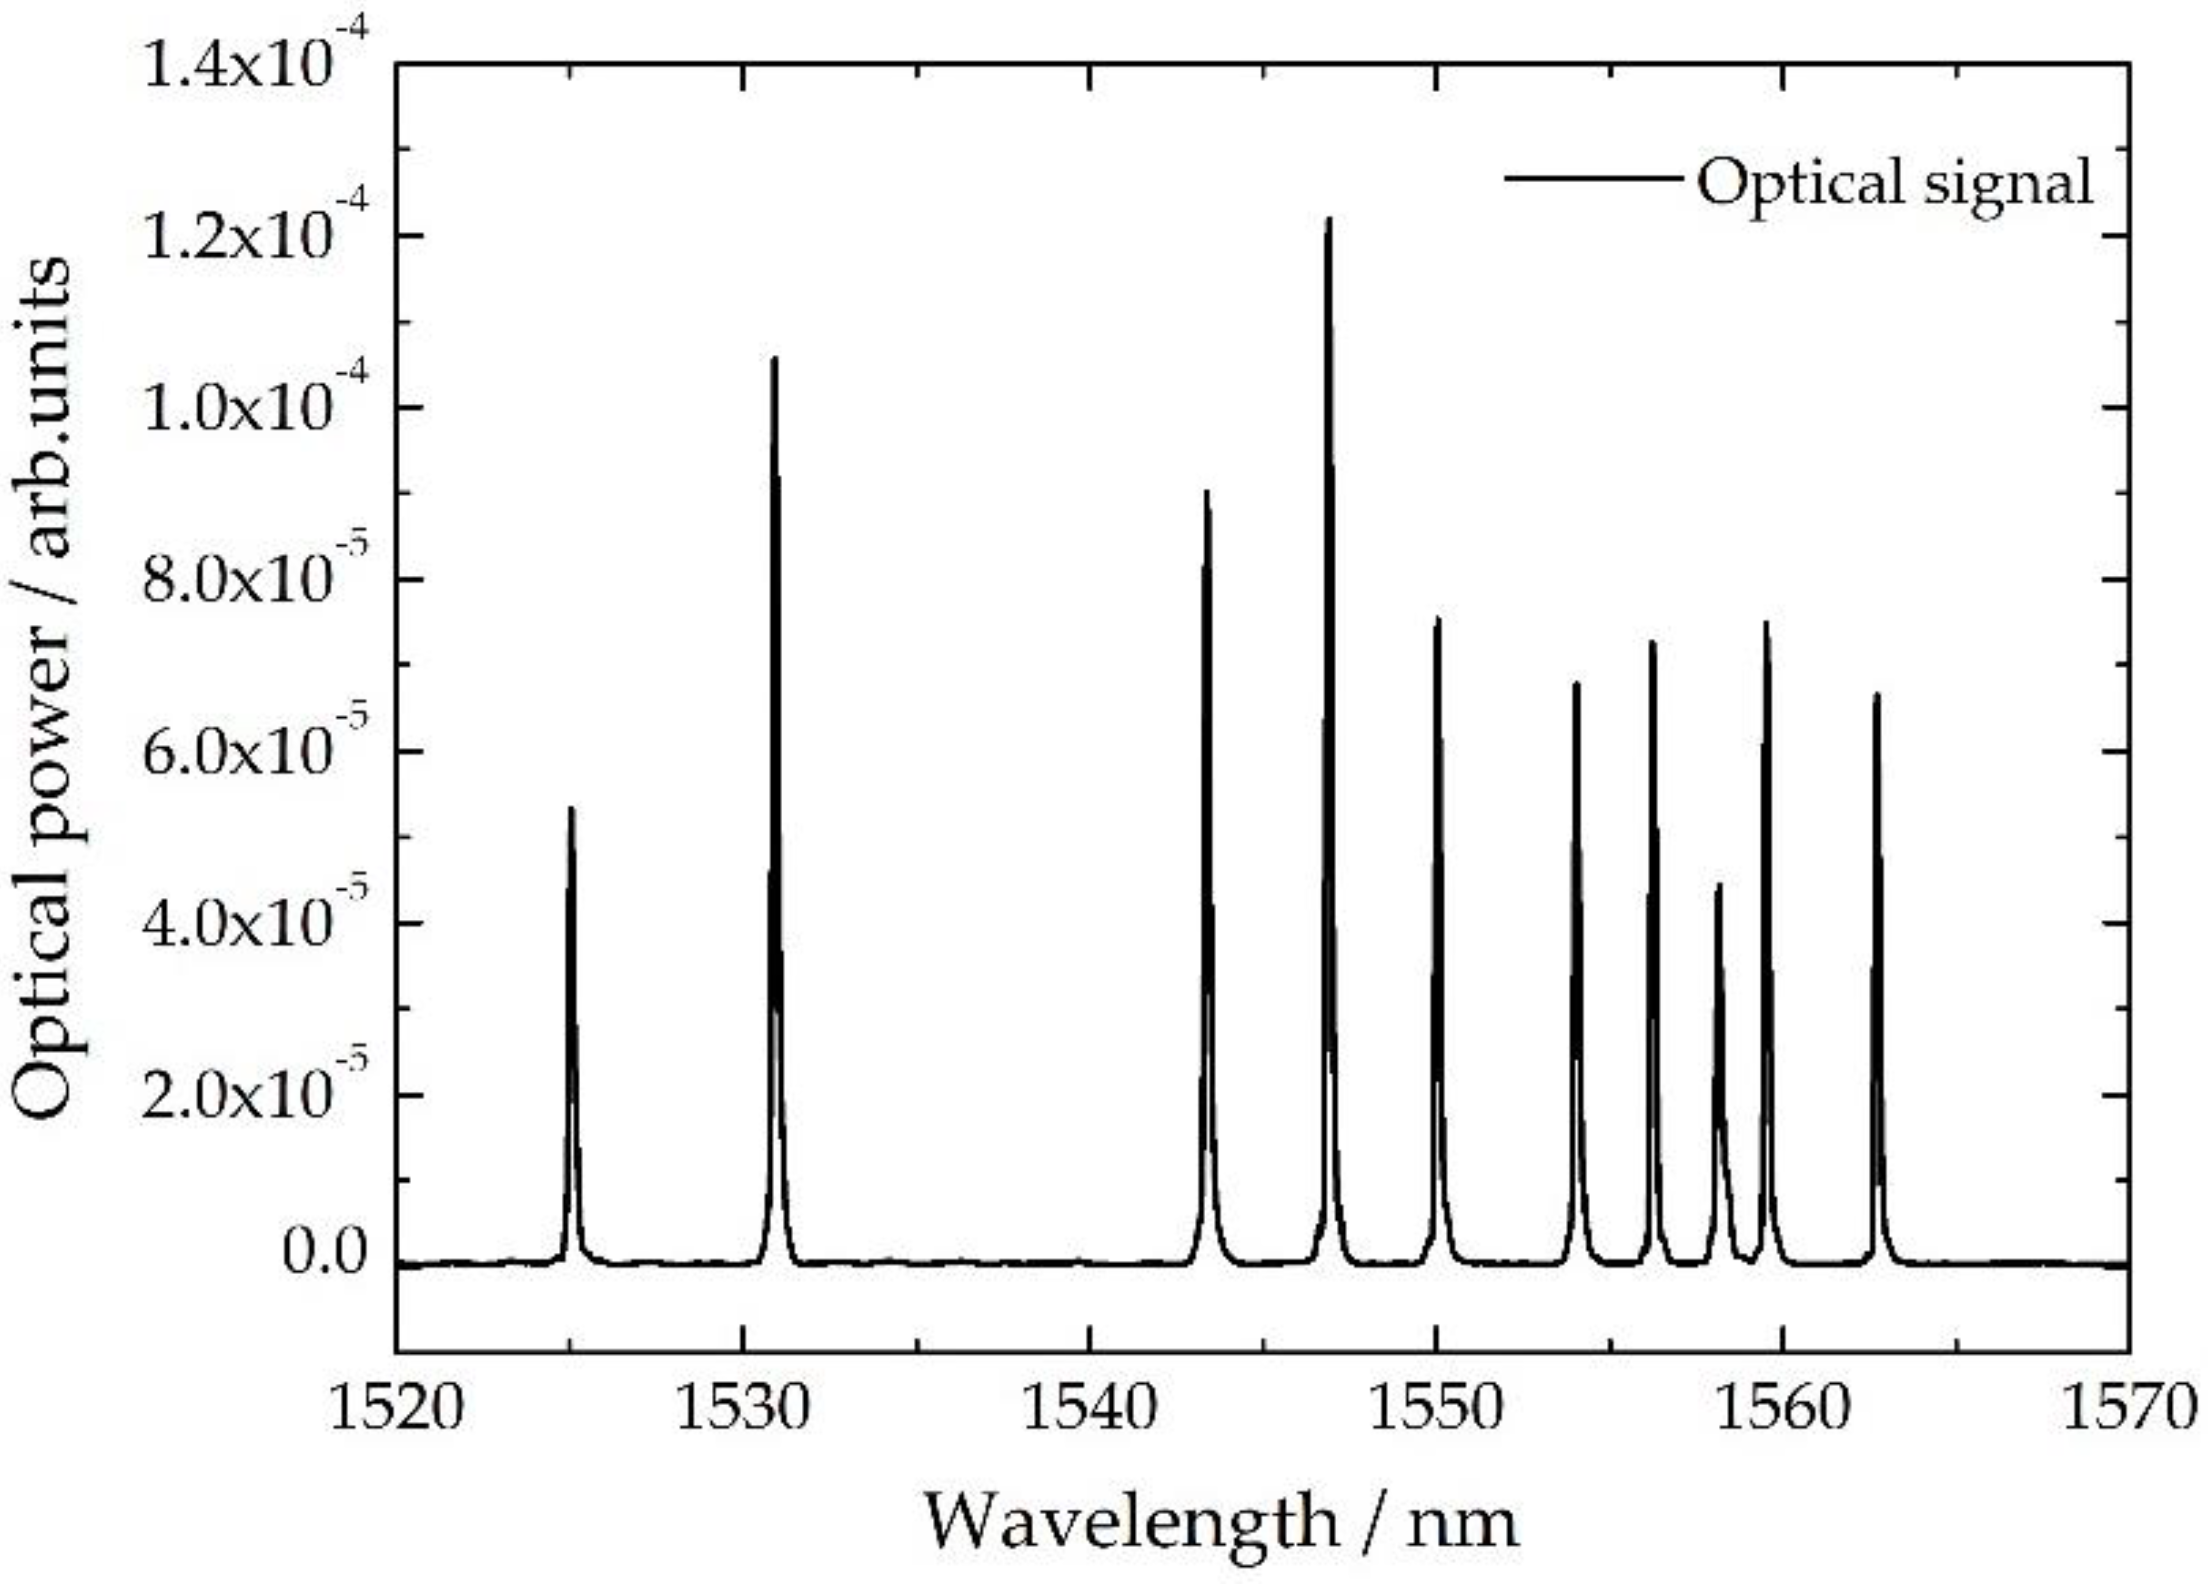
2.1. Fiber Bragg Grating Sensor Network

A fiber Bragg grating (FBG) sensor consists of a small segment of a single-mode optical fiber (length of a few millimeters) with a photoinduced, periodically modulated refractive index in the fiber core. The FBG resonant wavelength, λB, is related to the grating period (Λ) and to the effective refractive index of the core mode (neff) as in Equation (1):
λ B = 2 n e f f Λ
When the grating is illuminated with a broadband optical source, the reflected power spectrum presents a sharp peak, which is caused by the interference of light with the planes of the grating [31]. When the fiber is exposed to external variations of a given measurand (such as temperature), both neff and Λ can be changed, producing a shift in λB. The FBG sensitivity (K) towards a given parameter is obtained by subjecting the sensor to pre-determined and controlled variations of the parameter and measuring the λB for each step. The effects of temperature are accounted for in the Bragg wavelength shift (λ) by differentiating Equation (2):
Δ λ = 2 λ B ( 1 n e f f n e f f T + 1 Λ Λ T ) Δ T = λ B ( α + ξ ) Δ T = K T Δ T
where α, ξ, and K T are the thermal expansion, thermo-optic coefficient of the optical fiber material, and the temperature sensitivity, respectively.

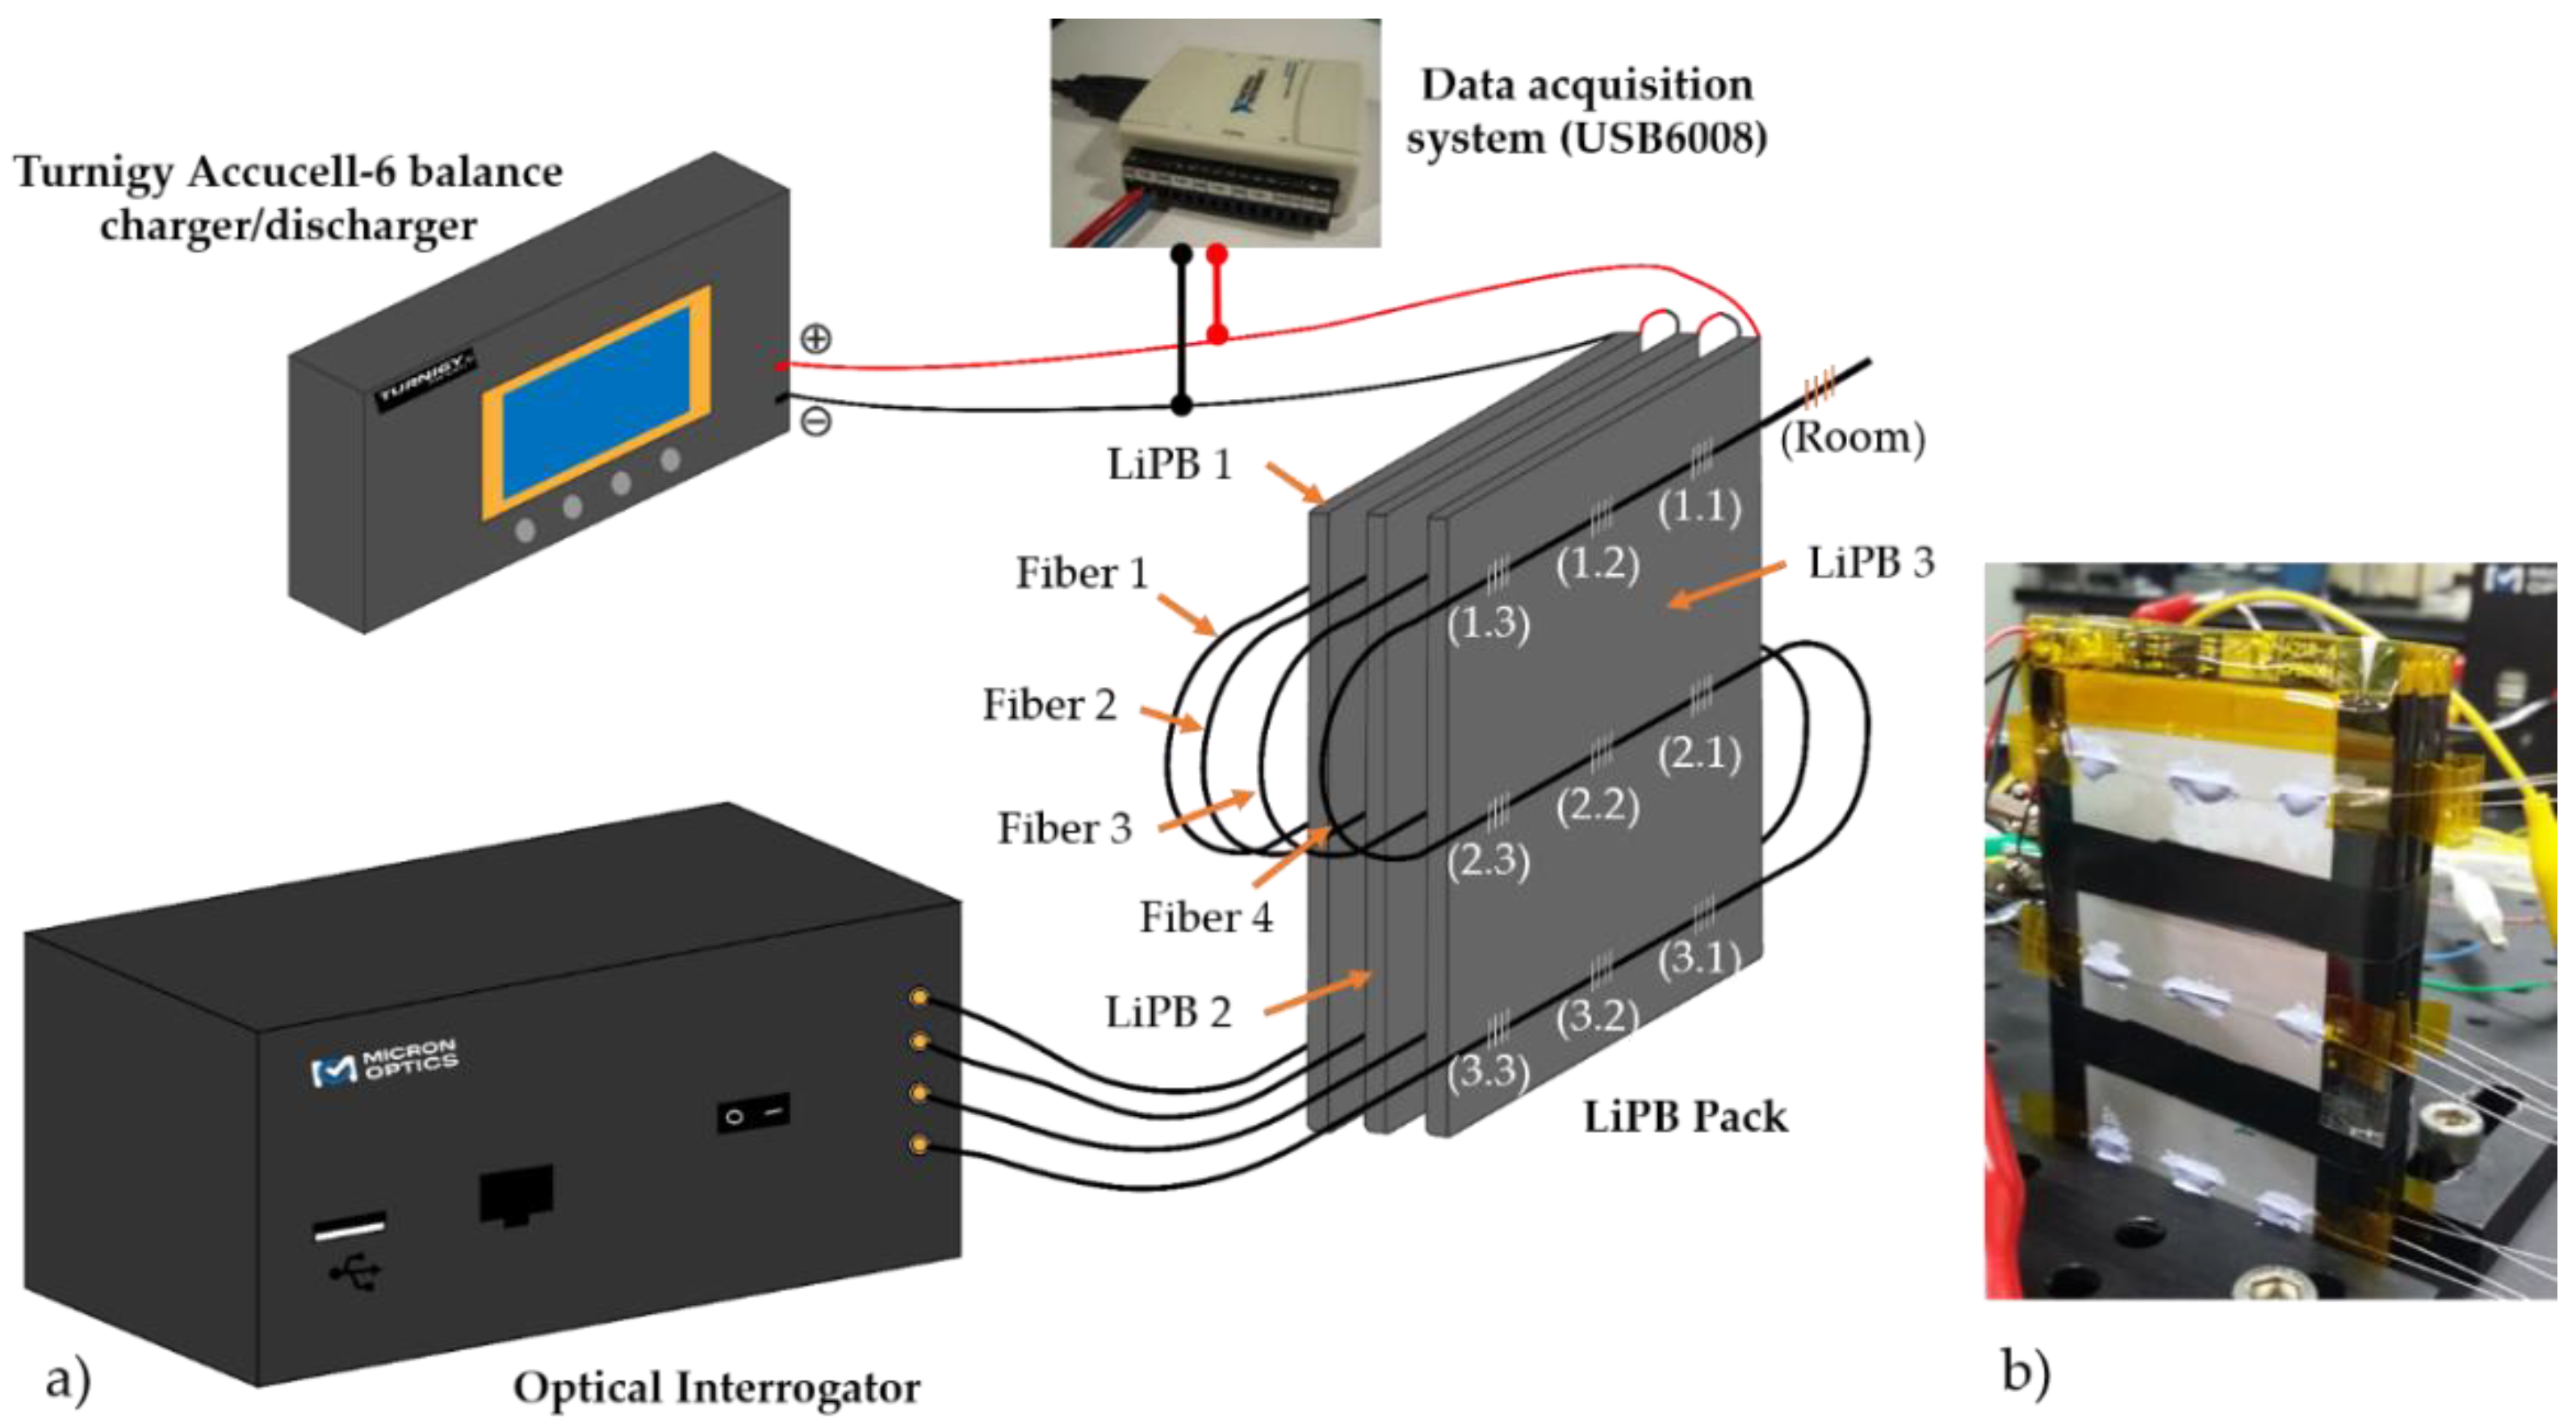
2.2. Experimental Setup

The FBGs (length of ~3.0 mm each) were sequentially recorded in four different photosensitive single-mode fibers (SMF) (GF1, Thorlabs Inc., Newton, MA, USA), using the phase mask method. A pulsed Q-switched Nd:YAG laser system (LOTIS TII LS-2137U Laser, Minsk, Belarus) lasing at the fourth harmonic (266 nm) and focusing the beam in the SMF with a plano-convex cylindrical lens (working length of 320 mm), was used. The reflected Bragg wavelengths were measured with an optical interrogator (sm125-500, Micron Optics Inc., Atlanta, GA, USA) operating at 2.0 Hz and wavelength accuracy of 1.0 pm. Typically, these sensors can operate from −150 °C up to ~350 °C without damaging the sensor’s reflection signal [37,38]. Figure 1 presents the spectrum for one of the fibers with a total of 10 FBG sensors.
A thermal calibration was performed prior to attaching the fiber sensors network to the LiPBs pack. The sensor’s thermal calibration was made using a Peltier device with a resolution of 0.01 °C. The temperature range was between 20.0 °C and 60.0 °C, in steps of 5.0 °C. Table 1 indicates the λB at room temperature and the KT obtained through the thermal calibration for one fiber. Notice that in the other fibers, KT and λB of the FBGs are very similar and are in the same location on the LiPBs. From Equation (2) it is possible to convert the wavelength shifts detected by the sensors into temperature variation (ΔT). Considering the calculation of the standard deviation between the maximum and minimum fluctuations of the sensors signals acquired over 1 h on the Peltier device with a stabilized temperature, an experimental resolution of 0.1 °C was determined for the FBGs.
The position of each FBG in relation to the battery is presented in the format of a matrix (i.j), where i = 1, 2, 3 corresponds to the top, middle, and bottom positions, whereas j = 1, 2, 3 indicates the sensor location on the left, middle and right, respectively.
Three rechargeable prismatic LiPBs (Cameron Sino Technology, China) with nominal voltage of 3.7 V/cell, nominal capacity of 1600 mAh and dimensions of 79 mm (length) × 54 mm (width) × 4 mm (thickness), were packaged in series, performing as an LiPB pack with a nominal voltage of 11.1 V. The voltage signal was monitored using a 12-bit resolution data acquisition system (DAQ) (USB6008, National Instruments). The acquisition modules were controlled by a LabVIEW® customized application, allowing real-time monitoring of the acquired data. The LiPBs pack was cycled twice under two different discharge rates of 0.7 C and 1.4 C through two power resistors of 10.0 Ω and 5.0 Ω, respectively, until a cut-off pack voltage of 9.0 V was reached. A fast charge current of 1.0 C was applied using a commercial Turnigy Accucell-6 balance charger/discharger with maximum current of 5.0 A.
The temperature variations were monitored with a network of 37 FBG sensors, divided by four different optical fibers (nine FBG sensors in each fiber), glued to the surface of the battery in nine strategic locations disposed as a 3 × 3 matrix as can be seen in Figure 2.
The extra FBG sensor was used out of the pack to monitor the room temperature variations and thus to eliminate possible external fluctuations. This setup allowed for the monitoring of temperature variations throughout the LiPBs pack interfaces on the top, middle and bottom areas. Thermal paste was placed along all fibers to increase thermal conductivity between the battery and the optical sensors.
In total, four interfaces on the LiPBs pack were monitored. Fiber 1 was placed in the surface of the LiPB1 (interface air-LiPB1) (negative electrode surface), fibers 2 and 3 were sandwiched in the interfaces between the LiPB1 and LiPB2 (interface LiPB1-LiPB2), and LiPB2 and LiPB3 (interface LiPB2-LiPB3), respectively. Fiber 4 was positioned in the other surface of the LiPB3 (interface LiPB3-air) (positive electrode surface).

3. Results and Discussion

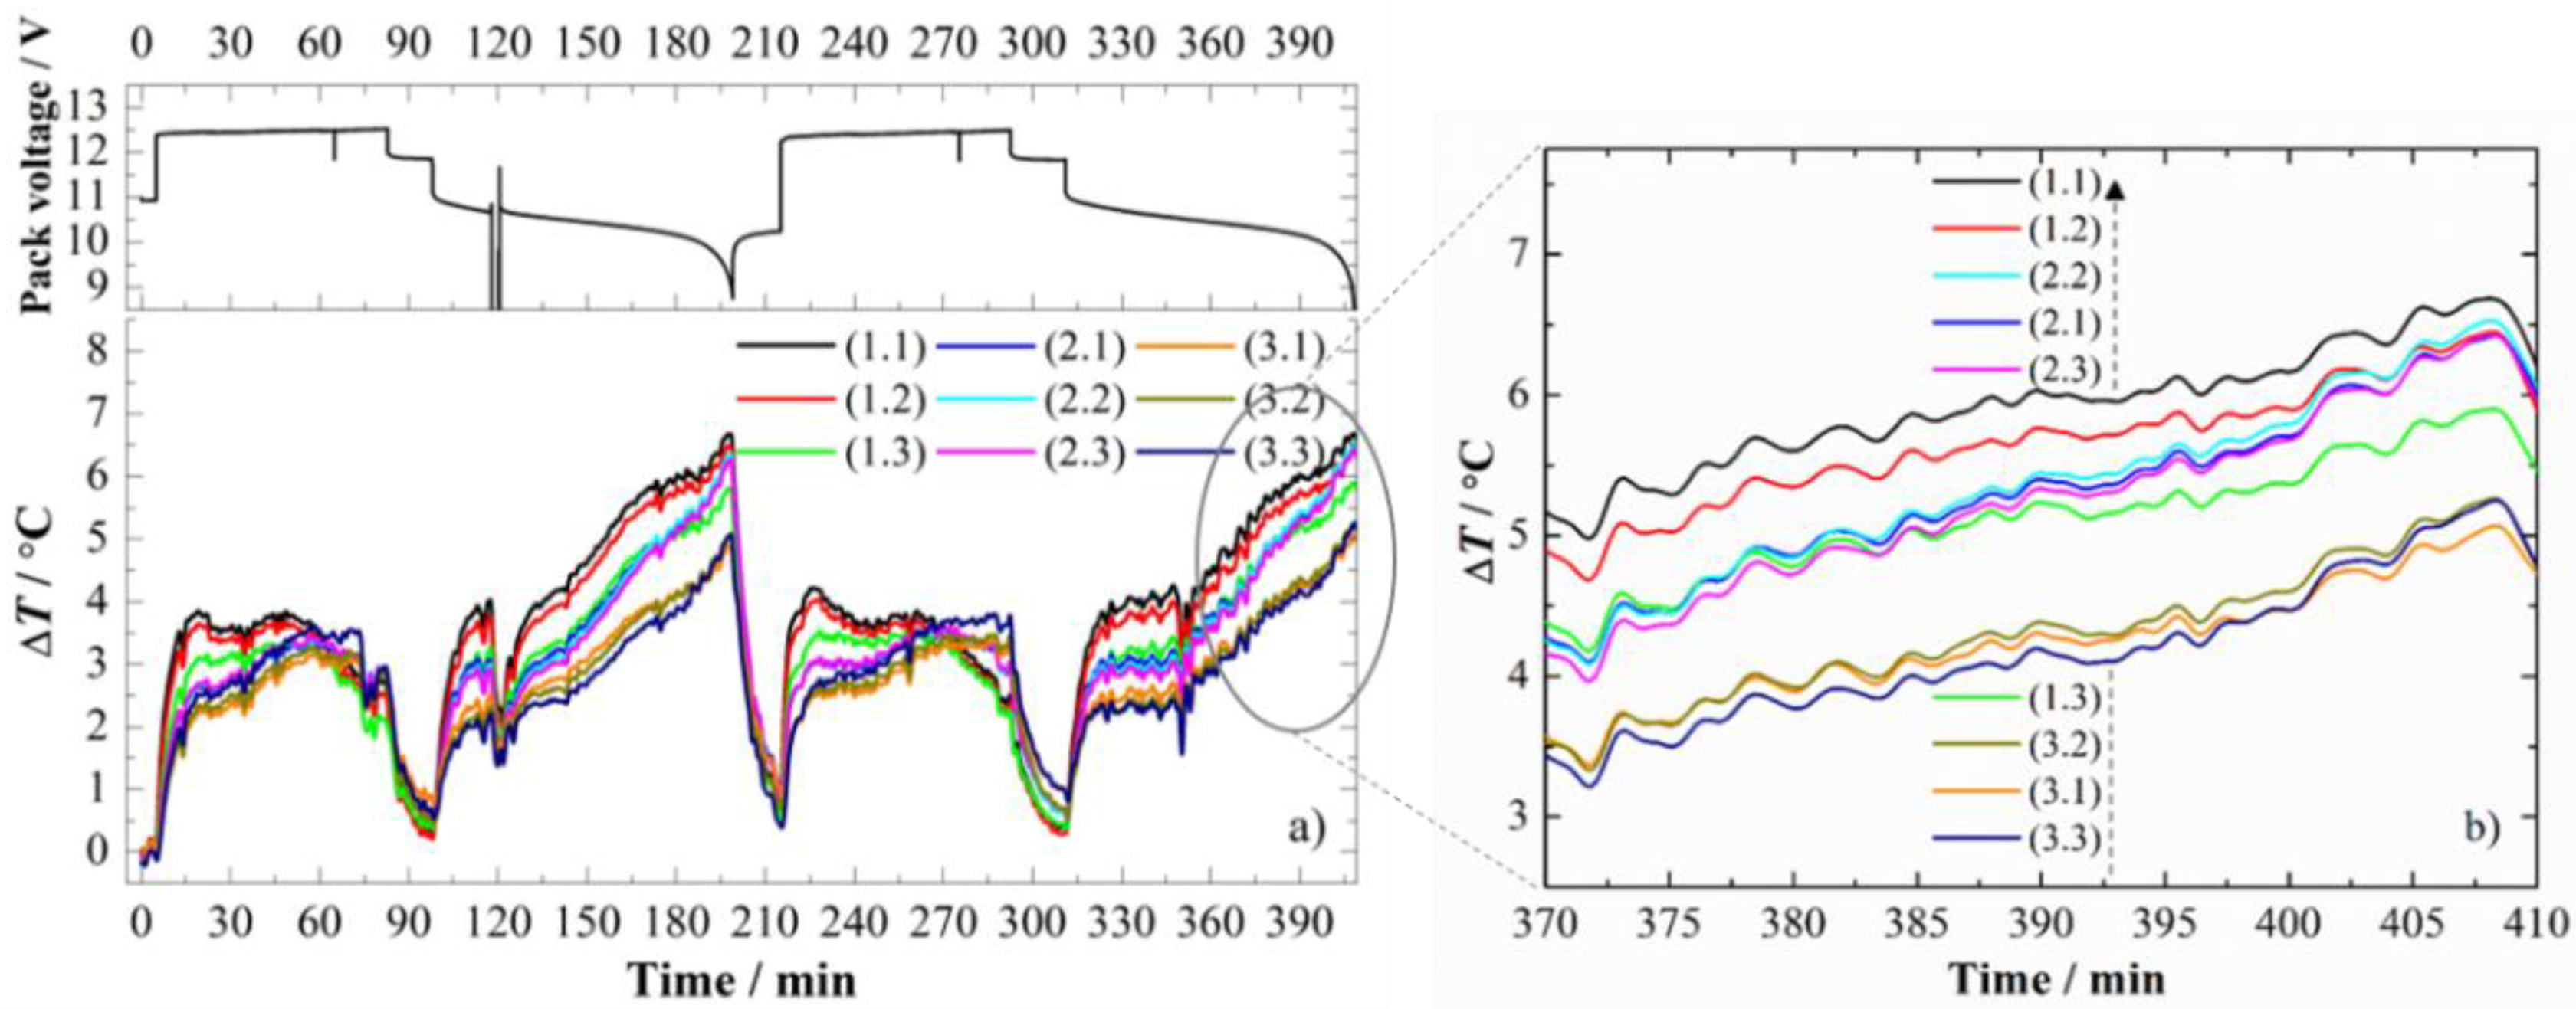
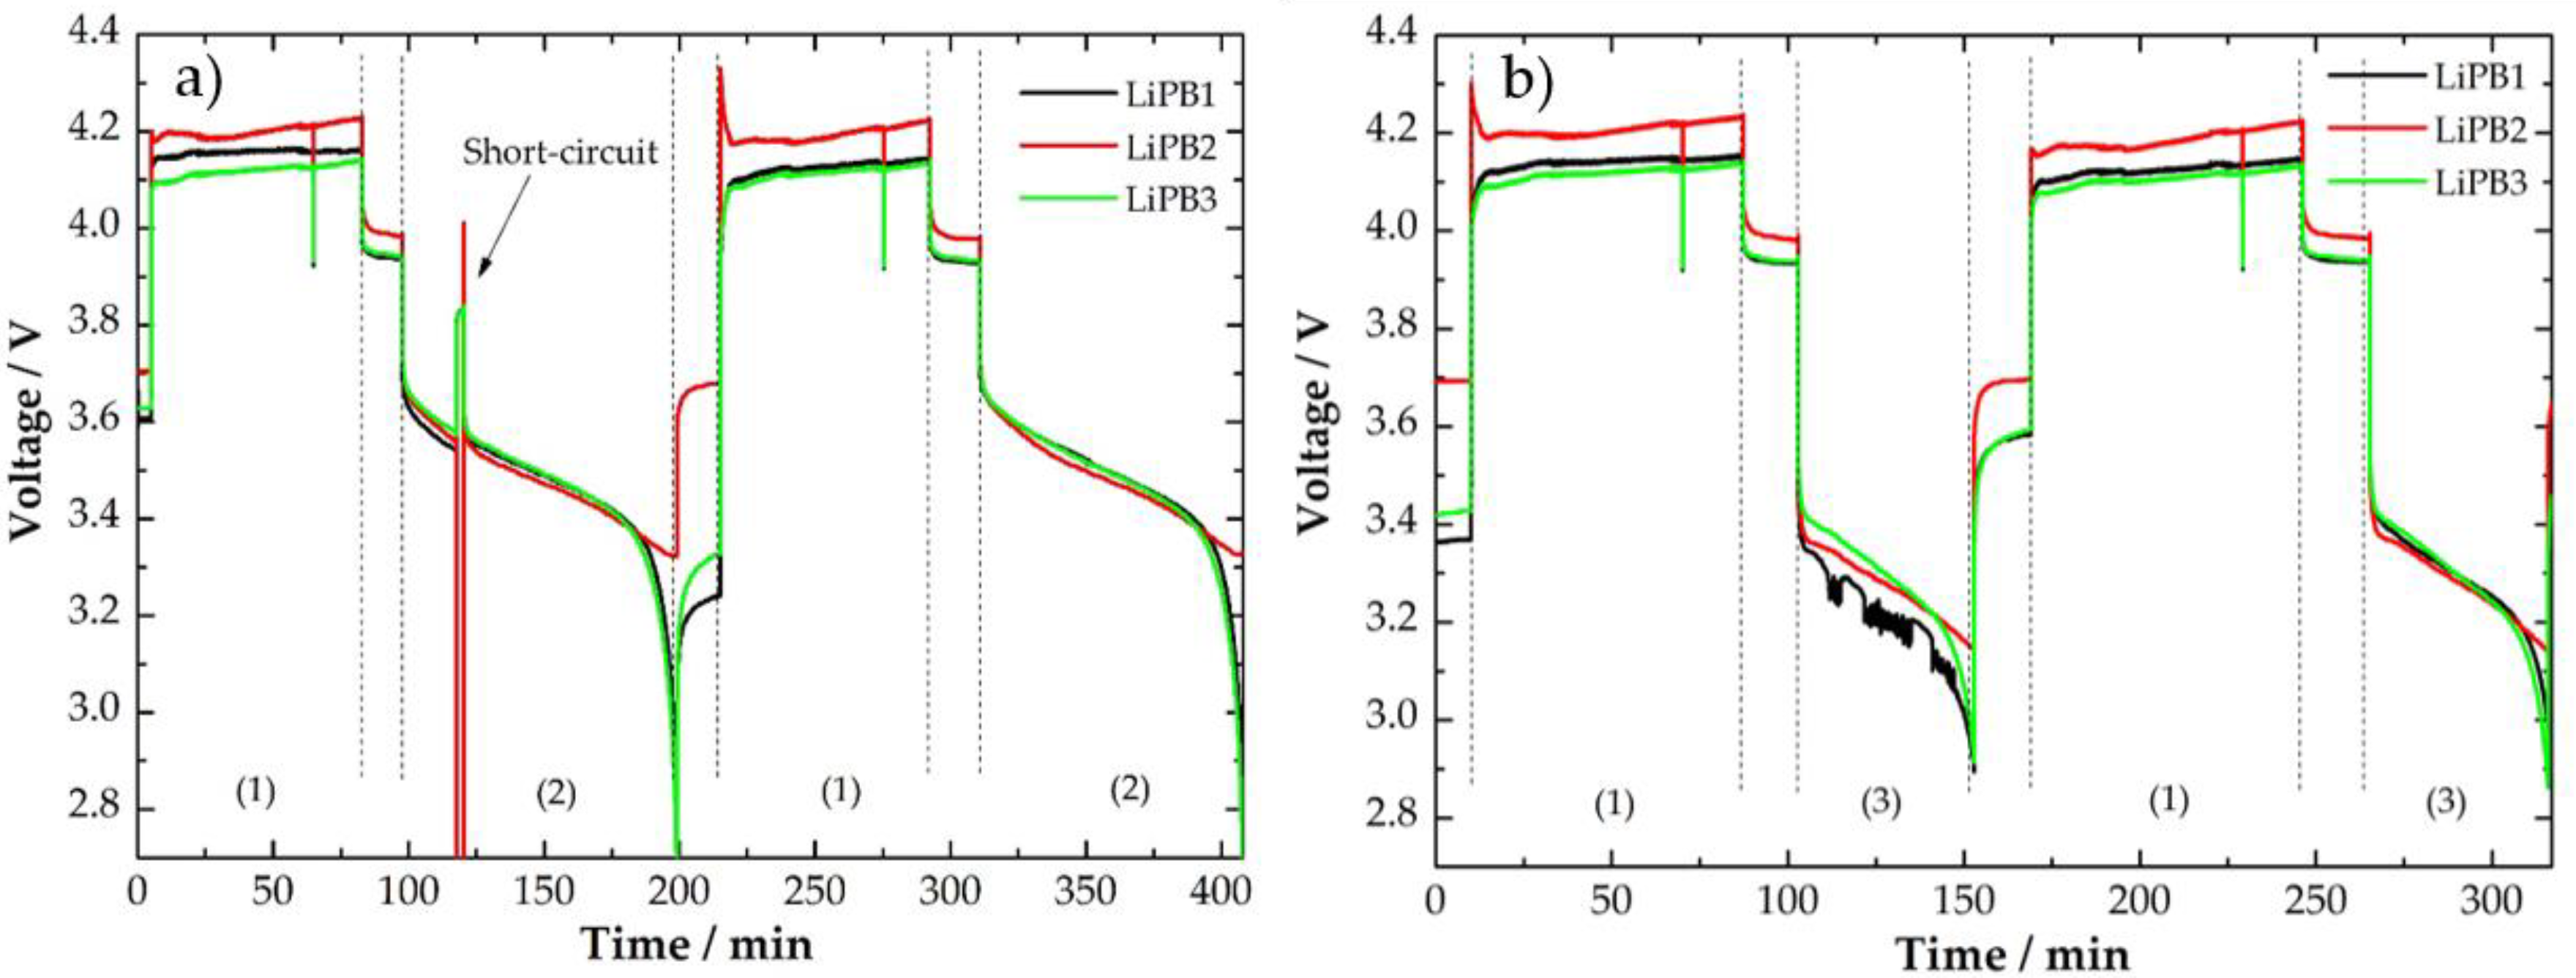
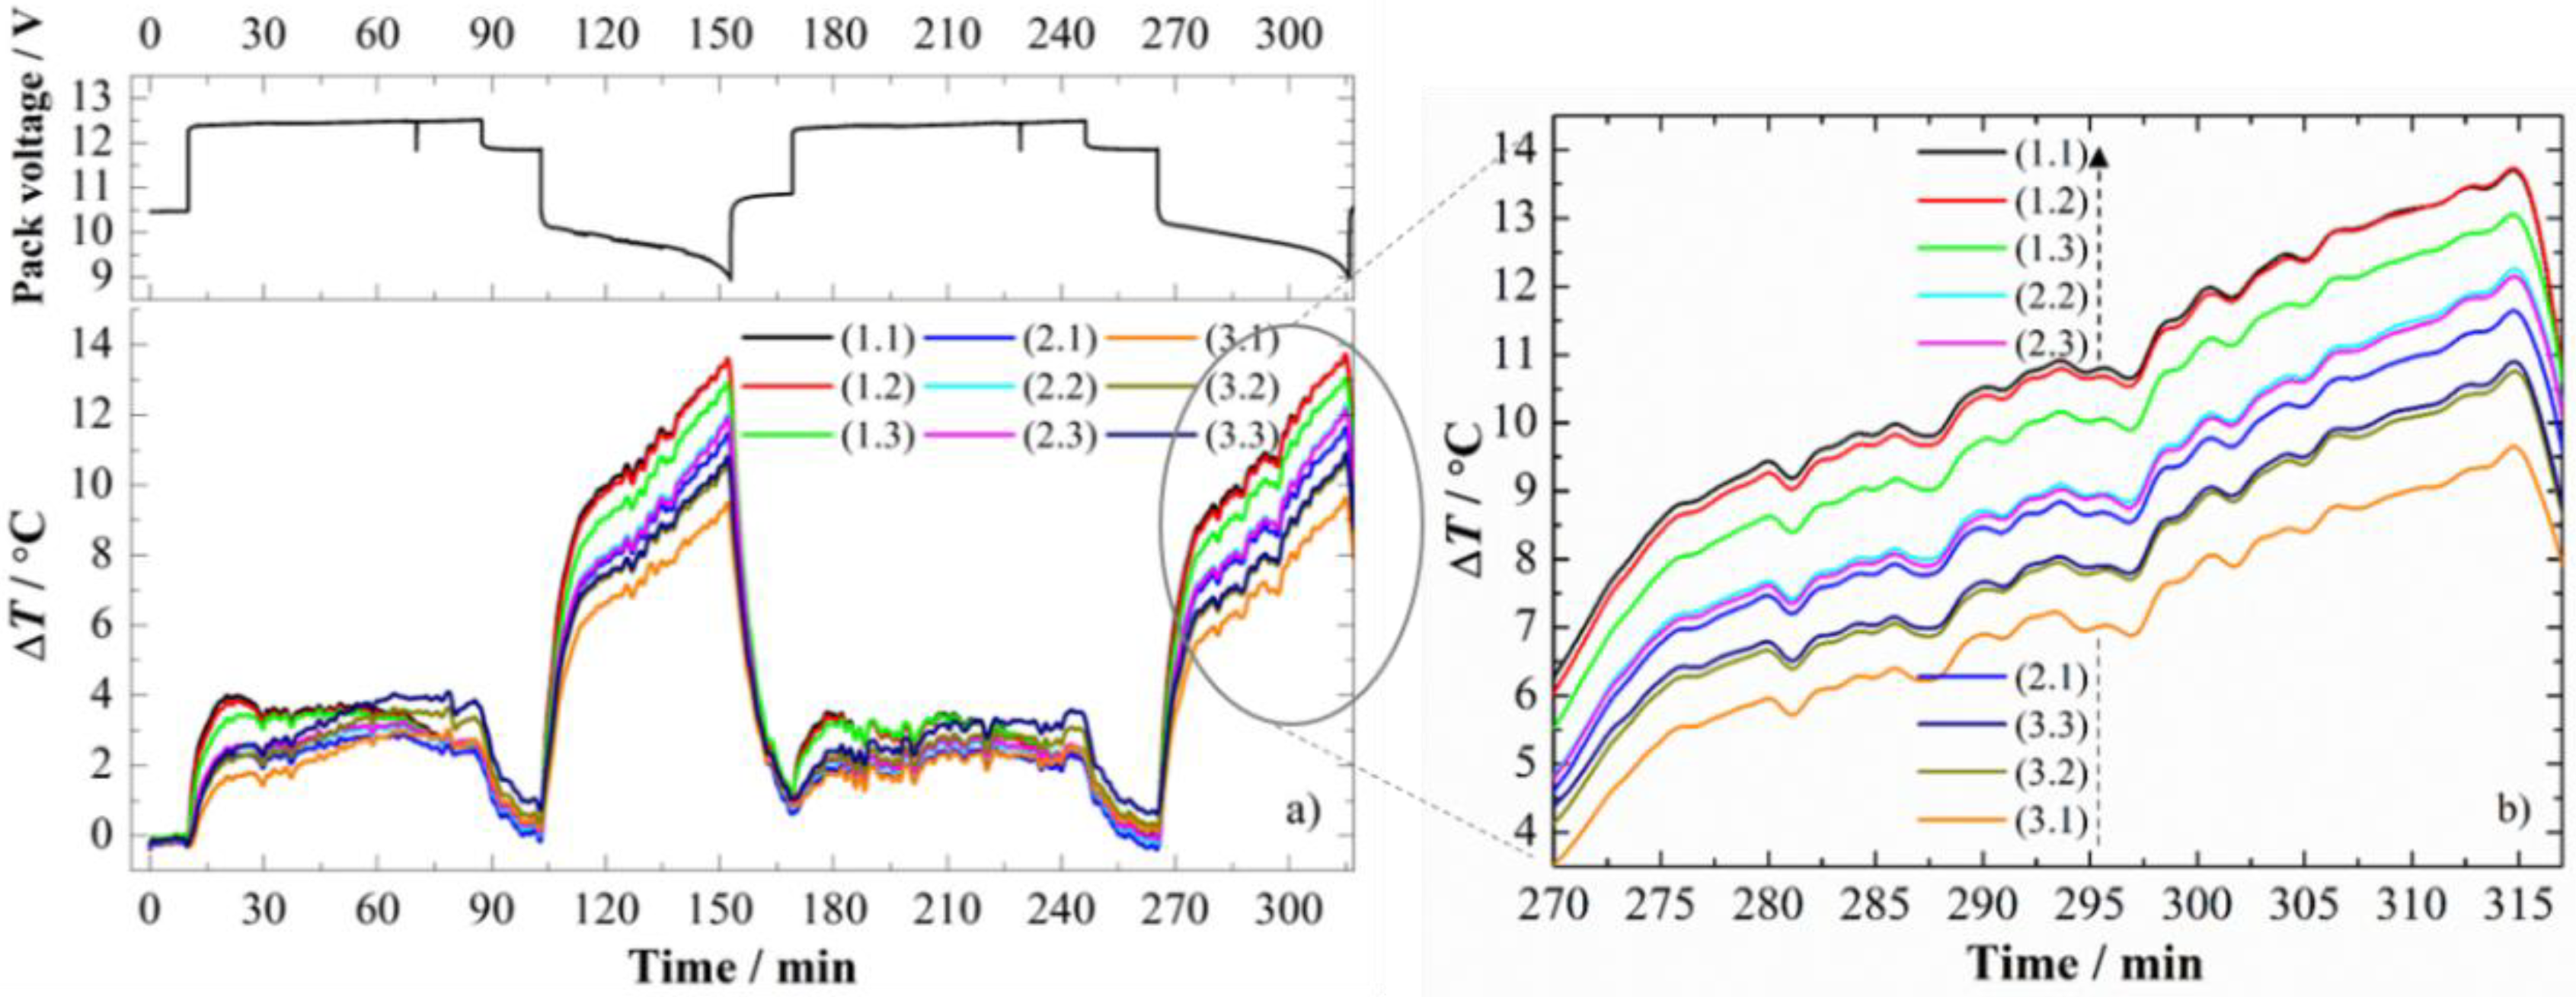
3.1. Cycling Protocols—Voltage and Temperature Curves

Figure 3 presents the voltage signals measured with the DAQ during the cycling tests for each battery that composed the LiPBs pack, under normal and abusive discharge conditions of 0.7 C (Figure 3a) and 1.4 C (Figure 3b). In total, four discharge cycles were applied, followed by a fast charge of ~1.0 C in all of them. Between the constant current (CC) charge/discharge steps, a resting time of ~15 min was selected to stabilize the temperature and relax the LiPBs pack. It is important to mention that the cooling of the LiPBs pack during all the cycling tests was performed by natural convection. The intentional short-circuit at the discharge cycle observed in Figure 3a was performed to assess the thermal impact at the LiPBs pack and its influence on the voltage behavior. After the circuit was re-established, the LiPBs pack returned to its previous behavior without affecting the posterior data.
For both discharge rates, the LiPB2 exhibited a better performance when compared to the other two pack batteries, presenting higher voltage values and more stable signals. For this reason, the temperature variations detected by the FBGs network placed on the LiPB1–LiPB2 interface as a function of the time and pack voltage were selected and are shown in Figure 4 and Figure 5. The intentional short-circuit described before and presented in Figure 4a, at around 120 min, translated into an instantaneous decrease of temperature, as expected. The temperature increased once again after the circuit was re-established, following the same behavior as in the second cycle.
During all the cycling tests represented in Figure 4a and Figure 5a, the sensor’s responses were very coherent with the voltage signals. The temperature fluctuations detected by the FBG sensors corresponded to the normal heating flux produced by the LiPB pack. Over the four CC charge steps (1), maximum temperature variations (ΔT) of 4.0 ± 0.1 °C were sensed by the FBG sensors placed on positions 1.1 and 1.2. During the CC discharge steps (2) and (3), higher ΔT values of 6.8 ± 0.1 °C (highlighted on Figure 4b) and 14.0 ± 0.1 °C (highlighted on Figure 5b) were respectively registered at the end of each step.
Over the CC discharge steps (2) and (3), a gradual temperature increase is observed while the LiPBs pack discharges up to 9.0 V. However, three different temperature increase rates can be precisely tracked. The first one—immediately after the beginning of discharge, the second—between 11.0 V and 10.5 V, and the last one—between 10.5 V and 9.0 V. The first one is the highest and fastest and is proportional to the discharge rate applied. The second one is only registered under the discharge rate of 0.7 C due to the higher jump in voltage to 10.3 V when the CC discharge step begins.
On the thermal behavior detected by the sensors located at the LiPB1–LiPB2 interface, during a CC discharge step at 0.7 C as highlighted in Figure 4b, there is a clear continuous heat generation up until the end of the discharge (EOD) process in all areas of the surface. However, there are different temperature variations depending on the sensor location. For example, the FBG placed in position (1.3) at ~370 min presented the third highest temperature variation, but as the temperature did not increase at the same rate as in other sensors. At ~383 min that location became the sixth hottest area.
A continuous increase of heat generation is observed in all areas during discharge rate at 1.4 C (see Figure 5b), and no changes were detected in terms of the gradient of the temperature between the beginning and finishing of the process in all FBGs areas. Thus, locations (1.1) and (1.2) were the hottest spots both when the discharge started and ended. The coldest zone was monitored by the FBG sensor on location (3.1). In EOD at ~315 min, a significant difference in temperature variation between the hot and cold areas of 4.3 ± 0.1 °C was observed.

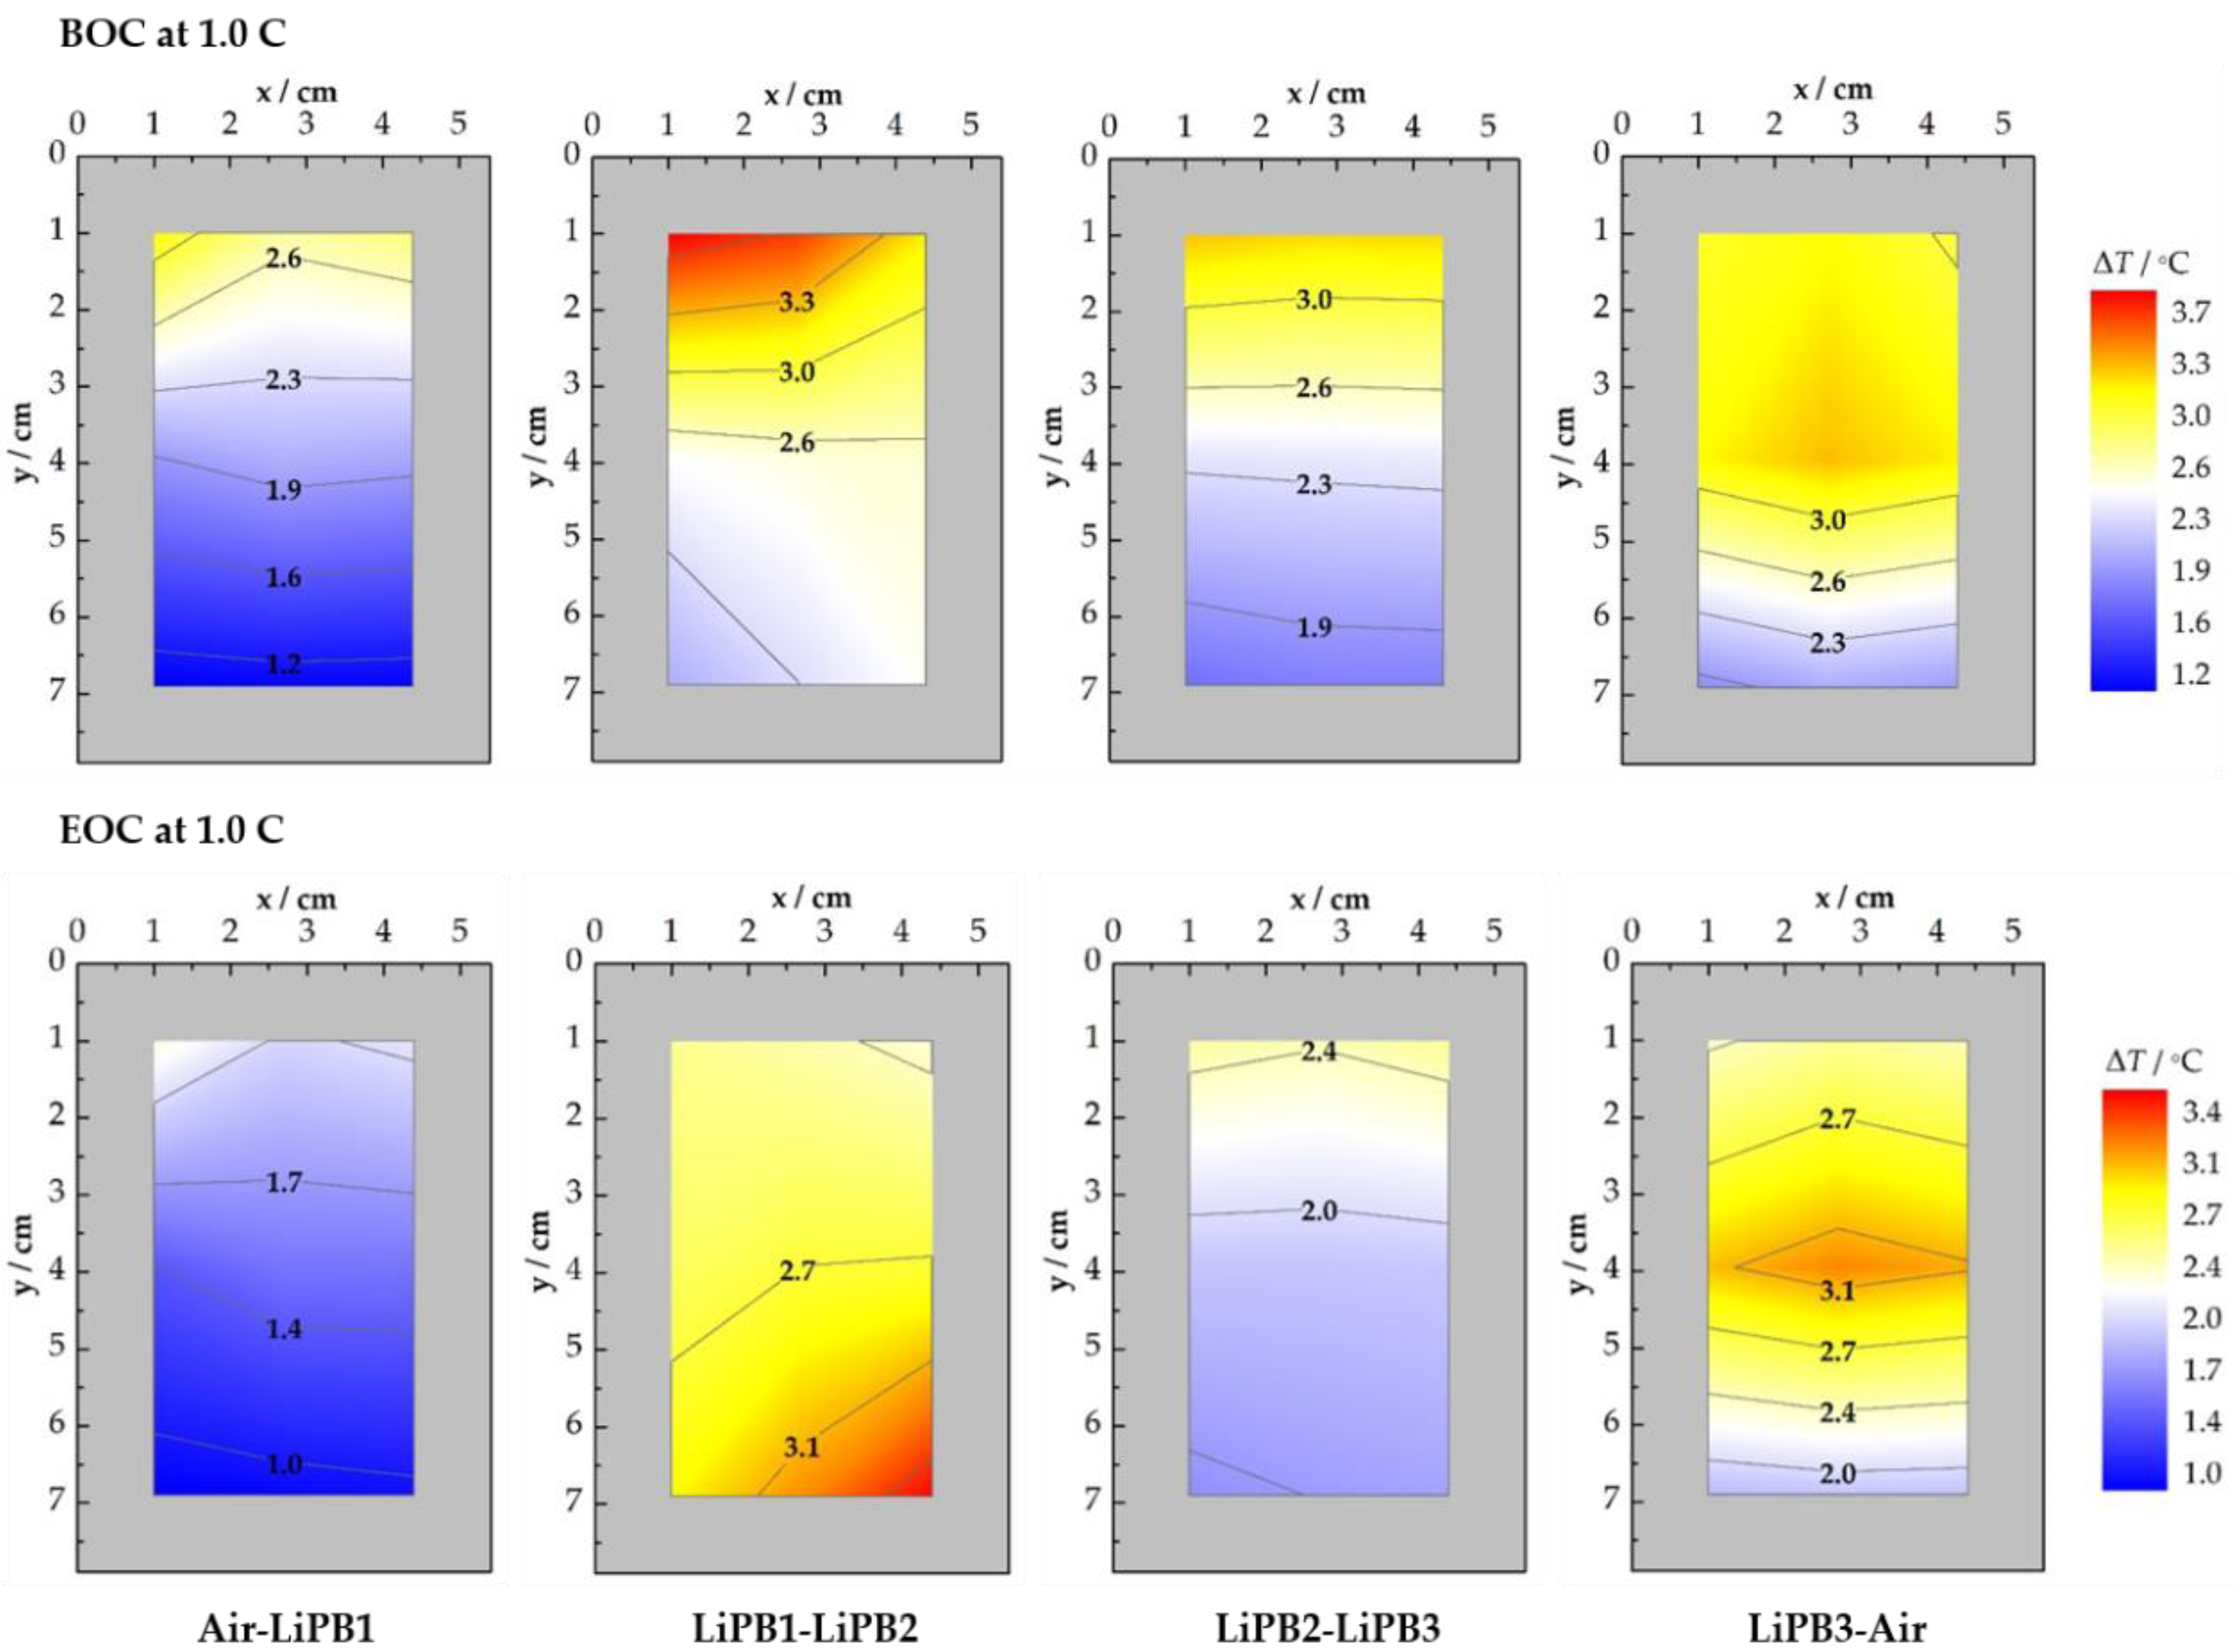
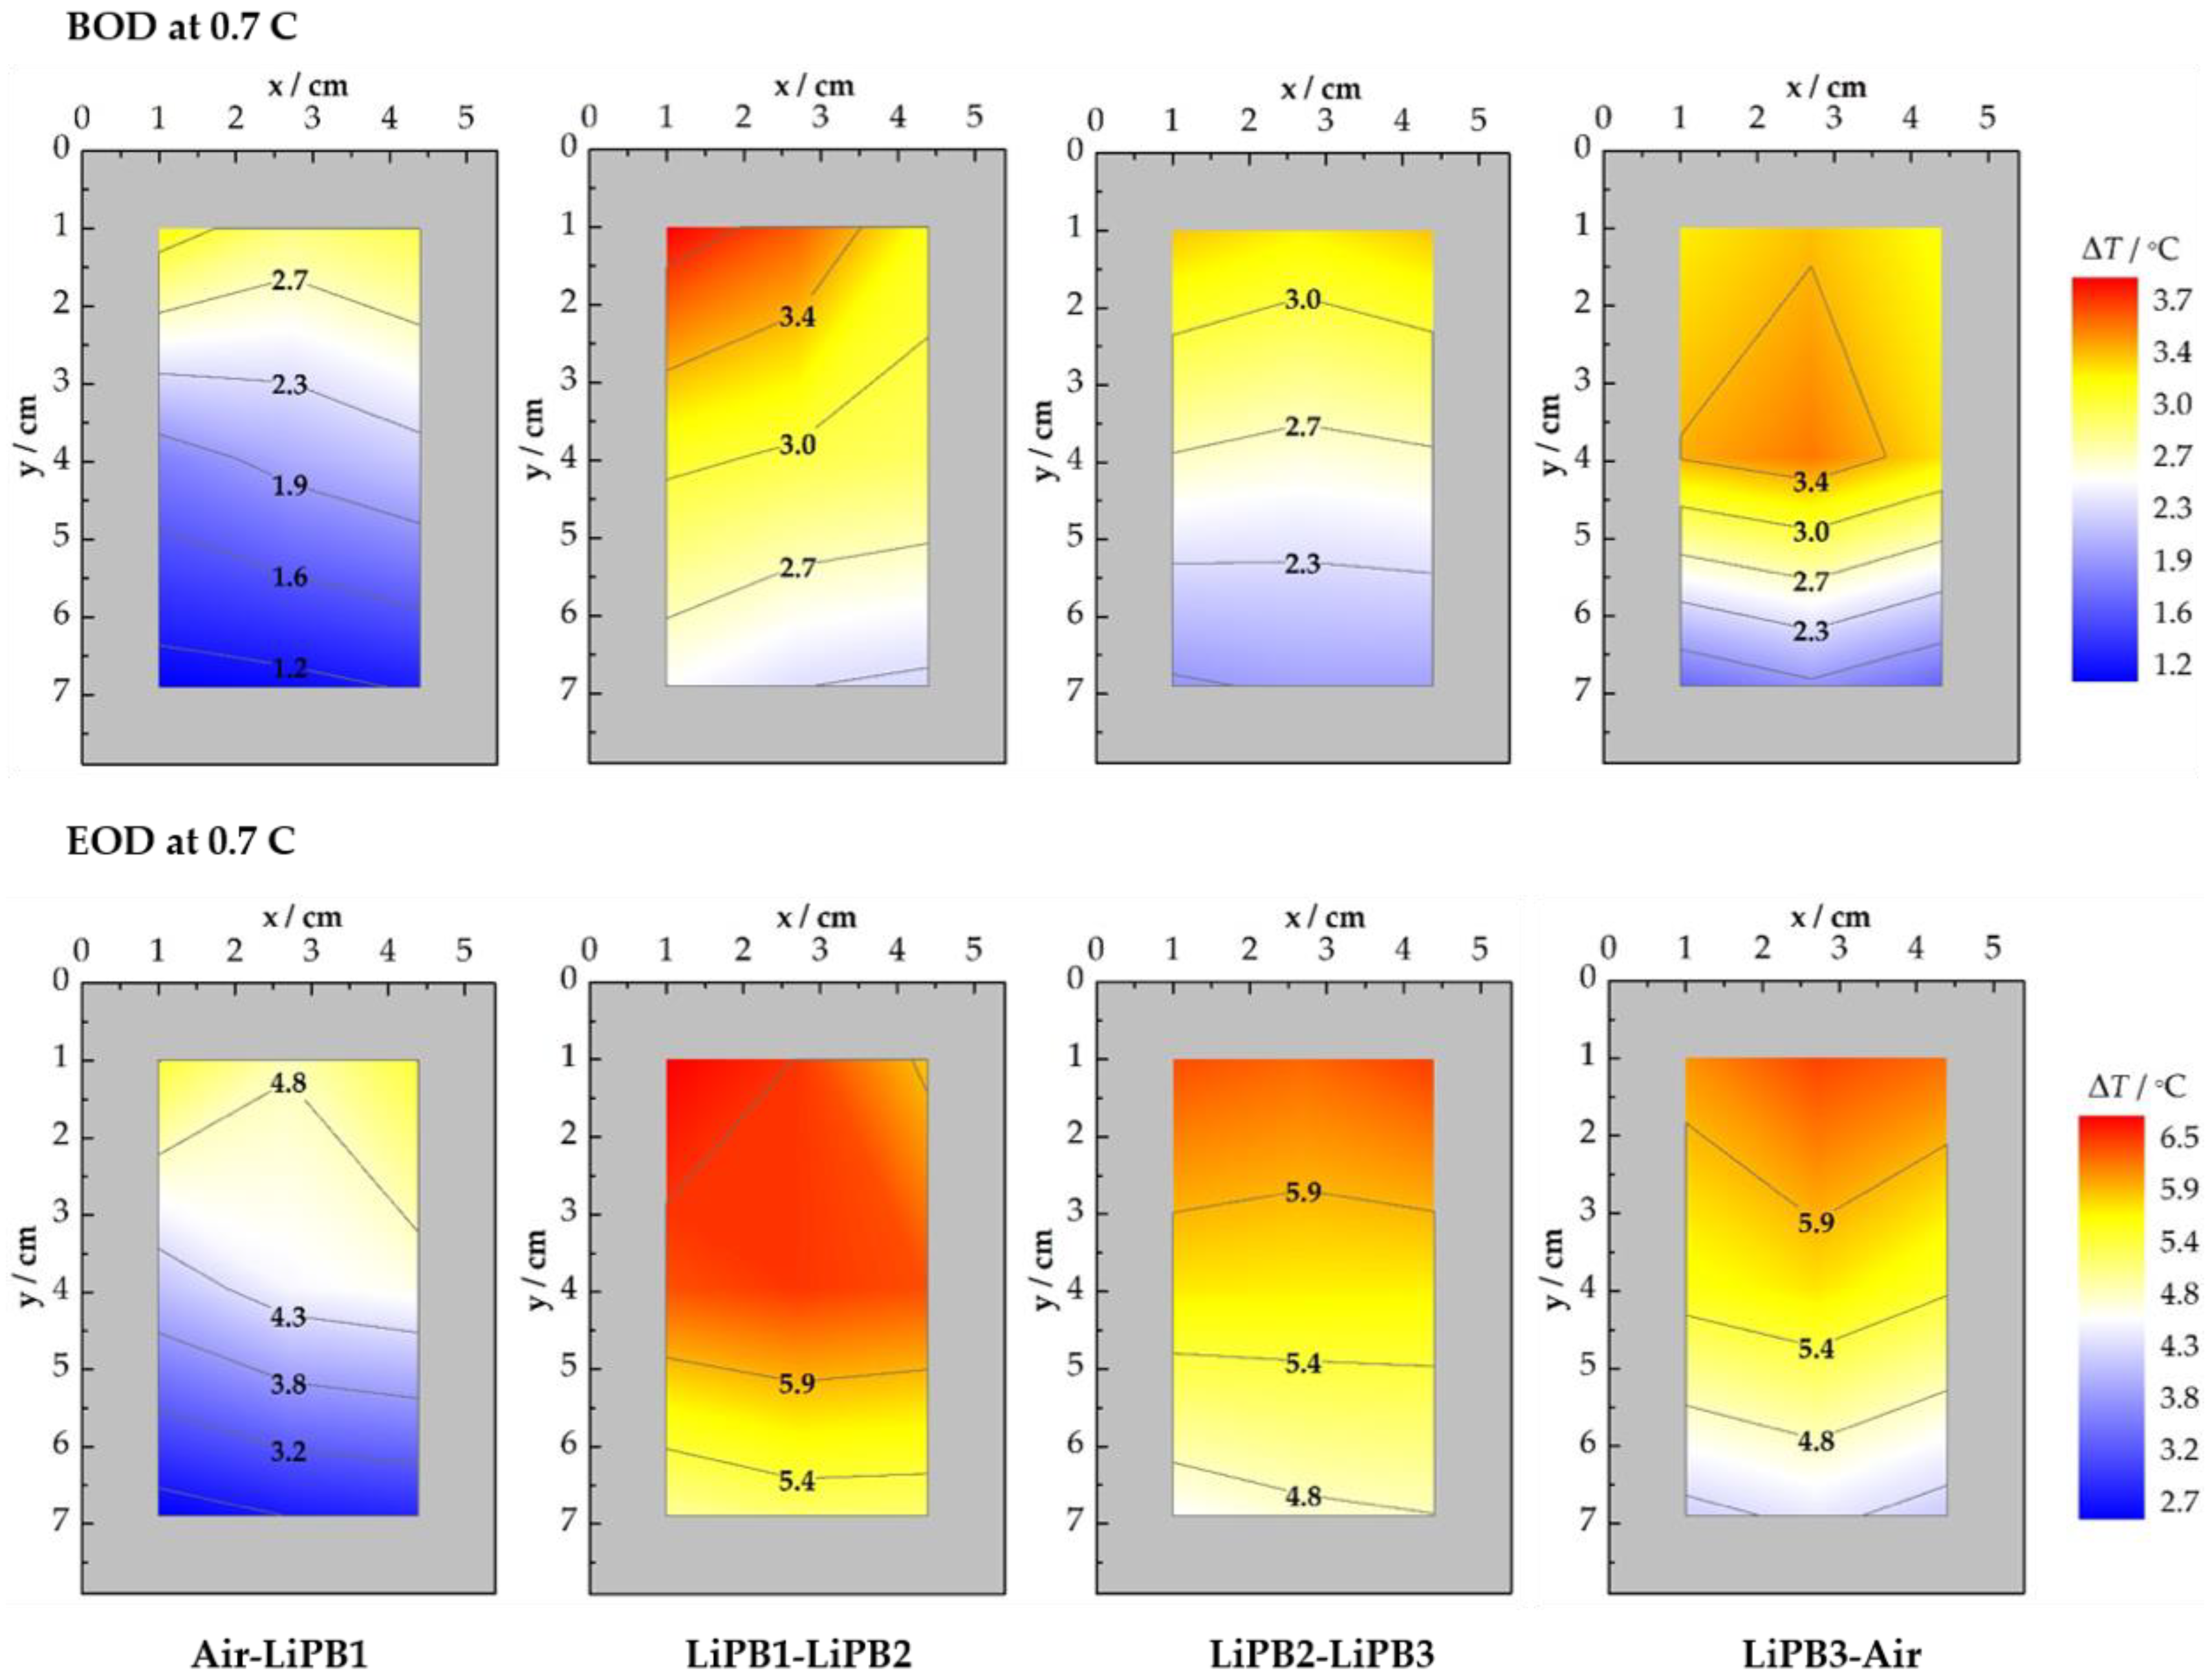
3.2. Spatial and Temporal Thermal Mapping

3.2.1. CC Charge at 1.0 C

The spatial and temporal thermal mapping of the four interfaces can be inferred through the FBG sensor responses just instants after the beginning (first instantaneous increase of temperature) and the end of each CC charge step at 1.0 C as it is shown in Figure 6. In this Figure, each set of data represents the mean ΔT values between the four equal CC charge steps that the LiPBs pack was submitted to. Analyzing the temperature distribution produced at the beginning of charge (BOC), the same thermal profiles are observed in all the interfaces with heating zones at the top of the LiPBs that compose the pack identified by the FBGs located on (1.1), (1.2), and (1.3), and cold areas predominantly in the bottom positions, corresponding to the (3.1), (3.2), and (3.3) zones.
Between all the interfaces monitored, the air–LiPB1 interface (monitored by fiber 1), was considered the coldest. On the other hand, the hottest interface was the one sandwiched between LiPB1 and LiPB2 (monitored by fiber 2). The warmest area was detected in this surface by the FBG in position (1.1) with ΔT values of 3.7 ± 0.1 °C. At the center of the interface between LiPB3 and the air, a heating zone with ΔT values of 3.3 ± 0.1 °C was identified. It is possible that this happened because of greater proximity with the positive electrode existing in this surface.
In the end of charge (EOC), a different thermal profile was observed, mainly at the LiPB1–LiPB2 interface, in which the heating zone was detected by the FBG placed in position (3.3) with ΔT values of 3.4 ± 0.1 °C, and the coldest in the top position (1.3). Notice that the scale is slightly different to the scale used in the BOC. The surface monitored by the sensors in the fiber 1 (Air–LiPB1 interface) remained the coldest. An interesting thermal profile was identified in the LiPB3–air interface, with a clear warmer central area and a decrease in ΔT from that area until reaching the extremities of the battery. The LiPB2–LiPB3 interface was shown to be the more thermally stable one all over the surface.

3.2.2. CC Discharge at 0.7 C

The temporal and spatial thermal mapping of the interfaces presented in the LiPB pack in the beginning of discharge (BOD) and EOD instants at 0.7 C, can be seen in Figure 7. As in BOC process, the thermal profiles are gradual from the bottom (colder areas) to the top (hotter areas). However, at the LiPB3–air interface, a different behavior was observed. In this case, the hottest area was located in the middle of the LiPB3 surface. The hottest spots with ΔT of 3.8 ± 0.1 °C and 3.5 ± 0.1 °C, were detected by FBGs (1.1) and (2,2) located near the positive tab collector and in the center of the active area, in the LiPB1–LiPB2 and LiPB3–air interfaces, respectively. This observation can be correlated with the higher activation and current density of the Li+ near both tabs, negative and positive, and the fact that the material of the positive tab (e.g., aluminum) is more conducive to heat generation than the negative tab material (e.g., nickel) due to the different electrical resistances of the two materials.
At the EOD, the coldest zones are well evidenced on the bottom of the cells, being more pronounced in the air–LiPB1interface. The hottest spots, with ΔT of 6.8 ± 0.1 °C were measured near the positive tab collector by the FBG located in (1.1), the LiPB1–LiPB2interface, as well as in areas (1.2), (2.1), (2.2), and (2.3) with ΔT of 6.4 ± 0.1 °C, all of them in the center of the active area of the cell, translating into the warmest interface in the LiPB pack. The FBGs inscribed in the fibers 3 and 4 also registered higher temperature changes near to both tab current collectors, i.e., in areas (1.1) and (1.3). Notice that in Figure 7, different scales were used for the EOD and BOD thermal maps, so, a thermal color comparison between the two cannot be performed in this case.

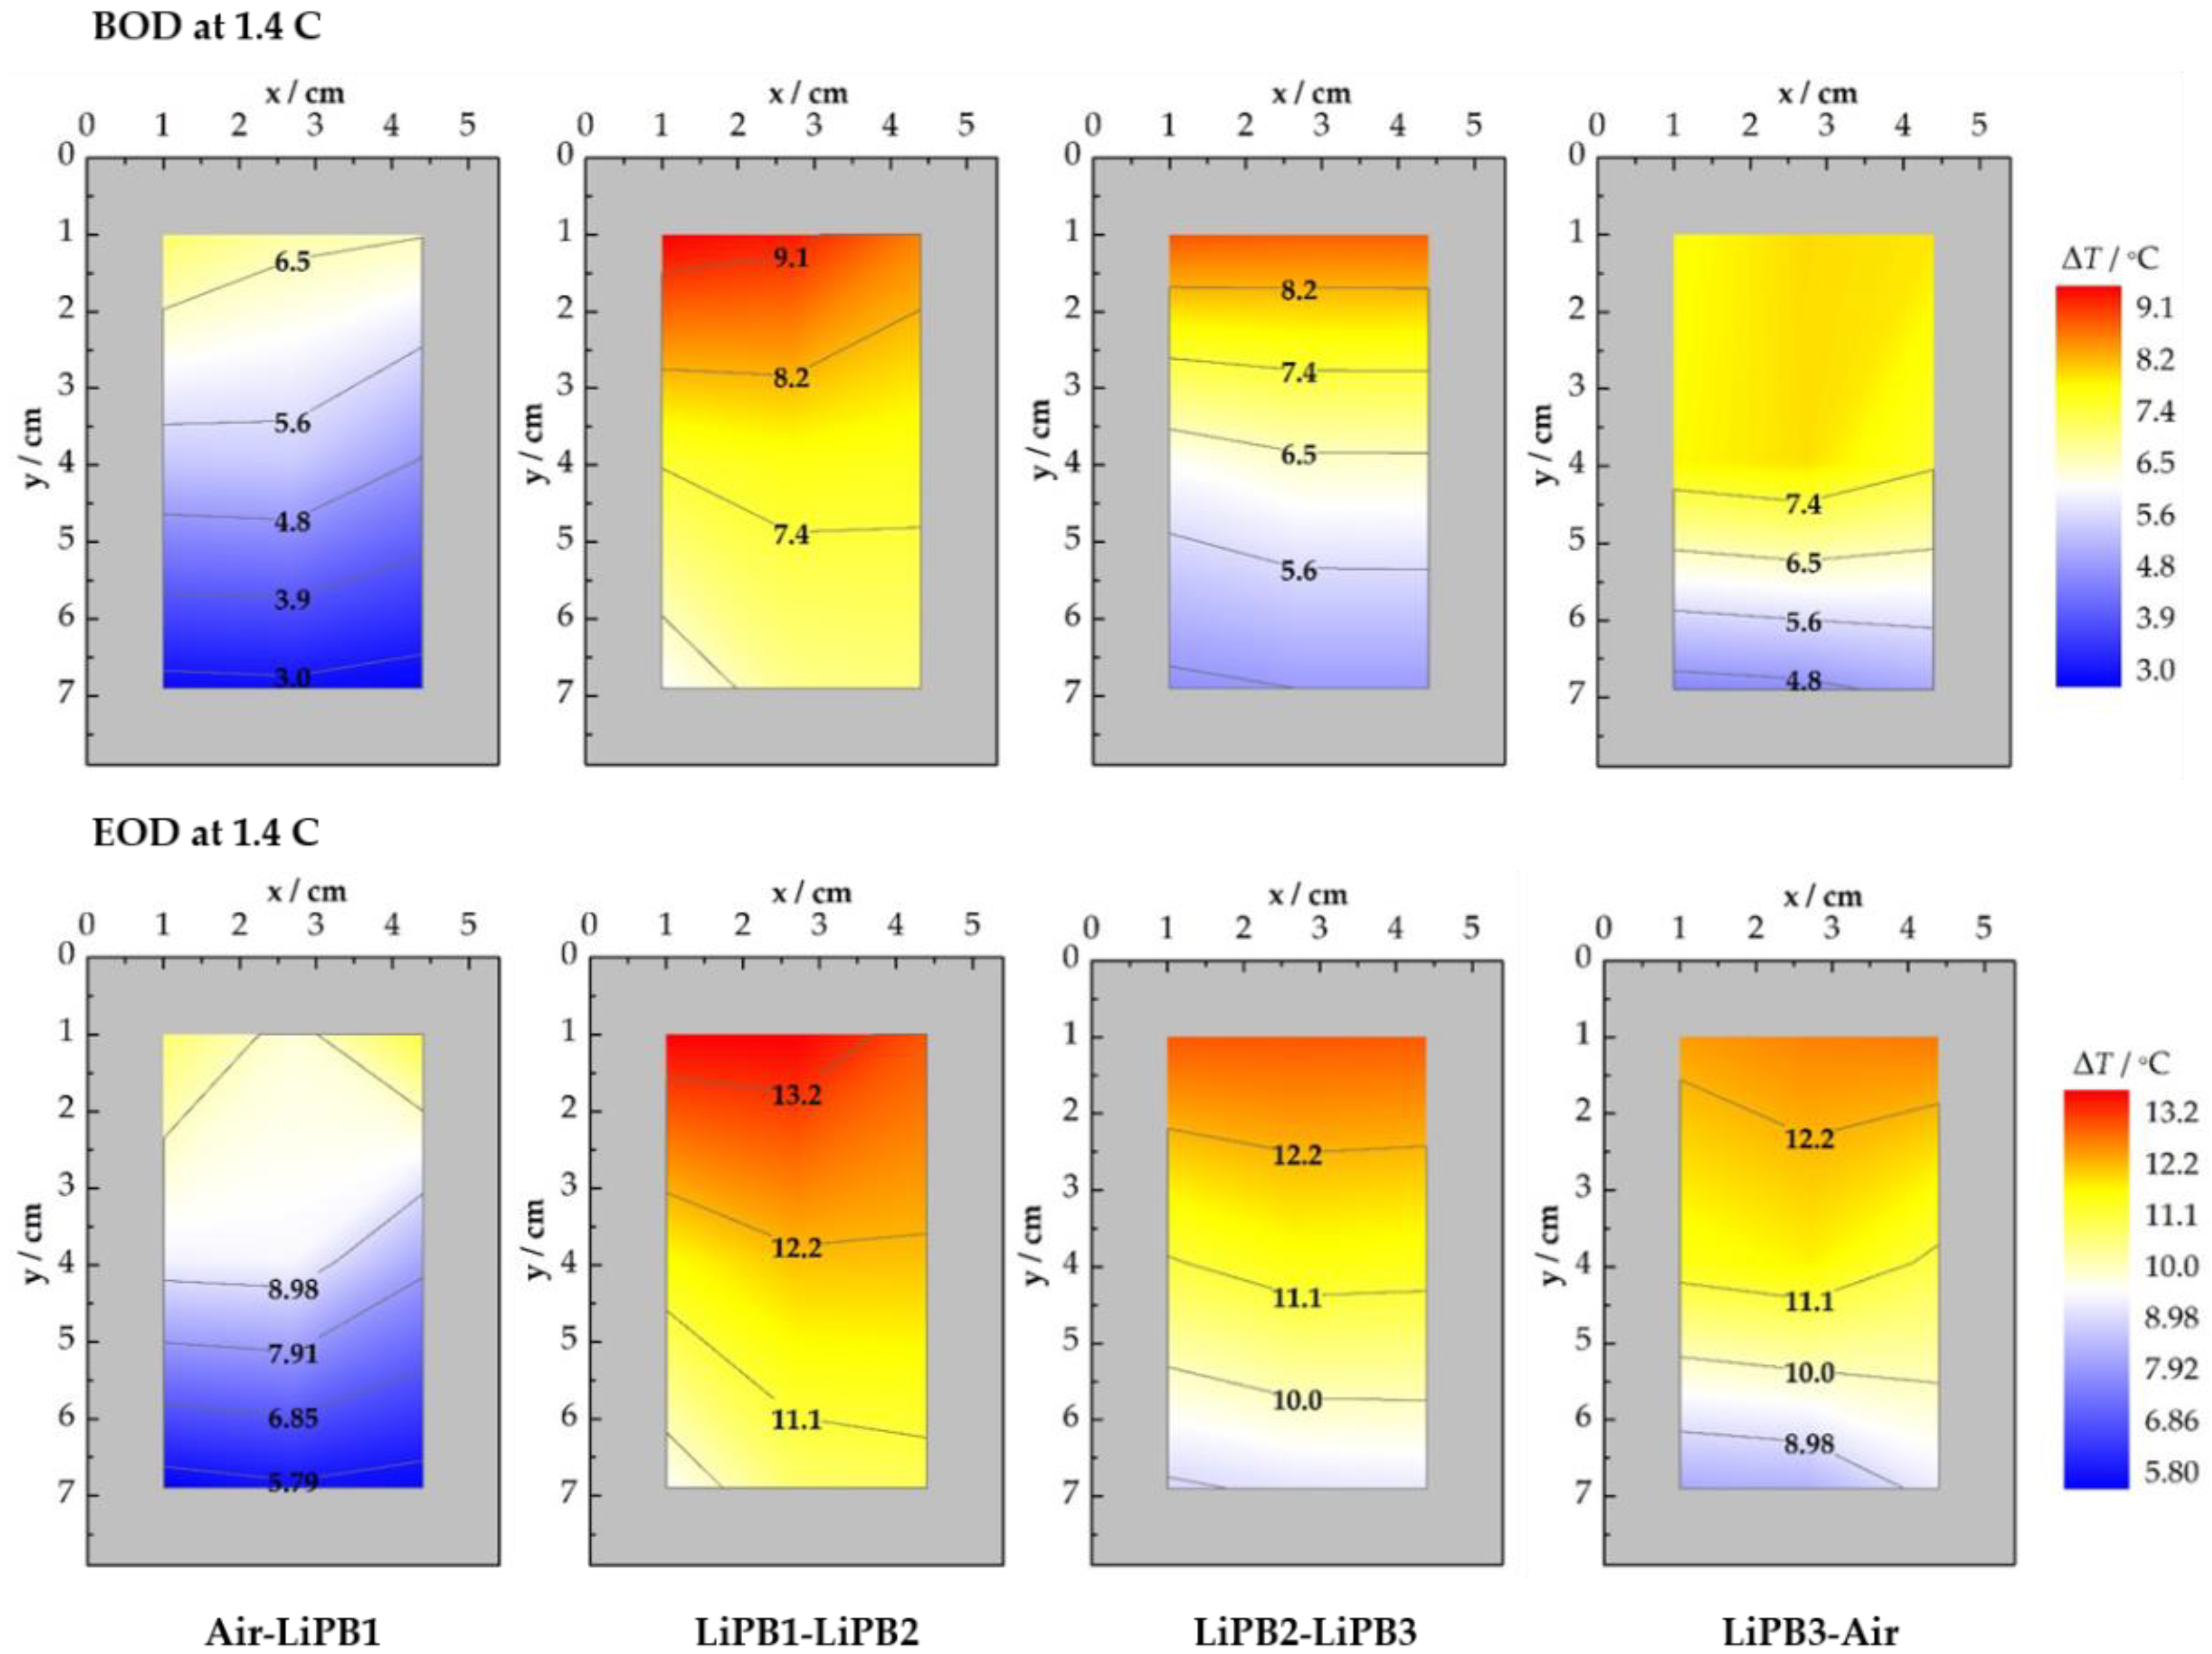
3.2.3. CC Discharge at 1.4 C

Figure 8 shows the temperature variation detected by all the FBGs at the BOD and EOD, at the higher discharge rate of 1.4 C in all the interfaces that compose the LiPBs pack. Due to the large temperature range on the BOD and EOD, the scales were also chosen independently to show the distribution with high resolution.
In general, and following the trend was noticed in Figure 7: The hottest zones were located at both collector tabs, at positions (1.1), (1.2), and (1.3), and the coldest zones were located at the bottom of the LiPBs at positions (3.1), (3.2), and (3.3). The temperature distribution gradient followed the line from the top to the bottom. These thermal profiles are in accordance with the literature, however, the battery dimensions reported are not the same and they were tested separately instead of in a pack of batteries [3,19,27].
On the BOD, the main hot spot with a ΔT of 9.4 ± 0.1 °C was detected by the FBG located at the LiPB2–LiPB2 interface at area (1.1). Of all the pack interfaces, the warmest was between the LiPB1 and LiPB2. The coldest interface was between the air and LiPB1, registering the lowest cold zone value of all battery packs of 2.8 ± 0.1 °C at the (3.1), (3.2) and (3.3) areas. The thermal profiles at the EOD follow the same behavior as at the BOD, however, the temperature variations were higher. The hottest spot, with ΔT of 14.0 ± 0.1 °C was clearly registered by the sensor written in the fiber 2 and located in position (1.1). The results indicate that this area is likely to be the hot spot zone in all the LiPB packs, being the most critical region in terms of safety. This occurred due to the higher current density of the Li+ in the positive tab collector. A plausible reason for the fact that this occurred in the interface between LiPB1 and LiB2 can be attributed to the higher performance registered by the LiPB2, as can be seen in Figure 3.
Comparing the temperature distribution in all the interfaces showed in Figure 8, it can be observed that the ΔT mean value between all interfaces is 4.0 ± 0.1 °C, revealing a low thermal discrepancy between them. However, the physical spacing between the thermal boundaries is different at all interfaces, highlighting their specific thermal profiles.

4. Conclusions

A sensing network of 37 FBGs was successfully used to monitor and to implement a temporal and spatial thermal mapping of four interfaces in a pack of 3 prismatic LiPBs. The batteries were connected in series and a cycling protocol was established with normal CC charge (1.0 C) and two different CC discharge steps (0.7 C and 1.4 C). The thermal profiles in the BOC, BOD, EOC, and EOD steps were analyzed. On the BOC, a maximum temperature variation of 3.7 ± 0.1 °C was measured near the positive tab in the LiPB1–LiPB2 interface. A heating zone of 3.3 ± 0.1 °C was also identified in the center of the surface between the LiPB3 and the air.
In general, over the discharge steps the hotter zones were located at both collector tabs, and the cold zones were at the bottom of the LiPBs. For the higher discharge rate, the thermal profiles at the EOD were very similar with the ones identified at the BOD. At the EOD, a hot spot with a ΔT value of 14.0 ± 0.1 °C was registered by the sensor located near the positive tab collector at the LiPB1–LiPB2 interface. This occurred due to the higher current density of the Li+ in that region. This sensing technique also allows more points to be monitored. For that, more FBG sensors with different Bragg wavelengths can be recorded in the same optical fiber or can be used different fiber sensing configurations without increasing the invasiveness of the battery pack interfaces.
The presented FBG sensing network has shown to be a good, precise, non-invasive and low-cost tool to improve the thermal management and safety of batteries, identifying critical zones for the appearance of hot spots.

Author Contributions

All authors contributed equally. M.N., T.P. and M.S.F. conceived the experiments and analyzed the data. All authors discussed the results, wrote and revised the paper.

Funding

This research was funded by Project POCI 01-0145-FEDER-016414, cofinanced by POCI and PORL through FEDER funds and by National Funds through FCT, grants numbers BI/UI96/6642/2018, PD/BD/128265/2016 (DAEPHYS) and SFRH/BPD/124549/2016 and by FEDER funds through the COMPETE 2020 Programme and National Funds through FCT under the project UID/CTM/50025/2013.

Conflicts of Interest

The authors declare no conflicts of interest.

References

  1. Zhang, Z.; Ramadass, P.; Fang, W. Safety of lithium-ion batteries. In Lithium-Ion Batteries: Advances and Applications; Pistoia, G., Ed.; Elsevier: Amsterdam, The Netherlands, 2014; Volume 18, pp. 409–435. ISBN 978-0-444-59513-3. [Google Scholar]
  2. Spotnitz, R.; Franklin, J. Abuse behavior of high-power, lithium-ion cells. J. Power Sources 2003, 113, 81–100. [Google Scholar] [CrossRef]
  3. Panchal, S.; Dincer, I.; Agelin-Chaab, M.; Fraser, R.; Fowler, M. Experimental temperature distributions in a prismatic lithium-ion battery at varying conditions. Int. Commun. Heat Mass Transf. 2016, 71, 35–43. [Google Scholar] [CrossRef]
  4. Xing, Y.; Miao, Q.; Tsui, K.-L.; Pecht, M. Prognostics and health monitoring for lithium-ion battery. In Proceedings of the IEEE International Conference on Intelligence and Security Informatics, Beijing, China, 10–12 July 2011. [Google Scholar] [CrossRef]
  5. Feng, X.; Fang, M.; He, X.; Ouyang, M.; Lu, L.; Wang, H.; Zhang, M. Thermal runaway features of large format prismatic lithium ion battery using extended volume accelerating rate calorimetry. J. Power Sources 2014, 255, 294–301. [Google Scholar] [CrossRef]
  6. Koch, S.; Birke, K.P.; Kuhn, R. Fast thermal runaway detection for lithium-ion cells in large scale traction batteries. Batteries 2018, 4, 16. [Google Scholar] [CrossRef]
  7. Lei, B.; Zhao, W.; Ziebert, C.; Uhlmann, N.; Rohde, M.; Seifert, H.J. Experimental analysis of thermal runaway in 18650 cylindrical Li-ion cells using an accelerating rate calorimeter. Batteries 2017, 3, 14. [Google Scholar] [CrossRef]
  8. Loveridge, M.J.; Remy, G.; Kourra, N.; Genieser, R.; Barai, A.; Lain, M.J.; Guo, Y.; Amor-Segan, M.; Williams, M.A.; Amietszajew, T.; et al. Looking deeper into the Galaxy (Note 7). Batteries 2018, 4, 3. [Google Scholar] [CrossRef]
  9. Bella, F.; Colò, F.; Nair, J.R.; Gerbaldi, C. Photopolymer electrolytes for sustainable upscalable, safe, and ambient-temperature sodium-ion secondary batteries. ChemSusChem 2015, 8, 3668–3676. [Google Scholar] [CrossRef]
  10. Radzir, N.N.H.; Hanifah, S.A.; Ahmad, A.; Hassan, N.H.; Bella, F. Effect of lithium bis(trifluoromethylsulfonyl)imide salt-doped UV-cured glycidyl methacrylate. Solid State Electrochem. 2015, 19, 3079–3085. [Google Scholar] [CrossRef]
  11. Suriyakumar, S.; Gopi, S.; Kathiresan, M.; Bose, S.; Gowd, E.B.; Nair, J.R.; Angulakshmi, N.; Meligrana, G.; Bella, F.; Gerbaldi, C.; et al. Metal organic framework laden poly(ethylene oxide) based composite electroytes for all-solid-state Li-S and Li-metal polymer batteries. Electrochem. Acta 2018, 285, 355–364. [Google Scholar] [CrossRef]
  12. Li, X.; Wang, Z.; Lin, H.; Min, Y.; Pan, F. Composite electrolytes of pyrrolidone-derivates-PEO enable to enhance performance of all solid-state lithium-ion batteries. Electrochem. Acta 2019, 293, 25–29. [Google Scholar] [CrossRef]
  13. Mankowski, P.J.; Kanevski, J.; Bakirtzian, P.; Cugno, S. Cellular phone collateral damage: A review of burns associated with lithium battery powered mobile devices. Burns 2016, 42, e61–e64. [Google Scholar] [CrossRef]
  14. Duh, Y.S.; Lin, K.H.; Kao, C.S. Experimental investigation and visualization on thermal runaway of hard prismatic lithium-ion batteries used in smart phones. J. Therm. Anal. Calorim. 2018, 132, 1677–1692. [Google Scholar] [CrossRef]
  15. Panchal, S.; Dincer, I.; Agelin-Chaab, M.; Fraser, R.; Fowler, M. Thermal modeling and validation of temperature distributions in a prismatic lithium-ion battery at different discharge rates and varying boundary conditions. Appl. Therm. Eng. 2015, 96, 190–199. [Google Scholar] [CrossRef]
  16. Panchal, S.; Dincer, I.; Agelin-Chaab, M.; Fraser, R.; Fowler, M. Experimental and theoretical investigation of temperature distributions in a prismatic lithium-ion battery. Int. J. Therm. Sci. 2015, 99, 204–2015. [Google Scholar] [CrossRef]
  17. Mutyala, M.S.K.; Zhao, J.; Li, J.; Pan, H.; Yuan, C.; Li, X. In situ temperature measurement in lithium-ion battery by flexible thin film thermocouples. J. Power Sources 2014, 260, 43–49. [Google Scholar] [CrossRef]
  18. Fu, Y.; Lu, S.; Li, K.; Liu, C.; Cheng, X.; Zhang, H. An experimental study on burning behaviors of 18650 lithium ion batteries using a cone calorimeter. J. Power Sources 2015, 273, 216–222. [Google Scholar] [CrossRef]
  19. Li, Z.; Zhang, J.; Wu, B.; Huang, J.; Nie, Z.; Sun, Y.; An, F.; Wu, N. Examining temporal and spatial variations of internal temperature in large-format laminated battery with embedded thermocouples. J. Power Sources 2013, 241, 536–553. [Google Scholar] [CrossRef]
  20. Ji, Y.; Wang, C.Y. Heating strategies for Li-ion batteries operated from subzero temperatures. Electrochem. Acta 2013, 107, 664–674. [Google Scholar] [CrossRef]
  21. Tippmann, S.; Wapler, D.; Balboa, L.; Spier, B.; Bessler, W.G. Low temperature charging of lithium-ion cells part I: Eletrochemical modeling and experimental investigation of degradation behavior. J. Power Sources 2014, 252, 305–316. [Google Scholar] [CrossRef]
  22. Yildiz, M.; Karakoc, H.; Dincer, I. Modelling and validation of temperature changes in pouch lithium-ion battery at various discharge rates. Int. Commun. Heat Mass Transf. 2016, 75, 311–314. [Google Scholar] [CrossRef]
  23. Panchal, S.; Dincer, I.; Agelin-Chaab, M.; Fraser, R.; Fowler, M. Uneven temperature and voltage distributions due to rapid discharge rates and different boundary conditions for series-connected LiFePO4 batteries. Int. Commun. Heat Mass Transf. 2017, 81, 210–217. [Google Scholar] [CrossRef]
  24. Mathew, M.; Mastali, M.; Catton, J.; Samadani, E.; Janhunen, S.; Fowler, M. Development of an electro-thermal model for electric vehicles using a design of experiments approach. Batteries 2018, 4, 29. [Google Scholar] [CrossRef]
  25. Lee, C.-Y.; Weng, F.-B.; Huang, Y.-P.; Chang, C.-P.; Cheng, C.-K. Real time monitoring of internal temperature and voltage of high-temperature fuel cell stack. Electrochim. Acta 2015, 161, 413–419. [Google Scholar] [CrossRef]
  26. Yi, J.; Kim, U.S.; Chee, S.; Han, T.; Park, S. Modelling the temperature dependence of the discharge behavior of a lithium-ion battery in low environmental temperature. J. Power Sources 2013, 244, 143–148. [Google Scholar] [CrossRef]
  27. Kim, U.S.; Yi, J.; Chee, S.; Han, T.; Park, S. Modelling the thermal bahaviour of a lithium-ion battery during charge. J. Power Sources 2011, 196, 5115–5121. [Google Scholar] [CrossRef]
  28. Wang, P.; Zhang, X.; Yang, L.; Zhang, X.; Yang, M.; Chen, H.; Fang, D. Real-time monitoring of internal temperature evolution of Li-ion coin cell battery during the charge and discharge process. Extreme Mech. Lett. 2016, 9, 459–466. [Google Scholar] [CrossRef]
  29. Lee, C.-Y.; Lee, S.-J.; Hung, Y.-M.; Hsieh, C.-T.; Chang, Y.-M.; Huang, Y.-T.; Lin, J.-T. Integrated microsensor for real-time microscopic monitoring of local temperature, voltage and current inside lithium ion battery. Sens. Actuators A Phys. 2017, 253, 59–68. [Google Scholar] [CrossRef]
  30. Grattan, K.T.V.; Meggitt, B.T. Optical Fiber Sensor Technology: Applications and Systems; Kluwer Academic Publishers: London, UK, 1999; Volume 3, pp. 357–363. ISBN 978-1-4757-6077-4. [Google Scholar]
  31. Othonos, A.; Kalli, K. Fiber Bragg Gratings: Fundamentals and Applications in Telecommunications and Sensing; Artech House: New York, NY, USA, 1999. [Google Scholar]
  32. Yang, G.; Leitão, C.; Lib, Y.; Pinto, J.L.; Jiang, X. Real-time temperature measurement with fiber Bragg sensors in lithium batteries for safety usage. Measurement 2013, 46, 3166–3172. [Google Scholar] [CrossRef]
  33. Sommer, L.W.; Kiesel, P.; Ganguli, A.; Lochbaum, A.; Saha, B.; Schwartz, J.; Bae, C.-J.; Alamgir, M. Fast and slow ion diffusion processes in lithium-ion pouch cells during cycling observed with fiber optic strain sensors. J. Power Sources 2015, 296, 46–52. [Google Scholar] [CrossRef]
  34. Novais, S.; Nascimento, M.; Grande, L.; Domingues, M.F.; Antunes, P.; Alberto, A.; Leitão, C.; Oliveira, R.; Koch, S.; Kim, G.T.; et al. Internal and external temperature monitoring of a Li-ion battery with fiber Bragg grating sensors. Sensors 2016, 16, 1394. [Google Scholar] [CrossRef]
  35. Nascimento, M.; Ferreira, M.; Pinto, J.L. Real time thermal monitoring of lithium batteries with fiber sensors and thermocouples: A comparative study. Measurement 2017, 111, 260–263. [Google Scholar] [CrossRef]
  36. Gao, H.; Li, H.; Liu, B.; Zhang, H.; Luo, J.; Cao, Y.; Yuan, S.; Zhang, W.; Kai, G.; Dong, X. A novel fiber Bragg grating sensor multiplexing technique. Opt. Commun. 2005, 251, 361–366. [Google Scholar] [CrossRef]
  37. Mihailov, S.J. Fiber Bragg Grating Sensors for Harsh Environments. Sensors 2012, 12, 1898–1918. [Google Scholar] [CrossRef] [Green Version]
  38. Gupta, S.; Mizunami, T.; Yamao, T.; Shimomura, T. Fiber Bragg grating cryogenic temperature sensors. Appl. Opt. 1996, 35, 5202–5205. [Google Scholar] [CrossRef]
Figure 1. Spectra of the 10 fiber Bragg grating (FBG) sensors network recorded in one fiber.
Batteries 04 00067 g001
Figure 2. (a) Experimental setup of the sensing network with the FBG sensor positions used to monitor the LiPBs pack. (b) Photograph of the LiPBs pack instrumented with the fiber sensing network.
Batteries 04 00067 g002
Figure 3. Voltage dependence with time for each LiPB, (a) at 0.7 C discharge rate and (b) at 1.4 C discharge rate. (1) Constant current (CC) charge at 1.0 C; (2) CC discharge at 0.7 C; (3) CC discharge at 1.4 C.
Batteries 04 00067 g003
Figure 4. (a) Temperature variations during two cycling tests in all the LiPB surface positions as a function of the pack voltage discharge rate at 0.7 C. (b) Enlarged image representing the temperature variations recorded by the 9 FBG sensors inscribed in fiber 2 during the CC discharge step at 0.7 C.
Batteries 04 00067 g004
Figure 5. (a) Temperature variations with time, during two cycling tests, in all the LiPB surface positions as a function of the pack voltage at 1.4 C discharge rate. (b) Enlarged image representing the temperature variations recorded by the 9 FBG sensors located at the LiPB1–LiPB2 interface during the higher discharge rate.
Batteries 04 00067 g005
Figure 6. Spatial and temporal thermal mapping of the LiPBs pack when the CC charge at 1.0 C begins and ends.
Batteries 04 00067 g006
Figure 7. Spatial and temporal thermal mapping of the LiPB pack at the BOD and EOD instances, for CC discharge at 0.7 C.
Batteries 04 00067 g007
Figure 8. Spatial and temporal thermal mapping of the LiPBs pack when the CC discharge at 1.4 C begins and ends.
Batteries 04 00067 g008
Table 1. Fiber sensors position on the lithium polymer battery (LiPB) with the corresponding Bragg wavelengths and sensitivities obtained through thermal calibration at 20.0 °C.
FBG PositionλB/nmKT ± 0.1/pm/°CFBG PositionλB/nmKT ± 0.1/pm/°C
Room1525.0510.0(2.2)1554.0610.2
(1.1)1530.9210.0(2.3)1556.2510.2
(1.2)1543.3910.1(3.1)1558.1710.3
(1.3)1546.9110.1(3.2)1559.5210.3
(2.1)1550.0510.2(3.3)1562.7110.3

